Research project
Inter-laboratory collaborative trial of real-time PCR method for the relative quantitation of horse DNA and pork DNA in raw and processed beef DNA: phase 1
This is the interim report for the completion of objective 1.2.
- This project (FS430818) was initiated by the Food Standards Agency, UK, with support from the Department for Environment, Food and Rural Affairs, UK. The overall project describes the full international interlaboratory collaborative trial to define the performance limits of the real-time PCR method for horse and pork DNA in raw and processed beef matrix covering the range of concentrations 0.1-10% (w/w of raw meat).
- The UK/EU Horse-meat issue of 2013, where a significant amount of horse DNA was found in a large number of beef meat products on sale at a supermarket store, prompted the development (Defra project FA0135) and interlaboratory validation (FSA project FS126001) of a real-time PCR approach for the quantitation of horse DNA in raw beef.
- The real-time PCR approach was extended to develop three new methods for the quantitation of horse and pork DNA in raw and processed beef background (Defra project FA0171). A limited UK based ring-trial provided evidence of the fitness for purpose of the three new methods, applicable for DNA extracted from meat derived from horse and pork samples and demonstrated acceptable precision around the 1% (w/w) level for enforcement action. The methods can reliably distinguish between adventitious contamination at 0.1%, enforcement level at 1% and economically motivated adulteration at 10%.
- This report describes the interim objective 1.2 of project FS430818, to internally validate the previously-developed real-time PCR method for the quantification of horse and pork in beef (raw and processed).
- Sample preparation comprised preparation of raw horse, pork and beef in clean laboratory facilities to avoid cross-contamination. Processing of the meat and meat combinations in the laboratory was done so that there was minimal DNA degradation by dehydration of the meat.
- Test samples comprised DNA extracts from three types of analyte/matrix combinations: horse in processed beef, pork in processed beef, pork in raw beef. Each sample type was prepared at five nominal concentration levels: 0.1%, 0.5%, 1%, 3%, 10% (w/w of raw meats initially combined).
- The CTAB extraction method obtained DNA of sufficient quality and quantity for analysis. Eight-fold standard curves with a starting concentration of at least 40 ng/µl on raw 100% horse and pork covered a dynamic range to quantify all % w/w combinations of raw and processed horse in beef and pork in beef mixtures using the horse and pork standard curves respectively.
- Reliable detection of 0.1% w/w contamination by horse or pork meat in a beef background in laboratory processed samples was successfully achieved.
- The internal method validation was used to verify all the samples prepared for the subsequent full collaborative trial and confirmed their fitness for purpose in terms of their homogeneity and expected concentration.
- The full collaborative trial was to be undertaken following completion of the internal validation and sample verification and is the subject of a separate report.
Following the UK/EU Horse-meat issue of 2013, where a significant amount of horse DNA was found in a large number of beef meat products on sale at a supermarket store, a real-time PCR approach for the quantitation of horse DNA in raw beef was developed at LGC through Defra funding (project FA0135, Real-time PCR approach for quantitation of horse DNA and study into relevance of expression units (DNA/DNA and w/w tissue)) [3]. This method was validated through an international collaborative trial (project FS126001 - International collaborative trial of a real-time PCR method for the relative quantitation of horse DNA) by LGC and funded by the FSA [4]. The success of this validation study has enabled the method to be formally subjected to European Standardisation at CEN where it is currently undergoing standardisation through CEN Technical Committee CEN TC460 on Food Authenticity.
A requirement to expand the real-time PCR approach to include pork meat in both raw and processed beef has resulted in the development of three SOP methods for the quantitation of horse and pork DNA in raw and processed beef background. The study was funded by Defra under its Food Authenticity Programme (project FA0171, Validation of Methods to Quantify Horse and Pork Meat Adulteration in Raw and Processed Beef) [5, 6]. The project looked at three new real-time-PCR methods for the relative quantitation of horse DNA in processed beef products, and the relative quantitation of pork DNA in raw and processed beef products. It included the development, the in-house validation and a limited UK based ring-trial (involving four UK laboratories). The study provided evidence of the fitness for purpose of the three new methods, as qualified by the limited (four laboratory) ring-trial. All three methods are applicable for DNA extracted from meat derived from horse and pork samples and demonstrate acceptable precision around the 1% (w/w) level for enforcement action. Furthermore, they can reliably distinguish between adventitious contamination at 0.1%, enforcement level at 1% and economically motivated adulteration at 10%.
Tenders were invited to plan a full-scale inter-laboratory collaborative trial on the methods that were developed under Defra project FA0171 [5] and additionally published [6] on the quantitation of horse DNA in processed beef and pork DNA in raw and processed beef. This report describes the initial method validation prior to its use in verifying the samples prepared for the full collaborative trial. The preparation of the samples and their verification of homogeneity are described. This interim report was presented in draft form to the FSA and Defra in March 2022, at the mid-point of sample preparation for the trial. Successful method validation and demonstration of the sample preparation up to that point was confirmation for the project to proceed to the full trial stage.
Raw material handling
Beef, pork and horse meats were purchased from local suppliers as whole joints. These were stored at -20 °C prior to preparation. Excess fat was trimmed from the joints before mincing (grinding) using an electric mincer. The beef was minced first to avoid any contamination from the pork and horse meat. For each meat species, the first ~200 g of minced meat was discarded so that any residue in the mincing equipment would be removed with that initial portion. The mincing equipment was cleaned before and after mincing each meat type using a combination of methods. After mechanical scrubbing of all parts of the mincer, the parts were soaked in a 10% bleach solution for 1 hour, sonicated in 10% bleach for 1 hour and then put through the dishwasher. Once out of the dishwasher all parts were sprayed with 1% Distel and wiped clean with paper towels. Swabs were taken from contact surfaces and analysed for the presence of each species DNA to ensure no cross-contamination occurred. The second ~200 g of minced meat for each species was retained as an environmental (negative) control for real-time PCR to ensure we had no contamination.
The meat mincing was located to a laboratory space that was several blocks removed from both the usual sample preparation facility at Fera and from the PCR laboratory. This was done to ensure the lowest possible risk of cross-contamination from the laboratory environment (where other meat sample handling is undertaken). An added benefit at the time of this project was to ensure sufficient physical working space when coronavirus social distance working mitigations were still in force at the Fera site.
Ingredients for the processed samples were tomato purée (Morrisons supermarket own-brand), cornflour (Sainsbury’s supermarket own-brand) and gravy mix (Bisto gravy powder from ASDA supermarket). The gravy powder ingredients are listed as: potato starch, salt, wheat starch, colour (ammonia caramel), onion powder, inactive yeast powder. The risk of an incurred cross-contamination with target meat DNA of these non-meat ingredients (including the gravy mix) was considered to be negligible. The same precautions were undertaken within the laboratory environment to minimise cross-contamination from the meat preparation.
DNA extraction and Authenticity
Following mincing, each meat species DNA was extracted from each species using the commercially available DNeasy® Mericon Food Kit (Qiagen) which is a cetyltrimethylammonium bromide (CTAB) method. Minced meat (2 g) was homogenised in 10 ml lysis buffer and proteinase K by mechanical disruption in a vortex. The homogenised mixture was then incubated at 60 °C, centrifuged and the cell lysis supernatant was phase-separated with chloroform. DNA was washed and precipitated in ethanol and eluted in 50 µl of elution buffer from the kit. The extraction method was also assessed in DNA fragmentation and a variety of modifications were trialled in the method. Modifications included differing lengths of incubation (30 or 60 minutes) and differing elution volumes (50 µl, 100 µl or 150 µl).
Because the input mass of each test portion of the meat was restricted for practical reasons (due to tube sizes) the eluates were individually measured on the spectrophotometer and the 260/280 nm and 260/230 nm ratios were noted. All individual extracts passed minimum performance criteria for quality and quantity and so were pooled after extractions to make one homogenous extract for each meat species.
Each meat species was also authenticated by Sanger sequencing using cytochrome B primers fwd: 5’-CCATCCAACATCTCAGCATGATGAA-3’ and rev: 5’-CCCCTCAGAATGATATTTGTCCTCA-3’. Standard curves for calibration were made from raw unprocessed 100% w/w horse and pork meat against the background myostatin mammalian gene target.
Table 1: combinations of target species DNA in matrix DNA with nominal w/w percentage of raw meats prior to extraction.
| Horse | Pork DNA in raw beef | Pork DNA in processed beef |
|---|---|---|
| Horse DNA in processed beef DNA (0.1%) | Pork DNA in raw beef DNA (0.1%) | Pork DNA in processed beef DNA (0.1%) |
| Horse DNA in processed beef DNA (0.5%) | Pork DNA in raw beef DNA (0.5%) | Pork DNA in processed beef DNA (0.5%) |
| Horse DNA in processed beef DNA (1%) | Pork DNA in raw beef DNA (1%) | Pork DNA in processed beef DNA (1%) |
| Horse DNA in processed beef DNA (3%) | Pork DNA in raw beef DNA (3%) | Pork DNA in processed beef DNA (3%) |
| Horse DNA in processed beef DNA (10%) | Pork DNA in raw beef DNA (10%) | Pork DNA in processed beef DNA (10%) |
The final meat combinations of nominal targets 10% and 3% w/w were prepared first. Homogeneity on the raw meat combinations was assessed on the DNA extracted from these w/w combinations and was quantified slightly higher than the intended target (see results). Lower final meat combinations of 1%, 0.5% and 0.1% w/w were made from the 3% w/w mixture, after checking yield, quality and homogeneity of the 3% w/w mixture. This was to ensure that no biases would be carried over from the 3% combination to the lower % w/w combinations. The higher w/w combinations were then processed, and homogeneity was re-assessed.
Processed sample preparation
Processed samples were prepared according to the following recipe taken directly from the Defra report [5]:
65% meat, 27% water, 1.25% tomato purée, 3% cornflour and 3% gravy mix
The 65% meat was the total meat content of the processed sample, itself comprising the corresponding percentage combinations of beef and horse or pork, defined in Table 1 above. The meat was added to the other ingredients at ambient temperature, stirred and gradually heated in a lidded vessel on a hot plate to a temperature of 72 °C for 15 minutes. The mixture was stirred occasionally during heating and then left to cool at ambient temperature prior to subsampling.
The lower % combinations for processed matrices were made from 3% raw meat and then cooked to give processed % w/w combinations at 1, 0.5 and 0.1%, i.e. 3% processed meat was not used to make lower % combinations.
Consumables procurement
Protein swabs and Real-time PCR Universal Mastermix (reagents Taq polymerase, dNTPs, buffer) were purchased from Fisher Scientific. DNeasy® Mericon Food Kits were purchased from Qiagen. Skirted tubes (0.5 ml), tube caps, centrifuge tubes (50 ml and 1.5 ml) were purchased from Starlab. Labels for sample tubes were purchased from Barcode Warehouse (to be compatible with the LIMS). Myostatin horse and pig assays were purchased from Eurofins.
Sufficient PCR consumables were purchased for both the internal validation of the methods and for the collaborative trial itself (where this means all sample preparation and verification/homogeneity testing plus consumables for the participants). Consumables to be distributed to the participants in the interlaboratory trial were aliquoted out in preparation for eventual dispatch.
PCR equipment
All assays and standard curves were validated on QuantStudio 6 Flex Real-time PCR systems (Applied Biosystems).
DNA extraction
Figure 1: Extracted Beef DNA assessed for fragmentation on an agarose gel.
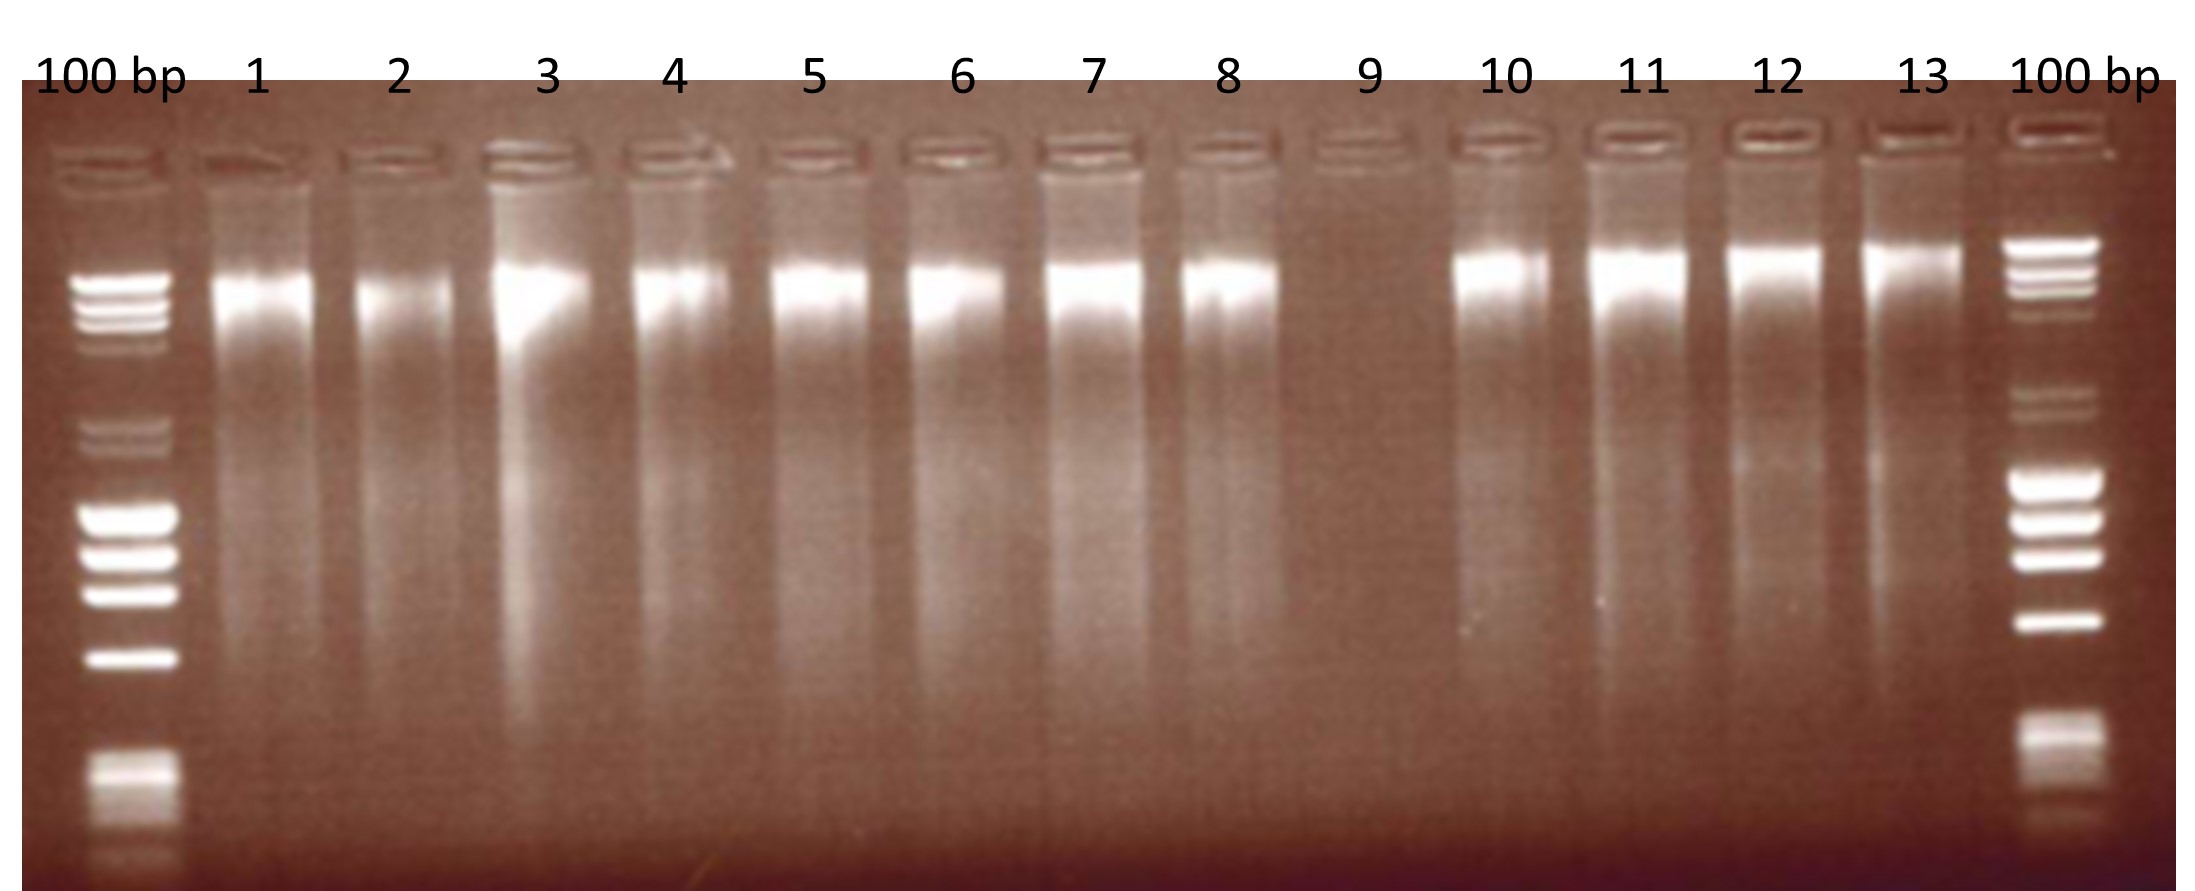
100 bp: DNA ladders, Lane 1: 30 min incubation, 100 µl elution; Lane 2: 30 min, 150 µl elution; Land 3: 30 min, 50 + 50 µl elution; Lane 4: 30 min, 100 + 50 µl elution; Lane 5: 60 min, 100 µl elution; Lane 6: 60 min, 150 µl elution; Lane 7: 60 min, 50 + 50 µl elution; Lane 8: 60 min, 100 + 50 µl elution; Lane 9: Blank; Lane 10 – 11: Environmental negative controls; Lane 12-13: first mince.
As the precise method of extraction was not defined in the supporting report [5] we based our extraction method on the same buffer-based methodology. DNA was extracted from each species using the commercially available DNeasy® Mericon Food Kit (Qiagen) which is a cetyltrimethylammonium bromide (CTAB) method. The quality and quantity of the DNA was measured on the NanoDropTM (Thermo Scientific) and by gel electrophoresis to check for DNA fragmentation. Both the horse and pork yielded 152.3 ± 3.0 ng/µl and 250.8 ± 2.0 ng/µl respectively. The background matrix of beef yielded 226.6 ± 1.6 ng/µl.
Appendix 1 Table A1 shows the NanoDropTM data from the individual extracts prior to pooling.
Variations on the extraction method were also assessed for suitability, i.e. quality of the extracted DNA was assessed for fragmentation by running 5 µl of beef DNA on an agarose gel (Figure 1). Minced meat (2 g) was homogenised in 10 ml lysis buffer and proteinase K by mechanical disruption in a vortex. The homogenised mixture was then incubated at 60 °C, centrifuged and the cell lysis supernatant was phase-separated with chloroform. DNA was washed and precipitated in ethanol and eluted in 50 µl of elution buffer from the kit. The extraction method was also assessed in DNA fragmentation and a variety of modifications were trialled in the method. Modifications included differing lengths of incubation (30 or 60 minutes) and differing elution volumes (50 µl, 100 µl or 150 µl).
Because the input mass of each test portion of the meat was restricted for practical reasons (due to tube sizes) the eluates were individually measured on the spectrophotometer and the 260/280 nm and 260/230 nm ratios were noted. All individual extracts passed minimum performance criteria for quality and quantity and so were pooled after extractions to make one homogenous extract for each meat species.
Authentication
Each meat species was authenticated by Sanger sequencing using cytochrome B primers fwd: 5’-CCATCCAACATCTCAGCATGATGAA-3’ and rev: 5’-CCCCTCAGAATGATATTTGTCCTCA-3’; against reference genomes for beef (D34635), horse (D82932) and pork (NC_000845). All alignment figures can be found in Appendix II, Figures A1-A3.
Inhibition
The pooled horse and pork DNA were examined for inhibitors that may affect PCR amplification. The myostatin assay was used to determine if there was inhibition, at a working dilution of 1:10 (from primary 100% extracts), and then three subsequent 1:4 dilutions for a four-point inhibition curve. There was no inhibition in any of the horse or pork DNA extracts (Figure 2), with the working concentration extrapolated values within 0.5 Cq of the measured values.
Figure 2: Inhibition curves for horse (empty circle) and pork (empty square).

The slopes and R2 for both matrices are within performance criteria. The measured Cq values for the horse assay (filled circle) and pork (filled square) are within limits as the extrapolated Cq value, indicating no inhibitory compounds influencing the PCR reaction.
Standard curves
The standard curves were produced from 100% raw horse and 100% pork species DNA, initially with a starting dilution of 22.5 ng/µl which we have estimated to be approximately 4096 copies for both species based on their equivalent genome sizes (2.47Mb horse and 2.45Mb pig). 4-fold and 8-fold curves showed similar results with all assays passing minimum performance criteria as set by the previous project [5, 6] and supporting standards [7, 8] (Figures 3 and 4).
Figure 3: Pork 4-fold and 8-fold standard curves for the pork specific assay (filled squares) and the mammalian myostatin assay (empty squares).

Data shown are Mean Cq ± Standard deviation (mean CT on axis label). S1 for both 4-fold and 8-fold standards are 22.5ng/µl.
Figure 4: Horse 4-fold and 8-fold standard curves for the horse specific assay (filled circles) and the mammalian myostatin assay (empty circles).

Data shown are Mean Cq ± Standard deviation (mean CT on axis label). S1 for both 4-fold and 8-fold standards are 22.5ng/µl.
10% and 3% initial raw samples indicative homogeneity
Once the 10% and 3% mixtures of raw horse in raw beef and raw pork in raw beef were made, they were quantified against the horse or pork standard curves respectively. 10% and 3% horse in beef samples measured (equine:myostatin) 12.88% ± 0.73 and 3.73% ± 0.46 respectively. 10% and 3% pork in beef samples measured (porcine:myostatin) 15.85% ± 0.76 and 5.26% ± 0.48.
Interpretation of the indicative homogeneity is that the relative variance in the samples ranges between 4.8% RSD and 12.3% RSD. Given that the target reproducibility precision of the interlaboratory trial shall be 25%, the variance in the indicative homogeneity is unlikely to significantly affect the outcome of the trial.
At this point of the sample verification, the decision was made to proceed with the remaining sample preparation and verification.
10% and 3% processed samples indicative homogeneity
The 10% and 3% pork in beef mixtures were processed by cooking. The recipe (ingredients) for the processed meat samples followed that of the previous project [4, 5], however, this lacked detail on the method of cooking. A trial was undertaken of cooking of the 10% and 3% pork mixtures on a hot plate. DNA was then extracted from the processed samples and these were quantified against the pork 8-fold standard curve (Figure 5). The results of the 10% and 3% processed samples were very close to the first dilution point on the mammalian standard curve. This was potentially due to the additional processing involved in the preparation of the mixtures and intensity of the heat was able to rupture additional muscle cells and release a higher concentration of myostatin in processed samples.
All further cooking of the samples was decided to be carried out in a Bain Marie to reduce the intensity of the heat during the cooking process and prevent as much DNA degradation as possible. Subsequently, the 10% and 3% horse mixtures were cooked, and DNA was extracted. The 10% and 3% horse raw and processed samples were then quantified against a horse 8-fold standard curve (Figure 6). Again, both the 10% and 3% processed horse samples were beyond the dynamic range of the myostatin standard curve. Further processing of the lower % w/w mixtures could fall off the standard curve, so we decided to increase the starting concentration (from 22.5 ng/µl to 40 ng/µl) to ensure the 8-fold standard curve was suitable for all further assessments (Figure 7). This brings the estimated genome copy number to approximately 31508 copies for both species based on their equivalent genome sizes (2.47Mb horse and 2.45Mb pig).
Figure 5: Quantification of 10% and 3% pork mixtures against the pork specific assay (top plot) or the mammalian myostatin assay (bottom plot).

8-fold curves with S1 at 22.5 ng/µl.
Figure 6: Quantification of 10% and 3% horse mixtures against the horse specific assay (top plot) or the mammalian myostatin assay (bottom plot).

8-fold curves with S1 at 22.5 ng/µl.
Figure 7: Pork (top plot) and horse (bottom plot) 8-fold standard curves.

Data shown are Mean CT ± Standard deviation. S1 for both pork and horse 8-fold standards are 40ng/µl.
Lower % w/w indicative homogeneity
The 1%, 0.5% and 0.1% raw mixtures of horse and pork meats were produced as previously described. We ensured all % combinations were within the dynamic range of the standard curve for each of pork (Figure 8) and horse (Figure 9).
Figure 8: Quantification of all % combinations of raw (left panels) and processed (right panels) pork samples against the 8-fold 40 ng/µl standard curve.

Figure 9: Quantification of all % combinations of raw (left panels) and processed (right panels) horse samples against the 8-fold 40ng/µl standard curve.

PCR assay volumes and cycling conditions
The LGC protocols (associated to [5]) used a variety of different concentrations for each assay and the rationale for this was not clear. Validation of the pork, horse and mammalian assays used the same compositions across all for ease of use Table 2. PCR thermal cycling conditions for all assays can be found in Table 3.
Table 2: Real-time PCR reaction composition for each assay (pork, horse and mammalian) for a total reaction volume of 25 µl. MGW: molecular grade water.
| PCR reagent | 1X per assay |
|---|---|
| 2x Universal Master mix | 12.5 |
| Forward primer (20µM) | 0.375 |
| Reverse primer (20µM) | 0.375 |
| Probe (5 µM) | 1 |
| MGW | 5.75 |
| Template DNA (Standards and test samples) | 5 |
Table 3: PCR thermal cycling conditions used for all assays.
| Temperature (c) | Time (s) | Repeat cycles |
|---|---|---|
| 50 | 120 | 1 |
| 95 | 600 | 1 |
| 95 | 15 | 45 |
| 60 | 60 | 45 |
On completion of each sample type preparation and its verification against the standard curves as described above, homogeneity was assessed for each sample type by analysis of ten randomly-selected units under repeatability conditions.
The data are provided in Table 4.
The mean and standard deviation were calculated for each sample type and no Grubbs’ outliers were detected, so all data were included. At the higher preparation levels of 10% w/w and 3% w/w, the RSD values ranged 5.06 – 11.0% RSD. At the mid-level preparation of 1% w/w, the RSD values ranged 6.39 – 14.5%. At the lower preparation levels of 0.5% w/w and 0.1% w/w, the RSD values ranged 13.6 – 43.7%. The processed pork generally had the lower RSD values, and the raw pork samples generally had the higher RSD values.
As the preparation level reduces in concentration of target species, the RSD increases. This finding is in keeping with the general trend in analytical (bio)chemistry of increasing variance at lower concentrations. The higher preparation levels were used to establish fitness for purpose prior to the lower preparation levels being sequentially diluted from them. Hence, there is a high degree of confidence that the lower preparation levels derive from a well-prepared stock sample.
The repeatability and reproducibility RSD values from the collaborative trial itself are included on Table 4. In all cases, the homogeneity RSD values are in keeping with the trial RSD values. The main exception is the raw pork sample at 0.1% w/w in which the homogeneity RSD (43.7%) exceeds the reproducibility RSD of 35.8%. Since the trial reproducibility RSD is consistently about 35% across all three sample types at the 0.1% w/w level, the high homogeneity RSD remains unexplained and may be an artefact of challenging repeatability rather than it having an effect on the trial.
The overall homogeneity data, including the verification against standard curves, provides sufficient confidence in the preparation of the samples as being fit for the purpose of the collaborative trial.
Processed horse
| Sample number | 10% w/w | 3% w/w | 1% w/w | 0.5% w/w | 0.1% w/w |
|---|---|---|---|---|---|
| Sample 1 | 14.1 | 3.29 | ND | 0.652 | 0.135 |
| Sample 2 | 14.4 | 2.97 | 1.56 | 0.846 | 0.207 |
| Sample 3 | 13.4 | 3.25 | 1.74 | 0.842 | 0.182 |
| Sample 4 | 12.7 | 3.56 | 1.66 | 0.726 | 0.209 |
| Sample 5 | 14.0 | 3.77 | 1.80 | 0.925 | 0.185 |
| Sample 6 | 13.5 | 3.05 | 1.53 | 0.468 | 0.159 |
| Sample 7 | 14.6 | 2.69 | 1.47 | 0.633 | 0.115 |
| Sample 8 | 12.1 | 3.06 | 1.65 | 0.915 | 0.172 |
| Sample 9 | 12.5 | 2.92 | 1.63 | 0.698 | 0.092 |
| Sample 10 | 13.7 | 3.10 | 1.55 | 0.872 | 0.129 |
| Data | 10% w/w | 3% w/w | 1% w/w | 0.5% w/w | 0.1% w/w |
|---|---|---|---|---|---|
| Mean, % w/w | 13.5 | 3.17 | 1.62 | 0.758 | 0.158 |
| SD, % w/w | 0.836 | 0.316 | 0.104 | 0.148 | 0.0395 |
| RSD, % | 6.19 | 9.98 | 6.39 | 19.5 | 25.0 |
| CT RSDr, % | 10.1 | 5.77 | 6.90 | 10.4 | 19.9 |
| CT RSDR, % | 12.5 | 11.02 | 21.2 | 21.4 | 34.9 |
Processed pork
| Sample number | 10% w/w | 3% w/w | 1% w/w | 0.5% w/w | 0.1% w/w |
|---|---|---|---|---|---|
| Sample 1 | 5.67 | 1.84 | 1.13 | 0.622 | 0.144 |
| Sample 2 | 5.78 | 1.82 | 1.06 | 0.481 | 0.130 |
| Sample 3 | 5.93 | 1.96 | 1.02 | 0.533 | 0.152 |
| Sample 4 | 5.19 | 1.82 | 1.39 | 0.556 | 0.127 |
| Sample 5 | 5.47 | 1.93 | 0.965 | 0.600 | 0.0826 |
| Sample 6 | 6.06 | 2.12 | 1.49 | 0.701 | 0.133 |
| Sample 7 | 5.50 | 2.08 | 1.42 | 0.531 | 0.153 |
| Sample 8 | 6.01 | 1.85 | 1.22 | 0.449 | 0.128 |
| Sample 9 | 5.83 | 2.03 | 1.29 | 0.659 | 0.144 |
| Sample 10 | 6.06 | 1.96 | 1.24 | 0.598 | 0.185 |
| Data | 10% w/w | 3% w/w | 1% w/w | 0.5% w/w | 0.1% w/w |
|---|---|---|---|---|---|
| Mean, % w/w | 5.75 | 1.94 | 1.22 | 0.573 | 0.138 |
| SD, % w/w | 0.291 | 0.111 | 0.179 | 0.0782 | 0.0260 |
| RSD, % | 5.06 | 5.71 | 14.6 | 13.6 | 18.8 |
| CT RSDr, % | 10.8 | 6.96 | 16.3 | 11.9 | 16.2 |
| CT RSDR, % | 17.3 | 17.5 | 28.4 | 19.9 | 32.6 |
Table 4: homogeneity data (% w/w) for 10 units for each sample type. SD is observed standard deviation of the 10 units, RSD is relative standard deviation (observed of the 10 units). CT RSDr is the collaborative trial repeatability RSD, CT RSDR is the collaborative trial reproducibility RSD.
Raw Pork
| Sample number | 10% w/w | 3% w/w | 1% w/w | 0.5% w/w | 0.1% w/w |
|---|---|---|---|---|---|
| Sample 1 | 9.59 | 3.29 | 1.20 | 0.610 | 0.109 |
| Sample 2 | 10.5 | 3.31 | 1.05 | 0.457 | 0.141 |
| Sample 3 | 9.86 | 3.38 | 1.08 | 0.471 | 0.158 |
| Sample 4 | 7.62 | 2.92 | 1.07 | 0.652 | 0.100 |
| Sample 5 | 8.17 | 2.96 | 1.08 | 0.601 | 0.103 |
| Sample 6 | 7.89 | 2.73 | 1.22 | 0.497 | 0.0703 |
| Sample 7 | 7.92 | 2.97 | 1.22 | 0.418 | 0.107 |
| Sample 8 | 9.72 | 2.78 | 0.875 | 0.513 | 0.0701 |
| Sample 9 | 9.00 | 2.51 | 1.31 | 0.485 | 0.0387 |
| Sample 10 | 8.72 | 3.26 | 0.962 | 0.646 | 0.0316 |
| Data | 10% w/w | 3% w/w | 1% w/w | 0.5% w/w | 0.1% w/w |
|---|---|---|---|---|---|
| Mean, % w/w | 8.89 | 3.01 | 1.11 | 0.535 | 0.0928 |
| SD, % w/w | 0.981 | 0.292 | 0.131 | 0.0846 | 0.0406 |
| RSD, % | 11.0 | 9.69 | 11.8 | 15.8 | 43.7 |
| CT RSDr, % | 8.76 | 8.60 | 19.2 | 21.0 | 24.0 |
| CT RSDR, % | 9.27 | 17.4 | 22.7 | 25.4 | 35.8 |
Table 4 (continued): homogeneity data (% w/w) for 10 units for each sample type. SD is observed standard deviation of the 10 units, RSD is relative standard deviation (observed of the 10 units). CT RSDr is the collaborative trial repeatability RSD, CT RSDR is the collaborative trial reproducibility RSD.
Conclusions
We have internally verified the published method [5, 6] for horse and pork quantification using real-time PCR in the Fera laboratory. We have demonstrated that the CTAB method chosen is suitable to obtain DNA of sufficient quality and quantity. Eight-fold standard curves with a starting concentration of at least 40 ng/µl on raw 100% horse and pork cover a dynamic range of five points, and we were able to quantify all % w/w combinations of raw and processed horse in beef and pork in beef mixtures using the horse and pork standard curves respectively.
Processing of the meat and meat combinations in the laboratory was done so that there was minimal DNA degradation by dehydration of the meat. This may differ to real world samples where meat has been cooked outside of the laboratory by a variety of methods that could accelerate DNA degradation. However, for the purpose of the collaborative trial, we have shown reliable detection of 0.1% w/w contamination by horse or pork meat in a beef background in laboratory processed samples.
The internal method validation in turn has allowed the verification of all the samples prepared for the full collaborative trial and confirmed their fitness for purpose in terms of their homogeneity and expected concentration. The outcome of the collaborative trial, as far as can be prepared for, is now dependent on the analysis by the participant laboratories in the trial.
References
- Fera science Ltd, Standards & Accreditations, accessed 21/03/2022.
- Lloyd’s Register, Learn about ISO 9001 Quality Management Systems (QMS), accessed 21/03/2022.
- Defra Report FA0135 (2013). Real-time PCR approach for quantitation of horse DNA and study into relevance of expression units (DNA/DNA and w/w tissue)
- FSA Report FS126001 (2016). International collaborative trial of a real-time PCR method for the relative quantitation of horse DNA
- Defra report FA0171 (2018). Validation of Methods to Quantify Horse and Pork Meat Adulteration in Raw and Processed Beef
- Malcolm Burns, Gavin Nixon, Simon Cowen, Timothy Wilkes. International collaborative trial of a real-time PCR approach for the relative quantitation of horse DNA. Food and Nutrition Open Access, 2018, DOI: 10.31021/fnoa.20181113
- CEN/TS 17329-1. Foodstuffs – General guidelines for the validation of qualitative real-time PCR methods – Part 1: Single-laboratory validation. (Final draft at January 2021.)
- ISO/DIS 20813:2018. Molecular biomarker analysis – Methods of analysis for the detection and identification of animal species in foods and food products (nucleic acid-based methods) – General requirements and definitions
Appendix 1 Table A1
Spectrophotometer (NanoDropTM 1000) data for beef, horse and pork in raw and processed formats across the various % w/w combinations. The horse and pork % w/w/ combinations were in a matrix of beef. The data relate to individual extracts prior to pooling, absorbance at 260 and 280 nm.
| Sample matrix | A260 | A280 | A260/A280 | A260/A230 | ng/µL |
|---|---|---|---|---|---|
| 100% raw Beef extract 1 | 3.23 | 1.60 | 2.02 | 1.98 | 161.33 |
| 100% raw Beef extract 2 | 3.15 | 1.54 | 2.04 | 2.06 | 157.32 |
| 100% raw Beef extract 3 | 2.87 | 1.42 | 2.03 | 1.97 | 143.70 |
| 100% raw Horse extract 1 | 2.21 | 1.12 | 1.98 | 1.99 | 110.69 |
| 100% raw Horse extract 2 | 2.75 | 1.39 | 1.97 | 2.06 | 137.32 |
| 100% raw Horse extract 3 | 2.24 | 1.13 | 1.98 | 1.77 | 112.02 |
| 100% raw Pork extract 1 | 4.8 | 2.39 | 2.01 | 2.03 | 240.08 |
| 100% raw Pork extract 2 | 4.6 | 2.28 | 2.02 | 2.13 | 230.25 |
| 100% raw Pork extract 3 | 4.31 | 2.16 | 2.00 | 2.00 | 215.73 |
| 10% raw Pork extract 1 | 3.68 | 1.88 | 1.96 | 2.24 | 183.89 |
| 10% raw Pork extract 2 | 3.44 | 1.74 | 1.98 | 2.24 | 172.04 |
| 10% raw Pork extract 3 | 3.12 | 1.58 | 1.98 | 2.22 | 156.01 |
| 3% raw Pork extract 1 | 3.41 | 1.74 | 1.96 | 2.17 | 170.25 |
| 3% raw Pork extract 2 | 4.35 | 2.21 | 1.97 | 2.19 | 217.42 |
| 3% raw Pork extract 3 | 3.37 | 1.71 | 1.97 | 2.19 | 168.72 |
| 1% raw Pork extract 1 | 2.51 | 1.27 | 1.97 | 2.13 | 125.53 |
| 1% raw Pork extract 2 | 1.93 | 0.97 | 2 | 2.03 | 96.68 |
| 1% raw Pork extract 3 | 2.04 | 1.02 | 2.01 | 2.18 | 102.10 |
| 0.5% raw Pork extract 1 | 4.59 | 2.37 | 1.93 | 1.87 | 229.28 |
| 0.5% raw Pork extract 2 | 4.4 | 2.24 | 1.97 | 2.19 | 220.11 |
| 0.5% raw Pork extract 3 | 3.29 | 1.68 | 1.95 | 2.12 | 164.40 |
| 0.1% raw Pork extract 1 | 3.15 | 1.63 | 1.93 | 1.83 | 157.40 |
| 0.1% raw Pork extract 2 | 2.82 | 1.43 | 1.97 | 2.13 | 140.83 |
| 0.1% raw Pork extract 3 | 2.63 | 1.34 | 1.96 | 2.05 | 131.30 |
| 10% processed Pork extract 1 | 1.25 | 0.71 | 1.76 | 0.96 | 62.40 |
| 10% processed Pork extract 2 | 0.81 | 0.39 | 2.05 | 1.96 | 40.45 |
| 10% processed Pork extract 3 | 0.76 | 0.38 | 2.01 | 1.9 | 38.15 |
| 3% processed Pork extract 1 | 0.87 | 0.46 | 1.91 | 1.48 | 43.67 |
| 3% processed Pork extract 2 | 0.91 | 0.47 | 1.92 | 1.65 | 45.37 |
| 3% processed Pork extract 3 | 0.86 | 0.44 | 1.97 | 1.88 | 43.19 |
| 1% processed Pork extract 1 | 0.93 | 0.48 | 1.94 | 2.36 | 46.32 |
| 1% processed Pork extract 2 | 0.9 | 0.47 | 1.91 | 2.09 | 45.24 |
| 1% processed Pork extract 3 | 0.84 | 0.44 | 1.9 | 2.32 | 42.21 |
| 0.5% processed Pork extract 1 | 1.29 | 0.68 | 1.91 | 2.22 | 64.73 |
| 0.5% processed Pork extract 2 | 1.23 | 0.65 | 1.91 | 2.04 | 61.73 |
| 0.5% processed Pork extract 3 | 0.94 | 0.49 | 1.92 | 1.95 | 47.14 |
| 0.1% processed Pork extract 1 | 1.33 | 0.72 | 1.83 | 1.51 | 66.25 |
| 0.1% processed Pork extract 2 | 1.1 | 0.59 | 1.86 | 1.71 | 54.93 |
| 0.1% processed Pork extract 3 | 1.32 | 0.7 | 1.9 | 2.1 | 66.23 |
| 10% raw Horse extract 1 | 4 | 2.07 | 1.93 | 2.14 | 199.83 |
| 10% raw Horse extract 2 | 3.7 | 1.91 | 1.93 | 2.15 | 185.10 |
| 10% raw Horse extract 3 | 3.97 | 2.04 | 1.95 | 2.16 | 198.31 |
| 3% raw Horse extract 1 | 3.92 | 2.03 | 1.93 | 2.16 | 195.80 |
| 3% raw Horse extract 2 | 2.95 | 1.52 | 1.93 | 2.1 | 147.43 |
| 3% raw Horse extract 3 | 4.16 | 2.14 | 1.94 | 2.18 | 208.20 |
| 1% raw Horse extract 1 | 3.12 | 1.61 | 1.94 | 1.93 | 156.18 |
| 1% raw Horse extract 2 | 3.56 | 1.81 | 1.97 | 2.2 | 178.06 |
| 1% raw Horse extract 3 | 3.16 | 1.64 | 1.93 | 1.81 | 158.20 |
| 0.5% raw Horse extract 1 | 3.97 | 2.04 | 1.95 | 2.06 | 198.32 |
| 0.5% raw Horse extract 2 | 3.34 | 1.71 | 1.95 | 2.11 | 166.86 |
| 0.5% raw Horse extract 3 | 3.36 | 1.72 | 1.96 | 2.23 | 167.92 |
| 0.1% raw Horse extract 1 | 4.56 | 2.34 | 1.95 | 2.19 | 227.99 |
| 0.1% raw Horse extract 2 | 3.3 | 1.7 | 1.95 | 2.21 | 165.07 |
| 0.1% raw Horse extract 3 | 4.49 | 2.32 | 1.94 | 2 | 224.74 |
| 10% processed horse extract 1 | 1.19 | 0.62 | 1.93 | 1.81 | 59.40 |
| 10% processed horse extract 2 | 1.27 | 0.66 | 1.93 | 1.88 | 63.37 |
| 10% processed horse extract 3 | 1.35 | 0.71 | 1.91 | 1.73 | 67.49 |
| 3% processed horse extract 1 | 0.94 | 0.49 | 1.91 | 1.73 | 47.22 |
| 3% processed horse extract 2 | 1.05 | 0.53 | 1.98 | 1.93 | 52.35 |
| 3% processed horse extract 3 | 1.23 | 0.62 | 1.98 | 1.93 | 61.67 |
| 1% processed horse extract 1 | 1.29 | 0.76 | 1.7 | 0.79 | 64.41 |
| 1% processed horse extract 2 | 1.58 | 0.93 | 1.69 | 0.81 | 79.08 |
| 1% processed horse extract 3 | 1.45 | 0.86 | 1.68 | 0.77 | 72.51 |
| 0.5% processed horse extract 1 | 1.53 | 0.84 | 1.81 | 1.78 | 76.58 |
| 0.5% processed horse extract 2 | 1.54 | 0.84 | 1.84 | 1.91 | 77.05 |
| 0.5% processed horse extract 3 | 0.9 | 0.5 | 1.81 | 1.78 | 45.24 |
| 0.1% processed horse extract 1 | 1.43 | 0.77 | 1.85 | 2.21 | 71.45 |
| 0.1% processed horse extract 2 | 1.53 | 0.83 | 1.85 | 2.24 | 76.48 |
| 0.1% processed horse extract 3 | 1.53 | 0.83 | 1.84 | 2.22 | 76.73 |
Appendix II: Authentication of meat species by Sanger sequencing, alignment figures
Figure A1: Alignment figure for pork forward and reverse cytochrome B sequences against the pork reference sequence (NC_000845).

Figure A2: Alignment figure for horse forward and reverse cytochrome B sequences against the horse reference sequence (D82932).

Figure A3: Alignment figure for beef forward and reverse cytochrome B sequences against the beef reference sequence (D34635).
