Our Food 2021: An annual review of food standards across the UK
This report describes the key changes in food standards from 2019 to 2021, a period when the UK’s food system was affected by our departure from the EU and the impact of the COVID-19 pandemic.
Food matters. In fact, it is integral to who we are and how we live. It impacts on our health, defines our communities and powers our economy.
A full PDF version is available for download:
England, Northern Ireland and Scotland
Food matters. In fact, it is integral to who we are and how we live. It impacts on our health, defines our communities and powers our economy. It gives us enjoyment, variety and comfort in our lives. It is what we turn to, again and again, when we want to celebrate and share cherished moments with friends and family.
For all these reasons, it is vital that the food we buy meets the standards we expect and supports the values we hold dear. As consumers, we should feel confident that what we eat is what it claims to be, and that we are being protected from anything that is unsafe, inauthentic, or harmful. Everyone should be empowered and informed to make the right dietary choices for themselves, their families and the planet.
So why publish a report on food standards now? Quite simply, we believe this an important period for food quality and safety. At a time when the UK is taking on new responsibilities for food following our departure from the European Union (EU), consumers need strong watchdogs looking out for whether standards are being protected. This report – the first in a series to be published annually – will help us do so by providing an objective, data-driven assessment of the safety and standards of food over time.
Why us? Because the Food Standards Agency (FSA) and Food Standards Scotland (FSS) are together responsible for food standards across the whole of the UK – this is an important, long-term collaboration between our two organisations that should provide greater transparency and accountability for food quality across the four nations. This, in turn, will help us work with food businesses, local authorities and other partners to address any emerging threats or vulnerabilities.
Why now? Because this first report is a chance to reflect on a particularly momentous period for UK food, spanning the years from 2019 to 2021. It not only takes in the first year after the UK was fully outside of the EU but also coincides with the peak of the COVID-19 pandemic. Both posed substantive challenges in ensuring business continuity and maintaining regulatory standards, and a major part of this report is devoted to understanding what impact these events have had, what we can learn from them and what we need to monitor in the future.
At the same time, other societal changes are posing additional questions. Climate change is resetting people’s expectations and priorities. Technology is reshaping the business landscape and creating new regulatory challenges. Poor diet and obesity remain major concerns, with health worries also putting a sharper focus on food information and the integrity of product marketing.
This was also a period when rising food prices were beginning to be felt. As we will see, there is a risk that this will make a healthier and more sustainable diet feel an unreachable goal. We expect that the affordability of food – and especially "good food" – will be a significant theme in next year’s annual report.
Finally, our food system is resolutely global in nature, and an important part of our work is with UK government departments, the Scottish Government, Welsh Government, and Northern Ireland Executive to protect food standards as best we can from the potential impact of any external shocks and upheavals. The war in Ukraine, for example, is already disrupting food supply chains. While it is too early to draw any conclusions about the specific effect on food standards, this is something we are monitoring closely and will explore further in next year’s report.
Similarly, as the UK builds new trading relationships with the rest of the world and our relationship develops with the EU, we need to keep a close eye on the impact of new trade deals and effectiveness of measures put in place to uphold the standards of our imported foods.
Of course, the process of getting food safely from “farm to fork" is complex and multi‑faceted, and this report can only address a limited number of these areas.
However, we want this evidence to start important conversations about emerging trends, future risks and how, together, we navigate our way through uncertainty and change.
We look forward to working with our many partners – and each other – to ensure that food across the UK continues to be safe and increasingly healthier and more sustainable.

Professor Susan Jebb, Chair, The Food Standards Agency

Heather Kelman, Chair, Food Standards Scotland
Food Standards Agency
Established in 2000, the Food Standards Agency is an independent, non ministerial government department working to protect public health and consumers' wider interests in relation to food. With responsibilities spanning all aspects of food and feed safety and standards across England, Wales and Northern Ireland, it works to make sure the food we eat is safe and what it says it is, as well as being healthier and more sustainable for the future.
Food Standards Scotland (FSS) was established on 1 April 2015 as the new independent non-ministerial public sector food body for Scotland. It exists to uphold food safety and standards, improve the public’s diet, and protect consumers’ other interests in relation to food. Its remit covers all aspects of the food chain which can impact on public health, aiming to protect consumers from food safety risks and promote healthy eating.
FSS was formally commissioned by the Minister for Public Health, Women’s Health and Sport to produce this report, in conjunction with the FSA, to support requirements in the Food (Scotland) Act 2015, which sets out a clear statutory objective for FSS to protect the interests of consumers in relation to food.
This report describes the key changes in food standards from 2019 to 2021, a period when the UK’s food system was affected by our departure from the EU and the impact of the COVID-19 pandemic.
Introduction and scope
This report describes the key changes in food standards from 2019 to 2021, a period when the UK’s food system was affected by our departure from the EU and the impact of the COVID-19 pandemic.
Food standards, of course, mean different things to different people. For the purposes of this report, we look at standards in two ways:
- Food and feed safety (including allergen management) – that is, ensuring the product is safe to consume, or in the case of feed, safe for introduction into the food chain. A number of factors are taken into account when proposing safety standards, including advice from the FSA and FSS risk assessors and wider as well as other aspects such as the principles that may determine consumer acceptability of risk.
- Other standards that support consumers and provide assurance – this includes provenance and authenticity, production standards (for example, animal welfare and sustainability), composition and nutritional content, labelling and advertising of food, and other information that enables consumers to make informed choices based on the values that are important to them.
Industry compliance with regulatory standards, and the capacity and capability of authorities to uphold them, are essential elements in assessing whether food standards are being maintained in practice. Whilst many standards are mandated in law, there are also voluntary standards, maintained by industry or supported through independent assurance schemes, that can exceed legal requirements and reassure consumers when making informed food choices.
In this report we ask whether our food is fundamentally safe, nutritious, authentic and what it claims to be, all with a view to protecting the consumer’s best interests. To answer this, we draw on a range of evidence – including local authority data,
official government statistics, compliance returns from import checks, and the FSA and FSS’s own research and surveillance activity. Our aim is to show whether standards are being upheld, with a focus this year on regulatory standards. The report overall provides UK-wide analysis but, where possible, we go into individual data across the four nations.
Future reports may also consider broader production standards, such as more specific issues related to animal welfare and the impact of production on the environment, reflecting the increasing public awareness of, and interest in, how our food system works and its impacts on the world around us. These issues are also of relevance when it comes to new free trade agreements, which have generated debate across the home nations due to concerns that they may lead to food produced to lower standards being placed on the UK market.
Finally, we report on how food standards are enforced, exploring the robust system of controls that underpin business compliance, whether at a slaughterhouse, the border, a factory or elsewhere. Our aim is to gauge how effectively the food industry adheres to these rules, and how well we, in turn, support them to do so.
Like the food system itself, food standards are complex and multi-dimensional. As consumers, we all have a view on what matters most when it comes to the intrinsic qualities of the food we eat, and this itself changes over time as our preferences and priorities shift and new events change our food supply chain. As such, the priorities and standards we pursue form part of an ongoing dialogue between industry, consumers and rule-makers about what we ultimately value.
We cannot hope to do justice to every aspect of food standards in the pages ahead, although over time we would like this annual report to grow – and for our data analysis and commentary to grow with it. For now, we make clear at the start of each chapter about which specific aspects of our definition of food standards we are focusing on in each case.
Key findings
The evidence set out in this report suggests that overall food safety standards have largely been maintained during 2021. However, this is a cautious conclusion. The pandemic disrupted regular inspections, sampling and audits across the food system, reducing the amount of data we can draw upon in assessing business compliance against food law requirements. It also changed patterns of consumer behaviour. While food safety standards have largely been maintained, both organisations recognise there are significant risks ahead.
The report highlights two particular areas of concern. Firstly there has been a fall in the level of local authority inspections of food businesses. The situation is in the process of being repaired – in particular in food hygiene inspections of cafes and restaurants – but progress is being constrained by resource and the availability of qualified professionals. The second is in relation to the import of food from the EU. To enhance levels of assurance on higher-risk EU food like meat, dairy and eggs, and food and feed that has come to the UK via the EU, it is essential that improved controls are put in place to the timescale that the UK Government has set out (end
2023). The longer the UK operates without assurance from the exporting country that products meet the UK’s high food and feed safety standards the less confident we can be that we can effectively identify potential safety incidents. It is vital that the UK has the ability to prevent entry of unsafe food and identify and respond to changing risks. Although we have considered these challenges carefully and put other arrangements within our control in place, they are not, in our view, sufficient. We are therefore committed to working with other government departments to ensure that the introduction of these improved import controls provides high levels of protection for UK consumers.
Outline of the report
The report is made up of five main chapters, each focusing on a different aspect of the UK’s food system. We have listed the key points from each of these below. While the majority of data featured in this report covers the period from 2019 to 2021, we have included historic data where appropriate, as well as our most recent piece of consumer research (The UK Public’s Interests, Needs and Concerns Around Food), which was conducted in early 2022.
The nation's plate
The chapter looks at the types of food finding their way on to the nation’s plate and what this tells us about how closely we are following dietary recommendations. It also looks at our eating habits and purchasing behaviours, including the factors that influence them.
1. There has been very little change in the nation’s nutrient intake over the last decade, with many people still falling short of official dietary recommendations. However there has been a notable reduction in the average intake of free sugars, particularly in children (though it still greatly exceeds recommended intakes). People are also eating less red and processed meat, and one in four people say they are now adopting ‘flexitarian’ eating habits, meaning that they are still eating, but cutting down on, meat, dairy and animal products.
2. The pandemic’s impact on people’s diets appears to be mixed. There is evidence that restrictions led some people to prepare and eat healthier meals at home, but also increased the tendency to indulge in unhealthy snacks and takeaways. People from households with lower financial or food security reported consuming fewer fruits and vegetables, less fish and more sugar-sweetened soft drinks than those who were more financially or food secure.
3. The latest FSA and FSS research shows accessing healthy food at an affordable price is uppermost in the public’s mind. More than three-quarters (76%) said they were concerned or extremely concerned about the cost of food.
4. Recent increases in food prices present a growing threat to the standard of food people eat. More than half (53%) of consumers say they feel ‘priced out’ of buying healthy food; and one four consumers now feel the only foods realistically
available to them are heavily processed, increasing to around half for households facing food insecurity. It is likely that the quality of the nation’s plate may be affected as the squeeze in household incomes intensifies this year.
Going global
This chapter looks at the reported safety of imported food over recent years, as well as the growing debate around how we uphold wider production standards as the UK enters into new trading partnerships. This is important because food safety alone is not a guarantee of high standards.
5. Around 40 million tonnes of food are imported from abroad each year. The EU remains by far the biggest supplier, accounting for over 90% of all beef, dairy, eggs and pork products imported into the UK and nearly two-thirds (65%) of all food and feed not of animal origin.
6. Despite recent volatility in import patterns, there are no signs of any immediate or wholesale shift in trading flows following the UK’s departure from the EU, though EU imports of fish, lamb and mutton, and pork have all fallen between 2019 and 2021.
7. Analysis of compliance levels in import controls checks carried out between 2020 and 2021 shows that there has not been any meaningful change in the standard of imported goods as a result of either the pandemic or the UK’s EU departure.
8. The UK Government recently announced that full import controls for goods coming from the EU to Great Britain would be further delayed and replaced by a modernised approach to border controls by the end of 2023. Until then, the UK food safety authorities continue to manage risks through pre-notifications[1], which were introduced in January 2022 for certain high-risk food and feed imports, and through enhanced capability and capacity put in place as part of EU exit planning to detect and respond effectively to food and feed incidents.
9. Although there is no evidence that the standards of EU imports have fallen, the FSA and FSS believe the current situation does reduce our ability to prevent foods that do not meet the UK’s high standards from being placed on our market. The lack of import controls means we are not receiving official assurance from the exporting country that imports meet the UK’s high food and feed safety standards. The absence of border checks could also affect how we identify and respond to safety risks in future, with additional resource required by the UK to maintain levels of food safety assurance for these imports.
10. New free trade agreements (FTAs) with Australia and New Zealand are in the process of being ratified at the time of writing. The UK Government has a statutory obligation to report to the UK Parliament on whether each FTA maintains statutory protections for human, animal or plant health, animal welfare or the environment. The FSA and FSS are providing advice on statutory protections for human health during this process.
Safe and sound
This chapter looks at how many food incidents were reported over this timeframe and explores the different factors influencing them. It also describes the latest trends in food crime and what is shaping our response to it.
11. Our analysis of reported food incidents shows a fall in the number of incidents in 2020, likely reflecting fewer food businesses trading during lockdown and the narrowing of product ranges by supermarkets. Levels of notifications have since recovered to historic averages.
12. There was a rise in reported cases of contamination by harmful micro-organisms during 2020 and 2021, as a result of more advanced surveillance (in particular, the introduction of Whole Genome Sequencing (WGS) to track the source of outbreaks) and the specific impact of an outbreak of Salmonella in breaded chicken products which triggered increased sampling activity.
13. There was a welcome fall in incidents related to food allergens from 2019 to 2021, which may indicate improvements in industry awareness and practice following a number of high-profile incidents. Widespread EU and UK reporting of ethylene oxide in sesame seeds accounts for many of the reported cases of chemical contamination in 2020 and 2021.
14. The UK’s exit from the EU means that it no longer has full access to the European Commission’s Rapid Alert System for Food and Feed (RASFF) though it continues to receive notifications concerning the UK. The FSA and FSS have built alternative arrangements with other international partners as well as investing in new surveillance approaches. Levels of incoming and outgoing notifications from EU and non-EU countries have remained stable.
15. There were 100 successful ‘disruptions’2 of criminal activity within the food chain reported by the UK’s two food crime units in 2021. Five cases in Scotland have been referred to the Crown Office and Procurator Fiscal Service, with three of these being considered under petition procedure reserved for the most serious offences. Last year also saw the first prosecution stemming from an investigation by the National Food Crime Unit (NFCU), related to the sale of 2,4 dinitrophenol (DNP) alongside other offences linked to controlled drugs and prescription only medicines.
16. Despite the pressure put on the food supply chain by the pandemic and the UK’s EU departure there has been no evidence of significant exploitation by criminals. There has been no discernible increase in food crime detected over this period.
Informing consumers
This chapter covers the implications for food information after EU Exit, including the steps taken to provide business continuity after the transition period, domestic policy changes to inform and protect consumers, and future developments for improving food labelling transparency.
17. The UK’s departure from the EU prompted a series of actions designed to minimise disruption, including new legislation, changes to compositional standards and origin labelling. A new UK Nutrition and Health Claims Committee (UKNHCC) has also been established to provide expert advice and scrutiny on food marketing claims. Existing arrangements remain in Northern Ireland under
the terms of the Protocol on Ireland/Northern Ireland.
18. Sampling conducted by the FSA and FSS during the pandemic provides reasonable confidence that the basic safety of the majority of food products was being upheld. However, a significant number of products tested did not meet required standards in at least one area, particularly in terms of the quality and accuracy of consumer information. This underlines the need for ongoing monitoring and
increased investment in a wider range of sampling activities.
19. This has also been a significant period in the development of domestic policy relating to food information with the introduction of amendments to the Food Information Regulations 2014 and equivalents in Northern Ireland, Scotland and Wales [3]. Also known as ‘Natasha's Law’, these new regulations require that all food that is pre-packed for direct sale has clearer information about ingredients and allergens. Mandatory calorie labelling, meanwhile, has been introduced in large food outlets across England.
20. Maintaining food authenticity and information standards in the future means keeping pace with a range of long-term challenges – from addressing shortfalls in inspection capacity, to expanding the scale and sophistication of sampling activity conducted by the food safety authorities. The growth in online commerce also creates further complexity by increasing the number of online businesses
requiring oversight and assurance.
Keeping it clean
This chapter assesses hygiene standards across different types of food and feed establishments. It charts the latest available data on legal compliance, in addition to how food businesses are performing according to the two food hygiene rating systems. Recognising the disruption caused by the pandemic, the chapter also looks at what steps are being taken to restore and strengthen inspection systems for the future.
Local authorities across the UK are responsible for carrying out a range of food hygiene checks and interventions at food establishments. Inspections were badly disrupted by the impact of the pandemic, which restricted the ability of inspection teams to physically access many establishments. The data in this chapter needs to be considered in this light.
22. The latest compliance data indicates that over 95% of food businesses inspected by local authorities were broadly compliant (or higher) in England, Wales and Northern Ireland. Similarly in Scotland, food law compliance status is above 96%.
23. Three-quarters of food establishments in England, Wales and Northern Ireland achieved a top rating of five under the Food Hygiene Rating Scheme (FHRS) (which provides a rating between zero and five), but 3% were rated two or below, requiring some improvement, major improvement or urgent improvement. In Scotland under the Food Hygiene Information Scheme (FHIS), which provides a rating of ‘pass’ or ‘improvement required’, nearly 94% of businesses received a pass rating over the past three years, with around 6% of businesses requiring improvement. Data is based on a snapshot of FHRS and FHIS ratings on 31 December 2021. This includes rating assessments undertaken both during and before the pandemic.
24. There was high and stable compliance with hygiene standards in meat and dairy establishments and among feed businesses, with the vast majority given a clean bill of health – though again, audit and inspection activity were significantly curtailed by the effect of social restrictions, with many checks having to be performed remotely. A more conclusive picture should emerge in next year’s
report.
25. Both the FSA and FSS are working with local authorities as they resume inspections across food businesses, starting with those establishments with a history of non-compliance or deemed to be high-risk. Early evidence suggests that local authority inspectors are encountering higher levels of non-compliance in businesses they have inspected since the onset of the pandemic. There is, however, insufficient evidence to say whether this drop in standards is more widely reflected across other businesses.
26. Other factors likely to affect food hygiene standards in future include the rise of online marketplaces. These are not inherently risky, but they allow new food businesses to pop up very quickly, with the associated risk that many may be unregistered and operating without adequate oversight or inspection of their practices.
27. Workforce recruitment and retention also present challenges. The FSA and FSS are implementing measures to recruit and retain official veterinarians and meat hygiene inspectors while also supporting local authority efforts to recruit and retain sufficient numbers of environmental health and trading standards officers. We will review the progress made across these areas.
In this year’s report, we reflect on food standards in 2021, a remarkable period for the UK food system dominated by two events: the UK’s departure from the EU and the COVID-19 pandemic.
In this year’s report, we reflect on food standards in 2021, a remarkable period for the UK food system dominated by two events: the UK’s departure from the EU and the COVID-19 pandemic. To provide context, this chapter sets out a timeline of the COVID-19 events that impacted on the food and animal feed environment and an overview of the impact of EU Exit on policy-making in the UK.
In preparing this report, we have also seen disruption caused by the war in Ukraine and the increasing cost of foods. While the impacts of both of these issues are being felt now, and are at the forefront of many people’s concerns about food today, this is a retrospective report. We will return to these issues and their overall impact on food standards in future reports, which will examine the data and evidence about the state of food standards in 2022 and beyond.
Timeline of significant external events impacting on the food and animal feed environment
Timeline of impact: COVID-19
This timeline does not seek to provide a comprehensive view of all COVID-19 restrictions across each of the four nations. It focuses on the major milestones that relate to food safety and standards in line with the wider approach taken to the report.
The pandemic had immediate and far-reaching effects on the UK food system. There were periods when non-essential retail shops and hospitality venues, including restaurants and work canteens, remained closed (other than for takeaways), and people were encouraged to stay at home. As we will see in Chapter 1 (The nation’s plate), this had a number of effects on people’s eating habits in the short term, though it is unclear what longer term impact, if any, the pandemic will have on consumer behaviours.
The pandemic similarly took its toll on hospitality businesses and suppliers, though many businesses responded creatively, developing new ways of working to stay open and avoid disruption to consumers. There was a sharp increase in the proportion of online purchases from food stores in March 2020, with no sign as yet of any return to pre-pandemic levels.
February to March 2020
Increased consumer demand for some food products creates localised and product-specific shortages, putting immense pressure on retailers and manufacturers.
March 2020
The first UK-wide lockdown begins. FSA publishes guidance for the food industry on food hygiene, social distancing, and managing employee sickness. FSA and FSS issue guidance to enforcement authorities on the approach that should be taken to the delivery of Official Controls. FSA and FSS begin taking actions to support the continued delivery of Official Controls, focusing on high-risk
activities.
April to May 2020
FSA and FSS publish guidance to consumers to provide reassurance that the risk of catching COVID-19 through food is very low.
FSS publish guidance to food businesses, including advice on risk management and infection control when handling food.
July to August 2020
Pubs, restaurants and other hospitality venues reopen. UK Government launches its Eat Out to Help Out scheme.
September to November 2020
Tighter restrictions are phased in, including limiting hospitality businesses to take-away service. A series of shorter national lockdowns affect different parts of the UK as COVID-10 cases rise.
December 2020
FSS and the Scottish Food Enforcement Liaison Committee jointly issue guidance to enforcement authorities on restarting the delivery of planned food law interventions.
December 2020 to January 2021
National lockdowns are reintroduced across the UK, with much of the hospitality sector again required to close.
April to May 2021
Restrictions are eased, with pubs, restaurants and other hospitality venues reopening across all four nations.
June 2021
FSA issues guidance to enforcement authorities on restarting the delivery of planned food law interventions.
Timeline of impact: EU Exit
Considerable efforts have been made to maintain business continuity following the UK’s EU departure. While robust controls are in place for high-risk food products from outside of the EU, equivalent checks on produce imported from EU countries are now unlikely to be introduced before the end of 2023. The absence of border checks could affect how we identify and respond to safety risks in future, with additional resource required by the UK to maintain levels of food safety assurance for these imports. Environmental health officers (EHOs) are now required to authorise some EU exports, and the FSA and FSS need to assess the impact that is having on EHO capacity in the wider assurance system in future reports. The adoption of EU law into domestic legislation means that we have seen few significant changes in food standards over the reporting period. This is covered in greater detail in the next section.
31 January 2020
The UK leaves the EU and enters a transition period. UK Nutrition and Health claims Committee begins to advise on nutrition and health claim application and to provide scientific opinions to government authorities.
30 December 2020
UK-EU Trade and Cooperation Agreement (TCA) signed.
1 January 2021
Transition period ends and the Protocol on Ireland/Northern Ireland takes effect. The FSA and FSS take on responsibility for food and feed regulated product applications.
1 January 2022
Pre-notification requirements are introduced for EU imports into Great Britain that involve products of animal origin (POAO), high risk food and feed of non-animal origin (HRFNAO), and composite food products introduced.
2023
Planned introduction of full import controls (documentary, identify and physical checks) for imports of POAO, HRFNAO, and composite food products.
A summary of the impact of EU Exit on policy-making
Ministers in Great Britain have responsibility for setting future levels of protection for UK consumers and producing new regulations for food and animal feed standards following the UK’s departure from the EU. Under the terms of the Protocol on Ireland/ Northern Ireland, food and feed placed on the market in Northern Ireland still needs to meet EU rules and new EU regulations will continue to be enforced in Northern Ireland. The UK’s food safety authorities, the UK Government, and the devolved governments now have additional responsibilities for shaping food safety and standards, which creates both opportunities and challenges.
As EU laws were incorporated into domestic legislation applicable in Great Britain, there have, as yet, been few immediate regulatory changes affecting food standards.
The focus across all four nations has been on maintaining continuity and providing clarity for businesses and consumers on processes and expectations. In this section, we briefly set out the processes through which UK ministers might consider changes to food standards in future years. In later sections of the report, we consider the impact of trade on food standards. Countries wishing to import products to Great Britain will still need to meet domestic import requirements, including on food safety.
Any future market access requests from new countries or for new commodities will be assessed for their suitability before they can be sold to consumers. We will return to this issue in future reports.
Risk analysis
FFor food and animal feed safety issues, the UK carries out its own assessments of science and evidence to inform the development of regulations through a process known as ‘risk analysis’. Risk analysis involves three stages: risk assessment (estimation of the risk to human health), risk management (how these risks are
controlled), and risk communication (how this information is conveyed). This process is summarised in figure 1. The risk analysis process covers procedures through which regulated products4, such as additives and novel foods, are placed on the market in future.
Risk assessments, previously conducted by the European Food Safety Authority (EFSA), are now undertaken by the FSA and FSS. Risk management, which was previously conducted by the European Commission, then considers how we control these risks. Decisions on food safety standards are informed by the risk management process and are taken by ministers in Great Britain. Assessments will continue to be underpinned by science and evidence, though risk management decisions may differ to when the UK was a member of the EU. This means that regulations may differ from the EU in the future whilst still being based on science and evidence.

The diagram shows how the food safety authorities make evidence-based recommendations. We call this our risk analysis process. It can apply to a range of issues - from control of pathogens and allergens to applications for authorisation of regulated products and processes such as chemical washes and genetically modified food and feed.
During the process the FSA and FSS will work with devolved administrations, government departments and interested parties to consider the interests of the those with responsibilities for food and agriculture, health and trade.
The process can be triggered for different reasons. Examples include a food safety risk, an application from a business or country, trade negotiations, policy issues or a request for advice from government departments.
A risk assessment of the safety and other evidence, gathered and analysed by the FSA, FSS and external experts. Other evidence can include consumer preferences, animal welfare, environmental and economic impacts and more.
The FSA and FSS develops advice or recommendations based on the evidence. This might include major policy changes, legislation or other actions.
The FSA and FSS finalise advice when a Ministerial decision or a change to legislation is required.
The FSA and FSS take decisions on regulatory requirements and approaches.
Minsters take decisions or consider changes to legislation.
Minsters informed of change as necessary.
Legislation made by parliamentary process as necessary.
The FSA and FSS issue advice for example, consumer advice or business guidance.
The following information will be published online on the FSA, FSS and scientific advisory committee websites:
- list of issues under consideration
- scientific committee papers, minutes (excluding commercially sensitive information)
- formal consultation on the options
- quarterly summary update to Boards
- the FSA and FSS's advice or recommendation with evidence
Outcomes from the risk analysis process are transparent, and the FSA and FSS advice in relation to food and feed safety issues will be published alongside the science and evidence upon which the advice is based. The system has been considered in open sessions of both the FSA and FSS Boards, which covered points such as the approach to uncertainty and risk in developing advice to UK ministers. The risk analysis process and support provided to businesses will be reviewed to ensure the process operates efficiently and supports innovation whilst continuing to protect consumers.
Regulated product applications
428 live regulated product applications were progressing through the system by the end of 2021, considerably higher than the expected figure of 150 applications. The majority were applications to place cannabidiol (CBD) products on the market as a novel food, although applications include other issues such as additives and food contact materials.
Devolution and UK Common frameworks
Food and feed policy are devolved matters. This is why decisions previously taken at EU level are now being made in Great Britain by ministers in the UK Government, Scottish Government, and Welsh Government, while Northern Ireland, under the terms of the Protocol on Ireland/Northern Ireland, continues to align with EU regulations.
The four nations have provisional agreements in place known as Common Frameworks, which set out how they work together in certain devolved policy areas.
Common Frameworks describe the agreement between the four Governments and their food safety bodies to work together in areas of retained EU law and ensure that food and feed safety, standards, labelling and composition policy is developed jointly.
Common Frameworks recognise that policy divergence will be appropriate in some instances and set out how this should be managed between the four nations. However, a recent report by the Office for the Internal Market did not identify evidence of substantial new policy divergence emerging between the four nations since 31 December 2020.
These non-legislative Common Frameworks take account of, and operate in accordance with, the wider legal framework including the UK Internal Market Act 2020,
which was introduced by the UK Government to regulate trade between England, Wales, Scotland and Northern Ireland.
The FSA and FSS continue to monitor divergence across the four nations, between Northern Ireland and Great Britain and between the EU and Great Britain.
Since 31 December 2020, no major new food and feed safety legislation has been introduced in any of the four nations that has led to significant divergence. Future reports will expand on this monitoring and evaluation.
This chapter sets the scene for our analysis of food standards by exploring what we currently eat in the UK and how this is changing over time.
At a glance:
In this chapter, we look at:
- the impact of the pandemic on our eating and purchasing preferences
- the affordability of food and how this affects people's ability to eat healthily
- the wider societal attitudes and concerns shaping our food choices
Introduction
There are good reasons to look closely at what food is finding its way onto the nation’s plate. What we eat, where we buy it, how much we spend on it, and what we worry about when doing so reflects our priorities and preoccupations – which, in turn, helps to define what we really value in our food.
This chapter sets the scene for our analysis of food standards by exploring what we currently eat in the UK and how this is changing over time. We also take a timely look at the affordability of our food, charting how the current economic environment – and other societal trends – are affecting our food choices. We begin by considering the effect of diet on long-term health, which underpins government dietary recommendations across the four nations [5].
Food and our health
In the UK, smoking and a poor diet are the leading causes of avoidable ill-health. Unhealthy diets account for 13% of all deaths in the UK. Most of this is because a poor diet causes obesity, high blood pressure, high blood cholesterol and type 2 diabetes, all of which can lead to cardiovascular disease. What we eat can also increase our risk of some cancers, especially bowel cancer, which is linked to eating too much red or processed meat. Obesity is linked to 13 different cancers, including post-menopausal breast cancer and bowel cancer.
The causes of obesity are complex. Some people are at higher risk because of their genes, and some people may gain too much weight because they are inactive. However, a diet which contains a lot of foods that are high in fat or free sugars, or is low in fibre with few fruits and vegetables, is strongly associated with an increased risk of excess weight gain. Since obesity is also a risk factor for cardiovascular disease and cancer, measuring the prevalence of obesity in a population gives a useful snapshot of the health impact of what we eat.
Latest figures show around a quarter of UK adults, or approximately 15 million people, have a body mass index (BMI) that indicates they are obese. In England, obesity rates have risen steadily for at least 50 years. The most recent figures from the Health Survey for England in 2019 found that 28% of adults (27% of men, 29% women) were living with obesity – approximately four times higher than in 1980 (6% men, 9% women). Wales and Northern Ireland have also experienced increases while in Scotland rates of adult obesity increased between 2003 and 2008 but subsequently remained relatively stable, at least up to the start of the pandemic.
Preliminary evidence suggests that there has been an increase in average weight over the last two years, which is likely to be due to the marked changes in our lifestyles over this period, with many of us becoming less physically active and changing the way we eat during the pandemic.
Among children, the situation is particularly concerning as more are classified as having obesity than ever before, increasing their lifelong risk of obesity and related poor health. The latest data from England shows that obesity now affects one in four children aged 10–11 years, with clear evidence of a recent spike since pre-pandemic. In Northern Ireland, the prevalence of childhood obesity appeared to have stabilised at around 18% and in Wales, latest figures show a prevalence of 12.6% among four and five year olds. Data is not yet available to assess whether this has changed during the pandemic.
In Scotland, in the school year 2020/21, 29.5% of the five and six year olds measured were at risk of overweight or obesity, representing a 6.8 percentage point increase since 2019/20. This data also found the increase was greater among children living in the most deprived areas (8.4 percentage points) compared to those in the least deprived areas of Scotland (3.6 percentage points).
Of particular concern across the whole of the UK is the clear association between higher rates of obesity and more deprived parts of the country. There is also worrying evidence that the gap in obesity prevalence between the most and least deprived areas in the UK is widening.
What are we eating today?
The most authoritative guide to what we are eating today is the National Diet and Nutrition Survey (NDNS), which has been collecting detailed information on the food and nutrient intake of the UK population since 2008. The latest findings are set out below.
Please note that due to changes in data collection during the pandemic the 2020 figures are not directly comparable to the historic data. For this reason, we have included references to the overall trends from 2008 to 2019 and kept the 2020 data separate.
Free sugars
Despite a decline in intake of free sugars in both adults and children between 2008 and 2019 consumption remains high (figures 2 and 3). According to the 2020 data, free sugars intake (as a proportion of total energy intake) is highest in children aged 11 to 18 years, though average consumption across all age groups exceeds the recommended maximum level of 5%.
Daily free sugars intake has fallen but still remains high
Figure 2: Daily free sugars intake as a percentage of total energy in adults and children

Source: Public Health England NDNS: results from years 9 to 11 (2016 to 2017 and 2018 to 2019)
Figure 3: Average consumption of free sugars as a proportion of daily total energy (2020)

Source: Public Health England NDNS: Diet and physical activity - a follow-up study during COVID-19
Saturated fat
The average person’s intake of saturated fat as a percentage of total energy intake saw no change between 2008 and 2019. Across all age groups, consumption continues to exceed the dietary recommendation that saturated fat should make up no more than 10% of daily total energy intake. Consumption of saturated fat (as a proportion of total energy intake) is highest in women aged 65 years and over, accounting for 13.9% of their total energy intake in 2020.
Figure 4 Average daily saturated fat consumption as a proportion of daily total energy (2020)

Source: Public Health England NDNS: Diet and physical activity - a follow-up study during COVID-19
Salt
Latest data taken from salt levels in urine shows that average intake is higher than the recommended intake of 6g per day for adults in all parts of the UK. The trend data we have suggests that this is broadly stable over time across the four home nations, except for in Scotland where there was a decline in salt intake between 2006 and 20146.
Figure 5: Average estimated daily salt intake across the UK for adults aged 19-64 years

Source: Salt intake is estimated through urine samples collected as part of the National Diet and Nutrition Survey rolling programme. Data are collected and reported separately for England (2018/2019), Wales (2009/10-2012/13), Scotland (2014) and
Northern Ireland (2015).
Fruit and vegetables
Most people in the UK eat fewer than the recommended five portions of fruits and vegetables a day, with children aged 11-18 years eating the fewest. Between 2008 and 2019 there was an increase in women aged 19‑64 years meeting the recommended intake for fruit and vegetables, but no change for other groups. Previous analysis has shown that higher income households tend to have a higher intake of fruit and vegetables.
Figure 6: Average portions of fruit and vegetables eaten per day by age (2020)

Source: Public Health England NDNS: Diet and physical activity - a follow-up study during COVID-19
Fibre
Fibre intake remains below dietary recommendations across all age groups. There was little change in fibre intake between 2008 and 2019. While a quarter of children from two to ten years old are meeting the recommended intake, just 4% of older children aged from 11 to 18 are doing so. The recommended amount is 30g for adults and varies for children depending on age.
Figure 7: Average amount of fibre consumed per day (2020)

Source: Public Health England NDNS: Diet and physical activity - a follow-up study during COVID-19
Fish
The amount of fish we are eating remains static and significantly below recommended guidelines of at least two portions of fish a week, one of which should be oily fish. Mean daily consumption of oily fish was also below the recommended one portion a
week across all age groups. Average consumption of all types of fish has changed very little between 2008 and 2019.
Figure 8: Average weekly consumption of fish by age group (2020)

Source: Public Health England NDNS: Diet and physical activity - a follow-up study during COVID-19
Meat
2019 largely driven by a reduction in red and processed meat consumption (figures 9 and 10). Latest figures from 2020 indicate the average adult now eats below the recommended maximum of 70g a day of red and processed meat – though there is a big gender difference, with men aged 19-64 years (68g) consuming nearly twice as twice as much, on average, as females of the same age (38g).
Both men and women are now eating less red and processed meat
Figure 9: Average daily consumption of red and processed meat in working age adults (grams per day)

Source: Public Health England NDNS: results from years 9 to 11 (2016 to 2017 and 2018 to 2019)
Figure 10 Average daily consumption (grams per day) of red and processed meat by age group (2020)

Source: Public Health England NDNS: Diet and physical activity - a follow-up study during COVID-19
Where are we buying food?
Our diets are also influenced by how and where we get our food. While most people regularly shop for food in supermarkets, the FSA’s Food and You 2 survey shows that over a third of people in England, Wales and Northern Ireland regularly buy food in local corner shops, newsagents or garage forecourts. These shops tend to be more expensive, have a more limited range of products, and supply less fresh food. Analysis shows that households with marginal, low or very low food security, are more likely to buy food from these types of outlets at least once a week, compared to those with high food security.
Most people shop for food in a supermarket at least once a week
Figure 11: % of respondents in England, Wales and Northern Ireland who shop about once a week or more

Source: Food Standards Agency: Food and You 2 Wave 3
The FSA and FSS's The UK Public’s Interests, Needs and Concerns Around Food research meanwhile shows that 22% of people in the UK order from a takeaway and a further 23% order via a food delivery service (for example, Deliveroo, Just Eat, Uber Eats) at least once a week, whilst one in five (20%) eat out in restaurants, pubs or cafes at least once a week. Younger adults, and higher income households are more likely to eat out or order takeaways.
What is influencing our food choices?
What is on people’s minds when they buy food for themselves and their families? In early 2022, the FSA and FSS's The UK Public’s Interests, Needs and Concerns Around Food surveyed more than 6,000 people to reveal what shapes our behaviour and preferences today. Here are some of the key findings:
The price of food
When thinking about the future of food in the UK over the next three years, consumers were most concerned about the price of food (76% were quite or extremely concerned). More than two thirds (68%) said they were worried about the cost of healthy food in particular and more than half (53%) said they felt “priced out” of
buying healthy food.
Health concerns
Over four in ten UK consumers claimed they often selected food because of its specific health properties, and nearly half (49%) said they avoid buying foods that contain added ingredients such as trans fats, palm oil, preservatives or E numbers.
Changing eating habits
Many consumers reported that they are adopting a ‘flexitarian’ diet – that is, eating mostly plant-based foods while eating meat and other animal products only occasionally. In the UK, 25% of the public described themselves as “still eating but cutting down on meat, dairy and animal products”. A further 5% already identify as vegetarian, 3% say they are pescatarian and 2% vegan [7].
Ethical and environmental awareness
Many consumers are making food choices based on ethical and environmental concerns, with 64% saying they care deeply about the treatment of animals in the food chain, and 67% reporting that they are trying to reduce or avoid food products that create plastic waste. Similar proportions expressed concerns related to the amount of packaging waste or plastic packaging in the food chain (65%), high levels of food waste (64%), and food poverty and inequality (64%).
The impact of the pandemic
Eight out of ten people in England, Wales and Northern Ireland have made changes to their eating habits in the last 12 months.
In 2021, 75% of people in Scotland say they know they have to make significant changes to what they eat to be more healthy, and 23% of adults said their diet had worsened since the pandemic.
COVID-19 certainly made an impression on the nation’s eating habits. From lockdown to 'Eat Out to Help Out', the pandemic caused sudden changes in what we eat and how we shop. It is less clear, however, whether longer-term changes in consumer behaviour have occurred.
A number of studies have looked at the impact of the pandemic on our diets. These include the regular Food and You 2 and Food in Scotland surveys, a monthly COVID-19 Tracker established in April 2020, a dedicated Food in a Pandemic study conducted in November 2020 and qualitative research conducted in England, Wales and Northern Ireland in June and July 2020. FSS also recently published a new Situation Report which provided an overview of changes to food shopping and eating behaviours in Scotland in 2020 as a result of the pandemic.
The main observations are set out below.
Observation 1: The financial pressures of the pandemic made healthy eating tougher for some consumers.
The FSA’s Food in a Pandemic study found that those who were vulnerable to household food insecurity were also more likely to find it harder to maintain a healthy
diet during the pandemic: 51% of those with children eligible for free school meals reported that it was a struggle to eat healthily compared with 37% of those with
children who were not.
The 2020 NDNS survey also showed that people from households with lower financial or food security reported consuming fewer fruits and vegetables, less fish, and more sugar-sweetened soft drinks than those who were more financially or food secure [8].
The FSS Food in Scotland survey found that just under 23% of adults in Scotland had worried about affording food in the past year, with those with children more likely to do so (36%). Around one in seven adults (14%), and nearly one in four (24%) of those with children, said they had skipped meals as a result [9].
Observation 2: The pandemic appears to have had a mixed impact on the nutritional quality of our diets.
Consumer research commissioned by FSS found that in Scotland cooking from scratch increased briefly after the first lockdown. However, there was also a greater increase in the use of ‘assisted cooking’ (such as cooking sauces and kits), particularly for evening meals, which lasted throughout 2020.
The FSA’s Food in a Pandemic study, meanwhile, found that a third (32%) of people reported eating more healthy main meals at the time of the study (November 2020) compared to before the pandemic (9% reported eating less), with the majority of these saying they had more free time and were cooking more at home10.
However, a survey of parents in Scotland (included in the FSS Situation Report), found that 34% thought their diet had become less healthy as a result of the COVID-19 pandemic, while 17% felt that their child’s diet was now less healthy [11].
Observation 3: The pandemic encouraged people to eat more unhealthy snacks and treats during lockdown.
The FSA’s Food in a Pandemic research shows a similar proportion of people (33%) from roughly the same groups that reported healthier eating in main meals, also
indicated that they were eating more unhealthy snacks. In contrast, 18% reported that they were eating fewer unhealthy snacks.
Similarly, FSS data found that in Scotland snacking at home increased by nearly a third (31%), particularly during the day. There was also a 31% increase in the value of the takeaway and delivery sector at the peak of the pandemic in Scotland.
Observation 4: Many consumers shopped online more for groceries, while some consumers also shopped more locally.
The 2020 NDNS survey suggests that around two-thirds (68%) of UK consumers went to grocery shops less often than before the pandemic and about a third (34%)
reported doing more grocery shopping online.
Data commissioned by FSS also shows an increase in online grocery shopping in Scotland, with 64% more groceries bought online compared to 2019.
The FSA’s Food in a Pandemic research, meanwhile, found that over a quarter of consumers (28%) reported purchasing more locally produced food, and a similar
proportion (29%) reported buying food from smaller grocery shops. This shift to buying local was higher among the more affluent consumers, those from ethnic
minority groups and those with children [12].
The affordability of our food
Official ONS data (figure 12) shows that food prices rose by 4.5% between December 2020 and December 2021. This represents the greatest annual increase in the price of food from one December to the next since 2010, and the annual rise has since increased to 6.7% from April 2021 to April 2022. There have also been sharp rises in petrol and energy prices, which are increasing household bills and squeezing family budgets.
UK households spent an average of £72.45 a week on food, accounting for 8.2% of household expenditure. This is equivalent to around £30 per person per week. When adjusted for inflation, we were spending 5.8% more on food in real terms in 2021 than we did over the previous five years on average, though this will vary between households.
Figure 12: How the price of food has changed over time (2009 to 2021)

Source: Office for National Statistics (2022) Consumer price inflation time series
How to interpret the graph
The graph is presented as an index which allows us to compare how nominal and real food prices have changed since the year 2000, which is given a baseline value of 100 for each. For example, we can see from the index that the nominal price of food was 110 in 2005 meaning that nominal prices were around 10% higher on average in 2005 than they were in 2000.
Household food insecurity and consumer concerns
While pressure on living standards affects all households to varying degrees, it poses the greatest concern for those most vulnerable to household food insecurity as lower income households tend to spend a greater proportion of their budget on food.
Official figures from the Department for Work and Pensions (DWP) Family Resources Survey show that a total of 7% of UK households – roughly two million households – were described as food insecure in 2020/21, with 3% reporting low food security and 3% very low food security. Although this was a slight decrease from the 8% of households being food insecure in the previous year, the combined food and energy price rises in recent months mean these figures are likely to rise again.
A fair share? The UK's household food insecurity hotspots
Figure 13: Household food insecurity in the UK by region (2020 to 2021)

Source: DWP Family Resources Survey: financial year ending 2021
The FSA’s tracking data (figure 14) to the end March 2022 shows that consumer worries about food affordability (for them personally or their household) have fluctuated since April 2020, with around a third of consumers feeling worried about food affordability in March 2022. Although not directly comparable, latest figures for FSS (figure 15) show that over one-fifth of consumers were worried about food affordability in September 2021 [13].
The approaching storm: concerns about food prices began to rise towards the end of 2021
Figure 14: Proportion of consumers worried about food affordability in England, Wales and Northern Ireland

Source: FSA COVID-19 Consumer tracker
Figure 15: Proportion of consumers worried about food affordability in Scotland

Source: FSS COVID-19 Consumer Tracker
According to research carried out in early 2022, this financial strain is already manifesting itself in people’s intended food choices. Many consumers are having to
make tough decisions about how to balance cost and convenience alongside their wider values and concerns about issues such as the basic quality, nutritional value, and environmental impacts of their food.
The FSA and FSS’s UK Public’s Interests, Needs and Concerns Around Food research provides an indication of how this is likely to affect people’s diet, with one in four people now feeling that the only foods realistically available to them are heavily processed. This figure climbs to around one in two among groups with low food security.
The public's priorities for the future
How can public confidence in food standards be maintained during such a challenging period? The FSA and FSS's The UK Public’s Interests, Needs and Concerns Around Food research shows that consumers are clear about what steps they want to be taken to improve the availability of safe, nutritious food.
Priority 1: Ensure equitable access to healthy, safe and affordable foods
Exactly half (50%) of people reported that “access to healthy food products at affordable prices” is important to them while 41% said that “access to low-priced food that is not over-processed and meets good quality standards” is important. Almost half (48%) say they want the FSA and FSS to work with their partners to ensure greater choice of basic low-priced foods which are of good quality as a key priority. More than a third (36%) would like clear guidance on how to make healthier choices on a budget.
Priority 2: Maintain or strengthen food safety and hygiene standards
Consumers want reassurances that food safety and hygiene standards will be upheld after the UK's departure from the EU and built into future trade deals. Enforcing clearer labelling of food ingredients and allergens is also a key priority for 43% of consumers.
Priority 3: Act on additives and processed foods
Nearly half (47%) of the public want the FSA and FSS to take action to reduce things added in the food process such as E numbers and preservatives. Over four in ten UK consumers claim they often select food because of its specific health properties, and nearly half (49%) say they avoid buying foods that contain added ingredients such as trans fats, palm oil, preservatives or E numbers.
Priority 4: Ensure locally-produced food is accessible to all
Over half of consumers (59%) trusted local (smaller) food producers to have higher quality standards than big businesses. However, high quality, locally-produced food was also viewed as expensive and out of reach of many households. More than four in ten people said they therefore wanted the FSA and FSS to work with government departments, local authorities, producers, manufacturers or retailers to “ensure access to affordable, locally-produced foods” as a priority.
Priority 5: Take further action on food waste and environmental sustainability
There is strong public interest in environmental issues within food systems, with consumers expressing concerns about globalised supply chains, sustainability, and animal welfare issues. Just under half of consumers (46%) want the FSA and FSS to work with government departments, local authorities, producers, manufacturers or retailers to set standards to minimise food waste in the supply chain – while 57% said that ensuring high standards of animal welfare, including for imported foods, should be a key priority.
Priority 6: Make it easier for consumers to make good food choices
Finally, consumers expressed frustration during interviews and focus groups about how difficult it can be to “get to the truth” when it comes to food choices. Three in five (61%) say that they often feel that foods labelled as ‘healthier options’ are unhealthy in other ways. Over a third would like more clarity on fat, salt and sugar content (38%), and simple, consistent health information labelling (37%). Many also expressed difficulties in understanding the long-term environmental impact of food and would again like to see clearer information to guide their choices.
Consumers want access to healthy, affordable food that is kinder to the planet
Figure 16: The top 10 food priorities for the public over the next three years

Respondents were asked the following question: “Thinking about the next three years, which of these issues, if any, do you see as important to you for the future of food?”
Source: Bright Harbour, Esposito Research & Strategy, And Good for FSA and FSS The UK Public’s Interests, Needs and Concerns Around Food.
Food price definitions
An item’s nominal price is the amount of money you spend to buy that item.
An item’s real price is the amount of money you spend to buy that item, adjusted for the fact that the prices of other goods and services change over time. Real prices help us to understand whether something is getting more or less expensive over time compared to other goods and services.
Our food system – like our culinary tastes – is resolutely global. Nearly half of what we eat comes into the UK from abroad, and two-thirds of that has in recent years come from the EU.
At a glance
In this chapter, we look at:
- how patterns of UK food imports have changed in recent years
- what we know about the safety standards of our food imports
- what impact our departure from the EU is likely to have on these standards in the future
Introduction
Our food system – like our culinary tastes – is resolutely global. Nearly half of what we eat comes into the UK from abroad, and two-thirds of that has in recent years come from the EU.
These long-standing trading patterns have brought huge diversity and choice to the nation’s diet, yet they also present ongoing challenges in terms of making sure the
food we import is safe and meets the standards we expect. As consumers grow more conscious of the broader environmental and ethical consequences of their food choices, the facts about where we source our food from and how we maintain standards are increasingly important for maintaining public confidence in our food.
This chapter looks at food standards related to food safety and official controls through the prism of our changing trading relationships with the world.
Current trends in food imports
According to official figures, in 2019 the food and agriculture industry contributed a total of £128.7 billion to the UK economy. For certain food types, domestic producers supply much of what we eat – we are more than 70% self-sufficient in beef, lamb, poultry, hen eggs and cereals, for example [14].
For other commodities, particularly fresh fruit, vegetables and sugar, the UK is more heavily reliant on imported goods. Here, the EU has remained the largest supplier in recent years, though we do source significant quantities of some products from further afield – as shown in figure 17.
Definition of terms
Food is generally split into two types for import control purposes:
- Products of Animal Origin (POAO). This includes meat, poultry, fish, shellfish, milk and milk products, eggs and egg products.
- Food Not of Animal Origin (FNAO) and Feed. FNAO includes fruit, vegetables, cereals and fungi, and has similar control arrangements to feed.
Most of the meat and eggs we consume are produced domestically
Figure 17: Percentage of total UK consumption of major POAO categories

A significant proportion of our fresh fruit and vegetables come from abroad
Figure 18: % of total UK consumption of major FNAO categories

*EU and rest of world data for potato imports is not separated.
The majority of our food imports currently come from EU countries
Figure 19: Percentage of total UK imports sourced from the EU and from other regions, 2017 to 21
| Commodity | EU percentage | Other large suppliers (more than 10%) |
|---|---|---|
| Pork | 99.9% | None |
| Eggs | 99.6% | None |
| Dairy | 96% | None |
| Beef | 91% | None |
| Other animal | 82% | None |
| Poultry | 75% | Asia (19%) |
| Composite (processed food) | 75% | None |
| FNAO | 65% | Latin America and Caribbean (11%) |
| Other POAO | 45% | Asia (43%) |
| Animal feed | 45% | Latin America and Caribbean (30%), North America (10%) |
| Fish | 35% | Asia (26%), Europe, Non-EU (23%) |
| Lamb | 20% | Oceania (77%) |
While there has been no immediate or wholesale shift in trading flows following the UK’s exit from the EU, there are tentative signs that the balance between EU and non-EU imports and home-grown produce is beginning to change. For example, the proportion of imported fish from the EU fell from 38% in 2019 to 29% in 2021. Lamb and pork imports have also fallen over the same period [15].
One of the reasons for this may be the introduction of EU import controls on British products from January 2021 – the higher costs and paperwork attached to exporting food may have led to more British produce being placed on the domestic market, thereby reducing the demand for imports [16].
There have also been some notable increases in imports from other countries over the past ten years. We compared imports of products from the five years from January 2012 to December 2016 (pre-referendum) with the five years post-referendum (2017- 2021), for the UK’s top 50 importers. Eight countries imported over 50% more food to the UK post-referendum than pre-referendum, as shown in figure 2017.
There was a particular increase in 2018 and 2019 in Canadian poultry and lamb, which has since decreased. Morocco was responsible for a large increase in the volumes of FNAO products imported into the UK. Across the six eastern European countries there were large increases in imports of FNAO products as well as fish, dairy and processed food products. This analysis is preliminary: changes in trading patterns can happen for numerous reasons unrelated to EU Exit, or it could be that changes occurred as part of industry contingency planning ahead of EU Exit. Overall, it is too soon to tell what the long-term impact of the UK’s departure will be on import flows.
Notable increases in imports from certain countries over the last decade
Figure 20: Largest % growth in import volumes from 2012-16 to 2017-21

How safe is imported food?
Around 40 million tonnes of food are imported into the country each year, and the UK has a series of controls in place to ensure these products meet the required safety standards.
All animal products are automatically considered “high-risk” and are subject to specific import controls and border checks (figure 21), except the EU where controls
are expected to be applied in 2023. Plant-based imports of food and feed are only considered high-risk if they come from certain countries where specific food or feed safety risks have been identified and need to be controlled.
The main types of import checks carried out on high-risk food and feed include:
- a mandatory documentary check – this typically involves the examination of the documents accompanying the consignment, such as an official certificate, analytical report or commercial documents and a comparison of those documents against what was expected [18].
- an identity check – this includes a visual inspection of the consignment to verify that it is what it should be. These checks are mandatory for imports of POAO and are conducted at a specified frequency for high-risk FNAO, which typically may vary between 5% and 50% of consignments. Where official documentation is presented, this will include checking and verifying the documents against the commodity itself
- physical checks – this involves a check on the goods themselves including, where appropriate, checks on packaging, the means of transport, labelling and temperature, the sampling for laboratory analysis, testing or diagnosis and any other checks necessary to verify compliance with safety controls. During some physical checks, a sample of food is taken and tested to look for the presence of contaminants, such as microbial pathogens, natural toxins and man-made chemicals, including pesticides and veterinary drug residues.
This report includes data from food import checks carried out by enforcement authorities in 2020 and 2021 [19]. In all, nearly 90,000 high-risk consignments were
processed in 2020, rising to over 123,000 in 2021. Compliance rates are set out in figure 21.
Imported food compliance levels have remained fairly stable
Figure 21: % of consignments failing import control checks in Great Britain, 2020 to 2021
Document checks
| Checks undertaken | 2020 | 2021 |
|---|---|---|
| Meat and other animal products (POAO) | 1% | 1% |
| Other high risks foods (HRFNAO) | 1% | 1% |
| All consignments | 1% | 1% |
Identity checks
| Checks undertaken | 2020 | 2021 |
|---|---|---|
| Meat and other animal products (POAO) | 1% | 1% |
| Other high risks foods (HRFNAO) | 5% | 2% |
| All consignments | 1% | 1% |
Physical checks
| Checks undertaken | 2020 | 2021 |
|---|---|---|
| Meat and other animal products (POAO) | 1% | Not applicable |
| Other high risks foods (HRFNAO) | 6% | 4% |
| All consignments | 2% | Not applicable |
Sampling checks
| Checks undertaken | 2020 | 2021 |
|---|---|---|
| Meat and other animal products (POAO) | 1% | 1% |
| Other high risks foods (HRFNAO) | 4% | 5% |
| All consignments | 3% | 3% |
Observation 1: Average failure rates for documentary checks remained stable throughout this period.
This covers a period in which the pandemic had disrupted global food supplies and led the EU to establish temporary measures allowing the import of high-risk food and feed without accompanying export health certification.
Observation 2: Three per cent of the samples taken were non‑compliant in both 2020 and 2021, with a higher failure rate among high-risk FNAO than POAO.
Sampling failure rates being higher for imported high-risk FNAO than for POAO is not unexpected. Import controls for HRFNAO allow commodities which we believe present a potential health concern to be temporarily controlled, allowing evidence to be gathered. It is therefore not surprising that sampling failure rates are higher for FNAO, which is only checked where there has previously been evidence of higher risk, compared with POAO, which is all subject to import controls. Most failures are associated with the detection of pesticide residues or aflatoxins [20].
Observation 3: The comparison of data for these periods suggests that safety standards of food exported to Great Britain have remained relatively static overall.
This was a challenging period for food producers with the pandemic putting considerable pressure on global food safety systems. Overall, it is reassuring to see the data remains broadly stable.
The impact of EU departure on import controls
The Protocol on Ireland/Northern Ireland took effect on 1 January 2021. This requires Northern Ireland to apply EU import requirements on any products entering the EU regulatory zone from outside the EU. Technical discussions continue between the EU and UK on the implementation of the Protocol in regard to products moving from Great Britain and Northern Ireland.
The UK’s departure from the EU has some important implications for how we uphold the quality and safety of food coming into the country. As a member state, import checks for food entering the UK from non-EU countries were carried out at the first point of entry into the EU, whereas now checks should be carried out at the point of entry into Great Britain (except for foods arriving from Northern Ireland).
While the UK applies safety controls to high-risk food and feed imported from non‑EU countries, as we did as part of the EU, the introduction of equivalent controls
for EU products is now unlikely to happen before the end of 2023. This means we are not receiving official assurance from the exporting country that those imports meet the UK’s high food and feed safety standards. The absence of border checks could affect how we identify and respond to safety risks in future, with additional resource required by the UK to maintain levels of food safety assurance for these imports.
Although the likelihood of food safety incidents being caused by EU imports has been low, member states are not immune from them and this risk could change.
The FSA and FSS believe the continued absence of a fully implemented UK import control regime for EU food and feed reduces our ability to prevent foods that do not meet the UK's high standards being placed on our market.
The introduction of new requirements for EU exporters to pre-notify all high-risk goods being brought into Great Britain will help mitigate some of these issues. The new requirement took effect in January 2022 and will help the FSA, FSS and local authorities to respond to food safety incidents by allowing products to be traced Our Food 2021: An annual review of food standards across the UK more quickly. Both organisations have also strengthened their capability and capacity to include surveillance which builds on proven mechanisms to allow them to better detect and respond to risks as they emerge, as we will describe further in the next chapter. However, the FSA and FSS do not believe that together these are a sufficient replacement for the introduction of robust import controls and remain concerned that the current system of import controls is weakened as a result.
The Rapid Alert System for Food and Feed (RASFF)
The RASFF is a notification system operated by the European Commission to exchange information on risks and hazards between member states. Enforcement authorities in EU member states issue Rapid Alert notifications when they detect serious food safety concerns with their own or other member states’ products.
These notifications alert member states to serious risks to health in real time and help facilitate an incident response, including by taking action. EU food law also requires member states to communicate and cooperate to resolve food incidents occurring between member states. The UK now has third country access to RASFF, which means we have a less detailed picture of food safety alerts across the EU single market.
Free trade agreements and food standards
As the previous chapter showed, consumer interests today go much deeper than safety standards – the public care deeply about wider issues such as nutrition, affordability, sustainability, environmental impacts and animal welfare.
There is concern across the UK, from consumers, industry, and other stakeholders, that new free trade agreements (FTAs) could affect standards in the UK over time, as reflected in the National Food Strategy in England, and the Scottish Government’s Vision for Trade.
As part of the scrutiny process for ratifying any future trade deal, the UK Government is obliged under the Agriculture Act 2020 to report to Parliament on whether provisions within the FTA maintain statutory protections for human, animal or plant life or health, animal welfare or the environment.
To inform these reports, the UK Government has asked for advice from the FSA, FSS and the newly formed Trade and Agriculture Commission, amongst others. The report assessing the Australian FTA was laid before the UK Parliament on 6 June 2022, and the New Zealand report is expected to be produced in summer 2022.
It should also be noted that the FTAs with Australia and with New Zealand re-affirm the UK’s rights and obligations to uphold international food standards under World Trade Organization rules. They also re-affirm the fundamental principle that imports will still have to comply with UK food safety rules.
In summary
- the UK has a long history of importing food from around the world – while there has been no major change in trading patterns since the UK’s EU Exit, there are small early signs of import trade patterns evolving
- although the global food system was disrupted by the pandemic, the level of compliance with import checks has remained broadly stable, suggesting that there has not been any significant fall in international food safety standards so far
- while import controls have been successfully put in place for high-risk goods from non-EU countries, the continued delay in establishing equivalent controls for EU products reduces our ability to prevent foods that do not meet the UK’s high standards being placed on our market
- new free trade agreements are being signed but at the time of writing have yet to be ratified and take effect. The FSA and FSS are contributing to official government assessments of whether there are sufficient safeguards in the agreements to maintain statutory protections for human, animal or plant health, animal welfare and the environment
Even with the most stringent checks in place, there are circumstances where the quality, safety and integrity of our food may be compromised. When this happens, it requires a rapid response to identify the problem and remove products from the market before they can cause harm.
At a glance
In this chapter we will look at:
- what we know about the scale and nature of food and feed incidents today
- how our food crime units are operating and what we can learn from the available data
- how we responding to emerging risks across our food supply chain
Introduction
Even with the most stringent checks in place, there are circumstances where the quality, safety and integrity of our food may be compromised. When this happens, it requires a rapid response to identify the problem and remove products from the market before they can cause harm.
The FSA’s Incidents and Resilience Unit in England and Consumer Protection Teams in Wales and Northern Ireland co-ordinate the response to food and feed incidents, and some aspects of foodborne illness outbreaks [21] – while the Scottish Food Crime and Incidents Unit (SFCIU) carries out a parallel role through its Incidents team.
The SFCIU also has responsibility for the investigation of serious food fraud and associated criminality across Scotland, while the National Food Crime Unit (NFCU) covers England, Wales and Northern Ireland [22]. Both units collaborate closely with local authorities and policing partners, which also have a role in food crime investigations.
As this chapter shows, this work goes to the heart of several key aspects of food standards, including food safety and hygiene, authenticity and labelling, composition standards and official controls. Local authorities may also lead on food crime investigations.
Food and feed incidents
A food incident occurs when a concern is raised about the safety, quality or integrity of food, which may require action to protect consumers [23]. Notifications of food incidents can come from many sources, including local authorities, port health authorities, government organisations, the food industry, other countries, and
consumers themselves.
The number of notified food incidents rose for several years after 2010 as a result of new regulations and advances in technology, science and analytical methods, which led to better detection and reporting [24]. The key observations from the 2019 to 2021 data are included in the next section.
Observation 1: Food incident rates appear to be returning to expected levels based on previous recorded rates, after falling during the pandemic.

Source: FSA/FSS incident management databases
Recent data shows there was a fairly sharp downturn in the number of food incident notifications received by the UK during the height of the pandemic in early 2020, with reported cases falling by 13% in 2020 compared to 2019. This was the result of a number of factors including changes in consumer behaviour, the streamlining of food production lines, fewer food businesses operating, and a reduction in the complexity of the product ranges on offer. The number of reported incidents increased steadily throughout 2021, though remained lower than in 2019.
Observation 2: Contamination by harmful micro-organisms was the most frequently reported hazard.

Source: FSA/FSS incident management databases
Salmonella accounted for the majority of microbiological incidents reported over the last three years. Recent rises can partly be attributed to increased regulatory food surveillance following a series of related foodborne outbreaks in 2020 and 2021, which are covered in this chapter. They also reflect longer-term increases in outbreak notifications resulting from the introduction of WGS, which allows cases of infection to be more definitively linked to a food origin [25].
Observation 3: Chemical contamination was the second most common category reported last year

Source: FSA/FSS incident management databases
A proportion of the contaminant incidents related to widespread EU and UK reporting of non-permitted presence of ethylene oxide in imported sesame seeds and products containing contaminated sesame seeds during 2020 and 2021. These resulted in the withdrawals of affected product across the UK market and should be seen as a reassuring sign that the reporting system was working effectively during the pandemic [26].
Observation 4: Incidents relating to undeclared or incorrectly declared allergens have fallen but remain a major area of concern.
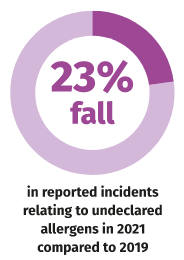
Source: FSA/FSS incident management databases
There were 272 allergen-related cases in 2021, down by nearly a quarter from 355 in 2019. The fall may be the result of heightened media reporting of allergens in food, and the impact of recent changes to labelling laws. The FSA and FSS have also increased their awareness raising campaigns aimed at the public and food businesses in recent years – as have a number of charities.
Observation 5: There have been substantial rises in incidents related to poultry meat during 2020 and 2021.

Source: FSA/FSS Incident management databases
Historically, recorded food incident rates have always tended to be highest in meat and meat products – partly due to the range and frequency of checks that need to be undertaken on these foods. However, between 2019 and 2021 it is notable that there was a nearly three-fold increase in poultry‑related incidents following a series of Salmonella outbreaks and associated increases in surveillance activity (see below).
It is important to note that a large volume of foodborne disease cases go unreported. For instance, in the case of Campylobacter, surveillance bodies report approximately 60,000-70,000 confirmed laboratory reports per year. However, research estimates that the true number of Campylobacter cases attributable to food is nearer 300,000. Very few of these cases are attributable to outbreaks as they are sporadic and often occur in the home. The FSA and FSS received a single notification for Campylobacter during 2021. In the future, enhanced genomic surveillance for such pathogens, for instance through the PATH-SAFE programme (covered later in this chapter), may provide more accurate methods for identifying the source of more of these cases.
Salmonella in breaded chicken
The rise in poultry-related incidents was largely driven by a series of foodborne outbreaks involving Salmonella in breaded chicken products from Poland in 2020 and 2021, which affected more than a thousand people and a number of products and brands [27]. In response, the UK Health Security Agency (then PHE) launched a major survey in 2020 to evaluate the scale of the contamination. This was followed by a broader FSA survey which looked for additional pathogens and evidence of antimicrobial resistance. Enhanced control measures have since been implemented by Polish authorities to ensure the safety of poultry imported into the UK.
Observation 6: Dietic foods, food supplements and fortified foods experienced a 49% rise from 2019 in incidents during 2021.

Source: FSA/FSS incident management databases
We believe these increases are due to a significant rise in the consumption of food supplements in recent years – especially in the sports nutrition, probiotic and herbal or traditional categories. The FSA and FSS will monitor incidents relating to these products in line with market changes.
Allergy alerts, product recall notices and food alerts for action
Once a food incident has been identified, a food product may have to be withdrawn or recalled [28]. These actions are industry-led and carried out in close liaison with the FSA and FSS. This partnership approach is usually key to the successful management of an incident. The FSA and FSS will then often issue alerts to let consumers and food businesses know about the issue and trigger certain actions they need to take.
Definition of terms
- an Allergy Alert is issued when the product has been, or is being, recalled from consumers because allergen information on food labels is either undeclared (including not in English) or incorrect
- a Product Recall Information Notice is issued when there are concerns about the safety of a product, most often due to the contamination, mis-packing or mis-labelling of products
- a Food Alert For Action (FAFA) is issued to local authorities and consumers when distribution of products is less well defined or when a food business is not taking the required steps to remove product from sale and remedial intervention action from local authorities is required
The number of allergy alerts increased when new legislation requiring better labelling of allergenic ingredients was introduced in 2017.

Source: FSA/FSS Incident Management Systems
Milk is consistently the most common food for which an allergy alert was issued, followed by cereals containing gluten and nuts or peanuts. This is a longstanding pattern and reflects the fact that these ingredients are widely used in all types of food product. However, across these categories, the number of reported incidents decreased from 2019 to 2021 – potentially a sign that general awareness of the risks is increasing and that industry practices are improving.
However, across these categories, the number of reported incidents decreased from 2019 to 2021 – potentially a sign that general awareness of the risks is increasing and that industry practices are improving.
Allergen related food incidents have fallen in recent years
To note, allergy alerts may include one or more of the allergens listed in the table below.

Source: FSA/FSS Incident Management Systems
Meanwhile, the number of product recall notices has remained stable over the last three years with a total of 181 notices issued. Only four FAFA notices were issued over the same period.

Source: FSA/FSS Incident Management Systems
Post-EU developments in food surveillance
As we saw in the previous chapter, the UK’s departure from the EU means that it no longer has full access to the rapid alert system run by the European Commission. Before leaving, the UK largely communicated with other countries on food safety issues through the RASFF. The UK now has third country access to this system, which means the FSA and FSS continue to receive relevant notifications affecting the UK.
We have since taken several additional steps to strengthen the way we identify and respond to food risks:
Step 1: Building new international partnerships
The UK uses the International Food Safety Authorities Network (INFOSAN) to communicate with other countries on food safety issues. This has already helped the UK work with the international community in response to a number of major incidents. FSS and the FSA are also key members of the INFOSAN working group.
Step 2: Enhancing global food safety monitoring
A new monitoring team in the FSA uses intelligence from international food alerts, trusted media sources, website searches, and stakeholder engagement to proactively identify potential food risks. This information is shared with FSS where it is relevant to Scotland. These new methods have helped to identify 24 incidents last year, while a further 109 products were referred to other UK authorities for further investigation [29].
Step 3: Improving prevention and risk management
FSS and the FSA also continue to work with food businesses, enforcement authorities and consumer interest groups to improve food safety withdrawals and recall processes. In particular, we are increasing our focus on incident prevention by encouraging local authorities and FBOs to use “root cause analysis” to help them understand what factors cause food incidents to happen and how to prevent them in future.
Step 4: Using next generation science
With advances in WGS and other genetic analysis led by the UK Health Security Agency, the FSA and FSS can now draw upon increasingly sophisticated ways of identifying and understanding foodborne illnesses. This is helping us to identify where cases are linked or probably linked to the same food source and take appropriate action. During 2021, these new systems successfully identified several important food safety issues which are now the subject of incident investigations [30].
The PATH-SAFE project
In 2021, the FSA, FSS, the Department for Environment, Food and Rural Affairs (Defra), the Department of Health and Social Care (DHSC), the UK Health Security Agency (then Public Health England), and the Environment Agency were awarded funding for a major programme of pathogen surveillance. The programme began in late 2021 and will run to March 2024. The PATH-SAFE project is designed to help safeguard UK food, agriculture and consumers by using cutting-edge technology to understand how pathogens and antimicrobial resistance spread. Tracking the
source of these issues will help to develop better control strategies to reduce illness and deaths.
Tackling food crime
Food crime is defined as serious fraud and related criminality within food supply chains, though it also encompasses drink and animal feed31. The UK’s food crime units, the National Food Crime Unit (NFCU), and the Scottish Food Crime and Incidents Unit (SFCIU) are responsible for holding food crime offenders to account and helping businesses and consumers to protect themselves.
The amount of information received by the two units gives a sense of the scale and nature of food crime in the UK, though it does not necessarily show whether the overall rate of crime is increasing or falling – partly because consumers or food businesses are often unaware that they have been a victim. A number of observations can be drawn from the available evidence.
Observation 1: the focus of the food crime intelligence reports received aligns closely with the crime units' strategic priorities.
The 2021 figures show that the majority of food crime intelligence received was related to the respective priorities of the units, as set out below. Of the 1,747 food crime intelligence reports (defined as pieces of information relating to a new or already identified food crime) received during 2021, more than two-thirds (69%) related to these strategic priorities.
NFCU control strategic priorities 2021 to 2022
- dangerous non-foods
- red meat
- illicit and counterfeit alcohol
- shellfish
- animal by-products
- illicit supply to meet community demand
- European Distribution Fraud
- e-commerce
- food service
| SFCIU control strategy priorities 2021 to 2022 | SFCIU key thematics 2021 to 2022 |
|---|---|
| Fish | Serious organised crime overlaps |
| Red meat | Misrepresentation of premium status |
| Alcohol | E-commerce |
| Wild Shellfish |
High-risk supply chains Fraud around allergens or plant-based products EU Exit COVID-19 |
Observation 2: 21 live investigations were underway across the two UK food crime units at the end of 2021.
In Scotland, SFCIU investigations have spanned issues involving counterfeit alcohol and the misrepresentation of beef and other foodstuffs as well as a serious animal welfare case. Five cases have been referred to the Crown Office and Procurator Fiscal Service, with three of these being considered under petition procedure reserved for the most serious offences.
In England, Wales and Northern Ireland, the NFCU investigated a variety of issues including the illegal diversion of waste product from meat production into the human food chain, the false declaration of ingredients used in food manufacture, and the illegal sale of the toxic chemical 2,4 dinitrophenol (DNP), which is sometimes dangerously promoted as a weight loss aid.
Last year also saw the first prosecution stemming from an investigation by the National Food Crime Unit. The conviction related to the sale of 2,4 dinitrophenol (DNP) alongside other offences linked to controlled drugs and prescription-only medicines. A defendant was jailed for over two years after pleading guilty to the offences.
Observation 3: a total of 100 'disruptions' were carried out by UK food crime units during 2021.
Prosecutions are not the only way to fight food crime. The units also focus on a range of measures that obstruct or prevent criminal behaviour in the first place, and support consumers and businesses by providing practical guidance on what they can do to protect themselves, including through the new Food Fraud Resilience Tool.
The NFCU describes any work it does which has a clear impact on a food crime threat as a 'disruption' and reports it to the National Crime Agency (NCA). During 2021 the NFCU recorded 60 such disruptions, including:
- the indefinite suspension of a person’s approval to handle animal by-products (ABP) following the identification of ABP being diverted into the human food chain
- the takedown of 34 websites or marketplace listings selling 2,4-Dinitrophenol (DNP) for human consumption
- working with partners to bring about the seizure and destruction of a large quantity of fish unfit for human consumption at a fish market in October 2021.
The SFCIU contributed to 40 actions which have helped to detect, disrupt, or deter criminal activity. These are helping to counter low-level food crime activity as well as contributing to investigations of more serious offences, and include:
- an investigation into the sale and distribution of suspected counterfeit confectionery across the UK
- work with local authorities on numerous occasions to establish the veracity of intelligence and take enforcement action where appropriate.
Looking to the future
Changes in the pattern of food crime tend to echo developments in how the food supply system is organised and what we as consumers prioritise.
During the pandemic, some foods and supplements made improper claims related to COVID-19, though offences were small-scale and largely investigated by local authorities and other partners.
Overall, there was no discernible increase in food crime as a result of the pandemic. Equally, there is little evidence that criminals have been exploiting our departure from the EU, though both food crime units remain vigilant.
Looking ahead, the two food crime units are now building stronger relationships with online food retail platforms, food producers, and other stakeholders to pre-empt any possible increases in fraud or other illegal practices over the coming years.
Through the Global Alliance on Food Crime, they are also taking a prominent role in international initiatives to tackle food crime, including active involvement in Operation OPSON, which targets counterfeit and substandard food and drink globally. Finally, in Scotland, the SFCIU is working with multiple agencies to address specific criminal activities involving livestock, with investigations underway into suspected ear tag fraud, illegal use of cattle passports and animal welfare concerns.
In summary
- our international collaboration and surveillance and response systems have changed as a result of our departure from the EU. There is no evidence to suggest that criminal activity in food supply chains has increased. Both food crime units will continue to monitor emerging threats closely
- reported cases of food incidents and intelligence received around food crime remain relatively stable – there was a fall in certain types of food incidents reported during the peak of the pandemic, but levels are now returning to pre-COVID-19 levels
Every day, consumers are met with an abundance of information about the food they eat, whether on labels and packaging, websites, or other marketing and advertising materials.
At a glance:
In this chapter we look at:
- how food information regulations are evolving in the wake of the UK’s EU departure
- what impact these developments are having on the public and the food industry
- what factors may influence food information standards in the future
Introduction
Every day, consumers are met with an abundance of information about the food they eat, whether on labels and packaging, websites, or other marketing and advertising materials.
Much of this is designed to help us make objective and informed decisions about our food choices – and for some people this can have significant health implications, particularly for those who have food allergies or a diet affected by long-term conditions that affect their dietary needs.
Yet the clarity and accuracy of this information may conflict with how a product is actually being marketed or labelled. When this happens, food information standards are there to ensure food companies are truthful and transparent in what they say, and that consumers get the clear, accurate information they need.
This chapter explores the implications in this area now the UK has left the EU. Many of the rules governing food labelling and information in this country have their basis in European food law. Now that much of the UK falls outside this jurisdiction, we look at the steps that have been taken to maintain stability and continuity for businesses and what the future may hold.
We also look at how the standards for food labelling and information have developed in recent years, charting the impact of key changes such as improved allergen
information, front-of-pack nutrition labelling and calorie labelling on menus in restaurants and other out-of-home food establishments.
Finally, we show the results from a basket of foods survey, which sampled the safety and composition of a selection of items on sale in England and Wales, and the results of the FSS annual food sampling programme.
What information must be on a food label?
Food labelling must, by law, convey a number of important pieces of information.
The table below sets out the most common requirements for most packaged foods – there are some important exceptions which are explained more fully in the official guidance for businesses.
1. Name and description: All packaged food must accurately describe what the food is. Some food names must meet specific compositional standards which protect consumers by preventing ingredients being substituted by poorer quality alternatives. For example, a beef burger must contain at least 62%
beef in order to be described as such [32].
2. Ingredients list: The list of ingredients is the main place on the label where detailed information about what is in the food is found. Subject to exemptions, any food with two or more ingredients must list them all in descending order of weight. The list must clearly emphasise any of 14 main allergens contained in the product. If there are no specific compositional standards the quantity (for example a percentage) of certain ingredients must be given. The information must
be in the name or the list of ingredients to let consumers know how much they are getting. It applies in certain circumstances including when an ingredient is emphasised in words or pictures on the label, or to ingredients that the consumer associates with the food such as the cheese in a margherita pizza.
This label shows the name of the food along with an ingredients list which emphasises the allergens.
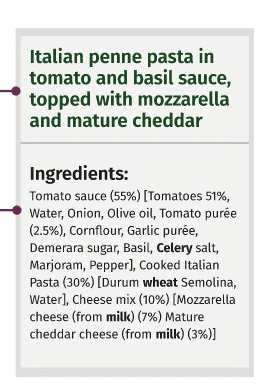
3. Nutritional information: Packaged food must state the amount of energy, total fat, saturated fat, carbohydrates, sugar, protein and salt in a typical portion.
A voluntary front-of-pack nutrition labelling scheme used by many food manufacturers also helps consumers to compare the calorie, fat, sugar and salt content of food products at a glance.
This is an example of a nutrition label, often referred to as mandatory back-of-pack nutrition information.
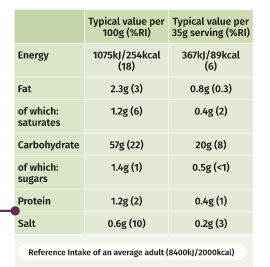
This is an example of a voluntary front-of-pack nutrition label. This is based on repeating some elements of the mandatory back-of-pack nutrition declaration to give consumers an at-a-glance indication of the energy and nutrient content.
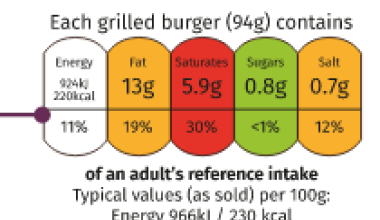
4. Best before or use by date: Packaged food should include either a best before or use by date. Use by dates are on food that goes off quickly, such as meat products or ready-to-eat salads – it tells the consumer when the food will no longer be safe to eat. The best before date, sometimes shown as BBE (best before end), is about quality not safety. The food will be safe to eat after this date but may not be at its best quality. Both dates are only accurate if the storage information on the label is properly followed.
5. Warnings: Food containing certain additives or other ingredients must also contain relevant warnings – for example, any beverage not based on tea or coffee that contains caffeine above a certain amount must state, ‘Not suitable for children, pregnant women and persons sensitive to caffeine'.
6. Place of Origin: Some foods should also contain information about where the food is from (its place of origin). For certain foods, such as prepacked fresh and
frozen pork, poultry and fish, origin information is always needed. In the case of processed food, origin information is needed if the labelling suggests it may come
from a certain country or place when this is not the case. If origin information is given, the labelling needs to show where the key ingredients come from or if they
are different from the origin of the food as whole.
Example of a label which may give the impression that the food is from Greece.

Example of a label which shows a food made with an ingredient from another country.
Departmental responsibilities and enforcement
Responsibility for the policy on food labelling and composition standards sits with different departments across the UK.
In England, Defra has the responsibility for general food labelling and composition standards, with the FSA having responsibility for food safety labelling and the DHSC leading on nutrition labelling.
In Scotland, FSS has responsibility for general food labelling, including food safety labelling, compositional standards, and nutrition labelling.
In Wales, the FSA has responsibility for general and food safety labelling, with the Welsh Government having responsibility for nutrition labelling.
In Northern Ireland, the FSA has responsibility for all these areas.
Enforcement of these requirements is carried out by local authorities, and this may be the responsibility of environmental health or trading standards departments
depending on location in the UK.
The impact of our departure from the EU
EU Exit
While the majority of the food labelling and information laws originating from the EU have been retained, there are some changes affecting trade between Great Britain and the EU, and British businesses sending food to Northern Ireland. The FSA, FSS and government departments, including Defra and the Department of Agriculture, Environment and Rural Affairs (DAERA) in Northern Ireland have helped industry with these changes.
The UK’s departure from the EU marks a significant turning point for food information laws, which have historically been heavily influenced by European regulations. From now, decisions on how to regulate and manage labelling and food information standards will be taken in Great Britain.
From a consumer’s point of view, this has had very little noticeable impact to date – the immediate focus has been on maintaining continuity with existing EU laws to minimise any disruption to supply. However, some important foundations for a post- EU approach to food information standards have been put in place:
Updating the law
Existing EU laws that govern food labels have now been converted into British laws, with corresponding changes to the domestic regulations in England, Scotland and Wales to allow enforcement authorities to continue enforcing these laws.
Removing the mutual recognition of food composition standards
“mutual recognition” arrangements for products containing meat, spreadable fats and wheat flour produced in the EU, Iceland, Norway and Turkey have been removed in Great Britain. Products such as lemon curd, mincemeat, sausage, and unfortified margarine and wheat flour had previously been allowed for sale in the UK even if they did not meet UK compositional standards, provided they had been sold legally in their country of origin. From 1 October 2022, this will no longer be the case. This means, for example, imported flour must now be fortified with calcium, iron, thiamin and niacin to the level required for British milled flour.
Changes to address and country of origin labelling
The UK's EU departure will also mean changes to address labelling and country of origin labelling for businesses trading in Great Britain. Businesses have been given until the end of September 2022 to make necessary changes. From 1 October 2022, those businesses not established in Great Britain will need to either use importers or set up legal entities in this country.
New powers to assess and authorise nutrition and health claims
Great Britain now has responsibility for assessing and authorising the nutrition and health claims made by products. A new UK Nutrition and Health Claims Committee (UKNHCC) has been established to provide expert advice and scrutiny to support these decisions.
Other key developments in food information standards
Information on food labels should help us make safe and informed choices about what we eat, and is particularly important in helping people with food allergies and hypersensitivities to stay safe.
While it seems unlikely that the measures above have had any short-term impact on food information standards, some of the following major policy changes – and
several more pending – will have a significant impact on the way consumers are given information about what they eat.
Changes to labelling laws for prepacked foods for direct sale
New regulations to amend the Food Information Regulations 2014 (and equivalents in Northern Ireland, Scotland and Wales)33, also known as ‘Natasha’s Law’, were introduced across the UK from 1 October 2021. All food sold prepacked for direct sale (PPDS) must now be labelled with the name of the food and a list of all ingredients, with any of the 14 major allergens emphasised within that list. The requirements cover all foods that are packed on the same premises from which they are sold.
The change was inspired by a campaign led by the family of Natasha Ednan‑Laperouse, who suffered a fatal allergic reaction to a shop-bought baguette containing sesame.
Example of a label used for food sold prepacked for direct sale.
Mandatory calorie information for eating out in England
In April 2022, new regulations came into effect in England requiring calorie information to be provided for food sold outside the home by restaurant chains and other large businesses of over 250 employees. The measure forms part of the UK Government’s Obesity Strategy and is intended to help consumers make healthier decisions as well as encouraging businesses to reformulate and offer lower calorie options. Local authorities in England have enforcement responsibility for the Calorie Labelling (Out of Home Sector) (England) Regulations 2021. These regulations were introduced on 1 April 2022 and their effectiveness will be reviewed by April 2026.
Under the Healthy Weight: Healthy Wales delivery plan 2021 to 2022, the Welsh Government will consult on mandatory calorie labelling for food purchased and eaten outside the home in 2022. The Scottish Government’s Out of Home action plan also committed to consult on detailed proposals for mandatory calorie labelling of food and soft drinks sold out of home. This consultation was published on 8 April 2022.
Reducing food waste
In 2019, the FSA, FSS and government departments worked with waste reduction organisations to produce official guidance to help businesses apply the appropriate date marks on their products.
This encourages businesses to consider their food production methods and whether best before dates would be appropriate, particularly if the food will not actually become unsafe for human consumption. Unlike products with a use by date, which concerns food safety, food beyond its best before date does not automatically need to be thrown away. In general, the more businesses are able to apply best before dates to their products, the longer consumers have to make use of them – which, in turn will help reduce food waste.
Improving precautionary allergen information
Work is also underway to improve the way food businesses communicate the risk of allergen cross-contamination of food products. This is where traces of allergens may be found in certain products as a result of the way the food or its ingredients are manufactured or prepared. From December 2021 to March 2022, the FSA consulted on how to develop better precautionary allergen information standards to signpost these risks.
Public confidence in food information
What impact is all of this having on the public’s perspective on food information standards?
Latest figures from the FSA’s Food and You 2 survey found that over eight in ten people (83%) are confident that the information on food labels is accurate. For those who shop for someone with a food allergy or intolerance, the same proportion (83%) felt confident in the allergen information provided on food labels.
People had the highest confidence in being able to identify allergens in food when shopping at a supermarket (71% in store and 69% online), or at independent food shops (67%). Respondents were less confident when buying from markets or stalls (57%).
In Scotland, figures from FSS’s Food in Scotland survey show a similar picture, with 70% of people saying they trust the information on food labels. Among those with food allergies, almost three-quarters (72%) found it very easy or quite easy to find allergen information when buying food in supermarkets.
There are also some broader areas of public concern. The FSA and FSS’s UK Public’s Interests, Needs and Concerns Around Food research shows that around six in ten of us believe that foods labelled as “healthier options” are unhealthy in other ways.
Compliance with food information standards
Both the FSA and FSS undertake regular sampling activity to check whether products available in shops around the country meet a range of safety, authenticity and food information requirements. The most recent sampling activity provides an important snapshot of how well food businesses upheld standards during the pandemic.
Baskets of foods survey
In 2020, early in the COVID-19 pandemic, the FSA launched a survey to check the safety and composition of food on the market in England and Wales. This was followed in 2021 with similar testing in a 'basket of foods’ survey. Its aim was to take a snapshot of compliance to food safety and standards, including the presence of allergens and contaminants, as well as consumer information relating to authenticity and labelling.
The commodities and tests were determined by a cross-government sampling group consisting of the FSA, FSS and Defra. Products were chosen because of prior
authenticity issues (such as basmati rice, herbs and spices), and supplemented with some commonly consumed foods (such as bread and milk). It was not a random sample of all available products. Moreover, the majority of samples were taken from smaller food businesses across the country (including retail outlets and online), which undertake less routine sampling than large food businesses. Figure 30 shows where samples were collected. Sampling and testing were carried out by Public Analyst Official Laboratories, which are responsible for undertaking enforcement testing of food and feed.
Figure 31 shows the types of testing conducted for each product or commodity group, the number of samples tested, and the percentage of unsatisfactory results. Overall, the results of the survey showed that 89% of products tested were compliant with respect to the specific standards we tested (figure 32). The majority of non-compliances found were for labelling and composition.
Figure 30: Location of samples taken as part of the basket of foods survey and the result

The FSA's sampling activity showed high levels of compliance in most categories - with some notable exceptions
Figure 31: The FSA's basket of foods survey: results by food category
The number of samples taken within each food category is shown, with the number of non-compliant samples given in brackets.
| Commodity | Labelling | Authenticity | Allergen | Composition | Containment | Adulteration |
|---|---|---|---|---|---|---|
| Basmati rice | - | 18 (3) | - | - | - | - |
| Bread | 26 (2) | - | 26 (6) | - | - | - |
| Cheese | 29 (0) | 29 (0) | - | - | - | - |
| Dairy free from | 29 (1) | - | 29 (1) | - | - | - |
| Gluten free from | 30 (4) | - | 30 (0) | - | - | - |
| Milk | 31 (0) | - | - | 31 (6) | - | - |
| Olive oil | 29 (1) | 29 (0) | - | 29 (1) | - | - |
| Orange juice | 30 (2) | - | - | 30 (0) | - | - |
| Oregano | - | 30 (1) | - | 30 (4) | 30 (0) | 30 (0) |
| Pasta | - | - | - | - | - | 30 (0) |
| Peanut free from | 30 (4) | - | 30 (0) | - | - | - |
| Turmeric | - | 30 (0) | - | - | 30 (2) | 30 (0) |
| Vegan products | 24 (3) | - | 24 (0) | - | - | - |
| Total percentage of non-compliance (by issue) | 7 | 3 | 5 | 9 | 3 | 0 |
Figure 32: Overall percentage of samples deemed satisfactory, with type and proportion of non-compliance by food category
Percentages might not add up to 100% due to rounding.

Notable concerns included the presence of allergens in seven samples that were not declared on the label, with all but one of these in bread. This represents 5% of the samples tested for non-declared allergens and these were reported as incidents by the FSA. Authenticity breaches were reported in one sample of oregano (adulterated with olive leaf) and three of basmati rice (adulterated with non-basmati rice). These samples represented 3% of the total number of samples tested for authenticity.
There were also cases where composition was not consistent with legal requirements. The fat content of 19% of the milks tested was not consistent with the label, with values both above and below those declared and all outside of permitted limits (with deviation ranging from 2 to 17% of the permitted limits).
For many other products (such as some vegan and 'free from' products), unsatisfactory results related to technical aspects of labelling and did not represent a specific public health issue – for example, issues with the readability of the font type used to provide allergen information and precautionary cross-contamination statements for consumers.
Overall, this survey provides reasonable products, especially given that sampling was targeted at high-risk areas. A small number of safety issues were identified (less than 3% of total samples tested), reinforcing the need for a regular sampling programme and enforcement, especially for allergens. However, a considerable number of products tested did not meet required standards in at least one area, especially regarding labelling and provision of consumer information, emphasising the need for further guidance to industry and ongoing monitoring.
While this was not a representative survey, it highlights the need for ongoing surveillance and the FSA is planning further sampling in 2022-23. Meat and meat product sampling will be covered in next years' report.
FSS annual targeted food sampling programme
FSS also undertakes an annual targeted food sampling programme. Sampling priorities selected each year are informed by intelligence and trends gathered from the Scottish Food Sampling Database (SFSD), horizon-scanning activities, issues identified by local authorities and through liaison with others (including the FSA). The programme covers both food safety and food standards issues, the latter including authenticity and allergen testing, as well as labelling analysis.
Data presented in this chapter focuses only on food standards issues and excludes any of the food safety data obtained in this reporting period. Results from targeted sampling undertaken in 2021 show generally high levels of compliance, with 90.2% of samples returning satisfactory results (figure 33). The majority of tested commodities had a low number of unsatisfactory results, which provides a reasonable degree of confidence that sampled products are meeting the required food standards.
However, the highest failure rate found in pre-packed beef mince (25%), where declared fat in the final product was higher than that stated on the label, is concerning. While this does not present a food safety issue, consumers need to have confidence in the accuracy of labelling information, which underlines the need for appropriate investment in ongoing sampling and monitoring, and, where necessary, enforcement action. Any identified non compliances will inform FSS’s future sampling priorities.
Figure 33: Overall percentages of samples assessed as satisfactory or unsatisfactory in FSS's sampling activity (2021)

Looking to the future
To stay relevant and effective, our food information standards must keep pace with the needs of the consumer and the key developments taking place across our food system.
Technology is a particularly important catalyst. With more people purchasing food online, both the FSA and FSS are exploring how they can work with businesses to ensure the consistency and quality of information available to the consumer, whether buying in-store or on a website, is maintained.
At the same time, the increasing number of food businesses trading via social media or other online marketplaces is making it harder to monitor compliance within food information laws in a consistent way.
Other pressures on food information standards are external. Major disruption to supply chains – as seen recently as a result of the war in Ukraine – is likely to increase the risk of misleading labelling, especially if ingredients or products are changed at short notice. The FSA and FSS work closely with the food industry and enforcement officers in these cases to ensure consumers are kept informed.
And finally, any future decisions on food information standards in Great Britain must continue to pay close attention to changes in EU law in light of the Protocol on Ireland/Northern Ireland.
In summary
- this has been a period of consolidation following the UK’s departure from the EU. There has been extensive legislation put in place and detailed work done with the food industry to maintain business continuity and market access, though much of this will not have had any noticeable impact on the consumer to date
- the UK’s food labelling laws have developed in recent years. The introduction of new rules on allergen labelling and mandatory calorie menu information laws are expected to improve the quality of information available to consumers. We will monitor the effectiveness of the changes, taking account of feedback from consumers, businesses and enforcers. A review of changes to the labelling of prepacked foods for direct sale will take place in 2022.
- post-EU Exit systems and structures for overseeing food information standards have also been established, in particular the creation of the new UK Nutrition and Health Claims Committee to assess proposed nutrition and health claims
Whether in a shop, canteen or restaurant, the safety of what we consume is upheld by a range of standards designed to ensure our food and animal feed is produced, manufactured, stored, and prepared in a safe and hygienic way.
At a glance:
In this chapter, we look at:
- the current level of legal compliance with hygiene standards across food and feed businesses, including the results of the latest food hygiene rating schemes
- the scale of the disruption and challenges to food hygiene controls caused by the pandemic and its potential implications for food hygiene standards
- other key challenges facing the hygiene inspection system, including workforce recruitment and retention, and the growth of online food sales
Introduction
Whether in a shop, canteen or restaurant, the safety of what we consume is upheld by a range of standards designed to ensure our food and animal feed is produced, manufactured, stored, and prepared in a safe and hygienic way. Strict requirements apply to a wide range of businesses, including food shops, restaurants, takeaways, caterers, meat, fish, shellfish and dairy producers, and animal feed manufacturers. They are regularly checked to assess compliance.
Animal feed businesses are also subject to stringent controls and inspections, many of which can trace their beginnings from the Bovine Spongiform Encephalopathy (BSE) crisis of the 1980s. As well as stopping people and farm animals from becoming ill, upholding these hygiene standards is key to maintaining the UK’s reputation as a trusted exporter of safe food and feed products.
There are a number of key elements that contribute to maintaining high standards of food and feed hygiene:
- clear legislation and guidance for food and feed businesses
- a proportionate and consistent risk-based approach to local authority interventions, to ensure that food business operators (FBOs) are complying with food and feed law
- taking appropriate action to control outbreaks of food and feed related infectious diseases
- taking appropriate action where non-compliance is found
- a well-resourced, trained and competent workforce to monitor and enforce business compliance
This chapter explores what the available data tells us about hygiene standards and highlights the particular challenges faced by those responsible for upholding them.
Figure 34: The annual economic cost of some well-known foodborne illnesses [34]
- Norovirus: commonly transmitted via shellfish, oysters, lettuce, fresh and frozen berries, £1,680 million
- Campylobacter: commonly transmitted via chicken, pigs and dairy products, £710 million
- Salmonella: commonly transmitted via eggs or egg products, red meat and poultry, £210 million
- Escherichia coli (VTEC O157): commonly transmitted via beef and dairy products, £4 million
The role of businesses
Hygiene in food establishments
Local authorities across the UK carry out a wide range of checks and interventions at food establishments to ensure a high level of food hygiene is maintained and that businesses are compliant with all relevant food laws [35]. These are carried out by food safety officers, such as environmental health officers.
The compliance data collected during the pandemic was affected by a fall in the overall number of inspections, which we describe later in this chapter. There are also some differences in how compliance is measured across the home nations. However, based on available data more than 95% of establishments in England, Wales and Northern Ireland were found to be compliant or better. In Scotland, more than 96% of establishments were deemed to have satisfactory compliance or better under the new Food Law Rating System [36].
Figure 35: The latest reported rates of compliance for UK food business operators
Percentage point change compared to the previous year is included in brackets.

Source: Local Enforcement Monitoring System (LAEMS), Scottish National Database (SND). Figures cover the latest available data, which covers 2019-20 for England, Wales and Northern Ireland, and 2020-21 for Scotland.
Similarly, the Food Hygiene Rating Scheme (FHRS) in England, Wales and Northern Ireland and the Food Hygiene Information Scheme (FHIS) in Scotland shows that the vast majority of restaurants and other places serving food received generally satisfactory or better ratings [37].
Figure 36: Percentage of UK food businesses achieving satisfactory or better ratings for food hygiene, as of 31 December 2021
Percentage point change compared to the previous year is included in the brackets

Figures include all businesses achieving a generally satisfactory rating of three or more as part of the FHRS for England, Wales and Northern Ireland, and a pass rating within the FHIS for Scotland.
Hygiene in approved meat establishments
Approved meat establishments include slaughterhouses, game handling establishments, cutting plants and wholesale meat markets, and are subject to a specific set of controls to ensure they meet food safety and hygiene standards. Many of the controls for these establishments are delivered by FSA and FSS officials. Food business audits are undertaken regularly at these establishments to verify compliance [38].
While there are differences in the way audits are carried out in Scotland compared to the rest of the UK (see chapter explanatory notes) that are reflected in the available figures, they again indicate the majority of meat establishments are compliant with hygiene standards, with figures in England, Wales, Northern Ireland and Scotland remaining broadly consistent with previous years [39].
Figure 37: Percentage of meat establishments rated as good or satisfactory for hygiene in 2020 to 2021
Percentage point change compared to the previous year is included in brackets.

Source: Meat establishment audit data
Hygiene compliance in milk production
Responsibility for the inspection of dairy establishments varies across the UK, but in all cases the aim is to ensure hygiene standards are maintained across registered farms and dairy producers [40]. Again, the pandemic had a significant operational impact, which is discussed further in the explanatory notes section [41].
In respect of dairy establishments, the most recent rating data available indicates compliance rates of 80.6% in England and Wales, and 99.2% in Northern Ireland [42]. The distribution of dairy establishment types differs between England, Wales and Northern Ireland, which can impact on compliance levels.
FSS has no direct enforcement role for dairy hygiene in Scotland, which is instead the responsibility of Scottish local authorities. Compliance has been measured by looking at what percentage of businesses were issued written or verbal advice. The absence of the need for formal enforcement action suggests high levels of compliance in Scotland [43]. This means that the vast majority of these businesses are operating safely.
Figure 38: Levels of compliance within dairy establishments in England, Wales and Northern Ireland, as at 31 December 2021
Percentage point change compared to the previous year is included in brackets.

Source: K2 dairy data system, DAERA Agri-food Inspection Branch, 2021
Figure 39 Proportion of dairy establishments in Scotland receiving verbal or written advice 2019 to 2020 (accessible version)
Proportion of businesses receiving verbal advice in 2019 to 2020 was 14.4%.
Proportion of businesses receiving written advice in 2019 to 2020 was 7.2%.
Source: Multi-Annual National Control Plan Annual Report 2019
Compliance across animal feed establishments
Animal feed plays an important part in the food chain and failures in feed controls have historically resulted in major incidents, including the BSE outbreak. There are a wide range of legal requirements for animal feed relating to hygiene, traceability, labelling, composition and undesirable substances. Responsibilities for animal feed controls can vary across the nations [44]. There are some important differences in the way the home nations report compliance data, which is outlined in the explanatory notes section [45].
Scotland
From the available data, 94.9% of feed businesses achieved at least satisfactory compliance in 2016, compared to 98.3% in 2017.
England
Feed business compliance remained consistent with 97.9% of businesses having at least satisfactory compliance in 2018 and 97.1% in 2019.
Wales
83.2% of feed businesses had achieved a rating of at least satisfactory compliance in 2020/21. This remained broadly consistent with 2019/20, when 82.8% of feed businesses had achieved a rating of at least satisfactory compliance.
Northern Ireland
Feed business compliance has remained static with 99.3% of businesses achieving at least satisfactory compliance in 2019/20 and 2020/21.
Source: National Trading Standards feed inspection planning data for England, Welsh feed inspection data as reported by local authorities, DAERA feed inspection data and Scottish local authority feed inspections for which FSS have reported outcomes.
Did the pandemic affect food hygiene standards?
The pandemic severely affected the ability of inspectors to assess industry compliance, due to the redeployment of local authority resources to support the pandemic response, and the challenge of gaining physical access to establishments.
This is reflected in the number of food businesses given food hygiene ratings during the pandemic (see figures 40 and 41). Although this is a significant reduction, enforcement officers will still have had a presence within some hospitality premises to carry out COVID-19 compliance visits. While these visits were not always combined with food hygiene checks, many of the principles used to assess whether a premises was COVID-safe also apply to food production practices.
Local authorities have now resumed inspections across food businesses, prioritising those establishments with a history of non-compliance, or those where complaints indicated possible problems. Early discussions with Local Authority Food Liaison Groups [46] suggest that local authorities are now encountering higher levels of non‑compliance than before. However, more data is needed before any firm conclusions can be drawn about whether the pandemic affected hygiene standards more broadly.
Hygiene ratings awarded fell sharply during the height of the pandemic
Figure 40: Number of food businesses given a FHRS rating in England, Wales and Northern Ireland

Figure 41: Number of food businesses given an FHIS rating in Scotland

Looking to the future
Finally, what are some of the big challenges to food hygiene standards in the years ahead?
The first key risk is workforce shortages. The pandemic and EU Exit have highlighted the challenges in recruiting and retaining sufficient numbers of well-trained staff. Many local authorities face difficulties hiring qualified staff to carry out inspections, and there have been similar problems recruiting and retaining official veterinarians (OVs) and meat hygiene inspectors (MHIs) in recent years. We will review the impact of recruitment and retention initiatives via analysis of workforce data in future reports [47].
The second key risk is the growth of online commerce. With a wide variety of online selling routes now opening up, including via aggregators, online marketplaces and social media platforms, it is becoming ever harder for enforcement authorities to have oversight of all food businesses operating online. In response, FSS and the FSA are working with local authorities and technology providers to understand the scale and changing nature of the online food market and assess any risks this may pose to food safety. Again, we will review progress in future reports.
In summary
- the pandemic significantly interfered with the routine hygiene inspection programmes of food businesses within all four nations. The scale of the drop in the number of local authority food hygiene inspections due to the pandemic was significant – inspections dropped to around a third of what they had been in England, Wales, Northern Ireland and Scotland
- compliance data indicates that over 95% of food businesses inspected by local authorities are broadly compliant or higher in England, Wales and Northern Ireland. Similarly in Scotland, food law compliance status is above 96%
- the most recent hygiene rating data shows that 97% of food businesses achieved a generally satisfactory rating of 3 or above in England, Wales and Northern Ireland. In Scotland, 93.8% of businesses achieved a pass rating
- the most recent audit data available for approved meat establishments indicates compliance in excess of 98% in England, Wales and Northern Ireland and 85% in Scotland. In respect of dairy establishments, the distribution of dairy establishment types differs between England, Wales and Northern Ireland can contribute to a variation in compliance levels. The most recent rating data available indicates compliance in excess of 80% in England and Wales, and 99% in Northern Ireland. The absence of the need for formal enforcement action suggests high levels of compliance in Scotland. This means that the vast majority of these meat and dairy establishments are operating safely
- in respect of feed businesses, there are differences in how we verify compliance with feed law requirements across the home nations which can contribute to a variation in compliance levels. The most recent rating data available indicates compliance in excess of 97% in England, 83% in Wales, 99% in Northern Ireland and 98% in Scotland. This means that the vast majority of these businesses are operating safely
- given the fall in inspection activity associated with the pandemic it is not possible to determine with confidence whether hygiene standards have fallen or not. Early intelligence from local authority food liaison groups suggests there may have been some impact on compliance but we expect a clearer picture to emerge in next year’s report.
Food standards usually play a hidden but essential role in people’s lives, helping us to eat well, stay safe and make the best choices for ourselves and our families.
Our first annual report on food standards comes after the UK food system has faced two years of significant upheaval. The COVID-19 pandemic shut down swathes of the hospitality industry, brought disruption and uncertainty across food supply chains, and piled additional pressure on local authority environmental health, trading
standards teams and FSA and FSS inspectors.
In addition, as a result of the UK’s departure from the EU, ministers and food regulators are now directly responsible for food law for the first time in nearly 50
years. As a consequence, the UK Government and devolved administrations have new and significant responsibilities to discharge, such as negotiating trade deals and
authorising novel foods.
And there are more changes ahead. As we write, the impact of the conflict in Ukraine is being felt across food supply chains, and rising global food prices are a matter of national and international concern.
The evidence set out in this report suggests that overall food safety standards have largely been maintained during 2021. Against the background of change and
uncertainty, this is a remarkable achievement.
However, this is a cautious conclusion. The pandemic disrupted regular inspections, sampling and audits across the food system, reducing the amount of data we can draw upon in assessing business compliance against food law requirements. It also changed patterns of behaviour. For example, people ate out less and supermarkets narrowed the range of items they stocked. This has made comparisons with previous years difficult for some key performance indicators, such as the numbers of allergy alerts issued.
While food safety standards have largely been maintained, both organisations recognise there are significant risks ahead. Evidence from this period points to two
particular points of concern in the system.
Firstly, there has been a fall in the level of local authority inspections of food businesses. The situation is in the process of being repaired – in particular in food
hygiene inspections of cafés and restaurants – but progress is constrained by resource and the availability of qualified professionals.
The second is in relation to the import of food from the EU. To enhance levels of assurance on higher-risk EU food like meat, dairy and eggs, and food and feed that
has come to the UK via the EU, it is essential that improved controls are put in place to the timescale that the UK Government has set out (end 2023). The longer the UK operates without assurance from the exporting country that products meet the UK’s high food and feed safety standards, the less confident we can be that we can effectively identify potential safety incidents.
It is vital that the UK has the ability to prevent entry of unsafe food and identify and respond to changing risks. Although we have considered these challenges carefully and put other arrangements within our control in place, they are not, in our view, sufficient. We are therefore committed to working with government departments to ensure that the introduction of these improved import controls provides high levels of protection for UK consumers.
These twin concerns about the capacity for inspection and the enforcement of future standards for imported food reinforce the need to expand investment in sampling programmes, such as the FSA’s basket of foods survey and FSS’s targeted food sampling activity. Local authorities also need sufficient resources to carry out their part in assuring that food is what it says it is.
Looking to the future, we recognise that considerations about the impact of trade and new free trade agreements go beyond safety standards. They include consumer concerns on broader standards linked to production such as animal welfare and sustainability, and questions related to national food security. These concerns tie in with a greater consumer appreciation of current UK food standards, including in domestic production, and a recognition of the contribution domestic food systems make to communities and the economy. These are issues that we will turn to in future reports.
Above all, the findings in this report highlight the need for food policy to keep pace with consumers’ expectations, concerns, behaviours, and values – particularly as their personal circumstances change.
Our research shows that concerns about price, health and the environment are high amongst the public’s priorities. Although there have been some modest and welcome improvements in people’s diets, especially the reduction in the consumption of free sugars, the overall picture shows that too many of us are not meeting dietary recommendations – a fact reinforced by the high and increasing numbers of people in the UK who are living with obesity. This in turn creates an avoidable pressure on health care resources as well as significant impact on the wider UK economy in terms of lost productivity, premature death, and disability.
There is an important and ongoing conversation underway about what role the government should play in addressing issues of health and sustainability that go
beyond immediate matters of food safety and authenticity. In the face of the steep rises in food prices, and wider pressures on household incomes, which are a subject of intense concern as we write this report, we recognise that it is almost certain to become more challenging for consumers to access affordable healthy and sustainable food this year.
The FSA and FSS are among many national organisations with responsibility for different aspects of food policy. This is a complex eco-system and the security, safety and sustainability of our food system, for people and the planet, are not issues that can be neatly disentangled. The question that shadows this report is how we can make sure that current cost of living pressures do not become a crisis for food safety or exacerbate the challenges we already face to public health and environmental sustainability.
This extends far beyond the powers we have as regulators. But it is one that we need to help to resolve, working with business and governments, and in partnership with all those involved in the food system. Affordable food must also be good food, for the sake of our health and the environment. We owe this to consumers today and for future generations.
These appendices contain additional information that is not an essential part of the text itself but is helpful in providing a more additional context. This page includes a list of acronyms, glossary of terms, table of figures, chapter references and explanatory notes.
Appendix 1: List of acronyms
| Acronym | Definition |
|---|---|
| ABP | Animal-by-product |
| BSE | Bovine Spongiform Encephalopathy |
| CAC | Codex Alimentarius Commission |
| CBD | Cannabidiol |
| DAERA | Department for Agriculture, Environment and Rural Affairs |
| Defra | Department for Environment, Food and Rural Affairs |
| DNP | 2,4 Dinitrophenol |
| DWP | Department for Work and Pensions |
| EFSA | European Food Safety Authority |
| EHO | Environmental Health Officer |
| EU | European Union |
| FAFA | Food alert for action |
| FBO | Food Business Owner |
| FHIS | Food Hygiene Information Scheme |
| FHRS | Food Hygiene Rating Scheme |
| FIIN | Food Industry Intelligence Network |
| FNAO | Food not of animal origin |
| FSA | Food Standards Agency |
| FSS | Food Standards Scotland |
| FTA | Free Trade Agreement |
| HIN | Hygiene Improvement Notice |
| HRFNAO | High risk food not of animal origin |
| INFOSAN | International Food Safety Authorities Network |
| LAEMS | Local Authority Enforcement Monitoring System |
| MHI | Meat Hygiene Inspector |
| NDNS | The National Diet and Nutrition Survey |
| NFCU | National Food Crime Unit |
| NTS | National Trading Standards |
| ONS | Office of National Statistics |
| OV | Official Veterinarian |
| PHE | Public Health England |
| POAO | Product of animal origin |
| QR | Quick response code |
| RASFF | Rapid alert system for food and feed |
| SFCIU | Scottish Food Crime and Incidents Unit |
| SFSD | Scottish Food Sampling Database |
| SND | Scottish National Database |
| TCA | UK-EU Trade and Co-operation Agreement |
| UKNHCC | UK Nutrition and Health Claims Committee |
| VPHP | Veterinary Public Health Programme |
| WGS | Whole Genome Sequencing |
Appendix 2: Glossary of terms
| Term | Definition |
|---|---|
| Additives | Food additives are ingredients that are added to food for particular functions. |
| Aflatoxins | A toxic compound produced by certain moulds found in food, which can cause liver damage and cancer. |
| Allergens | There are 14 allergens declarable by law, but consumers may be allergic or have intolerance to other foods or ingredients. |
| BSE | Bovine Spongiform Encephalopathy, also known as BSE or mad cow disease is a brain disease that can infect cattle, sheep and goats. If this infected meat is eaten by humans, it can result in serious illness and death. |
| Campylobacter | A cause of food poisoning, mainly spread by cross-contamination from raw chicken. |
| Cannabidiol (CBD) | A chemical found within hemp and cannabis. CBD extracts are being sold as food, often as food supplements in the UK. |
| Climate change | Long-term shifts in weather patterns and temperatures, some natural and some caused by the burning of fossil fuels since the 19th century. |
| Dinitrophenol | A highly toxic chemical, which is poisonous to humans and can cause death. |
| Disruptions | A recently implemented measure of food crime interventions which stop or reduce the opportunity for food crime offending and, in doing so, increase UK food security by ensuring food is safe. |
| E. Coli | Escherichia coli is a type of bacteria that can be found in the intestines of animals and humans. Some strains can cause serious illness in humans, such as Verocytoxin producing E. coli (VTEC). |
| E numbers | The number assigned to a food additive that has been tested and proved to be safe for its intended use, and its use does not mislead the consumer. |
| European Commission | The EU's executive arm, responsible for proposing new laws, managing policies and funding and enforcing EU law. |
| Farm to the fork | The complete journey of our food ingredients, from source to consumption. |
| Fibre | A type of carbohydrate that the body cannot break down. Found naturally in plant foods like wholegrains, beans, nuts, fruit and vegetables, it helps keep our digestive system healthy. |
| Free from | A product that has been designed to be free from one or more ingredients that people can be intolerant or allergic to. |
| Free sugars | All sugars naturally present in fruit juices, vegetable juices, purées and pastes and similar products in which the structure has been broken down; all sugars in drinks (except for dairy-based drinks); and lactose and galactose added as ingredients. |
| Free trade agreements | Trade agreements set out the rules that cover trade between two or more countries. They aim to make trading easier between those countries. They do this by reducing the restrictions on imports and exports between them. |
| Genome sequencing | A technique used to ‘read’ DNA which, in the context of this report, allows scientists to identify and differentiate between different bacterial and viral strains. |
| Household food insecurity | A term used to describe households that are without reliable access to a sufficient quantity of affordable, nutritious food. |
| Natasha's Law | Regulations that require food businesses to include full ingredients labelling on pre-packed for direct sale foods. These requirements protect those with allergies and give them greater confidence in the food they buy. The requirements are within specific Regulations:
|
| Norovirus | Also known as winter vomiting bug, it is highly transmissible and one of the most common causes of foodborne illness in the UK. Although unpleasant, it is short-lived and considered a mild illness. |
| Obesity | Used to describe someone who is very overweight, with a lot of body fat. In terms of the Body Mass Index (BMI), a score of 30 or higher would denote that a person is obese. |
| Official controls | Generally meaning inspections, enforcement, advice and guidance that are required in law or government guidance. |
| Online marketplaces | Food providers engaged either by computer or smartphone via the internet to deliver food directly to the consumer. |
| Pathogen | A bacterium, virus or other organism that can cause disease. |
| Probiotic | A substance which stimulates the growth of microorganisms, especially those with beneficial properties. |
| Processed meat | Any meat which has been modified in order to alter the taste or extend its shelf life. |
| QR code | Quick response code, taking the form of an optical matrix barcode, typically readable by mobile phones. |
| Rapid Alert System for Food and Feed (RASFF) | An EU system enabling information to be shared efficiently between EU, EEA and EFTA countries. |
| Regulated products | Certain food and feed products (including food and feed additives, flavourings and food contact materials) requiring authorisation before they can be sold in the UK. |
| Risks Analysis | The process of assessing, managing and communicating food and animal feed safety risks. |
| Root cause analysis | Root cause analysis involves finding and fixing the case of problems, rather than applying superficial fixes to problems as they occur. |
| Salmonella | Salmonellas are a group of common bacteria that cause food poisoning. They are usually spread by inadequate cooking and through cross-contamination. Salmonella infection (salmonellosis) is a common bacterial disease that affects the intestinal tract. Salmonella bacteria typically live in animal and human intestines and are shed through faeces. Humans become infected most frequently through contaminated water or food. |
| Sampling | Sampling is the taking of a product to check that it is up to the standard needed. This may include being safe, of the desired standard, or that labelling is correct. It is undertaken to support enforcement, as part of business checks, and for research and surveillance purposes. |
| Saturated fat |
A type of fat associated with an increased risk of high blood cholesterol, which can increase the risk of heart disease and stroke. |
| Sustainable | Reducing our carbon-footprint, promoting sustainable best practice, conserving natural resources and building environmental awareness through our policies and practice. |
| Trans fats | A type of unsaturated fat found naturally at low levels in some foods, such as meat and dairy products, and in partially hydrogenated vegetable oil. Trans fats can raise cholesterol levels in the blood, increasing the risk of heart disease and stroke |
Appendix 3: Table of figures
Setting this year's report in context
- Figure 1: How the FSA and FSS make evidence-based recommendations and advice
Chapter 1: The nation's plate
- Figure 2: Daily free sugars intake as a percentage of total energy in adults and children
- Figure 3: Average consumption of free sugars as a proportion of daily total energy (2020)
- Figure 4: Average daily saturated fat consumption as a proportion of daily total energy (2020)
- Figure 5: Average estimated daily salt intake across the UK for adults aged 19-64 years
- Figure 6: Average portions of fruit and vegetables eaten per day by age (2020)
- Figure 7: Average amount of fibre consumed per day (2020)
- Figure 8: Average weekly consumption of fish by age group (2020)
- Figure 9: Average daily consumption of red and processed meat in working age adults (grams per day)
- Figure 10: Average daily consumption (grams per day) of red and processed meat by age group (2020)
- Figure 11: % of respondents in England, Wales and Northern Ireland who shop about once a week or more
- Figure 12: How the price of food has changed over time (2000-21)
- Figure 13: Household food security in the UK by region (2020-21)
- Figure 14: Proportion of consumers worried about food affordability in England, Wales and Northern Ireland
- Figure 15: Proportion of consumers worried about food affordability in Scotland
- Figure 16: The top 10 food priorities for the public over the next three years
Chapter 2: Going global
- Figure 17: % of total UK consumption of major POAO categories
- Figure 18: % of total UK consumption of major FNAO categories
- Figure 19: % of total UK imports sourced from the EU and from other regions, 2017-21
- Figure 20: Largest % growth in import volumes from 2012-16 to 2017-21
- Figure 21: % of consignments failing import control checks in Great Britain, 2020-21
Chapter 3: Safe and sound
- Figure 22: Number of reported food incidents in the UK
- Figure 23: Number of incidents of contamination by harmful micro‑organisms in the UK
- Figure 24: Number of incidents of chemical contamination in the UK
- Figure 25: Number of reported incidents involving poultry meat in the UK
- Figure 26: Number of reported incidents involving food supplements in the UK
- Figure 27: Total number of allergy alerts issued in the UK, 2019-21
- Figure 28: The five allergens most commonly involved in food incidents
- Figure 29: Total number of product recall information notices issued in the UK
Chapter 4: Informing consumers
- Figure 30: Location of samples taken as part of the basket of foods survey and the result
- Figure 31: The FSA's basket of foods survey: results by food category
- Figure 32: Overall % of samples deemed satisfactory, with type and proportion of non‑compliance by food category
- Figure 33: Overall % of samples assessed as satisfactory or unsatisfactory in FSS's sampling activity (2021)
Chapter 5: Keeping it clean
- Figure 34: The annual economic cost of some well-known foodborne illnesses
- Figure 35: The latest reported rates of compliance for UK food business operators
- Figure 36: % of UK food businesses achieving satisfactory or better ratings for food hygiene, as of 31 December 2021
- Figure 37: % of meat establishments rated as good or satisfactory for hygiene in 2020‑21
- Figure 38: Levels of compliance within dairy establishments in England, Wales and Northern Ireland, as at 31 December 2021
- Figure 39: Proportion of dairy establishments in Scotland receiving verbal or written advice, 2019-20
- Figure 40: Number of food businesses given a FHRS rating in England, Wales and Northern Ireland
- Figure 41: Number of food businesses given an FHIS rating in Scotland
Appendix 4: Chapter references and explanatory notes
1 Pre-notification enables food products to be traced more easily in case food safety and enforcement authorities need to respond to a safety incident.
2 Disruptions refer to any activity which stops or reduces the opportunity for food crime to be carried out and, in doing so, increases UK food security by ensuring
food is safe.
3 For more detail, see Information (Amendment) (England) Regulations 2019, Food Information (Wales) (Amendment) (No. 2) Regulations 2020, Food Information
(Amendment No. 2) Regulations (Northern Ireland) 2020 and Food Information (Scotland) Amendment Regulations 2021.
4 Certain food and feed products, known as regulated products, require authorisation before they can be sold in the UK. These products include food and
feed additives, flavourings and food contact materials.
5 Further details of dietary recommendations are provided in the Eatwell guide and the Scottish dietary goals.
6 The latest comparable data shows there was no statistically significant change in estimated salt intake for adults in England between 2005/6 and 2018/9. There
was also little change in estimated intake in Wales between 2006 and 2009 to 2013 combined. However, data collected in Scotland indicates a decline in salt intake
between 2006 and 2014. There has only been one assessment from urine samples in Northern Ireland to date, so trends are not available.
7 A recent evidence review found that the strongest motives for reducing meat and dairy consumption were to improve health and for animal welfare reasons,
although health reasons were a weaker driver for reducing dairy intake compared to meat. Only a small minority of consumers reported that their primary goal in
reducing their consumption of meat and dairy was protecting the environment. However, this was due to low consumer awareness of how, and how much, the
production of meat and dairy impacts the environment, as well as the belief that other actions were more important.
8 The FSA’s Lived Experience of Food Insecurity report (2020) also found that people living in household food insecurity in England, Wales and Northern Ireland felt that the variety in their diet suffered during lockdown, with meals centring around low perishable foods such as tinned or frozen food, or inexpensive carbohydrates (such as bread, pasta and rice), often at the expense of fresh fruit, vegetables or meat. Many were concerned about reducing the variety in their diet and the impact that this might have on their and their children’s health.
9 For more detail, download the full results of the FSS tracker survey.
10 The results varied by social group. Higher income groups, people in full-time employment, and those with children eligible for school meals being more likely to
have eaten healthier meals than other groups.
11 Download the full Situation Report: Changes to shopping and eating behaviours in Scotland during the COVID-19 pandemic in 2020 | Food Standards Scotland.
12 The extent to which food shopping habits changed also depended on people’s personal situations. For example, the 2020 NDNS survey found that participants
who reported managing less well financially were more likely to report buying items that were on special offer, changing where they shopped, or substituting
what food they bought for cheaper alternatives. Other research conducted by the FSA suggested that changes in how and where people were shopping were also
driven by pragmatic factors such as access during lockdown, rather than the desire to support local shops. People also reported feeling more comfortable shopping
locally (where there were often shorter queues), or online (due to the lower risk of virus transmission).
13 The sample size for the research conducted in England, Wales and Northern Ireland (around 2,000) varies to that in Scotland (around 500). The survey was only run for selected months in Scotland.
14 Import data in this chapter is mostly taken from the HMRC trade database, summarised through the FSA’s trade data visualisation tool. Data on consumption
comes from Agriculture in the UK (AUK). HMRC and AUK data do not directly correspond due to differences in product definitions and AUK making adjustments
for bone weights. We used the list of higher risk FNAO (HRFNAO) that was in force in December 2021, and have not accounted for historic changes. HMRC import
data goes to 8-digit commodity level, so where HRFNAO is defined at 10-digit commodity code level, it was assumed all products at the 8-digit level were high risk.
Other import controls are in place covering imports from certain products or commodities such as rice products containing GMOs (Genetically Modified
Organisms), food contact materials (kitchenware) from China and certain food and feed from Japan or Chernobyl. These have not been accounted for in our
analysis. In the analysis, we have used volume (in kg) of UK imports of food and feed from all other countries: we have not included price analysis and have not
considered exports. This report has looked at movements into the UK only. Product movements between Great Britain and Northern Ireland continue to be subject to EU-UK negotiation, but data related to those movements is not included in this report.
15 Note that our analysis only looks at overall imports, and not the effect of wider trade patterns. For example, historically some pork from the UK has been exported to the EU for storage, to be re-imported when needed. In addition, some produce enters one EU port and then is transported to the UK. When these goods travel straight to the UK, it should appear in the data with the correct origin. However, when the UK was in the EU, the border checks would have been completed at an EU port and the product entered general EU circulation before being transported to the UK. This can appear as an import from the country from which it was last sent; a scenario commonly known as the ‘Rotterdam effect’.
16 New EU import controls may also have driven major changes in trading patterns for certain types of businesses. For example, it is no longer lawfully possible to
import meat from the EU to be sliced, repackaged and re-exported to the EU. This restriction may have had a significant impact on the pork industry and had
implications for UK food supply chains.
17 These figures were taken up to 2021. Figures for 2022 are likely to change as a result of the situation in Ukraine. This will be picked up in future reports.
18 Some high-risk FNAO checks will happen some time after the products have entered, so the numbers reported later in this chapter may increase due to checks
recorded after the data was compiled for this report (February 2022).
19 These figures are taken from the EU’s Trade and Control Expert System (TRACES) 2020 and Defra’s Import of Products, Animals, Food and Feed System (IPAFFS) for 2021. The data is for Great Britain only. We are currently unable to extract outcome data for POAO physical checks for 2021.
20 Aflatoxins are a family of toxins produced by certain fungi that are found on agricultural crops such as maize (corn), peanuts, cottonseed, and tree nuts.
21 Responsibility for tackling foodborne disease outbreaks is shared with the UK Health Security Agency and the respective public health agencies in Scotland,
Wales and Northern Ireland. These agencies lead on the surveillance of all infectious diseases, including gastrointestinal pathogens that cause foodborne
illnesses, and the FSA and FSS investigate what elements of the food chain may be affected.
22 Serious food crime offences are those which cause significant harm to consumers, cover a wide geographic reach, exhibit a large scale of criminality or pose
considerable reputational risk to the UK and its interests.
23 Examples of food incidents include:
- food being contaminated with harmful microorganisms such as Salmonella, E.coli or Listeria that may cause foodborne illness
- food allergens being present without a declaration (or an incorrect declaration) on the label, which may present a risk for people with food allergies or
- intolerances
- the presence of unauthorised additives in food or animal feed products which may present a health risk if consumed
- the chemical contamination of food or animal feed with illegal pesticides, heavy metals or other toxins which might make them unsafe
- the contamination of foods with foreign bodies such as plastic, glass or metal which might be accidental or intentional and harmful to consumers if eaten.
24 Reporting data has also been affected by the identification of new hazard types, such as stowaways in food vehicles – this represents a contamination risk for food being transported and is linked to wider crime issues such as people trafficking.
25 One of the key advantages of WGS is that it allows the linking of cases in a way that was not possible before, meaning that more disease outbreaks are now being identified. We provide an example of how this has helped to improve our response to food safety incidents below (point 29).
26 Ethylene oxide is an anti-microbial treatment banned in the EU and the UK as it is a known carcinogen. The high levels of incidents is indicative of high levels
of controls by food safety authorities to ensure consumers were protected and affected goods were removed from sale.
27 Source: FSA and FSS Incident Management Systems.
28 A withdrawal is when unsafe food is removed from the supply chain before it has reached consumers. A recall is when unsafe food is removed from the supply
chain and consumers are advised to take appropriate action, such as returning or disposing of the unsafe food.
29 The new monitoring system is also helping to identify other risks to consumers, including the presence of Listeria in sesame products from Syria, Salmonella
in enoki mushrooms from East and South East Asian countries and potential undeclared mustard contamination of wheat products from Italy. These all relate
to imported food products and led to targeted sampling to identify and remove unsafe foods from the market.
30 For example, in April 2021 an outbreak of Salmonella Braenderup linked to melons was identified through Whole Genome Sequencing, allowing the FSA and UKHSA to quickly identify the source of the outbreak. Working with authorities in Honduras and other countries known to be affected, UK scientists were able to show through the genomic profiling that melons from Honduras were the cause of the outbreak. The Honduran authorities are now working with the growers to put in place remedial action to prevent future outbreaks.
31 There are seven main types of food crime:
- Theft – dishonestly obtaining food, drink or feed products to profit from their use or sale.
- Unlawful processing – slaughtering or preparing meat and related products in unapproved premises or using unauthorised techniques.
- Waste diversion – illegally diverting food, drink or feed meant for disposal back into the supply chain.
- Adulteration – including a foreign substance which is not on the product’s label to lower costs or fake a higher quality.
- Substitution – replacing a food or ingredient with another substance that is similar but inferior.
- Misrepresentation – marketing or labelling a product to wrongly portray its quality, safety, origin or freshness.
- Document fraud – making, using or possessing false documents with the intent to sell or make a fraudulent or substandard product.
32 More detail can be found The Products Containing Meat Regulations 2014 – see Regulation 4 and Schedule 1.
33 Food Information (Amendment) (England) Regulations 2019, Food Information (Wales) (Amendment) (No. 2) Regulations 2020, Food Information (Amendment
No. 2) Regulations (Northern Ireland) and 2020 Food Information (Scotland) Amendment Regulations 2021
34 The statistics for this diagram are taken from the following source: FSA research report on The Burden of Foodborne Disease in the UK 2018. The common food
sources for each pathogen are derived from the following reports: FSA Report on Norovirus Attribution Study; FSA Report on Enhanced molecular-based surveillance and source attribution of campylobacter infections in the UK; and the One Health Report on Zoonoses (2019). There are a total of 2.4 million cases of foodborne illness in the UK per year, costing the economy £9 billion in total, including £3 billion attributed to illnesses that have been attributed to a known pathogen.
35 Compliance assessments are carried out at a range of businesses. These include manufacturers and packers, importers and exporters, distributors and transporters, retailers, restaurants and caterers. In each case, the establishment’s level of compliance is assessed against a range of criteria, including how food is handled, stored, and prepared, the cleanliness of facilities and how food safety is managed. The criteria for assessment may vary across the nations and are carried out in line with the relevant Food Law Codes of Practice. See the Food Law Code of Practice (for Scotland) and the Food and Feed Codes of Practice (for England, Wales and Northern Ireland).
36 In England, Wales and Northern Ireland, the FSA tracks the proportion of food establishments that are “broadly compliant” with food hygiene legal standards,
meaning that the food establishment achieved a score of not more than 10 for compliance in hygiene, structure and confidence in management scores. The FSA
has used the Local Authority Enforcement Monitoring System (LAEMS) to collect this data up to 2019/20. Reporting arrangements were changed to a bespoke return in 2020/21 to reduce demands on local authorities during the pandemic.
In Scotland, FSS uses the Scottish National Database (SND), which replaced LAEMS in 2017. This collects compliance data from Local Authority database systems, including the outcome of inspections. Scottish local authorities use The Food Law Rating System (FLRS) to risk rate premises. This is a relatively new risk rating scheme which has been gradually implemented in Scotland since 2018 and combines food hygiene and food standards into a single inspection regime. FLRS has been gradually phased in as a new risk rating scheme from 2018 onwards.
In England, Wales, and Northern Ireland the data for 2018/19 and 2019/20 shows that more than 95% of establishments in all three nations were broadly compliant
or better. Northern Ireland had the highest rate of compliance (98.4%), followed by Wales (96.6%) and England (95.7%).
In Scotland, during the relevant period, there has been a change to the risk rating scheme, so a direct comparison is not possible. Notwithstanding, there was an increase in food hygiene compliance of food establishments from 89.3% in 2018/19 to 92.7% in 2020/21. Food standards compliance status, which covers the requirements concerning the quality, composition, chemical contamination, labelling, presentation, and advertising of food, has remained high at over 99%
over the relevant period. Food Law compliance status, under the new Food Law Rating System has stayed at or above 96.0% since 2018/19.
37 Both the FHRS and FHIS provide information about the standard of food hygiene of businesses based on the most recent inspection by a local authority food
safety officer. The two schemes take a different approach to ratings. FHRS provides a rating between 0 and 5, with 5 being the highest score, indicating ‘very good’ hygiene standards. FHIS provides a rating of ‘pass’ or ‘improvement required’. The schemes are run by the FSA and FSS respectively in partnership with local authorities. Ratings are given to places where food is supplied or sold to consumers, including restaurants, pubs, cafés, takeaways, hospitals, care homes
and schools. In Wales, the scheme also covers business-to-business operations such as manufacturers that fall under the remit of local authorities.
In England, Wales and Northern Ireland, as of 31 December 2021, 97% of food businesses achieved a generally satisfactory rating of 3 or above with 74.9% in
England, 70.7% in Wales and 83.5% in Northern Ireland achieving the top rating of 5. The profile of ratings has shown only minor variations over the last few years.
Overall, 74.9% of businesses in England, Wales and Northern Ireland achieved a top rating of 5. Meanwhile, 3.0% of food establishments, achieved a rating of 2 or
below, requiring some improvement, major improvement, or urgent improvement.
In Scotland, FHIS data shows a pass rate over the last three years of 93.8%, with 6.2% of businesses requiring improvement. However, the lack of any meaningful
difference between the 2020 and 2021 pass rate may be due to the reduced number of inspections undertaken during the pandemic, as described in the ‘did the
pandemic affect hygiene standards’ section of the chapter.
38 The responsibilities for overseeing compliance in meat hygiene establishments vary across the nations as follows:
- in England and Wales, the FSA carries out food business audits to verify business compliance in approved meat establishments and works with FBOs to identify where improvements are necessary
- in Scotland, FSS carries out audits of approved meat establishments to verify compliance with legal food safety and hygiene standards, working with
- businesses to ensure action is taken where needed
- in Northern Ireland, the Department of Agriculture, Environment and Rural Affairs’ Veterinary Public Health Programme (VPHP) carries out meat hygiene official controls and other official activities for the FSA in approved meat establishments to ensure compliance
- audits are undertaken by veterinary auditors
- audits in England, Wales, Northern Ireland and Scotland are scored as either Good, Generally Satisfactory, Improvement Necessary or Urgent Improvement Necessary
- approved meat establishments in England, Wales and Northern Ireland are subject to audit cycles which vary in frequency depending on their risk profile,
- typically from 2 months to 18 months. The level of compliance of food business operators can partly be assessed by audit outcomes. The latest data provides a snapshot of audit outcomes as of 31 December 2021 for England, Wales and Northern Ireland. Data for 2020 is also provided for comparison. However, audits conducted in 2020 were significantly impacted by the pandemic, so the data may not be directly comparable for Scotland, the 12-month audit cycle consists of several inspections and interventions in every approved meat establishment. Each intervention triggers a written report and intermediate audit result, after which plants receive a final audit outcome
39 In 2020, FSS suspended FBO audits in approved meat establishments entirely due to the pandemic. Audits resumed in January 2021 using a new audit approach,
with plants entering the inspection cycle gradually over the following 12 months. The new approach was based on a remote review of FBO documentation and onsite hygiene inspections conducted by veterinary auditors. The assessment of audit outcomes under the new system has also changed. For example, a major
non-compliance that is still active (not addressed by the FBO), will now result in an audit outcome of ‘improvement necessary’. It should also be noted that outcomes for Scottish meat establishments in 2021 are intermediate as opposed to final outcomes. The plants going through the audit cycle are periodically assessed (as per their resource calculation) and they can improve their outcome by the end of the audit cycle. As a result, the data is not comparable with previous years or with the FSA data.
In England, Wales and Northern Ireland, as of 31 December 2021, 98.6% of FBOs in England and Wales and 100% of FBOs in Northern Ireland were compliant,
achieving either good or generally satisfactory as their most recent rating. This is a consistent level of FBO compliance compared to previous years. Figures are based on FSA data for Meat Establishments and Approved Establishments.
In Scotland, as of 31 December 2021, 85.5% of FBOs were compliant, achieving either a good or generally satisfactory rating. In 2019 and 2020, 84.3% of premises
achieved a good or generally satisfactory rating. Though it is difficult to compare the 2021 data to previous years due to changes in the audit approach. However,
levels of compliance again appear to have remained high, with minimal changes in the rate of compliance compared to recent years The outcomes for 2021 are
intermediate outcomes and not final outcomes. The plants going through the Audit cycle are periodically assessed (as per their resource calculation) and they can
improve their outcome by the end of the Audit cycle. As a result, the data is not comparable with previous years or with the FSA data.
40 Responsibilities for dairy controls across the home nations are as follows:
- in Scotland, FSS has no direct enforcement role for dairy hygiene in Scotland, which is instead the responsibility of Scottish local authorities. They perform all checks carried out on dairy farms, liquid milk processing plants and other approved and registered dairy establishments. The majority of dairy holdings are rated as either category D or E (low-risk establishments), resulting in inspection frequencies of two or three years respectively. FSS have been informed of inspection frequency and ratings through discussions with Scottish local authorities – particularly those sitting on FSS/Scottish Food Enforcement Liaison Committee (SFELC) remote dairy inspection working group
- in England and Wales, the FSA employs dairy hygiene inspectors to monitor, verify and enforce compliance with food hygiene legislation at milk production holdings. Once milk goes on for further processing or production, delivery of hygiene controls become the responsibility of the respective local authority
- in Northern Ireland, DAERA carries out dairy hygiene inspections on behalf of the FSA. This covers milk production holdings, liquid milk processing plants and raw milk intake at approved milk product plants. It also carries out inspections enforcing food hygiene legislation at other approved and registered premises, including on-farm pasteurisers, milk purchasers, hauliers, distribution depots and self-serve businesses
- businesses in England, Wales and Northern Ireland that are members of a voluntary assurance scheme approved by the FSA benefit from a reduced
- inspection frequency. This enables food law enforcement bodies, including local authorities, DAERA and the FSA, to focus their resources on businesses that are less compliant and higher risk
- third-party assurance schemes are not utilised to reduce the inspection frequency of dairy holdings in Scotland
41 The impact of the pandemic on dairy inspections activity across the UK was as follows:
- in England and Wales, only high-risk inspections (that is, involving farms that produce raw drinking milk for direct supply to the final consumer) were
- completed during the peak of the pandemic. Following the easing of lockdown measures, all routine inspections were resumed but with the introduction of additional health and safety measures. Outstanding inspections are being prioritised and a plan is in place to address these
- in Northern Ireland, on-site inspections were suspended from 17 March 2020 until 8 June 2020 and also during the month of January 2021, though limited remote inspections were completed by telephone. Physical inspections have continued outside of these periods, albeit with amended inspection procedures to ensure a COVID-safe workplace. However, some aspects of work have continued on a remote basis
- in Scotland, local authorities suspended their inspection of low-risk dairy premises during the pandemic. Recovery planning and the restart of all aspects
- of environmental health work are now underway and some local authorities are piloting remote inspection of low-risk dairy farms. This work will enable
- authorities to prioritise higher risk premises while also having oversight of operations undertaken at lower risk locations. It is also important to note that
- the sale of raw milk is banned in Scotland, which changes the risk profile of its dairy establishments in comparison to other parts of the UK.
42 In England and Wales, 80.6% of approved dairy establishments were compliant in 2021, achieving either a good or generally satisfactory as their most recent rating. This represents a marginal decline in standards when compared with 2020, and 2019, where 83.0% and 84.8% respectively of dairy establishments were compliant. In Northern Ireland, 99.2% of dairy establishments were compliant in 2021, achieving either a good or generally satisfactory rating. This remained consistent with levels in both 2020 and 2019, where 99.0% of dairy establishments were compliant. It should be noted that Northern Ireland has a lower proportion of raw milk drinking (RDM) establishments (0.2% of all dairy establishments in Northern Ireland compared to 1.8% in England and Wales).
Raw drinking milk (RDM) establishments are considered higher risk and are subject to more frequent inspections and additional microbiological sampling
requirements. This can result in unsatisfactory sampling results and therefore the need for enforcement action. More Information on RDM can be found on the FSA
website.
43 In Scotland, as part of routine local authority enforcement checks, verbal advice was issued to 14.4% of businesses in 2019/20, with 7.2% receiving written advice. However, a review of pre-pandemic data shows no formal enforcement action was taken, as no hygiene improvement notices (HINs) were issued between April 2018 and March 2020 – this suggests a high level of compliance across the sector during this period.
The following information provides additional detail on the approach taken by local authorities: The first stage of enforcement action is education and advice. Verbal advice is often used first before serving formal enforcement notices. If verbal advice is not acted on by the establishment owner, formal enforcement
action would be taken to secure compliance as soon as possible. While it is not possible to determine what the verbal and written guidance issued to businesses
refers to, it is unlikely the guidance involved any formal action being taken against businesses as HINs are recorded separately.
44 The split of responsibilities for animal feed controls is as follows:
- in Northern Ireland, the Department of Agriculture, Environment and Rural Affairs (DAERA) is responsible for the enforcement of all feed controls, while the FSA remains responsible for animal feed legislation and policy
- in Scotland, up to 1 April 2021, Scottish local authorities were responsible for ensuring feed businesses in their area were complying with feed law. Since then, FSS took over formal responsibility – although many local authorities continue to deliver feed controls on their behalf
- in England and Wales, the FSA is responsible for animal feed legislation and policy, while feed controls are delivered by local authorities. This is achieved
- through an annual programme of risk-based interventions performed by local authority officers
45 There are some important differences concerning how and when the compliance data provided for animal feed businesses was collected across the four home
nations:
- compliance data for feed premises in England and Wales is drawn from the annual feed inspection planning conducted each year by local authorities.
- This data is collated by the FSA in Wales and National Trading Standards (NTS) for England. The latest validated data for England is 2019, as the annual planning was interrupted due to the pandemic
- in Wales, changes were made to the feed delivery model in April 2015, which involves local authorities working collaboratively across six regions with
- oversight provided by the FSA. The feed delivery programme in Wales prioritises official controls at premises that are new, poorly compliant or higher risk due to the nature of their activities, meaning that the percentage is not indicative of compliance levels across the sector as a whole. It should be noted that the total number of feed establishments that have received an official control has continued to increase and the majority of the premises inspected have fallen within the categories of satisfactory compliance or above
- the figures provided for businesses in Scotland in 2016 and 2017 are based on those local authority inspections for which FSS have reported outcomes. FSS gathered the last known inspection outcomes from local authorities in 2018, and this information was not subsequently recorded nationally until FSS became the competent authority for feed in April 2021. Since then, an electronic system for recording inspection activity and outcomes across all local authority areas has been in use. This system enables inspection information to be submitted directly to FSS and allows quick production of up-to-date outcome data for all feed inspections.
46 Food liaison groups provide a network for local authorities to share information with neighbouring authorities and the FSA and FSS. Activities includes sharing good practice, reducing the burden on businesses and facilitating the efficient, effective and consistent enforcement of food law.
47 Official veterinarians play a critical role in ensuring meat produced in slaughterhouses or processing plants is produced safely and in line with relevant laws. Meat Hygiene Inspectors make sure food processing plants and slaughterhouses follow safety and hygiene standards.
Acknowledgements
Firstly, we would like to thank the many contributors across the FSA and FSS who have made this report possible. This is a new endeavour for our respective organisations and was a genuine UK-wide effort, with extensive input from policy experts across the four home nations. We hope the process has cemented the strong working relationships we have across the two organisations.
The report also benefited hugely from the expert input provided by the twelve external reviewers who examined early drafts and provided support and constructive challenge throughout their development. Their combined wisdom and generous advice have made this report stronger, so we are particularly grateful to:
Chapter 1: The nation’s plate
-
Professor Lynn Frewer, Professor of Food & Society, Newcastle University
-
Professor Morven G. McEachern, Professor of Sustainability & Ethics, University of Huddersfield
Chapter 2: Going global
-
Professor Katrina Campbell, Professor in Food Security & Diagnostics, Queen’s University, Belfast
-
Professor Dennis Novy, Professor of Economics, University of Warwick
Chapter 3: Safe and sound
-
Professor Tony Hines MBE
-
Professor Louise Manning, University of Lincoln
Chapter 4: Informing consumers
-
Dr Vitti Allender, Cardiff Metropolitan University
-
Dr David Mela, Registered Nutritionist and Fellow of the Association for Nutrition
-
Dr Michael Walker, Honorary Professor, Queen's University, Belfast
Chapter 5: Keeping it clean
-
Professor Ian Brown OBE, Oxford University Hospitals and the Institute of Food, Nutrition and Health, University of Reading
-
Dr Belinda Stuart-Moonlight, Moonlight Environmental Ltd
-
Dr Nicholas Watson, Associate Professor, University of Nottingham