page
National Monitoring Plan for POAO: Data Analysis Report 2023-24
This is a summary of the sampling results of imported products of animal origin (POAO) undertaken at UK Border Inspection Posts (BCPs), under the UK’s National Monitoring Plan (NMP), between April 2023 and March 2024.
NMP data for POAO has been sourced from IPAFFS (Import of Products, Animals, Food and Feed System), GB’s replacement for the EU’s TRACES system. NMP samples have been identified where the ‘random’ button has been selected on the ‘checks’ tab, as advised by the Food Standards Agency’s (FSA) Trade Facilitation Unit in the UK and International Affairs Division. To be aware that not all random samples recorded on IPAFFS are necessarily taken for the NMP, for example those testing for speciation or authenticity are not normally included here. As a result, extracting the NMP data from IPAFFS has necessitated a certain amount of data cleansing.
Overview of sampling carried out
During this period, a total of 2,062 samples were identified as being taken under the POAO NMP. These were against the following hazard categories:
- Veterinary residue
- Microbiological
- Heavy metals
- Biotoxins
- Chemical contaminants
There is also a summary for NMP sampling of pet food (dog or cat food) on pages 21 to 22, and for other product types not for human consumption also classed as pet food. Otherwise, feed for animals destined for the food chain is not included in the NMP.
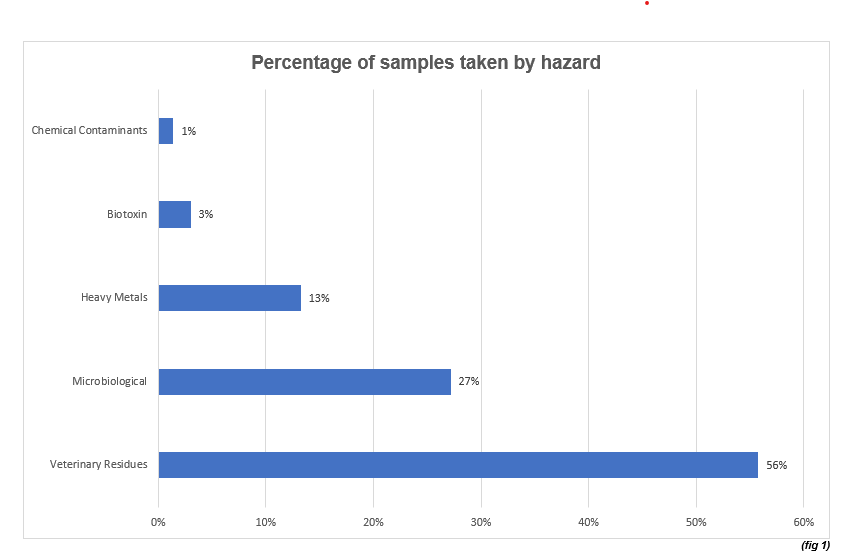
A horizontal bar chart titled “Percentage of samples taken by hazard.” It shows five categories with corresponding percentages: Chemical Contaminants: 1% Biotoxin: 3% Heavy Metals: 13% Microbiological: 27% Veterinary Residues: 56% Veterinary Residues has the largest bar, followed by Microbiological, Heavy Metals, Biotoxin, and Chemical Contaminants. The x-axis ranges from 0% to 60%. A note at the bottom right reads “(fig 1).”
Figure 1: Samples taken by hazard & percentages of total
|
Hazard |
No. of samples |
% |
|---|---|---|
|
Veterinary residues |
1150 |
56 |
|
Microbiological |
560 |
27 |
|
Heavy metals |
273 |
13 |
|
Biotoxin |
50 |
3 |
|
Chemical contaminants |
29 |
1 |
|
Total |
2,062 |
|
The majority of the samples taken were for veterinary residues (1150 or 56%), followed by microbiological hazards (560 or 27%); heavy metals (273 or 13%); biotoxins (50 or 3%) and chemical contaminants (29 or 1%). These ratios closely match those in the same categories in the previous twelve-months reporting period, except for veterinary residues where sampling has decreased by 10%, and heavy metals where sampling has doubled. The total amount of sampling during this period (2,062 samples) remains comparable to the previous period (2,212 samples). (fig 1)
Of the samples taken, a total of six were found to be non-compliant, compared to a total of 43 in the previous period. There were non-compliances in the following hazard categories: biotoxin, chemical contaminants and microbiological, compared with forty-three non-compliances in the previous period. (fig 2).
Figure 2: Non-compliances by country of origin, product & hazard
|
Country |
Product type |
Product category |
Hazard category |
Hazard |
Non-compliances |
|---|---|---|---|---|---|
|
Australia |
Ovis aries |
Ovine |
Microbiological |
Eschericia coli |
1 |
|
China |
Dog and cat food |
Pet food |
Microbiological |
Salmonella spp. |
1 |
|
Ukraine |
Gallus gallus |
Poultry |
Chemical contaminants |
Chlorate |
1 |
|
Ukraine |
Ice cream |
Milk & milk products |
Microbiological |
Enterobacteriaceae |
2 |
|
Vietnam |
Stolephorus spp. |
Fish |
Biotoxin |
Histamine |
1 |
As the graph below shows, consignments from 39 countries were sampled, most frequently from India (591 or 29%), Thailand (267 or 13%), China (223 or 11%), Vietnam (152 or 7%), Brazil (130 or 6%), New Zealand (98 or 5%), Bangladesh (87 or 4%), Sri Lanka (66 or 3%) and Myanmar (65 or 3%). (fig 3) and percentages in graph chart (fig 4).
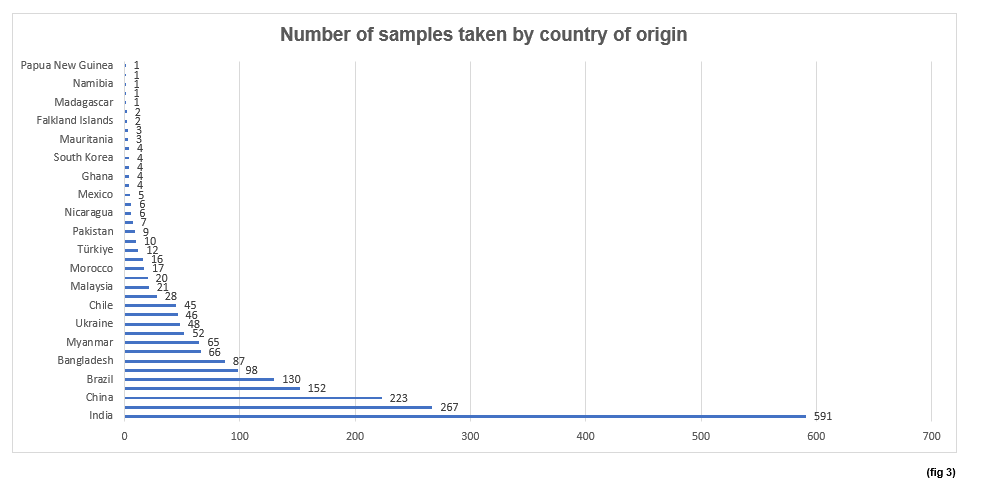
A horizontal bar chart titled “Number of samples taken by country of origin.” It lists 22 countries on the y-axis and the number of samples on the x-axis, ranging from 0 to 700. The countries and sample counts are: Papua New Guinea: 1 Namibia: 1 Madagascar: 1 Falkland Islands: 3 Mauritania: 4 South Korea: 4 Ghana: 5 Mexico: 6 Nicaragua: 6 Pakistan: 9 Türkiye: 10 Morocco: 15 Malaysia: 20 Chile: 28 Ukraine: 45 Myanmar: 46 Bangladesh: 66 Brazil: 87 China: 223 Thailand: 267 India: 591 India has the highest number of samples (591), followed by Thailand (267) and China (223). The smallest counts are from Papua New Guinea, Namibia, and Madagascar (1 each). A note at the bottom right reads “(fig 3).”
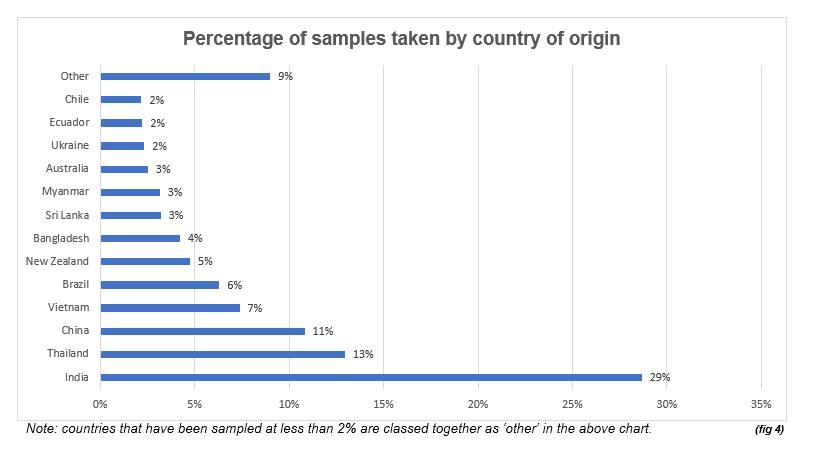
A horizontal bar chart titled “Percentage of samples taken by country of origin.” It shows percentages for 13 categories, including individual countries and an “Other” group. The values are: Other: 9% Chile: 2% Ecuador: 2% Ukraine: 2% Australia: 3% Myanmar: 3% Sri Lanka: 3% Bangladesh: 4% New Zealand: 5% Brazil: 6% Vietnam: 7% China: 11% Thailand: 13% India: 29% India has the largest share at 29%, followed by Thailand (13%) and China (11%). Countries sampled at less than 2% are grouped under “Other.” A note below the chart explains this grouping, and the bottom right reads “(fig 4).”
Figures 3 & 4: Samples taken by country of origin & percentage of total
%
|
Country of origin |
No. of samples |
Country of origin |
No. of samples |
% |
|
|---|---|---|---|---|---|
|
India |
591 |
29 |
Pakistan* |
9 |
- |
|
Thailand |
267 |
13 |
Peru* |
7 |
- |
|
China |
223 |
11 |
Nicaragua* |
6 |
- |
|
Vietnam |
152 |
7 |
Uruguay* |
6 |
- |
|
Brazil |
130 |
6 |
Mexico* |
5 |
- |
|
New Zealand |
98 |
5 |
Argentina* |
4 |
- |
|
Bangladesh |
87 |
4 |
Ghana* |
4 |
- |
|
Sri Lanka |
66 |
3 |
Serbia* |
4 |
- |
|
Myanmar |
65 |
3 |
South Korea* |
4 |
- |
|
Australia |
52 |
3 |
Zambia* |
4 |
- |
|
Ukraine |
48 |
2 |
Mauritania* |
3 |
- |
|
Ecuador |
46 |
2 |
Mauritius* |
3 |
- |
|
Chile |
45 |
2 |
Falkland Islands* |
2 |
- |
|
Indonesia* |
28 |
- |
Japan* |
2 |
- |
|
Malaysia* |
21 |
- |
Madagascar* |
1 |
- |
|
Canada* |
20 |
- |
Maldives* |
1 |
- |
|
Morocco* |
17 |
- |
Namibia* |
1 |
- |
|
United States* |
16 |
- |
Oman* |
1 |
- |
|
Türkiye* |
12 |
- |
Papua New Guinea* |
1 |
- |
|
South Africa* |
10 |
- |
Total |
2,062 |
|
*Countries marked with an asterisk have been sampled at less than 2% and appear together as ‘other’ in figure 4.
Samples were taken from 15 product categories. During this period, crustaceans accounted for 759 samples, with 430 for poultry and 422 for fish. Compared with the previous period, in 2022-23 there was lower sampling of crustaceans (427samples), but higher for poultry (462 samples) and for fish 617 (samples). (fig 5).
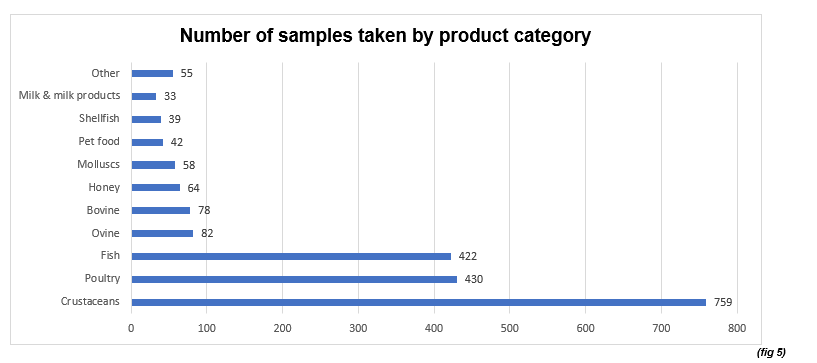
A horizontal bar chart titled “Number of samples taken by product category.” It displays 12 categories with corresponding sample counts: Other: 55 Milk & milk products: 33 Shellfish: 39 Pet food: 42 Molluscs: 58 Honey: 64 Bovine: 78 Ovine: 82 Fish: 422 Poultry: 430 Crustaceans: 759 Crustaceans have the highest number of samples (759), followed by Poultry (430) and Fish (422). All other categories have fewer than 100 samples. The x-axis ranges from 0 to 800. A note at the bottom right reads “(fig 5).”
Figure 5: Samples taken by product category & percentage of total
|
Country of origin |
No. of samples |
% |
|
Crustaceans |
759 |
37% |
|
Poultry |
430 |
21% |
|
Fish |
422 |
20% |
|
Ovine |
82 |
4% |
|
Bovine |
78 |
4% |
|
Honey |
64 |
3% |
|
Molluscs |
58 |
3% |
|
Pet food |
42 |
2% |
|
Shellfish |
39 |
2% |
|
Milk & milk products |
33 |
2% |
|
Other |
55 |
3% |
|
Total |
2,062 |
|
Detailed analysis
Sampling for veterinary residues
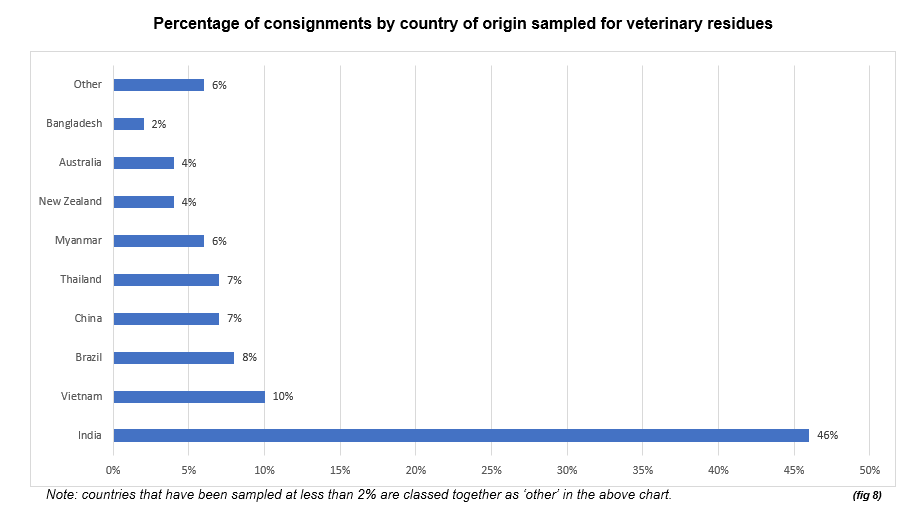
There were 1,150 samples from 22 countries (fig 6) taken and checked for the presence of veterinary residues. There were no non-compliant samples.
The greatest number of samples for veterinary residues were taken from India (529 or 46%), followed by Vietnam (110 or 10%), Brazil (94 or 8%), China (86 or 7%) and Thailand (86 or 7%). See chart on (fig 8) for percentages – countries marked with an asterisk are shown together as ‘other’ on the graph chart.
Figure 8: Samples taken by country of origin & percentage of total
|
Country of origin |
No. of samples |
% |
Country of origin |
No. of samples |
% |
|
India |
529 |
46% |
United States* |
9 |
- |
|
Vietnam |
110 |
10% |
Ukraine* |
8 |
- |
|
Brazil |
94 |
8% |
Nicaragua* |
6 |
- |
|
China |
86 |
7% |
South Africa* |
6 |
- |
|
Thailand |
86 |
7% |
Mexico* |
4 |
- |
|
Myanmar |
65 |
6% |
Uruguay* |
4 |
- |
|
New Zealand |
47 |
4% |
Zambia* |
4 |
- |
|
Australia |
41 |
4% |
Indonesia* |
3 |
- |
|
Bangladesh |
19 |
2% |
Pakistan* |
2 |
- |
|
Ecuador* |
14 |
- |
Türkiye* |
2 |
- |
|
Chile* |
10 |
- |
Madagascar* |
1 |
- |
|
Total |
1,150 |
|
* Countries marked with an asterisk have been sampled at less than 2% and appear together as ‘other’ on figure 8.
Of the samples tested for veterinary residues, the highest numbers were for nitrofurans (243), chloramphenicol (228) followed by tetracyclines (211), avermectins (55), antibacterials (48), coccidiostats (45), macrolides (29) and benzimidazoles (25). (fig 7)
Samples tested for veterinary residues
|
Substance |
No. of samples |
Substance |
No. of samples |
|
Nitrofurans |
243 |
Nitroimidazoles |
3 |
|
Chloramphenicol |
228 |
Penicillin |
3 |
|
Tetracyclines |
211 |
Pleuromutilins |
3 |
|
Avermectins |
55 |
Quinolones/Fluoroquinolones |
3 |
|
Antibacterials |
48 |
Rifamycin |
3 |
|
Coccidiostats |
45 |
Sulphadimidine |
3 |
|
Macrolides |
29 |
Trenbolone |
3 |
|
Benzimidazoles |
25 |
Zeranol (Alpha-Zearalanol) |
3 |
|
Phenicoles |
24 |
Dapsone |
2 |
|
Sulfonamides |
23 |
Diclazuril |
2 |
|
Other Pharmacologically Active Substances |
19 |
Doxycyclin |
2 |
|
Quinolones |
17 |
Lasalocid |
2 |
|
Pesticides residues |
16 |
Malachite Green |
2 |
|
Anticoccidials including nitroimidazoles |
15 |
Methacylin |
2 |
|
Dyes |
15 |
Moxidectin |
2 |
|
Beta-agonists (screening multisubstances) |
12 |
Nicarbazin |
2 |
|
Beta-lactamics |
11 |
Thiamphenicol |
2 |
|
Streptomycin |
10 |
AMOZ |
1 |
|
Fluoroquinolones |
5 |
Anthelmintics |
1 |
|
Nitromidazoles (group) |
5 |
AOZ |
1 |
|
Trimethoprim |
5 |
Epi-Oxytetracycline |
1 |
|
Nitrofurans metabolites |
4 |
Erythromycin |
1 |
|
Organochlorine compounds inc PCBs |
4 |
Lincosamides |
1 |
|
Oxytetracyclin |
4 |
Medroxyprogesterone |
1 |
|
Sulfamides/Sulfonamides |
4 |
Miscellaneous Veterinary |
1 |
|
Amphenicols |
3 |
Quinolones/Fluroquinolones |
1 |
|
Cephalosporins |
3 |
Tylosin |
1 |
|
Total |
1,150 |
(fig 7)
A horizontal bar chart titled “Percentage of consignments by country of origin sampled for veterinary residues.” It shows percentages for 10 categories, including individual countries and an “Other” group. The values are: Other: 6% Bangladesh: 2% Australia: 4% New Zealand: 4% Myanmar: 6% Thailand: 7% China: 7% Brazil: 8% Vietnam: 10% India: 46% India has the largest share at 46%, followed by Vietnam (10%) and Brazil (8%). Countries sampled at less than 2% are grouped under “Other.” A note below the chart explains this grouping, and the bottom right reads “(fig 8).”
Sampling for microbiological contamination
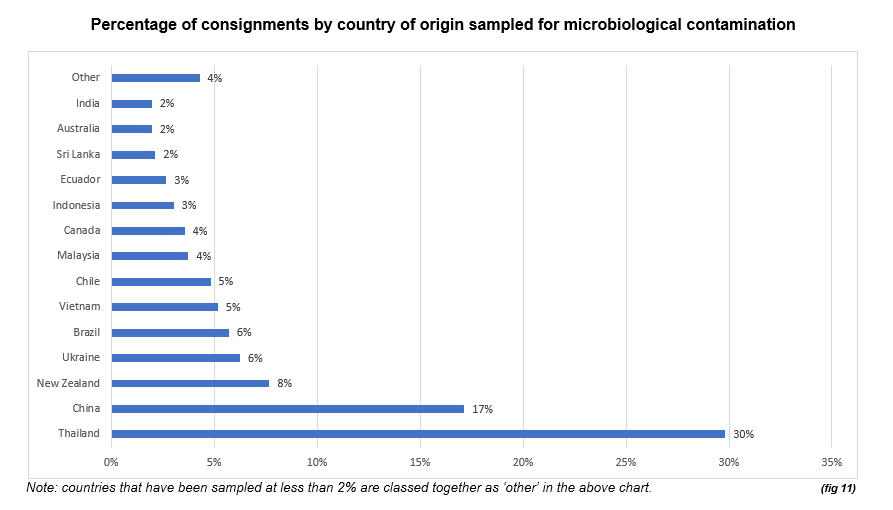
There were 560 samples from 22 countries (fig 9) taken and checked for the presence of microbiological contamination. There were four non-compliant results identified: one each for Eschericia coli in ovine from Australia and Salmonella in pet food from China; and two for Enterobacteriaceae in milk products from Ukraine.
The greatest number of microbiological samples, were taken from Thailand (167 or 30%), China (96 or 17%), New Zealand (43 or 8%), Ukraine (35 or 6%), Brazil (32 or 6%), Vietnam (29 or 5%), Chile (27 or 5%), Malaysia (21 or 4%), Canada (20 or 4%), Indonesia (17 or 3%), Sri Lanka (12 or 2%), Australia (11 or 2%) and India (11 or 2%). See graph chart on (fig 11) for percentages – countries marked with an asterisk below are shown together as ‘other’ on the chart.
Figure 11: Samples taken by country of origin & percentages of total
|
Country of origin |
No. of samples |
% |
Country of origin |
No. of samples |
% |
|
Thailand |
167 |
30% |
Sri Lanka |
12 |
2% |
|
China |
96 |
17% |
Australia |
11 |
2% |
|
New Zealand |
43 |
8% |
India |
11 |
2% |
|
Ukraine |
35 |
6% |
Türkiye* |
6 |
- |
|
Brazil |
32 |
6% |
Serbia* |
4 |
- |
|
Vietnam |
29 |
5% |
South Africa* |
4 |
- |
|
Chile |
27 |
5% |
United States* |
4 |
- |
|
Malaysia |
21 |
4% |
Bangladesh* |
2 |
- |
|
Canada |
20 |
4% |
Falkland Islands* |
2 |
- |
|
Indonesia |
17 |
3% |
Japan* |
1 |
- |
|
Ecuador |
15 |
3% |
Namibia* |
1 |
- |
|
Total |
560 |
|
(fig 9)
* Countries marked with an asterisk have been sampled at less than 2% and appear together as ‘other’ on figure 11.
Of the samples tested for microbiological contamination, the highest numbers were for Salmonella (120), followed by Eschericia coli (81), Enterobacteriaceae (72), aerobic microorganisms 30°C (49), Listeria monocytogenes (36), Staphylococcus aureus (35), Listeria spp (excl L monocytogenes) (27) and Clostridium perfringens (21) (fig 10)
Samples tested for microbiological contamination
|
Hazard |
No. of samples |
Hazard |
No. of samples |
|
Salmonella spp. |
120 |
Coagulase Positive Staphylococci |
6 |
|
Eschericia coli |
81 |
Salmonella Typhimurium |
6 |
|
Enterobacteriaceae |
72 |
Listeria species (total) |
5 |
|
Aerobic microorganisms 30°C |
49 |
Salmonella species |
5 |
|
Listeria monocytogenes |
36 |
ß-Glucuronidase Positive Escherichia coli |
5 |
|
Staphylococcus aureus |
35 |
Vibrio species |
5 |
|
Listeria spp (excl L. monocytogenes) |
27 |
Vibrio spp. |
3 |
|
Clostridium perfringens |
21 |
Microbiological |
2 |
|
Vibrio cholerae |
12 |
AHD |
1 |
|
Vibrio parahaemolyticus |
12 |
Escherichia coli and Salmonella spp. |
1 |
|
Staphylococcus coagulase + |
11 |
Full micro screen |
1 |
|
Eschericia coli (STEC) |
10 |
Listeria spp |
1 |
|
Campylobacter spp (excl C. jejuni and C. coli) |
9 |
Listeria spp. (total) |
1 |
|
Campylobacter (C. jejuni, C. coli) |
7 |
Presumptive Bacillus cereus |
1 |
|
Salmonella Enteritidis |
7 |
Salmonella spp |
1 |
|
Aerobic colony count at 30 ºC for 48h |
6 |
Vibrio vulnificus |
1 |
|
Total |
560 |
(fig 10)
A horizontal bar chart titled “Percentage of consignments by country of origin sampled for microbiological contamination.” It shows percentages for 15 categories, including individual countries and an “Other” group. The values are: Other: 4% India: 2% Australia: 2% Sri Lanka: 2% Ecuador: 3% Indonesia: 3% Canada: 4% Malaysia: 4% Chile: 5% Vietnam: 5% Brazil: 6% Ukraine: 6% New Zealand: 8% China: 17% Thailand: 30% Thailand has the largest share at 30%, followed by China (17%) and New Zealand (8%). Countries sampled at less than 2% are grouped under “Other.” A note below the chart explains this grouping, and the bottom right reads “(fig 11).”
Sampling for heavy metals
There were 273 samples from 21 countries (fig 12) taken and checked for the presence of heavy metals. There were no non-compliant samples. The greatest number of heavy metals samples were taken from Bangladesh (66 or 24%), followed by Sri Lanka (54 or 20%), India (33 or 12%), China (29 or 11%) and Morocco (14 or 5%). See chart on (fig 14) for percentages – countries marked with an asterisk below are shown together as ‘other’ on the chart.
Figure 14: Samples taken by country of origin & percentage of total
|
Country of origin |
No. of samples |
% |
Country of origin |
No. of samples |
% |
|
Bangladesh |
66 |
24% |
Pakistan |
5 |
2% |
|
Sri Lanka |
54 |
20% |
Argentina* |
4 |
- |
|
India |
33 |
12% |
Ghana* |
4 |
- |
|
China |
29 |
11% |
Peru* |
4 |
- |
|
Morocco |
14 |
5% |
South Korea* |
4 |
- |
|
Vietnam |
9 |
3% |
Mauritania* |
3 |
- |
|
Ecuador |
8 |
3% |
United States* |
3 |
- |
|
Indonesia |
8 |
3% |
Brazil* |
2 |
- |
|
Thailand |
8 |
3% |
Uruguay* |
2 |
- |
|
Chile |
6 |
2% |
Mexico* |
1 |
- |
|
New Zealand |
6 |
2% |
Total |
273 |
|
(fig 12)
* Countries marked with an asterisk have been sampled at less than 2% and appear together as ‘other’ on figure 14.
Of the samples tested for heavy metals, the highest numbers were for lead Pb (89) followed by mercury Hg (88), cadmium Cd (69) and arsenic As (24). (fig 13)
Samples tested for heavy metals
|
Hazard |
No. of samples |
|
Lead Pb |
89 |
|
Mercury Hg |
88 |
|
Cadmium Cd |
69 |
|
Arsenic As |
24 |
|
Chromium Cr |
1 |
|
Cupper Cu |
1 |
|
Zinc Zn |
1 |
|
Total |
273 |
(fig 13)

A horizontal bar chart titled “Percentage of consignments by country of origin sampled for heavy metals.” It shows percentages for 12 categories, including individual countries and an “Other” group. The values are: Other: 10% Pakistan: 2% New Zealand: 2% Chile: 2% Thailand: 3% Indonesia: 3% Ecuador: 3% Vietnam: 3% Morocco: 5% China: 11% India: 12% Sri Lanka: 20% Bangladesh: 24% Bangladesh has the largest share at 24%, followed by Sri Lanka (20%) and India (12%). Countries sampled at less than 2% are grouped under “Other.” A note below the chart explains this grouping, and the bottom right reads “(fig 14).”
Sampling for biotoxins
There were 50 samples from 12 countries (fig 15) taken and checked for the presence of biotoxins. There was one non-compliant sample for histamine from Vietnam. The greatest number of samples for biotoxins were taken from India (12 or 24%) followed by China (8 or 16%), Ecuador (6 or 12%) and Thailand (6 or 12%). See chart on (fig 17) for percentages.
Figure 17: Samples taken by country of origin & percentage of total
|
Country of origin |
No. of samples |
% |
|
India |
12 |
24% |
|
China |
8 |
16% |
|
Ecuador |
6 |
12% |
|
Thailand |
6 |
12% |
|
Vietnam |
4 |
8% |
|
Mauritius |
3 |
6% |
|
Morocco |
3 |
6% |
|
Peru |
3 |
6% |
|
Chile |
2 |
4% |
|
Maldives |
1 |
2% |
|
Oman |
1 |
2% |
|
Papua New Guinea |
1 |
2% |
|
Total |
50 |
|
(fig 15)
Of the samples tested for biotoxins, only histamine was recorded (50) (fig 16)
Samples tested for chemical biotoxin
|
Hazard |
No. of samples |
|
Histamine |
50 |
|
Total |
50 |
(fig 16)

A horizontal bar chart titled “Percentage of consignments by country of origin sampled for biotoxins.” It shows percentages for 13 countries. The values are: Papua New Guinea: 2% Oman: 2% Maldives: 2% Chile: 4% Peru: 6% Morocco: 6% Mauritius: 6% Vietnam: 8% Thailand: 12% Ecuador: 12% China: 16% India: 24% India has the highest percentage at 24%, followed by China (16%) and Thailand/Ecuador (12% each). The smallest percentages (2%) are for Papua New Guinea, Oman, and Maldives. The x-axis ranges from 0% to 30%. A note at the bottom explains that countries sampled at less than 2% are grouped under “Other,” and the bottom right reads “(fig 17).”
Sampling for chemical contaminants
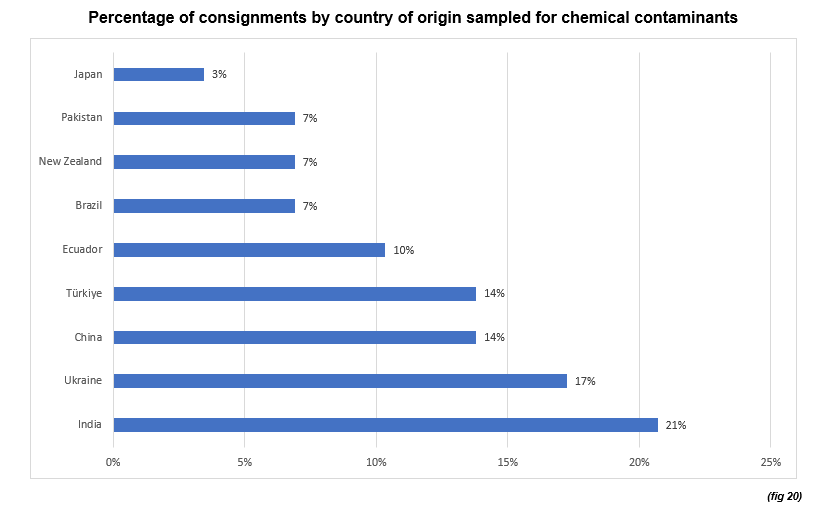
here were 29 samples from 9 countries (fig 18) taken and checked for the presence of chemical contaminants. There was one non-compliant sample for chlorate in chicken from Ukraine. The greatest number of samples for chemical contaminants were taken from India (6 or 21%), Ukraine (5 or 17%), China (4 or 14%) and Türkiye (4 or 14%). See chart on (fig 20).
Samples taken by country of origin & percentage of total
|
Country of origin |
No. of samples |
% |
|
India |
6 |
21% |
|
Ukraine |
5 |
17% |
|
China |
4 |
14% |
|
Türkiye |
4 |
14% |
|
Ecuador |
3 |
10% |
|
Brazil |
2 |
7% |
|
New Zealand |
2 |
7% |
|
Pakistan |
2 |
7% |
|
Japan |
1 |
3% |
|
Total |
29 |
|
(fig 18)
Of the samples tested for chemical contaminants, the highest number were for lead Pb (89), followed by mercury Hg (88), cadmium Cd (69) and arsenic As (24). (fig 19)
Samples tested for chemical contaminants
|
Hazard |
No. of samples |
|
Chlorate |
12 |
|
Dioxins |
6 |
|
Polyphosphates STPP (E452) |
4 |
|
sulphur dioxide (SO2) |
2 |
|
Benzo-a-pyrene |
1 |
|
Hydrogen peroxide (H2O2) |
1 |
|
PAH4 |
1 |
|
Perchlorate |
1 |
|
SEM (semicarbazide) |
1 |
|
Total |
29 |
(fig 19)
A horizontal bar chart titled “Percentage of consignments by country of origin sampled for chemical contaminants.” It shows percentages for nine countries. The values are: Japan: 3% Pakistan: 7% New Zealand: 7% Brazil: 7% Ecuador: 10% Türkiye: 14% China: 14% Ukraine: 17% India: 21% India has the highest percentage at 21%, followed by Ukraine (17%) and China/Türkiye (14% each). Japan has the smallest share at 3%. The x-axis ranges from 0% to 25%. The bottom right reads “(fig 20).”
Sampling of pet food (dog or cat food & other pet food)
here were 42 samples from 5 countries (fig 21) taken and checked for Salmonella spp., Enterobacteriaceae, chloramphenicol and nitrofurans. There was one non-compliant result for Salmonella in pet food from China. The greatest number pet food samples were taken from China (24 or 57%) and India (12 or 29%). See chart on (fig 23) for percentages.
Samples taken by country of origin & percentage of total
|
Country of origin |
No. of samples |
% |
|
China |
24 |
57% |
|
India |
12 |
29% |
|
New Zealand |
2 |
5% |
|
Türkiye |
2 |
5% |
|
United States |
2 |
5% |
|
Total |
42 |
|
(fig 21)
Of the samples of pet food tested, the highest number of tests was for Salmonella spp (45). (fig 22)
Samples of pet food tested
|
Hazard |
No. of samples |
|
Salmonella spp. |
21 |
|
Enterobacteriaceae |
19 |
|
Chloramphenicol |
1 |
|
Nitrofurans |
1 |
|
Total |
42 |
(fig 22)

A horizontal bar chart titled “Percentage of consignments by country of origin sampled of pet food (dog or cat food & other pet food).” It shows percentages for five countries: United States: 5% Türkiye: 5% New Zealand: 5% India: 29% China: 57% China has the highest percentage at 57%, followed by India at 29%. The other three countries (United States, Türkiye, and New Zealand) each account for 5%. The x-axis ranges from 0% to 60%. The bottom right reads “(fig 23).”
Revision log
Published: 18 December 2025
Last updated: 22 December 2025