Research project
Estimating financial cost to individuals with a food hypersensitivity
The aim of the study was to quantify and monetise the financial burden imposed on households with FHS through the day-to-day management of the physical risks associated with food allergies, food intolerance and coeliac disease.
You can download a PDF version of this report:
List of acronyms
| Acronyms | Definition |
|---|---|
| CCG | Clinical Commissioning Group |
| CD | Coeliac Disease |
| FA | Food Allergy |
| FBO | Food Business Owner |
| FHS | Food Hypersensitivity which includes all food allergies, food intolerance and coeliac disease |
| FI | Food Intolerance |
| FIO | Food intolerance cohort, includes those with other conditions |
| FSA | Food Standards Agency |
| GP | General Practitioners |
| MI | Multiple Imputations |
| ONS | Office for National Statistics |
| REA | Rapid evidence assessment |
| RSM | RSM UK Consulting LLP |
Executive Summary
Introduction
The Food Standards Agency (FSA) is a non-ministerial government department within the United Kingdom responsible for protecting public health and protecting consumer interests in relation to food in England, Wales, and Northern Ireland.
Food Hypersensitivities (FHS) is a key priority within the FSA as it is an important food-related health issue with a severe and enduring impact for people living with it. FHS includes individuals living with a food allergy, coeliac disease and food intolerance.
It is the responsibility of the FSA to seek ways to understand and reduce avoidable deaths, the negative impact of FHS on both consumers and businesses, and make sure that FHS consumers have access to safe food that is what it says it is on the label, which they can trust. For people with chronic and / or potentially life-threatening FHS, that trust becomes even more important.
FHS places both a public health and financial burden on society. According to the FSA’s Food and You 2 Wave 3 Survey (footnote 1), an estimated 800,000 people are living with a clinically diagnosed food allergy, 300,000 with coeliac disease and 1.2 million living with food intolerance and other FHS conditions in the UK.
The FSA has invested in a programme of research to understand the economic and societal burden of FHS and to explore how people living with FHS are impacted in their daily lives. The FSA commissioned RSM UK Consulting (RSM), Dr Audrey DunnGalvin from University College Cork and Alizon Draper from the University of Westminster to quantify and monetise the financial burden imposed on people living with FHS through their day-to-day management of the physical risks associated with food allergies, food intolerance and coeliac disease.
This is the first study of its kind to consider whether residents in England, Northern Ireland, and Wales who live with any type of FHS condition (food intolerance, coeliac disease or food allergy) results in additional financial burden for their household.
About this study
The aim of the study was to quantify and monetise the financial burden imposed on households with FHS through the day-to-day management of the physical risks associated with food allergies, food intolerance and coeliac disease, by:
- comparing the price paid for food between households with at least one adult above 18 years old living with FHS, to households without FHS
- valuing the direct costs incurred through efforts to manage FHS and remain symptom free (for example, medical and kitchen supplies)
- monetising indirect costs incurred when having to deal with an FHS condition (for example, lost working days)
This study is unique in terms of estimating price differentials for food consumption across different types of FHS and then comparing to a non-FHS comparison group. Previous studies have focused on coeliac disease, specifically the comparison between gluten-free and gluten-containing products, so this study is adding new knowledge to the evidence base.
Scope of analysis
The FHS cohorts used for analysis across England, Wales and Northern Ireland are:
- Food Allergy (FA): Adults above 18 years old that reported living with a food allergy
- Coeliac Disease (CD): Adults above 18 years old that reported living with coeliac disease
- Food Intolerance and Other (FIO): Adults above 18 years old that reported living with food intolerance or other suspected (undiagnosed) FHS (footnote 2)
Further in-depth analysis of these cohorts revealed that approximately 92% of reported coeliac disease cases indicated that their diagnosis was as per NHS guidelines (blood test and/or gut biopsy). Additionally, approximately 90% of food allergy cases reported that their diagnosis was according to recommended NHS guidelines (skin prick test, oral challenge, blood test or a food elimination diet). Notably, both of these cohorts also included non-NHS recognised diagnosis methods (approx. 8% and 10% for CD and FA, respectively).
Methodology
An evidence review was initially completed to scope out and inform the design of the methods used. Additionally, interviews were conducted with people (some interviewees also responded on behalf of their children) living with FHS to inform the development of an online survey examining the direct and indirect costs borne by adults with FHS. The online FHS survey received 1,225 responses from households with an adult that has FHS. The comparator survey (non-FHS group household survey), received 1,530 household responses all of which were from adults. The model was then developed using statistical tests and multivariate regression models, applying the data collected from both surveys.
Key findings
The results of this study show that adults with FHS, regardless of their FHS condition, face an increased financial burden compared to the non FHS group. This study found that compared to households without FHS, on average an FHS household spends an additional 12% - 27% more on weekly food purchases.
In addition, on average FHS households:
- spend £15.22 on monthly medical costs, to manage the symptoms of their condition
- loses approximate 3 paid workdays and 4 unpaid days per year, due to their FHS condition
- spend 40.37 days per year on FHS-related activities including researching, shopping for suitable items and discussing their FHS condition
Broken down by FHS groups, those in the FA group face the highest overall burden, followed by FIO and CD, respectively. The key costs contributing to the higher total cost for the FA group included:
- eating out and takeaway costs for those with FA are 11% more than those with CD
- average monthly medical costs for those with FA are approx. 1.6 to 2.5 times more than those with FIO and CD
This report provides estimates for the financial costs to individuals with an FHS condition however, it does not represent the full cost. The pursuit of safe, allergen-free food environments can lead to social isolation, depression and/or anxiety which pose further costs to individuals that have not been monetised in this study (footnote 3). A further and more detailed cost breakdown by FHS condition is summarised in the dashboards below.
Findings
Direct costs: food consumption costs of FHS adults relative to non FHS adults in England, Northern Ireland, and Wales

Note: Weekly groceries costs are costs on any food and non-alcoholic beverages bought from a store/supermarket. This is the primary outcome measure.
Additional direct and indirect financial costs borne by FHS adults living in England, Northern Ireland and Wales.
Limitations
Whilst this study adds new analysis to the evidence base, there are however several limitations.
- The data is subject to recall bias (the survey ran between November 2020 to January 2021 and respondents were asked to recall their pre-covid costs).
- The FHS household survey was disseminated via the partner charities which could have resulted in sampling bias as other members of the population (i.e. adults with FHS that may not be members of any of our partner charities) were excluded. However, this was done to increase outreach to people living with FHS and maximise sample size for robust statistical analysis. The FHS household survey was largely completed by females (79% of responses) whereas the comparator household survey was more representative of the population (52% of respondents are female). This risk of bias was addressed by a sensitivity analysis.
- Another limitation is that kitchen equipment costs were monetised by deriving a UK high street average price for all the pieces of equipment named by respondents.
- Additionally, with the propensity score matching, we were unable to achieve ‘perfect’ matching which means the matched FHS survey respondents and non-FHS group respondents are not balanced on all demographic and household characteristics. However, the matching method which gave an almost ‘perfect’ matching while maintaining a large enough sample size was chosen. These limitations are further discussed in Chapter 9 of the report.
Conclusions
The quantitative data shows unequivocally that adults with FHS, regardless of their FHS condition, face an increased financial burden compared to the non FHS group. These costs not only arise from higher food costs, but also higher medical costs (for example, nutritional supplement costs, prescription medication costs, specialist medical costs) (footnote 4) and lost working/ personal time due to illness and medical appointments, that further increases this burden.
Broken down by FHS groups, those in the FA group face the highest burden, followed by FIO and CD, respectively. This is contributed by those in the FA group having approx. double the eating out / takeaway costs, 1.6 to 2.5 times more in medical costs, and up to a third more in the cost of personal time (including unpaid days lost and extra time lost due to research, planning etc.) compared to FIO and CD. This however is not the full picture, as the pursuit of safe, allergen-free food environments, can lead to social isolation and depression or anxiety.
There is scope for future research that builds on this study’s findings. Innovative data collection methods such as big data observations on actual consumer transactions, could enable cost comparisons at a granular level. However, such a study would be challenging to design and gain consent for (since researchers would need to collect individuals’ demographic and FHS data alongside expenditure data).
With growing awareness of FHS among food producers/retailers and society, a longitudinal study across multiple time periods that considers the impact of changing attitudes and food environments across time on cost differentials would be an interesting area of research. Other future work could also include examining adults versus parents of children with FHS or studies examining the impact of different FHS conditions on different socio-demographic groups. In addition, the cost of managing an FHS condition compared to other health conditions such as diabetes would provide useful insights into the relative burden of FHS.
-
These are point estimates from the FSA’s Food and You 2 Wave 3 Survey. The 95% upper and lower confidence intervals for each of the FHS conditions are as below: Food Allergies 600,000 (lower). 900,000 (upper), Food Intolerance: 1m (lower), 1.4m (upper), Coeliac Disease: 200,000 (lower), 400,000 (upper).
-
The symptoms of food intolerance are similar to many other conditions, making it hard to distinguish, it’s likely that a reported food intolerance may be another condition. The accurate identification of conditions and the proportion of food intolerance to other FHS conditions is unclear which is a caveat of this grouping.
-
The University of Manchester was commissioned by the FSA to conduct research: Impacts of Food Hypersensitivities on Quality of Life (QoL) in the UK and Willingness to Pay (WTP) to Remove those Impacts (September 2022) - to elicit monetised economic values. The study applied an established stated preference approach to identify people’s Willingness to Pay (WTP) to remove the symptoms caused by living with FHS in the UK, specifically the day-to-day management of these conditions and the associated inconveniences (social isolation, depression and/or anxiety.
-
Overall, 84% (n = 1,030) of people living with FHS indicated in the FHS online survey say that they do not have private healthcare
The Food Standards Agency (FSA) commissioned RSM UK Consulting (RSM), Dr Audrey DunnGalvin from University College Cork, and Alizon Draper from the University of Westminster, to carry out a study into the financial burden of living with a food hypersensitivity (FHS) in August 2020. The FSA was established in 2000 as a non-ministerial government department and is responsible for protecting public health in relation to food safety in England, Wales, and Northern Ireland. This includes responsibility for allergen labelling and providing guidance to consumers with food allergies, food intolerance and coeliac disease.
1.1 The research programme context
This study is part of a wider research programme being conducted by the FSA. The programme which is part of the FSA Food Hypersensitivity Strategy 2019-2025 aims to increase consumer trust in the information provided to food hypersensitive consumers and through effective enforcement creating confidence, so individuals can make informed choices in their daily lives. Current projects include (but are not limited to):
- a study on the willingness to pay (WTP) and quality of life impacts of FHS. This research will provide data on the management and impacts of FHS on daily lives and monetary valuations for both the financial costs and non-financial costs (pain, grief, and suffering)
- exploratory work on a Food Allergy Safety Scheme to improve choice for the hypersensitive consumer by raising allergy management standards in the food service sector
- the FOODSENSITIVE study, led by Aston University, which seeks to understand how FHS impacts people’s quality of life. Methods involve two surveys. One survey was designed to capture data on behaviours, attitudes, and quality of life for adults and children. The second survey is designed to capture intangible costs of living with FHS. RSM collaborated with a researcher from the study to plan the timing and content of the study household surveys, to ensure alignment and complementarity with our work
The overarching objective of this research project is to identify and capture all relevant financial (direct and indirect) costs associated with the burden of living with food hypersensitivity, specifically the day-to-day management of food allergies, food intolerance, and coeliac disease i.e. to capture the financial burden of maintaining a symptom-free state. Results from this work will contribute to the development of the FSA’s Cost-of-Illness (COI) model for food hypersensitivities, which aims to capture the overall economic burden related to food allergies, food intolerances and coeliac disease.
The study aims to quantify and monetise the financial burden imposed on adults with FHS through the day-to-day management of the physical risks associated with food allergies, food intolerance and coeliac disease, by:
- comparing the price differentials paid for food between FHS households and non-FHS households
- valuing the direct costs incurred through efforts to manage FHS and remain symptom-free (for example, medical and kitchen supplies)
- monetising indirect costs incurred when having to deal with an FHS condition (for example, lost working days)
This study is unique in terms of estimating price differentials for food consumption across different types of FHS (food allergy, food intolerance, coeliac disease) and then comparing them to a non-FHS group. Previous studies have focused on coeliac disease and gluten-free products only, so this study is adding new knowledge to the evidence base.
This study includes three FHS cohorts in England, Northern Ireland, and Wales:
- Food Allergy (FA): Adults above 18 years old that reported living with a food allergy
- Coeliac Disease (CD): Adults above 18 years old that reported living with coeliac disease
- Food Intolerance and Other (FIO): Adults above 18 years old that reported living with food intolerance or other suspected (undiagnosed) FHS
After further in-depth analysis, it was discovered that approximately 92% of reported coeliac disease cases indicated that they were diagnosed by NHS guidelines (blood test and/or gut biopsy). Additionally, approximately 90% of food allergy cases reported to be diagnosed according to NHS guidelines (skin prick test, oral challenge, blood test or a food elimination diet. Both cohorts also included methods of self-diagnosis (approx. 8% and 10% respectively).
1.2 Report structure
The rest of the report is made up of nine chapters:
- Chapter 2 explains the methodological approaches used in the study
- Chapter 3 summarises the rapid evidence assessment that was conducted in the initial stages and used to inform survey development
- Chapter 4 summarises the findings from the semi-structured interviews that were conducted in the initial stages and used to inform survey development
- Chapter 5 presents the food consumption costs comparison findings from the quantitative research survey
- Chapter 6 presents the non-food direct costs findings from the quantitative research survey
- Chapter 7 presents the findings of the indirect costs from the quantitative research survey
- Chapter 8 details other findings from the quantitative research survey that were not cost-related
- Chapter 9 sets out a discussion of the findings, limitations, and conclusions of this study
2.1 Overview of methodology
This study uses a price differential approach, comparing the household food consumption costs for an FHS group versus a non-FHS group, to understand the additional financial burden faced by people with FHS. Additionally, other direct/ indirect costs incurred due to FHS were collected for the FHS households. The identification of such costs provided the study with a wider perspective that extends beyond the healthcare sector. Intangible costs, such as quality of life impacts, were out of scope for this study. The three main data collection activities are summarised below in Figure 2.1 (surveys are anonymised):
Figure 2.1 Project stages and methods for the examination of Direct and Indirect Costs associated with FHS

2.2 Scoping and design activity to understand existing research, methodologies and inform survey questions
2.2.1 Rapid evidence assessment
RSM conducted a rapid evidence assessment (REA) on the financial burden of restricted diets for individuals with FHS (see Appendix 1). The aim was to identify existing research on the cost of living with FHS, to understand methodologies used and their findings to inform the research design. Evidence was reviewed from four sources:
- research and literature recommended to us by the FSA team and our expert advisors
- searches of relevant academic literature databases
- grey literature
- national statistics on food consumption patterns
A search protocol was developed to guide the academic literature database searches (available in Appendix 2). Studies were screened for relevance and findings against the four research questions were extracted:
- what are the costs incurred by people living with FHS?
- what are the burdens of living with an FHS more generally?
- what research has been done in related areas on price differentials/representative ‘baskets of goods’ between groups?
- what statistics are available on food consumption patterns and costs among groups?
Intelligence gathered from the 107 studies was used to inform the design of the household survey questionnaire. Details on papers screened and included at each stage of the REA is summarised in the Prisma method diagram below.
Figure 2.2 PRISMA diagram

Note: Records were excluded because they did not meet the inclusion/exclusion criteria specified in Appendix 2. This could be due to studies not being in the scope of the research question, not within specified language and time of publication, or conducted in a non-OECD country.
2.2.2 Qualitative research: interview with people living with FHS (n=22)
Online interviews were completed with a sample of people living with FHS to inform the content of the household survey questions in August and September 2020. Semi-structured topic guides were developed after the REA was completed, to aid discussion with people living with FHS. All interviews lasted between 45 minutes to an hour. Topic guides were further refined following the pilot interviews (see Appendix 3). The three FHS charities (Allergy UK, the Anaphylaxis Campaign and Coeliac UK), recruited those living with FHS to take part in these interviews with RSM researchers.
Interviews were carried out with 20 respondents (all adults):
- 13 people living with FHS (CD=5 and FA=8)
- 1 person living with FHS who is also the parent of a child with FHS (FA=2)
- 5 parents responded on behalf of their child with FHS (FA=5)
- 1 parent who responded on behalf of their two children with FHS (FA=2)
In total, there were therefore 22 observations on people living with FHS including 14 adults and 8 children. Table 2.1 outlines the main demographics for this group, including gender, ethnicity, and age. The interviews focused on food consumption habits; identifying areas of financial burden; and capturing common adjustments made to lifestyle to manage FHS.
Table 2.1 Socio-economic characteristics of people living with FHS from the interviews used to inform household survey questions to calculate direct and indirect costs associated with FHS (n=22)
| Gender | Percentage of socio-economic characteristics |
|---|---|
| Male | 13 (59%) |
| Female | 9 (41%) |
| Race | Percentage of socio-economic characteristics |
|---|---|
| White British | 14 (64%) |
| Black British | 1 (4.5%) |
| White European | 1 (4.5%) |
| Indian | 1 (4.5%) |
| Mixed | 1 (4.5%) |
| Prefer not to say | 4 (18%) |
| Age group | Percentage of socio-economic characteristics |
|---|---|
| 0 to 4 | 2 (9%) |
| 5 to 9 | 3 (14%) |
| 10 to 14 | 3 (14%) |
| 15 to 19 | 1 (5%) |
| 20 to 29 | 4 (18%) |
| 30 to 39 | 1 (5%) |
| 40 to 49 | 2 (9%) |
| 50 to 59 | 1 (5%) |
| 60 to 69 | 5 (23%) |
2.3 FHS Household survey
Using intelligence from the REA and the qualitative interviews (n=22 people living with FHS) mentioned in Section 2.2.2, an anonymous online survey questionnaire was developed for households with people living with FHS. The survey questions were designed to capture details of each respondent’s condition (problem foods, length, and type of diagnosis, severity of reaction) and standard demographic / household composition data. A series of questions were asked about the financial burden of managing FHS and routing was used to ensure respondents were only asked relevant questions.
The survey collected both direct costs (spend on food shopping, takeaways and eating out, medical and kitchen equipment) and indirect costs (paid and unpaid days lost due to illness and appointments).
The survey was disseminated in November 2020 via the partner charities using membership email lists, social media channels, and websites; and ran until January 2021. The FSA and RSM also used social media to promote the survey. As the survey was open to all UK residents, responses were received from Scottish households (which is outside the FSA’s jurisdiction). It is not known how many people were invited to complete the survey and respondents were not compensated for taking part.
2.3.1 Breakdown of FHS household survey respondents (n=1,225)
A total of 1,559 complete responses from the FHS household survey were received but only 1,225 responses were used for analysis. This is because responses where the primary person living with FHS is below 18 years old and / or is from Scotland were removed for easier comparison with the non-FHS household survey which did not include responses from these categories as these categories were excluded (footnote 1). The FHS household survey had responses from Scottish households as it was open to Scottish households (because the FHS charities operate across the UK). However, only a total of 1,225 complete responses were used for analysis, with each response representing a unique household of an adult (>18 years) who reported to have FHS.
Of the 1,225 responses, 25% (n = 305) reported that their households had more than one person with FHS (other than the primary respondent). Furthermore, 14% (n = 176) stated that the primary person with FHS in their household had more than one FHS condition.
Coeliac disease made up the highest proportion of total responses (53%, n = 651) (footnote 2). Given that the coeliac population in the UK is the smallest of the three cohorts (estimated at 300,000 compared to 800,000 thousand with food allergy and approximately 1.2 million with food intolerance and other FHS conditions (footnote 3)), it is possible that the high response rate from the coeliac population is due to greater promotion of the survey by Coeliac UK or higher motivation to engage among this cohort.
As mentioned, the FHS household survey ran between November 2020 and January 2021. Although the survey asked for typical food consumption costs pre-Covid-19, concerns were raised by the study team and the FSA around the potential impact of the Christmas period on food consumption responses. To address these concerns, food costs were compared for responses submitted in the pre-festive period (19/11/2020 to 18/12/2020) against responses in the festive period (19/12/2020 to 03/01/2021). Reassuringly, no statistically significant differences in food consumption costs between the two periods were found (footnote 4). Figure 2.6 below summarises the breakdown of FHS respondents.
Figure 2.6 Summary dashboard for the FHS household group survey (n=1,225) conducted between November 2020 to January 2021

2.4 Non-FHS group household survey
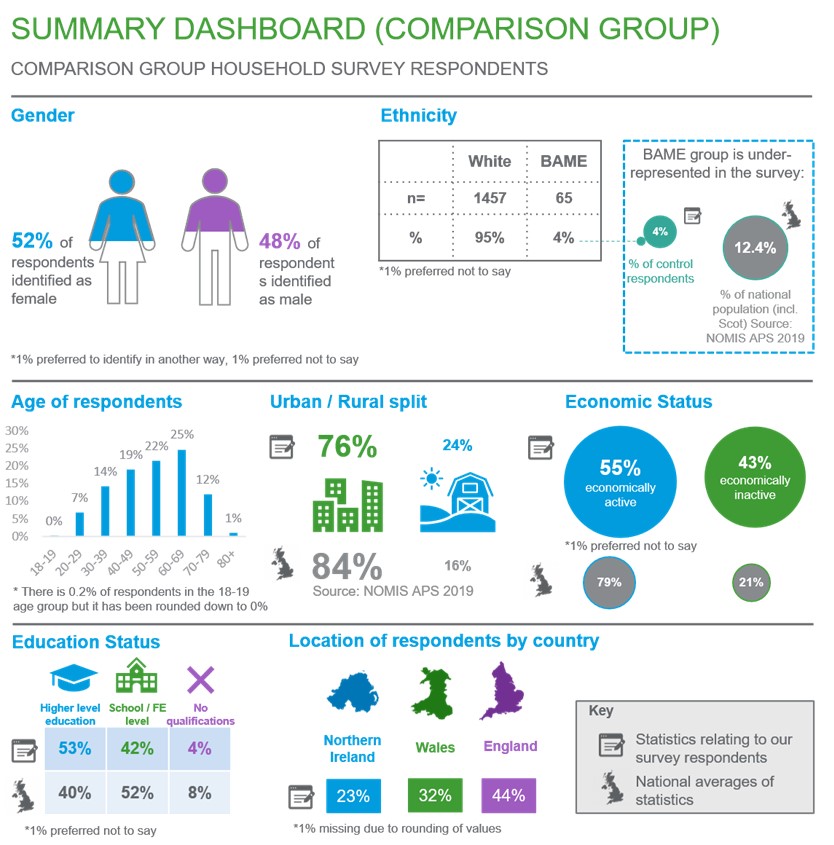
BMG Research was commissioned to survey non-FHS households, on their food costs (food spend, takeaway and eating out). Respondents were recruited from panels using demographic criteria to represent the national population and each respondent was compensated to take part. The survey questionnaire was much shorter than the FHS survey and only collected demographic information and food consumption costs.
2.4.1 Breakdown of non-FHS group household survey respondents (n=1,530)
The survey ran between November and January 2021. In total, 1,530 completed responses were received. Due to the sampling and panel recruitment approach, respondents were more representative of the national population than the FHS household survey. Figure 2.7 below summarises the breakdown of non-FHS respondents.
Figure 2.7 Summary dashboard for the non-FHS (adult) group survey n=1,530) conducted between November 2020 and January 2021
2.5 Model and analytical approach for analysis of FHS and non-FHS household survey
For further information on the full statistical approach used including models developed and tests used, please see Appendix 6.
2.5.1 Data cleaning
Our data cleaning processes ensured consistent levels of data quality across FHS and non-FHS households and removed implausibly high outliers, using the boxplot method. A boxplot diagram has quartiles and inter quartiles which define the upper and lower limit and any data points beyond these limits can be considered as outliers. Outliers were only present in the FHS household survey and the breakdown of specific outliers for each cost as well further details about their removal can be found in Appendix 6. Additionally, analysis was conducted for food consumption costs with and without outliers and the results were similar overall except for the comparison of FA with non-FHS when we comparison of CD with non-FHS when weekly groceries costs were used (footnote 5). However, the outliers are likely to be measurement errors that will overinflate the estimates, they have been removed from the main analysis. The results with outliers can be found in Appendix 7.
2.5.2 Food consumption cost comparators
Data from both FHS and non-FHS household surveys were used for cost comparator analysis of household food consumption. To do this, a model was developed controlling for household composition and size, income level, education status, and other variables, to assess price differentials for the following food consumption costs:
- weekly groceries costs: Weekly costs on any food and non-alcoholic beverages bought from a store/supermarket (excluded eating out/takeaway costs). This is the primary outcome measure
- monthly eating out / takeaway costs: Monthly costs on food and beverages bought from restaurants, cafes, etc. This cost was converted into weekly costs for the primary analysis for consistency.
There were several missing data points for a few control variables and for one of the outcome variables, monthly eating out / takeaway costs (footnote 6). The missing data was dealt with using a combination of Multiple Imputation (MI) and the missing indicator method, which is an approach used for data that is not missing at random. The specific proportion of missing data and description of methods are detailed in Appendix 6.
Propensity score matching (PSM) was used to reduce any underlying differences between households/survey respondents that could potentially introduce bias when comparing food consumption costs in FHS and non-FHS households. PSM was performed for each type of FHS (FA, CD, and FIO) with the non-FHS group and for each type of food consumption cost. The balance statistics can be found in Appendix 10. PSM was applied using the “nearest neighbour” method which matches the closest eligible non-FHS unit to the FHS unit. Matched pairs of similar participants were selected (one from the relevant FHS group and one from the non-FHS group). The logit of the propensity score was used as the matching scale with a caliper width equal to 0.2 of the standard deviation of the logit of the propensity score, in line with the recommendations of Austin (2011) (footnote 7). Variables used in deriving the propensity score are similar to the demographic and household characteristics used in the multivariate regression which are:
- household size
- household income
- region
- gender
- education
- age
- ethnicity
- geography
- place of shopping (for example, large supermarket / online / specialist shops) – only for weekly grocery costs
- frequency of eating out – only for monthly eating out / takeaway costs
The propensity score matching resulted in smaller sample sizes for each FHS types as a consequence of selecting only participants who matched the non-FHS group and who contributed to achieving an overall covariate balance across groups. The final sample size of each dataset can be found in Chapter 5.3. To ensure that the most optimal matching parameters were selected for the PSM, a brief assessment of different matching methods was performed and is detailed in Appendix 7.
Multivariate regression analyses were performed for all three costs. The regression model used is a Gamma model with a “log” link. More detailed explanations on why this model was chosen can be found in Appendix 6. For each regression analysis, a separate analysis was performed using three datasets:
- dataset A: consisting of information from those in the FIO category and the non-FHS group
- dataset B: consisting of information from those with CD and the non-FHS group
- dataset C: consisting of information from those with FA and the non-FHS group
This generated estimates for the extra costs paid by each of the FHS groups compared to the non-FHS group, with results presented in Chapter 5.3.
2.5.3 Other direct costs for people living with FHS/FHS households
Direct costs were assessed for the three FHS cohorts and presented as average costs for each group. Questions on these costs were not asked of the non-FHS cohort because it was not relevant to them. All analyses focused on cost estimates for the following items:
Kitchen equipment: FHS households were asked to name items of additional kitchen equipment purchased to avoid cross-contamination of food prepared for FHS households. The items were coded into categories by analysts (for example, separate toaster, separate chopping board). These items were monetised using an average UK high street shopping price in 2021, with the assumption that these items were purchased in the last two years before the survey took place and that prices did not significantly fluctuate within these years. For items , such as having a separate preparation area or separate storage, these were assumed to be of zero cost as it is likely that households had existing storage space or preparation areas.
Medical costs: People living with FHS were asked to provide three costs for medications/ medical equipment. These costs were consolidated to give total monthly medical costs. The three costs are:
- nutritional supplement and/or over the counter medication costs
- prescription medication costs (for example, adrenaline auto-injectors, antihistamines, and corticosteroids)
- specialist medical costs (for example, medical bags and, inhalers)
The averages of the costs above are presented in Chapter 6.
Additionally, multivariate regression analysis was conducted to assess the difference in outcomes between the three FHS cohorts but as these are beyond the scope of the research question, these are not presented in the main paper. The full methodology used for the regression analysis can be found in Appendix 6 and the results in Appendix 7.
2.5.4 Indirect costs for people living with FHS
The third stage involved monetisation of the indirect costs by each FHS group, which included:
Days lost from paid work due to FHS: People living with FHS were asked how many days of absence from paid work they had taken in the past year due to FHS.
Days lost from unpaid work due to FHS: People living with FHS were asked how many unpaid days they had lost in the past year due to FHS. Unpaid work includes days spent on education, training, voluntary work, lost leisure time, caring for others, and housework time.
Extra time spent on food shopping/ planning/ FHS education due to FHS: People living with FHS were asked how many hours per week they spent on:
- time on food shopping per week
- time on planning food shop and reading food labels per week
- time to travel further for food shopping per week
- extra time on planning and preparing for eating out/takeaways per month
- extra time on planning and preparing for visiting/hosting friends and family per month
- time spent on research, training or education related to FHS per month
- time spent educating/informing other people about FHS per month
This information was consolidated to provide the total extra time spent per week on activities related to FHS. Questions on the time spent were not asked of the non-FHS cohort because it is not relevant to them as these are days lost / time spent due to FHS.
The time estimates were valued using secondary wage data. Days lost from paid work due to FHS were monetised by multiplying with the UK’s 2019-2020 annual median income of £29,900 (ONS, 2021) (footnote 8). Unpaid work and time spent on food shopping etc was monetised using the 2021 National Living Wage of £8.72 (GOV.UK, 2020) and the range of National Minimum Wages to provide a range of monetised costs. Different sources were used to monetise paid and unpaid work because they are not considered equivalent to each other. Additionally, there have been papers citing the use of hourly minimum wage to measure unpaid work (Care work and care jobs for the future of decent work, ILO 2018). Although there is an ONS designed Unpaid Work calculator which calculates the value of each type of unpaid work (for example, childcare, housework, transport, etc), it was inapplicable to this study as the survey aggregately asked respondents how many unpaid days they had lost due to FHS, rather than the individual categories of unpaid work in order to reduce the response burden on participants. The averages of the costs above are presented in Chapter 7.
Additionally, multivariate regression analysis was conducted to assess the difference in outcomes between the three FHS cohorts but as these are beyond the scope of the research question, these are not presented in the main paper. The full methodology used for the regression analysis can be found in Appendix 6 and the results in Appendix 7.
2.5.5 Sensitivity analysis
Heterogeneity of FHS effects
Due to the very high response rate from females compared to males in the FHS household survey (79%) sensitivity analysis was conducted to address potential response bias and effect modification. In addition to adjusting for any confounding effect of gender, a model with interaction effects was constructed to assess whether the cost differentials between FHS types and non-FHS varied between females and males.
To explain, FHS_Presence is the exposure variable consisting of either one of the three FHS groups (FIO, CD, or FA) and the non-FHS group. An interaction term of gender*FHS_Presence, was created for all food consumption cost models.
Multivariate regression using a fully adjusted model was then performed for food consumption costs in all datasets with the addition of the interaction term. If the coefficients of the interaction terms are statistically significant at the 95% confidence level, this indicates that there is a difference in the effect of FHS presence on costs between genders. The sensitivity analysis found no differences in FHS presence on food consumption costs between genders.
Modelling of missing data
The final model presented in the main analysis was originally run with five imputations. In general, two to 10 imputations are usually sufficient for the efficiency of point estimates however, a higher number of imputations may be needed for standard errors that would not significantly change if data was imputed again (von Hippel, 2018). Thus, the analysis for the food costs was run separately with imputations of 10, 20, 40, and 100 times to check the sensitivity of the results to different numbers of imputations (a pragmatic form of iterative multiple imputations). The results (described in Chapter 5.4.2 and presented in Appendix 7) remained stable even as the number of imputations increased from five to 100.
-
Under 18s were excluded from the non-FHS household survey as the only cost figures that were asked about were for household spending on food costs, thus it makes sense that respondents are adults and not children.
-
In addition, we received a total of 611 partial survey responses across all FHS groups which were not analysed due to missing cost data
-
Prevalence figures obtained from Food and You 2 Wave 3 data provided by the FSA.
-
A student’s t-test was performed to test for significant difference in costs between the two periods.
-
There were only 4 outcome / FHS type combinations with outliers removed
-
The specific number of missing observations are detailed in Appendix 6.
-
Austin P. C. (2011). An Introduction to Propensity Score Methods for Reducing the Effects of Confounding in Observational Studies. Multivariate behavioural research, 46(3), 399–424. https://doi.org/10.1080/00273171.2011.568786
-
Average household income, UK - Office for National Statistics (ons.gov.uk)
The first part of the study involved a REA focused on a set of priority research areas. Findings were used to inform and influence the design of the primary research methodology and the cost model developed. Detailed findings and a full reference list of the included studies are presented in Appendix 1.
3.1 Research questions of interest for the REA
Research question 1: What are the costs incurred by people living with a food hypersensitivity?
Research question 2: What are the burdens of living with a food hypersensitivity more generally?
The REA identified a small body of research on the costs, and general burdens, of living with an FHS.
On food costs, the research suggested that the cost of restricted diets is greater than unrestricted diets, and thus places a financial burden on individuals with FHS. Most of this research, however, was focused specifically on coeliac disease and the comparison of GF products with gluten-containing products. All studies that used a basket of goods type approach were for GF diets apart from one study on the six-food elimination diet. This specific diet is required for eosinophilic esophagitis and excludes food allergens such as dairy, wheat, eggs, soy, nuts, and seafood. There were few studies looking across the breadth of FHS.
On non-food costs, there were a variety of areas in which a higher cost or burden was identified for FHS. This included lost productivity, job-related opportunity costs, and time spent on food shopping and preparation. Restrictions, which impose a burden but not necessarily a financial cost, were found for eating out and socialising (restricted choices, avoidance of events) and travelling (restrictions on holidays). Health and wellbeing impacts were also considerable, although that was out of scope for this study (footnote 1).
Research question 3: What research has been done in related areas on price differentials/representative 'baskets of goods' between groups?
Studies looking at the cost or burden for other chronic conditions and disabilities were also reviewed. There was a significant body of relevant research, but it predominantly focused on three elements: direct medical costs, indirect productivity costs (both of which were in scope for this study), and intangible costs, for example, quality of life impacts (which were out of the scope of this study).
Research question 4: What statistics are available on food consumption patterns and costs among groups?
Direct non-medical costs were seldom reported in the literature. Additionally, no studies were found which attempted a price differential or representative basket of goods approach which this study is focused on.
The REA also looked for existing statistics on food consumption in the UK, which could be used to compare against the amount paid by individuals with FHS. The main source for food expenditure data in the UK is the ONS Living Costs and Food Survey (footnote 2), and some useful information is provided from the FSA’s Food and You Survey Wave 4 (footnote 3).
3.2 How the REA informed the FHS survey in this study
The methodology was designed based on the evidence of what had worked in previous relevant studies.
Direct surveying was identified as the most appropriate method for collecting information on the burden of FHS. Although relying on individuals to report their food consumption habits may be limited by recall bias, the method allows for the calculation of an average price differential for a more heterogeneous group of people living with FHS (for example, coeliac disease, food allergy or food intolerance and other undiagnosed FHS conditions) versus those who are not. The survey directly asked respondents to estimate their average weekly food shop cost as the primary measure for estimating food consumption cost differentials. This approach is suited to producing an estimate of the price differentials between people living with FHS on restricted diets and people on non-restricted diets, breaking this down by factors such as type and severity of FHS. The price differential also considers the effect of socio-economic and demographic factors on the relationship between price and type/ severity of FHS.
The literature also highlighted that asking survey respondents to complete a food diary was a useful secondary method for understanding information on a representative basket of food items; that could be compared between FHS groups and comparator households. Data and results for food diary costs is appended and weekly grocery costs is used as the primary measure for analysis. Additionally, only 45.7% (n = 577) of FHS household survey respondents completed the weekly food diary costs, while 100% (n = 1,530) of non-FHS group households completed it. Due to the discrepancy in response rates, it is not ideal when comparing food diary costs between FHS and non-FHS households. The survey questionnaire and the food diary is available in Appendix 4 for FHS households and Appendix 5 for non-FHS households. Although there were precedents in the literature, it should be noted they used much narrower subsets, for example, coeliac disease and gluten-free products.
The literature and qualitative research highlighted that non-food costs could be collected in the FHS household survey through direct questions, on:
- lost productivity
- job-related opportunity costs
- health and wellbeing
- time spent on food shopping and food preparation
- eating out and socialising
- travelling
-
This will be captured in the FOODSENSITIVE study.
-
ONS (2020) Family spending in the UK: April 2018 to March 2019
Online interviews were completed with 22 people living with FHS (or their carers) to inform the development of the survey questions. Interviews allowed the study team to discuss consumption habits and adjustments made due to FHS in detail and resulted in the identification of common areas of the financial burden for people living with FHS. The interviews were then analysed, and the findings are grouped thematically in the subsections below (the topic guide is available in Appendix 3).
4.1 Main findings from the online interviews
4.1.1 Preparing food
Ownership of personal utensils and other separate kitchen equipment were mentioned by interviewees as essential for preparing food and avoiding cross-contamination, and that these needed to be replaced regularly. One interviewee said they carry their own set of cutlery when eating outside the home. Another said they spend considerable time on cooking everything from scratch because processed food products contain more ingredients and are riskier. Another interviewee said they must cook separately from their family, buy substitutes, and spend time adjusting recipes to ensure meals are safe to eat.
4.1.2 Reading food labels
People living with FHS (or their carers) were asked about their normal shopping habits and the time spent on grocery shopping. These questions prompted interviewees to describe their shopping routine and a few mentioned reading food labels as a particularly time-consuming activity that increases the time spent on food shopping. One person said they can spend up to two hours at a grocery shop just checking labels. Another said it takes up to three hours to do a grocery shop because half of that time is spent reading labels.
Two interviewees said they must visit multiple stores to buy their preferred allergen-free products. Another said they prefer to shop at one supermarket chain but visit another chain to purchase bread (this person avoids another large supermarket chain due to perceived poor labelling). One interviewee said they shop online because it takes less time, while another interviewee avoids online shopping because food labels can be inaccurate/ incomplete. Food purchased online is at higher risk of being wasted than food purchased in store as its safety can only be checked on delivery.
Three interviewees said they were concerned about labelling legislation and ‘that it does not go far enough’. They highlighted the limitations of the 14 main allergens for mandatory labelling. Labels for allergens outside this list (eg chickpeas, pea) can be poor and dog food (transferred by touch) can cause allergic reactions as these products do not have to comply with mandatory allergen labelling. One interviewee expressed concern about the impact of the UK exiting the EU on allergen labelling and food safety.
A reoccurring theme was the constant change in product ingredients. People living with FHS cannot repeat buy ‘safe’ processed products without checking the labels first. One interviewee provided an example of a leading brand of sunflower spread that was previously safe but changed the formula to include their child’s allergen.
4.1.3 Takeaway
Two interviewees said they do not order takeaways because they do not trust food business operator staff to manage allergen exposure. Another interviewee avoided takeaways after needing to attend A&E, following food contamination with an allergen.
4.1.4 Holidays
Most interviewees reported that holidays were a major source of concern and stress, especially those with children with FHS. This topic was raised unprompted by most interviewees. They emphasised the additional financial cost and lost time, as well as the anxiety involved.
Flying is a concern for individuals who are at risk of a severe reaction. One interviewee said they do not fly, because they cannot risk a fellow passenger opening a bag of nuts. Another interviewee said the risk of anaphylaxis co-factors when flying is too high and so they avoid it. One interviewee explained the difficulties in getting airlines to make allergen warning announcements on board. The burden falls on the person living with FHS to repeatedly ask for the announcement and negotiate with the cabin crew.
Three interviewees prefer self-catering holidays so they have more control of food preparation, but this can be more expensive than holiday packages with fully inclusive food options while another participant said they avoid hotel buffets. Some opt for large hotel chains because they perceived them to be safer and more accountable. One person said they take food from home and do not eat out on holiday.
A few interviewees said they spend a lot of time researching the destination to assess food safety before travel. Interviewees said they research allergen policies and hotel protocols, local hospital provision, and suitable catering options. Two interviewees said they have decided not to travel after completing research due to uncertainty and risks. Language barriers were also a concern for those travelling with FHS. One interviewee shared their experience of explaining their allergies to the hotel staff and being served food containing allergens anyway.
4.2 Implications for the study from the interviews
Table 4.1: Implications from the qualitative findings (interviews) for people living with FHS
| Findings | Implications |
|---|---|
| Preparing food | Cooking and food preparation are the most common sources of higher costs. We found that interviewees often buy new, separate kitchen equipment to avoid cross-contamination (for example, through utensils or chopping boards). The purchasing of separate food preparation equipment is another direct cost that needs to be accounted for in the study. Question added to the survey: Do you need to use any special or additional equipment for cooking and preparing food? |
| Reading food labels | Interviews highlighted indirect costs associated with time lost reading food labels, due to the ambiguity of labelling practices, unclear ingredient labelling, and limited availability of products with sufficient allergen information provided. The time spent on reading labels in the supermarket is considerable. Poor labelling online can increase the financial burden if products need to be thrown away after they are delivered. The experiences described by the participants in the interviews provided a rationale for a decision to include labelling in the survey and monetise the indirect costs incurred. Question added to the survey: On top of the time spent shopping, how much time do you estimate that you spend planning your food shop and checking/reading labels per week? |
| Takeaway | While the direct costs of eating out were captured in the draft survey design, takeaways were not included. During the interviews, some participants mentioned takeaways when discussing eating out. Therefore, a decision was made to combine ‘eating out’ and ‘takeaways’ into one topic. Question expanded in the survey: Takeaways added to the topic of eating out . |
| Holidays | The interviews highlighted the challenges of booking a safe holiday, particularly foreign holidays, and parents of children with FHS. They face more limited choices when choosing a destination, accommodation, and catering options. Although holidays are not essential, the time spent on researching and preparing for a holiday and choosing not to travel if it is not safe, has a detrimental impact on people living with FHS and their families. Some interviewees said it is more expensive to choose safer options, such as self-catering and overland travel to avoid flying. Higher food costs can be incurred on holidays. These findings informed our decision to include a question around the topic of holidays in our survey to capture this experience. Question added to the survey: How does the food hypersensitivity impact holidays and trips away? |
In addition to the inclusions set out in Table 4.1 above, other considerations emerged from the qualitative research which were captured by the survey:
- household size: the decision was made to ask about household size for household shopping costs in the survey to enable more accurate cost analysis
- highest level of education: a question was added on the highest level of education as a socioeconomic indicator to enable more accurate cost analysis.
5.1 Overview of food consumption cost comparisons
This chapter presents summary statistics for the three types of food consumption costs described in Chapter 2, along with findings from the multivariate regression analyses, followed by sensitivity analysis. For the results below, we refer to FIO as an FHS category, however, it is important to note that it is an imprecise categorisation that contains other undiagnosed / suspected food hypersensitivities in addition to food intolerance. Although it is important to keep this in mind, the results are still valid and can be used for comparison as long as the FIO category is similarly defined.
5.2 Summary statistics
Tables 5.1 to 5.3 below set out the summary statistics for the three food consumption costs between FHS types and the non-FHS groups, respectively. These summary statistics are presented with outliers removed (4 outliers removed for weekly groceries costs, and 1 outlier removed for weekly eating out / takeaway costs) fromthe total 1,225 responses for weekly groceries costs and eating out / takeaway costs (footnote 1). Please see Appendix 8 for full summary statistics.
The key findings are:
From Table 5.1 for weekly groceries costs:
- there are higher weekly groceries costs for those with FA (n = 339) compared to non-FHS households (n = 1,530) and the difference in means between the two groups is significant [p < 0.001]. On average, those with FA spend £25.66 per week more than non-FHS households. The annual estimated difference is then £1,334.32
- there are higher weekly groceries costs for those with CD (n = 648) compared to non-FHS households (n = 1,530) and the difference in means between the two groups is significant [p < 0.001]. On average, those with CD spend £17.87 per week more than non-FHS households. The annual estimated difference is then £929.24
- there are higher weekly groceries costs for those in the FIO category (n = 234) compared to non-FHS households (n = 1,530) and the difference in means between the two groups is significant [p < 0.001]. On average, those in the FIO category spend £23.50 per week more than non-FHS households. The annual estimated difference is then £1,222 (footnote 2)
From Table 5.2 for monthly eating out/takeaway costs:
- there are higher eating out / takeaway monthly costs for those with FA (n = 339) category compared to non-FHS households (n = 1,530) and the difference in means between the two groups is significant [p < 0.001]. On average, those with FA spend £12.98 per month more than non-FHS households. The annual estimated difference is then £155.76
- there are higher eating out / takeaway monthly costs for those with CD (n = 651) compared to non-FHS households (n = 1,530) and the difference in means between the two groups is significant [p = 0.02]. On average, those with CD spend £7.98 per month more than non-FHS households. The annual estimated difference is then £95.76
- there are higher eating out / takeaway monthly costs for those in the FIO (n = 234) category compared to non-FHS households (n = 1,530) and the difference in means between the two groups is not significant [p = 0.06]. On average, those in the FIO category spend £10.11 per month more than non-FHS households. The annual estimated difference is then £121.32.
Table 5.1 Summary statistics of weekly grocery costs for adults living with FHS (n = 1,221) and non-FHS households (n = 1,530) in England, Northern Ireland, and Wales following online survey between November 2020 and January 2021
| Statistic | FA, N=339 | CD, N=648 | FIO, N=234 | Non-FHS households N=1,530 |
|---|---|---|---|---|
| Mean (SE) | 100.41 (2.80) | 92.62 (2.12) | 98.25 (4.01) | 74.75 (38.39) |
| Difference in means per week | Comparison of FA with non-FHS: 25.66*** | Comparison of CD with non-FHS: 17.87*** | Comparison of FIO with non-FHS: 23.50*** | - |
| Difference in means per year | Comparison of FA with non-FHS: 1,334.32*** | Comparison of CD with non-FHS: 929.24*** | Comparison of FIO with non-FHS: 1,222.00*** | - |
| P-values (one way ANOVA test and Turkey Honest Significant differences) | [p < 0.001] | [p < 0.001] | [p < 0.001] | - |
P<0.05*,p<0.01**,p<0.001***
Table 5.2 Summary statistics of monthly eating out/takeaway costs for adults living with FHS (n = 1,224) and non-FHS households (n = 1,530) in England, Northern Ireland, and Wales following online survey conducted between November 2020 and January 2021
| Statistic | FA, N=339 | CD, N=651 | FIO, N=234 | Non-FHS households N=1,530 |
|---|---|---|---|---|
| Mean (SE) | 94.09 (5.63) | 92.25 (4.15) | 103.53 (5.78) | 76.99 (42.92) |
| Difference in means per week | Comparison of FA with non-FHS: 12.98*** | Comparison of CD with non-FHS: 7.98*** | Comparison of FIO with non-FHS: 10.11*** | - |
| Difference in means per year | Comparison of FA with non-FHS: 155.76*** | Comparison of CD with non-FHS: 95.76*** | Comparison of FIO with non-FHS: 121.32*** | - |
| P-values (one way ANOVA test and Turkey Honest Significant differences) | [p < 0.001] | [p = 0.02] | [p = 0.06] | - |
P<0.05*,p<0.01**,p<0.001***
5.3 Multivariate regression analysis findings
Multivariate regressions were conducted to examine the relationship between FHS type and non-FHS costs while controlling for differences in demographic characteristics. The fully adjusted model considers all available demographic and household characteristics below (reference categories are in blue):
- household size: Single, Small, Medium, reference category: Large
- household income: Low, Medium, reference category: High, Very high
- region: reference category: England, Northern Ireland, Wales
- gender: reference category: Female, Male, Other
- education: reference category: No qualifications, Entry level education (NQF Levels 1, 2, 3), Higher level education (NQF Levels 4, 5, 6, 7, 8)
- age group: reference category: 18-19, 20-29, 30-39, 40-49, 50-59, 60-69, 70-79, 80+
- ethnicity: White, reference category: BAME, Other
- geography: reference category: Rural, Urban
- place of shop: reference category: Supermarket, Online, Other specialist or independent stores (only applicable for Weekly Groceries Costs
- frequency of eating out: At least once a day, 5-6 times a week, reference category: 3-4 times a week, Once or twice a week, Once a fortnight, Once a month, Less than once a month, Never (only applicable for Eating Out / Takeaway Costs).
The headline results (statistically significant results highlighted in bold) for the comparison with non-FHS households from the fully adjusted model which control for all demographic and household variations and are from matched and imputed datasets are (footnote 3):
Weekly Groceries Costs
- those with FA (n = 339) spend 14.4% more on weekly groceries than non-FHS households (n = 1,530). For every £1 spent by the non-FHS household, those in the FA group spend £0.14 more
- those with CD (n = 648) spend 11.9% more on weekly groceries than non-FHS households (n = 1,530). For every £1 spent by the non-FHS household, those in the CD group spend £0.12 more
- those in the FIO (n = 234) category spend 15.8% more on weekly groceries than non-FHS households (n = 1,530). For every £1 spent by the non-FHS household, those in the FIO group spend £0.16 more
Weekly eating out / takeaway costs
- those with FA (n = 339) spend 26.7% more on weekly eating out / takeaway than non-FHS households (n = 1,530). For every £1 spent by the non-FHS household, those in the CD group spend £0.27 more
- those with CD (n = 651) spend 14.1% more on weekly eating out / takeaway than non-FHS households (n = 1,530). For every £1 spent by the non-FHS household, those in the CD group spend £0.14 more
- those in the FIO (n = 234) category spend 15.0% more on weekly eating out / takeaway than non-FHS households (n = 1,530). For every £1 spent by the non-FHS household, those in the FIO group spend £0.15 more
The results above are presented in Table 5.4 below together with their P-values, 95% Confidence Intervals, and their sample sizes.
Table 5.3 Multivariate regression findings: food consumption costs for adults living with FHS (sample size differs between the three food consumption costs presented, thus the specific sample size can be found in the table below) and non-FHS households (n = 1,530) in England, Northern Ireland, and Wales following online survey conducted between November 2020 and January 2021
| Costs (outcome variable) | Sample size | Difference in costs compared to non-FHS (95% CI) | P-value |
|---|---|---|---|
| Weekly groceries costs | FA + Non-FHS 448 CD + Non-FHS 826 FIO + Non-FHS 396 |
FA: 14.4% (4.6% - 25.2%) CD: 11.9% (5.2% - 19%) FIO: 15.8% (5.3% - 27.3%) |
FA: 0.003 CD: <0.001 FIO: 0.003 |
| Weekly eating out/takeaway costs | FA + Non-FHS: 440 CD + Non-FHS: 816 FIO + Non-FHS: 374 |
FA: 26.7% (6.6% - 50.6%) CD: 14.1% (1.5% - 28.4%) FIO: 15.0% (-1.1% to 33.7%) |
FA: 0.008 CD: 0.03 FIO: 0.07 |
Please see Appendix 7 for the full regression tables.
5.4 Sensitivity analysis
5.4.1 High proportion of female respondents
The sensitivity analysis was conducted to address the higher proportion of female respondents (79% of responses) in the FHS household survey and the possibility that the gender of people living with FHS could have a modifying effect on the estimated group differences. The results from the sensitivity analysis showed no statistically significant interactions between type of FHS (comparison of either FIO/CD/FA with non-FHS) and gender for all food consumption cost outcomes. Thus, the gender of people living with FHS surveyed does not have a modifying effect on the estimated group differences.
Please see Appendix 7 for full sensitivity analysis tables.
5.4.2 Multiple imputation
As described in Chapter 2.5.5, sensitivity analysis was conducted using different number of imputations (five, 10, 20, 40, and 100 imputations) for each outcome / dataset combination.
The results show that overall, there is no significant difference in estimates generated between five, 10, 20, 40, and 100 imputations (footnote 4). For example, for the comparison of those in the FIO group with the non-FHS group, the estimates generated by the different number of imputations (five, 10, 20, 40, and 100) are all ± 2.5% different from one another. This small difference in estimates generated by different number of imputations is similar for the separate comparisons of CD and FA with the non-FHS group.
A pragmatic iterative multiple imputation strategy was adopted by selecting the minimum number of imputations once satisfactory convergence had been achieved. All results from other comparisons and outcomes presented in Chapter 5.3 have been generated with 5 imputations as the results are not sensitive to changes in number of imputations. Ultimately, the key concern is that the results for the primary outcome, Weekly Groceries Costs, are stable across the different number of imputations; and the results have shown that they are stable.
The full regression tables from the different multiple imputations can be found in Appendix 7.
-
Specifics of why these outliers were removed can be found in Appendix 6.
-
This and all annual costs presented below in Chapter 5.2 is calculated by the weekly cost difference multiplied by 52 weeks / by the monthly cost difference multiplied by 12.
-
The monetary (£) figures listed below are taken from the calculations to convert individual percentage differences to population costs in Appendix 6. These calculations have inherent limitations in that assumptions are made that costs differences at the household level similarly apply to the individual level. If these monetary amounts are to be cited, please also note the limitations.
-
Imputation is the process of replacing missing data with substituted values
The average kitchen equipment and medical costs of FHS households are described below. These results are presented without 23 outliers (footnote 1) for medical costs and no outliers for kitchen equipment costs. Questions on additional kitchen equipment and medical costs due to FHS were not asked of the non-FHS group because these questions were not relevant to them.
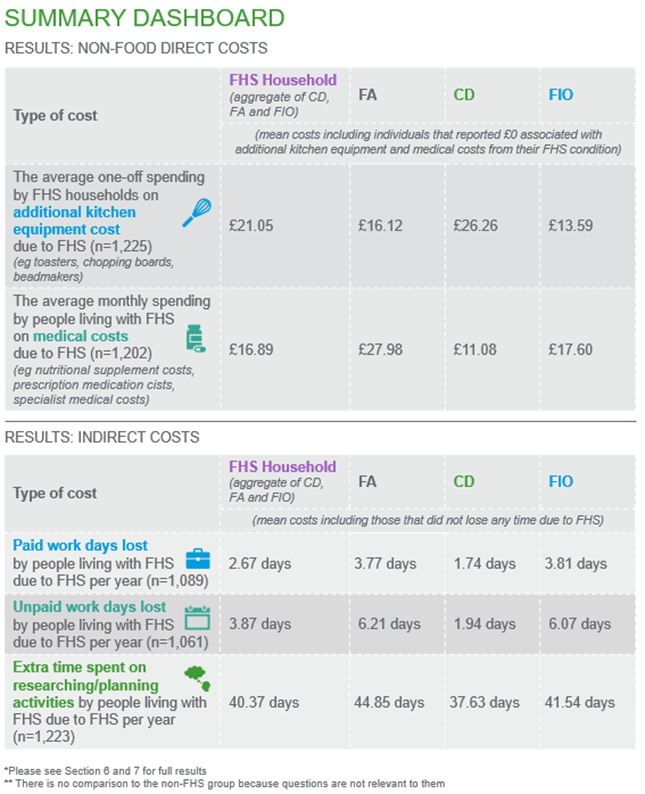
The vast majority of additional kitchen equipment was purchased to manage cross contamination risks (for example separate toasters and separate chopping boards); it was far less common to purchase equipment to make allergen free food (for example breadmakers). The average one-off spending by an FHS household on additional kitchen equipment is £21.03 p.a. However, there are 767 / 1,225 (63%) households which did not spend on additional kitchen equipment. If these observations are excluded, the average then increases to £56.234 p.a. over 458 observations. The table below shows the kitchen equipment costs broken down by type of FHS.
Table 6.1: Kitchen equipment costs due to FHS broken down by FHS type (sample sizes varies depending on exclusion of those that did not have any costs) in England, Northern Ireland, and Wales according to an FHS household survey conducted online between November 2020 and January 2021.
| FHS type | FA, n=340 | CD, n=651 | FIO, n=234 |
|---|---|---|---|
| Mean costs including those that did not spend on additional kitchen equipment due to FHS (£) | 16.12 | 26.26 | 13.59 |
| Standard error (SE) | 4.23 | 2.05 | 3.03 |
| FHS type | FA, n=58 | CD n=351 | FIO, n=49 |
|---|---|---|---|
| Mean costs excluding those that did not spend on additional kitchen equipment due to FHS(£) | 94.50 | 48.70 | 64.90 |
| Standard error (SE) | 22.39 | 3.38 | 11.95 |
The table above shows that for mean costs, including those that did not spend on additional kitchen equipment, individuals with CD spend twice as much compared to those in the FIO group and approximately 63% more than those with FA. However, that shifts when excluding those that did not spend on additional kitchen equipment. When examining only those that did spend on additional kitchen equipment, those in the FA group spend more than the other two FHS types. Although, it must be noted that the sample size for both FIO and FA have decreased more than those in the CD group once households that did not spend on additional kitchen equipment have been excluded.
The average monthly medical cost due to FHS with the exclusion of the 23 outliers is £16.89. However, there are 508 / 1,202 (42%) observations which did not have any monthly medical costs. If these 508 observations are removed, the average then increases to £29.26 over 694 observations.
Table 6.2: Monthly medical cost due to FHS broken down by FHS type (sample size varies depending on exclusion of those who did not incur costs) in England, Northern Ireland, and Wales according to an FHS household survey conducted online between November 2020 and January 2021 (footnote 2).
| FHS type | FA, n=325 | CD, n=648 | FIO, n=229 |
|---|---|---|---|
| Mean costs including those that did not have any monthly medical costs due to FHS (£) |
27.98 |
11.08 | 17.60 |
| Standard error (SE) | 13.05 | 2.31 | 1.90 |
| FHS type | FA, n=222 | CD, n=333 | FIO, n=139 |
|---|---|---|---|
| Mean costs excluding those that did not have any monthly medical costs due to FHS (£) |
40.96 |
21.56 | 29.00 |
| Standard error (SE) | 19.05 | 4.43 | 2.72 |
Table 6.2 shows that those in the FA group have £16.90 and £10.38 higher monthly medical costs than those in the CD and FIO groups respectively, when including those who had no monthly medical costs due to FHS. Looking only at those who had monthly medical costs, those in the FA group still have higher costs, £19.40 and £11.96 more in monthly medical costs compared to those in the CD and FIO groups respectively.
The average paid days lost, unpaid days lost and extra time costs of adults with FHS are described below. Results are presented without two outliers identified for extra time costs. Questions on paid days lost, unpaid days lost and extra time costs due to FHS were not asked of the non-FHS group because these questions were not relevant to them. Although these questions were asked as part of the FHS household survey, the respondents were asked to provide individual figures for them in relation to the main adult with FHS in the household. These The method used to monetise these outcomes is explained in Chapter 2.5.4.
The average number of paid days lost per year due to FHS for people living with FHS is 2.67 days. This average only includes 1,089 observations as there are 136 observations that did not provide a response. In addition, out of the 1,089 observations, there are 835 observations that did not lose any paid days per year. If these 835 observations are excluded, the average number of paid days lost per year for people living with FHS rises to 11.7 days over 254 observations. Using the annual national median income of £29,900 (footnote 1) and the average of 2.67 days, the cost of these paid days lost to people living with FHS in monetary terms (value of foregone earnings) is £307.05 per year (footnote 2).
Table 7.1: Yearly cost of paid days lost due to FHS by FHS type (n = 1,089) in England, Northern Ireland, and Wales according to an FHS household survey conducted online between November 2020 and January 2021.
| FHS type | FA, n=291 | CD, n-591 | FIO, n=207 |
|---|---|---|---|
| Average paid days lost per year including those that did not lose any paid days due to FHS (Mean costs of paid days lost per year,£) | 3.77 (433.52) | 1.74 (199.64) | 3.81 (438.89) |
Table 7.1 shows that the FIO group have £5.37 and £239.254 higher costs of paid days lost per year than the FA and CD group, respectively, when including those that did not have any paid days lost due to FHS. Both the FA and FIO group have costs of unpaid days higher than the overall average.
The average number of unpaid days lost per year due to FHS for people living with FHS is 3.87 days. This average includes only 1,061 observations as there are 164 observations that did not provide a response. In addition, out of the 1,061 observations, there are 860 observations that did not lose any unpaid days due to FHS per year. If these 860 observations are excluded, the average number of paid days lost per year for people living with FHS increases to 20.44 days over 201 observations. Using the hourly national living / minimum wage and the average of 3.87 days, the cost of these unpaid days lost to people living with FHS can be calculated. The table below sets out the costs of unpaid days lost per year depending on different National Living Wage and Minimum Wage rates. These rates correspond to the different age groups or whether it is an apprenticeship.
Table 7.2: Costs of unpaid days lost per year calculated with different National Living Wage and Minimum Wage Rates, broken down by FHS type in England, Northern Ireland, and Wales according to an FHS household survey conducted online between November 2020 and January 2021 (n = 1,061). Categorised by different age groups.
| Cost of unpaid days lost | 23 and over age group | 21 to 22 age group | 18 to 20 age group | Apprenticeship |
|---|---|---|---|---|
| National minimum living wage | £8.91 | £8.36 | £6.56 | £4.30 |
| Cost of 3.87 unpaid days lost per year for people living with FHS (footnote 3) | £275.85 | £258.83 | £203.10 | £133.13 |
| Cost of 6.21 unpaid days lost per year for those in the FA group (cost calculations are similar to the one for overall people living with FHS) | £442.44 | £415.13 | £325.74 | £213.52 |
| Cost of 1.94 unpaid days lost per year for those in the CD group (cost calculations are similar to the one for overall people living with FHS) | £138.34 | £129.80 | £101.85 | £66.76 |
| Cost of 6.07 unpaid days lost per year for those in the FIO group (cost calculations are similar to the one for overall people living with FHS) | £432.62 | £405.92 | £318.52 | £208.78 |
Table 7.2 shows that those in the FA group have higher costs of unpaid days lost per year than those in the FIO and CD groups, when including those that did not have any unpaid days lost due to FHS. Both the FA and FIO groups have costs of unpaid days higher than the overall average.
Different sources were used to monetise paid and unpaid work because they are not considered equivalent. Additionally, there have been papers citing the use of hourly minimum wage to measure unpaid work, Care work and care jobs for the future of decent work (ILO, 2018). Although there is a ONS designed Unpaid Work calculator which calculates the value of each type of unpaid work (for example, childcare, housework, transport), we were unable to use this as the survey asked respondents in aggregate how many unpaid days they lost due to FHS, to reduce the response burden on participants. However it must be emphasised that although National Living Wage has been used as a measure of unpaid work, paid and unpaid work are not equivalent and entering into the labour market is probably not going to be a viable alternative use of unpaid work time/leisure time.
The average extra time spent per week for FHS related activities (these activities are detailed in Appendix 6) for people living with FHS is 6.21 hours. This average only includes 1,223 observations as there are 2 observations which are outliers (responses were more than 168 hours per week) and were removed. Out of the 1,223 observations, there are 6 observations that do not spend any extra time on FHS related activities. If these 6 observations are excluded, the average extra time spent per week for people living with FHS increases slightly to 6.24 hours per week. Using the hourly national living wage of £8.91 and the average of 6.21 hours per week, the cost of this extra time lost to people living with FHS in monetary terms is £55.33 per week (footnote 4). This translates to a yearly spend of £2877.22.
Table 7.3: Weekly costs of extra time spent due to FHS broken down by FHS type (n = 1,223) in England, Northern Ireland, and Wales according to an FHS household survey conducted online between November 2020 and January 2021.
| FHS type | FA, n=340 | CD, n=649 | FIO, n=234 |
|---|---|---|---|
| Average extra hours spent per week on FHS-related activities including those that did not spend any extra time (Mean costs of extra time per week, £) | 6.90 (61.48) | 5.79 (51.58) | 6.39 (56.93) |
Table 7.3 shows that those in the FA group have higher costs from weekly extra time spent on FHS-related activities than those in the FIO and CD groups, when including those that did not spend any extra time. Both the FA and FIO groups have costs higher than the overall average.
-
The MetLife Caregiving Cost Study: Productivity Losses to U.S. Business (2020)
-
Calculated using the equation: 2.67*29,900 divided by 52 * 5.
-
Cost calculated using national hourly living/minimum wage, as of August 2021 and assuming they spend an average of 8 hours/day on these activities: 8.91*8*3.87.
-
Calculated using the equation: 8.91*6.21.
8.1 Overview
In this chapter we present findings from the FHS household survey on direct and indirect costs, including the impacts on:
- food shopping habits
- eating out and takeaway habits
- overnight stays and holidays
- one-off costs around the time of diagnosis
- other findings including public attitudes towards FHS, mental health impact, impact on other people, and GF food on prescription withdrawal.
Note that for certain graphs, the percentage figures may add up to 101% or 99% rather than 100% due to rounding up / down of the percentage figures.
8.2 Impact on food shopping habits
FHS households were asked where they normally shop for food and 1,223 people provided their response. The majority (90%, n=1,105) said they visit a large supermarket chain. These responses were consistent across the three FHS cohorts. Out of 1,223 responses, only 8% of respondents said (n=91) that they regularly purchase their main food shop online, while just 2% (n=27) expressed a preference for other outlets (such as a specialist or independent stores).
FHS households were also asked whether they need to purchase additional products for people living with FHS from other shops and respondents could select more than one option. Most commonly, respondents said they purchase allergen free food items from a different supermarket (see Figure 8.1 below). These findings suggest that FHS customers are not able to purchase all their supplies in one single supermarket.
Figure 8.1: Additional shops to buy food (based on 100% of the sample used in the analysis, n=1,225) in England, Northern Ireland, and Wales according to an FHS household survey conducted online between November 2020 and January 2021.

We asked people living with FHS whether their food shopping habits had changed due to the Covid-19 pandemic. Out of 1,021 responses, 82% of FHS households (n=842) said their habits have changed and 33% (n=334) said they had started purchasing food online. Some respondents felt safer ordering food online, to limit the time spent reading labels in store and reduce the handling of products.
Another 24% of respondents (n=248) said the supply of ‘free from’ products, particularly the essentials, caused a problem for them during the first lockdown. This led some people living with FHS in the survey to bulk purchase essentials (such as GF bread) direct from wholesalers/ producers, to ensure they were well stocked. These supply constraints were reported to particularly impact shielding households and other vulnerable groups who were less able to visit different shops to source allergen free goods.
Additionally, 5% (n=50) of 1,021 respondents said that due to these supply issues, they started shopping at a different supermarket and 2% of respondents (n=22) said that having to track down allergen free foods during Covid-19 meant they spent a lot more time shopping. Only 2% of respondents (n=19) said that the food shortages forced them to cook more food from scratch and some said they had to learn how to cook produce and meals which they would have usually purchased pre-made, which took a considerable amount of time.
8.3 Impact on eating out and takeaway habits
The FHS household survey asked about the extent to which respondents agree with the statements on their eating out / takeaway habits. Results from Figure 8.2 show that having an FHS condition influences the frequency of households’ eating out / takeaway habits, where they eat out / get takeaway, and what foods they choose when eating out / getting takeaway. Overall, 93% (n = 1,093) of 1,175 respondents either agree or strongly agree it influences where they eat out or get takeaway from, and 95% (n=1,115) of 1,174 respondents either agree or strongly agree it influences their food choices when eating out / getting takeaway.
Figure 8.2: Eating out/takeaway habits of respondents (n=1,174 to 1,177) (footnote 1) in England, Northern Ireland, and Wales according to an FHS household survey conducted online between November 2020 and January 2021.

In addition to their perception of how having an FHS condition influences their eating out / takeaway habits, the survey also asked how they think the average price of their meal compares to those without FHS when eating out. Figure 8.3 reveals more respondents from the FIO and CD cohorts (55%, n=123 and 67%, n=423 respectively) think eating out is more expensive with an FHS condition. On the other hand, only 46% in the FA cohort (n=141) believe their food costs more than people living without FHS.
Figure 8.3: Perception of meal prices for people living with FHS compared to those without FHS when eating out (n=1,163) in England, Northern Ireland, and Wales according to an FHS household survey conducted online between November 2020 and January 2021.

We also asked people living with an FHS condition to provide any additional comments on how food hypersensitivity affects their eating out/takeaway habits and received 880 responses. The main impact is around the limits to their social life. Two percent of respondents (n=18) said they have turned down invitations to gatherings due to their condition. Of the 880 respondents, 13% (n=111) acknowledged that eating out is not a spontaneous decision. They must spend time researching options online in advance, discussing suitable meals with food business operators (FBO) by phone, informing serving staff about their allergies on arrival, and reading labels before ordering. Additionally, 8% of respondents (n=68) said they experience worry and anxiety due to a lack of trust in FBOs around preventing exposure to allergens through ingredients and cross-contamination.
The anxiety is heightened for those who experience severe reactions to food allergens. Five percent of respondents (n=46) reported having a past reaction to an allergen while eating out, despite some being assured by the FBO that the food was safe and allergen free. For these reasons, 8% of respondents (n=71) said they completely forego eating out and eating takeaways, preferring the safety of home-cooked food instead. An alternative is to eat at formal dining establishments or get takeaways from chains as there is typically more comprehensive and up-to-date allergen information available, as reported by 3% of respondents (n=24). Some 1% of respondents (n=11) said they rely on FHS networks (for example, Coeliac UK, friends with FHS) for FBO recommendations. Another 1% of respondents (n=12) said they keep emergency rations in their bag when they eat out in case there are no safe options available.
Additionally, we asked respondents to provide any additional comments as to whether Covid-19 had any impact on their eating out/ takeaway habits during November 2020 to January 2021 and received 398 (32%) responses. Figure 8.4 below sets out the types of changes these respondents experienced due to Covid-19.
Figure 8.4: Impact on COVID-19 on eating out/takeaway habits (n=398) in England, Northern Ireland, and Wales according to an FHS household survey conducted online between November 2020 and January 2021

Figure 8.4 shows that the largest impact of Covid-19 is that respondents reduced or stopped eating out / ordering takeaway. Interestingly, 15% of impacted respondents (n=59) felt there were less options available for people living with FHS, due to the closure of their ‘go-to’ safe restaurants/ takeaways or the removal of allergen free options from slimmed down menus due to Covid-19 restrictions on FBOs.
8.4 Impact on holidays
We asked FHS respondents how their condition impacts their holidays and trips away, and received a total of 1,017 responses. Many respondents told us that travelling with a FHS is a challenge, including work trips and conferences. Foreign holidays can be particularly stressful and require considerable advance planning for people living with FHS. Although foreign holidays are a luxury rather than an essential, they are life enhancing and bring benefits that are more difficult to access for people living with FHS.
The most common way that an FHS impacts on holidays is the reduced choice of accommodation options, with 26% of respondents (n=263) citing this as an issue. Many respondents (22%, n=220) prefer to stay in self-catering accommodation rather than hotels, because they have access to a private kitchen where they can prepare their own meals. Some people living with FHS noted that planning their eating habits on holiday to stay safe requires extra effort, from the deep clean of the kitchen on arrival to shopping and cooking throughout the stay. Skipping meals to stay safe or using emergency rations from home when safe options are unavailable was reported by 1.8% respondents (n=18).
Living with an FHS also affects where people choose to holiday, with 22% of respondents (n=228) citing this as an issue. Locations are selected depending on how likely it is that dietary restrictions can be accommodated. Many respondents (16%, n=160) said they select destinations based on factors such as awareness and culture of food safety, food safety regulations, and language spoken. Some people choose to revisit a destination where they have previously felt safe. Several respondents said they feel safe while travelling in EU countries (1%, n=13) due to harmonized allergen labelling while others said they prefer visiting English-speaking countries (1%, n=12) as it is easier to read food labels in English.
Moreover, the type of food people typically eat is another consideration and some respondents said they would avoid destinations where an allergen is commonplace in the local cuisine (for example sesame seeds in China or Israel); with 1% of respondents (n=10) identifying Asia as an area they would not travel to due to the cuisine. Conversely some respondents choose locations where the local cuisine makes it easier to avoid an allergen (for example, countries with a Mediterranean diet where gluten-free dishes are widely available).
A notable number of respondents (7%, n=68) raised concerns about the safety of flying with a severe food allergy and some people (1%, n=13) choose not to fly due to the risk. Although it was noted that airlines have improved their food options for certain diets in recent years (vegetarians, vegans, halal etc) the provision of allergen and GF free foods for people living with FHS was felt to have ‘worsened over time’. Another challenge is ensuring that airlines and cabin crew notify passengers of severe allergies and ban certain food items on individual flights. Another barrier is the paperwork required to keep EpiPens in hand luggage: a letter from the GP needs to be purchased for each flight and airline permission is needed in advance to carry an EpiPen.
People living with FHS typically do more preparation when going on holiday than non FHS, particularly abroad. Several respondents (37%, n=378) indicated that they have to spend a significant amount of time on planning and research such as choosing a location / destination. This means checking online reviews for guidance/ feedback from fellow people living with FHS; reading blogs to identify ‘safe’ restaurants; and speaking to hotels beforehand to discuss menus and cross contamination policies. Many people said they typically research catering options before booking and do not book if there is uncertainty. Those at risk of severe reactions said they research medical facilities prior to booking and this determines where they stay. A common activity for 8% of respondents (n=82) before travel to a non-English speaking destination, is learning key words and phrases in the local language or buying translation cards from Allergy UK or Coeliac UK. Items reportedly taken on holiday by people living with FHS include pre-packaged safe foods (emergency rations for when safe food is unavailable), toasters / toaster bags and even mini fridges.
Lastly, a number of respondents (17%, n=174) felt that it is often more expensive for people living with FHS to go on holiday, particularly outside the UK. Hotels that have good allergy policies in place and cater to restrictive diets are often at the premium end of the market and prohibitively expensive to families and others on moderate incomes. Some holidaymakers with severe food allergies will only travel on certain airlines which charge higher fares. When flying, it may be necessary to purchase extra luggage capacity to transport packaged foods and other items for preparing food safely (16% of respondents (n=165) mentioned taking food from home on holiday). Travel insurance was reported to be higher by 1% of respondents (n=12), due to their risk of a severe reaction to food.
8.5 Non-continuing costs at diagnosis
Respondents were asked whether there were any one-off time and/or financial costs at the time of their diagnosis. Table 8.1 below summarises the common non-recurrent costs.
Table 8.1: Common non-recurrent costs around the time of diagnosis (n=453) in England, Northern Ireland, and Wales according to an FHS household survey conducted online between November 2020 and January 2021.
| Costs around time of diagnosis | Examples of the costs |
|---|---|
| Some of the common non-recurrent costs around the time of diagnosis | disposal of foods that contain the allergen(s), travel to appointments around the time of diagnosis including time and costs (petrol, train fares and parking), the cost of tasting new ‘free from’ products to see if they are palatable. |
| Less common one-off costs around the time of diagnosis |
buying food for skin prick tests or oral food challenges, which were thrown away, time spent cooking items for the infant milk and egg ladders, purchasing of FHS recipe books, charity membership, training and events run by Coeliac UK, Anaphylaxis Campaign or Allergy UK, deep cleaning the kitchen, time spent educating family and friends about the condition, costs for associated legal actions: Local Education Authority tribunal to access appropriate education and a family court case, private dental care for discoloured/ damaged teeth caused by FHS, overnight accommodation required for longer trips associated with diagnosis (appointments and stays in medical facilities). |
8.6 Other findings: public attitudes towards FHS, mental health impact, impact on friends and families and GF food on prescription withdrawal
Participants were asked to share additional information on the burden of living with FHS. We received 598 responses and the majority of these emphasised the financial burden of living with FHS (which has been covered in the analysis of other survey questions, so is not repeated here). Additional themes were raised including public attitudes towards FHS; mental health impacts; impacts on friends and family (footnote 2). These findings are summarised in the table 8.2 below.
Table 8.2: Other findings from the FHS household survey: (n=598) in England, Northern Ireland, and Wales according to an FHS household survey conducted online between November 2020 and January 2021.
| Findings | FHS household survey responses |
|---|---|
| Public attitudes towards FHS | A lack of public awareness for FHS was raised by 7% of respondents (n=43). People living with FHS said they have experienced intolerant/ impatient attitudes and had hurtful comments directed towards them. The risk of food contamination is not always taken seriously, and some people living with an FHS condition said they have experienced a lack of support in the workplace. For those living with coeliac, gluten intolerance can be dismissed as a mild condition or lifestyle choice. Respondents said they had been accused of following a fad diet, being picky or awkward. |
| Mental Health impact | Overall, 8% of respondents (n=45) mentioned mental wellbeing/ psychological issues as an additional impact arising from their FHS condition. For 3% of respondents (n=17) their mental health was said to have declined as a direct result of their FHS, leading to stress / anxiety and depression. A few people living with FHS emphasised that the emotional burden is higher than the financial burden and they feel at greater risk of poor mental health outcomes due to social isolation and exclusion. |
| Impacts on friends and family | Overall, 6% of respondents (n=33) acknowledged that their FHS condition also has a big impact on immediate friends and family. Relationships can be affected too, from minor irritation to feelings of burden causing a great strain on relationships. These issues were reported by 3% of respondents (n=15) who said their FHS condition had negatively affected their relationships with family and friends. Some respondents said their partners follow restrictive diets to minimise the risk of cross contamination for people living with FHS. |
| Food on prescription withdrawal | The withdrawal of GF food on prescription in England for people on restrictive diets was raised as a concern by 3% of respondents (n=20). In recent years, increasing numbers of Clinical Commissioning Groups (CCGs) have declined to fund gluten free food on prescription for those living with coeliac disease (or limited the amount available). Half of these respondents also said the withdrawal of free prescriptions has caused them a greater financial burden. |
-
Sample sizes vary because some respondents did not provide a response to the particular statement
-
The FSA has also commissioned the FOODSENSITIVE study led by Aston University, which seeks to understand how FHS impact people’s quality of life. One of the surveys is designed to capture the intangible costs of living with FHS.
The main study limitations are due to the retrospective design, the reliance on self-reported data, and the potential for bias in the selection of households for the surveys. Both household surveys (surveys ran between November 2020 and January 2021) ask respondents to provide estimates of costs incurred pre-Covid, meaning the data is subject to recall bias. This was a pragmatic approach to mitigate against the potential influence of Covid on spending patterns during the study period. The FHS household survey was also disseminated via the partner charities using membership email lists, social media channels and websites in addition to promotion of the survey on both FSA and RSM social media channels. This could have resulted in sampling bias as participants will likely have been members of the partner charities, thus potentially excluding those that are not aware or affiliated with the partner charities. However, this was done for practical purposes as utilising the charities’ outreach channels provided better access to FHS respondents, which helped maximise sample size.
Additionally, prospective power analysis to determine the minimum sample size needed to detect an effect of a given size, was not performed. However, it must be noted that despite power analysis not being performed, this is the largest survey of its kind in the UK, and it may be difficult to obtain larger sample sizes in similar timeframes.
The FHS household survey was largely completed by females (79%) whereas the non-FHS household survey was more representative of the population (52% female). This means there is a risk of respondent bias when analysing differences within FHS types and between the non-FHS group. The study addressed this issue by adjusting for the confounding effect of gender in the multivariate regression models. Further sensitivity analysis was conducted to assess whether the relationship between FHS types and cost differentials varied between females and males. The results from this analysis found no difference between females and males.
A further limitation is that kitchen equipment costs were monetised by deriving a UK high street average price for all the pieces of equipment named by respondents. As respondents were not asked to detail when they purchased the additional kitchen equipment, the assumption is that these were bought fairly recently and that the market price in 2021 has not significantly changed in the last few years. The alternative was to ask respondents to recall how much they had spent on each item, but this would have been subject to unacceptable recall bias. Therefore, the approach selected provided the most pragmatic estimation for kitchen equipment costs.
For the propensity score matching model, we were unable to achieve ‘perfect’ matching (for example, not all sub-characteristics had a post-matched standardised mean difference less than 0.1) which means that the FHS survey respondents and non-FHS group respondents are not completely balanced on demographic and household characteristics. This was due to there being a trade-off between achieving ‘perfect’ matching and losing observations which would have affected sample size. Although there were other matching parameters – described in Appendix 6 – which would have resulted in ‘perfect’ matching, the sample size would have been reduced by more than 50%. We addressed this remaining imbalance through adjustment for the demographic and household characteristics in the multivariate regression analysis as part of a ‘doubly robust’ approach to addressing confounding. However, we note that our approach to addressing covariate imbalance may not have removed residual confounding by unmeasured factors.
10.1 Findings discussion
10.1.1 Direct costs: food consumption
Overall, the results from the online survey comparing costs between FHS households and non-FHS households align with what people living with FHS were reporting during the qualitative interviews earlier in the study.
Households with people living with CD spend more on food consumption than non-FHS households (11.9% more on weekly groceries costs and 14.1% more on weekly eating out / takeaway costs). Households with people living with FA also spend more on food consumption than non-FHS households (14.4% more on weekly groceries costs and 26.7% more on weekly eating out / takeaway costs). Meanwhile, households with those in the FIO category also spend more on food consumption than non-FHS households (15.8% more on weekly groceries costs and 15.0% more on weekly eating out / takeaway costs (footnote 1)).
These results align with the REA findings. The literature found that gluten-free products in the UK are 100% - 500% more expensive than non-gluten-free products (Capacci, Leucci, & Mazzocchi, 2018; Fry, Madden, & Fallaize, 2018; Allen & Orfila, 2018; Singh & Whelan, 2011). We show that those with coeliac disease, who require a gluten-free diet, have statistically significant higher spending of 112% - 117% [p = 0.03 to < 0.001] of the cost of those without FHS. There is no comparison with the FA group as most of the literature focused on gluten-free products.
When looking at literature where differences in combined direct costs (food, medical treatment, travel, leisure activities etc) are analysed, those studies showed no significant difference between adults with FHS and those without (Jansson et al., 2014; Voordouw et al., 2010; Voordouw et al., 2016). However, this study shows that when examining food costs specifically, there are significant differences in food costs between adults with FHS and the control group, with those in the FA and FIO groups facing the highest burdens. This is a key finding, which should be taken into account in the FSA’s cost of illness model to show a fuller picture of the economic burden for adults with FHS. Additionally, this study did not combine direct costs (food costs added with medical and additional kitchen equipment costs) for the FHS group as medical costs and additional kitchen equipment costs were not asked of the non-FHS group.
All the results stated above are statistically significant except for the comparison of weekly eating out / takeaway costs between those in the FIO category with non-FHS households (15.0%, p-value = 0.07). This borderline result could be statistically insignificant due to lack of power, residual confounding or heterogeneity in the FIO category. Without further research on those in the FIO category, we are unable to provide a definite explanation as to why the comparison is not statistically significant.
However, it should be noted again that FIO is not a medically recognised category and was created for the purposes of analysis by the study team. It is made up of those with food intolerances or individuals with an undiagnosed but suspected food allergy or suspected coeliac disease. Thus, any comparison made with this category must be done with caution as it includes more than just individuals with food Intolerances.
10.1.2 Discrepancy in mean food consumption costs between summary statistics and multivariate regression analysis
Discrepancies were observed in the cost differentials of food spending between those reported in the summary statistics (see Chapter 5.2) and those reported in the multivariate regression analysis for weekly groceries costs (see Chapter 5.3). The group differences reported in the multivariate regression analysis are almost 2 – 2.5 times less than those reported in the summary statistics when comparing the three FHS groups vs non-FHS. Table 10.1 below summarises the differences between groups in the summary statistics, univariate regression analysis, and multivariate regression analysis. The findings that do not have big discrepancies between the summary statistics and multivariate regressions (as in eating out / takeaway costs) or those that are not statistically insignificant, have been excluded from the table.
Table 10.1 Table showing the differences in the data and modelling for summary statistics, univariate regression, and multivariate regression across the different groups for weekly groceries costs
Summary statistics:
- outliers are removed
- data has not undergone regression
- no confounding factors adjusted for
- missing data not imputed
Univariate regression:
- outliers are removed
- data underwent Gamma with log link regression
- no confounding factors adjusted for
- matching has been done
- missing data imputed
Multivariate regression:
- outliers are removed
- data underwent Gamma with log link regression
- confounding factors adjusted for
- matching has been done
- missing data imputed
| Comparison: How much more FHS types spend compared to non-FHS | Summary statistics | Univariate regression | Multivariate regression |
|---|---|---|---|
| FOI versus non-FHS | 24% | 21.7% | 15.8% |
| CD versus non-FHS | 19.3% | With matching and Multiple Imputation: 11.1%. Without matching and Multiple Imputation: 23.9% |
11.9% |
| FA versus non-FHS | 25.6% | With matching and Multiple Imputation: 15.7% Without matching and Multiple Imputation: 33.9% |
14.4% |
Table 10.1 shows the results with summary statistics, univariate regression models (with and without propensity score matching together with multiple imputation (footnote 2)), and multivariate regression models. The costs difference between those in the FIO group with the non-FHS group (in row 1) drops from 24% with summary statistics to 15.8% with the multivariate regression model which included all the confounding factors listed in Chapter 5.3. Part of this discrepancy can be explained by the addition of confounding factors in the multivariate regression model as the univariate regression (with propensity score matching and multiple imputation) model without confounding factors results in a difference of 21.7%, which is closer to the 24% difference from summary statistics. The difference also gradually drops from 21.7% with the univariate regression model to 15.8% with the multivariate regression model as more confounding factors are gradually added. Thus, the discrepancy from 24% with summary statistics to 15.8% with the multivariate regression model can be jointly explained by the adoption of a more rigorous methodological approach including the use of propensity score matching, adjustment for confounding factors in the regression (doubly robust control for confounding) and multiple imputation to address sources of missing data.
The costs difference between those in the CD group with the non-FHS group (in row 2) drops from 19.3% with summary statistics to 11.9% with the multivariate regression model which included confounding factors. However, this discrepancy cannot be explained by the addition of confounding factors (footnote 3) as the univariate regression (with propensity score matching and multiple imputation) model without confounding factors results in a difference of 11.1%, which is even further from the 19.3% difference with summary statistics. Thus, the univariate regression (without propensity score matching and multiple imputation) model with log-transformation was run to check if the propensity score matching and multiple imputation could have caused the difference. The results from this model showed a difference of 23.9%, which is closer to the 19.3% difference with summary statistics. Thus, the discrepancy from 19.3% with summary statistics to 11.9% with the multivariate regression model can be mainly explained by the use of propensity score matching together with multiple imputation.
The costs difference between those in the FA group with the non-FHS group (in row 3) drops from 25.6% with summary statistics to 14.4% with the multivariate regression model which included confounding factors. However, this discrepancy cannot be explained by the addition of confounding factors as the univariate regression (with propensity score matching and multiple imputation) model without confounding factors results in a difference of 15.7%, which is still far from the 25.6% difference with summary statistics. Thus, the univariate regression (without propensity score matching and multiple imputation) model with log-transformation was run to check if the propensity score matching and multiple imputation could have caused the difference. The results from this model showed a difference of 33.9%, which is slightly closer to the 25.6% difference from summary statistics. Thus, the discrepancy from 25.6% with summary statistics to 14.4% with the multivariate regression model can also be mainly explained by the use of propensity score matching together with multiple imputation.
Propensity Score Matching was clearly necessary for the last two cases with the comparison of FA and CD with the non-FHS group. It performs well as it ensures better balanced samples in terms of socioeconomic characteristics (such as household income, gender, and geography) as demonstrated by balance statistics in Appendix 10. This means there is a “like for like” comparison between the FHS groups and the non-FHS group.
10.1.3 Other direct costs and indirect costs
The results show that the average one-off costs for additional kitchen equipment to an FHS household is £21.05 (those with FA spend £16.12, those with CD spend £26.26, and those with FIO spend £13.59). Meanwhile, the figure for average monthly medical costs to people living with FHS is £16.89 (those with FA spend £27.98, those with CD spend £11.08, and those with FIO spend £17.60). The average number of paid days lost per year due to FHS for people living with FHS is 2.67 days and the costs of these days (using the annual national median income of £29.900) is £307.05 per year (those with FA lose £433.52, those with CD lose £199.64, and those with FIO lose £438.89). Meanwhile, the average number of unpaid days lost per year due to FHS for people living with FHS is 3.87 days. Depending on the range of national minimum / living wage used for different wage groups, the monetary costs range from £133.13 to £276.85 per year (those with FA lose £208.78 – £432.62, those with CD lose £66.76 - £138.34, and those with FIO lose £213.52 - £442.44). Adults with FHS also spend an average of 6.21 hours per week on FHS related activities. Using the hourly national living wage of £8.91, this amounts to £55.33 lost per week (those with FA lose £61.48, those with CD lose £51.58, and those with FIO lose £56.93).
The literature on lost productivity (lost work time, household task time etc) showed mean productivity level valued at $1,038 (£778.60 (footnote 4)) across worldwide studies (Bilaver et al., 2019). If we add up the paid and unpaid days lost, from our study for people living with FHS, the total indirect costs ranges from £440.18 - £583.90 per year, which is a slightly more conservative estimate compared with studies conducted across the globe. However, once cost of time spent on FHS-related activities are included, the indirect costs rise to £3,317.40 - £3,461.12. This suggests that extra time spent on FHS-related activities represent a large chunk of productivity lost to adults with FHS.
There are other studies which combined indirect costs (lost productivity, lost time to healthcare) and compared these to a control group. The evidence was mixed with some finding no significant difference (Voordouw et al., 2016) and others finding significant differences in the range of EUR 2,578 - EUR6,424 (Jansson et al., 2014; Voordouw et al., 2010). As our study did not ask for control group costs, we cannot determine the difference in costs for those with FHS compared to the control group; however the study finding of an indirect cost of £3,317.40 - £3,461.12 does fall within this previously reported range.
Additionally, our results showed that those with FHS lose £55.33 per week from FHS-related activities (planning for food shopping etc). This aligns with numerous studies that report the amount of time needed for these activities are a major burden on people living with FHS (Bilaver et al., 2016; Broome, Lutz, & Cook, 2015; DunnGalvin et al., 2020a; Komulainen, 2010; MacKenzie, Grundy, Glasbey, Dean, & Venter, 2015; Neil, 2012; Peniamina, 2014; Peniamina, Bremer, Conner, & Mirosa, 2014; Peters, Crocker, Jenkinson, & Violato, 2020; Sommer, MacKenzie, Venter, & Dean, 2012; Stjerna, Vetander, Wickman, & Lauritzen, 2014).
There is no direct comparison with the non-FHS households for these costs as these are all expenditure incurred due to FHS. For example, if future studies were to attempt to compare these costs with non-FHS households, it must be ensured that the non-FHS households respondents and FHS household respondents are matched based on similar medical histories. A non-FHS respondent could have a chronic medical condition which drives up their medical costs so that when their medical costs are compared with people living with FHS, it would obscure the effect of having FHS on the medical costs.
10.2 Conclusions
The online surveys conducted with adults living with and without FHS in England, Northern Ireland, and Wales indicates that adults with an FHS condition face an increased financial burden due to food costs compared to non-FHS households.
Those in the FIO group face the highest burdens for weekly groceries costs whilst those in the FA group face the highest-burden for weekly eating out / takeaway costs.
However, food is not the only cost. Adults with FHS also experience additional direct costs (such as kitchen equipment and medical costs) and indirect costs (lost work days, lost unpaid days, and time spent on FHS-related activities). Overall, those in the FA group and FIO groups generally experience a higher financial burden compared to those in the CD group (except for additional kitchen equipment costs). The average additional costs for adults with FHS and the specific FHS groups are summarised in Table 10.3 below.
Table 10.3: Key findings on non-food direct and indirect costs from the multivariate regression analysis of the online survey of FHS adults in England, Northern Ireland, and Wales (n = 1,225)
| Type of costs | Costs to people living with FHS (aggregate of FIO, CD and FA) | Costs to those in the FIO group | Costs to those in the CD group | Costs to those in the FA group |
|---|---|---|---|---|
| Average one-off additional kitchen equipment costs due to FHS | £21.05 | £13.59 | £26.26 | £16.12 |
| Monthly medical costs due to FHS | £16.89 | £17.60 | £11.08 | £27.98 |
| Annual medical costs due to FHS | £202.68 | £211.20 | £132.96 | £335.76 |
| Average number of paid days lost per year due to FHS (costs in £) (footnote 5) | 2.67 (£307.05) | 3.81 (£438.89) | 1.74 (£199.64) | 3.77 (£433.52) |
| Average number of unpaid days lost per year due to FHS (costs in £) (footnote 6) | 3.87 (£275.85) | 6.07 (£432.62) | 1.94 (£138.34) | 6.21 (£442.44) |
| Average hours on FHS related activities per year due to FHS (costs in £) | 322.92 (£2,877.22) | 332.28 (£2,960.62) | 301.08 (£2,682.62) | 35.8 (£3,196.91) |
This study importantly highlights the specific cost elements affecting people living with an FHS condition, in particular demonstrating that not only does food cost more, but so do a range of other direct and indirect costs. The literature on lost productivity showed mean productivity level valued at $1,038 (£778.60) across worldwide studies (Bilaver et al., 2019). From our study, the total indirect costs (from paid and unpaid days lost) ranges from £440.18 - £583.90 per year, which is a slightly more conservative estimate compared with the literature. However, once cost of time spent on FHS-related activities are included, the indirect costs rise to £3,317.40 - £3,461.12. This not only has significant financial implications for the individuals concerned but also their health and wellbeing.
This study is unique in its focus on the people living with FHS but it would also be beneficial to collect and analyse data on actual consumer transactions in order to allow for more accurate cost comparisons at a granular level. However, this approach would require consumer consent to share their personal details and expenditure data. Additionally, a longitudinal study on financial burdens of adults with FHS conducted across multiple time periods would capture the impact of changing attitudes and food environment across time.
Overall, the study shows that those living with FHS, regardless of their FHS condition, face increased financial and economic burdens due to their condition. As such, policy actions are needed from the FSA and other government departments to help alleviate the burden felt by those with FHS and aid in managing the stress that arises from their condition.
-
This result is not statistically significant.
-
In order for propensity score matching to be performed, multiple imputation needed to be performed before that as propensity score cannot be done with the presence of missing data
-
It is important to note that once propensity score matching has been conducted, it is not expected that regression adjustment will make much of a difference to estimates
-
Calculated using 2018 average exchange rate of 1USD = 0.7501 GBP (Exchange Rates.org.uk)
-
Monetised using the annual national median income of £29,900.
-
Monetised using a National Living Wage of £8.91.
We would like to thank our colleagues who made a significant contribution to the project, particularly Jenny Irwin, Kerry Daff, Nicole Chan and Sofia Reva at RSM.
We also thank our advisors for their valuable direction and guidance:
- Dr. Audrey DunnGalvin from University College Cork and Dr Alizon Draper from University of Westminster: Both experts in the field of FHS. They provided QA by reviewing the survey, overall methodology, and report to ensure that any information about FHS is as accurate and robust as possible
- Professor William Henley from Exeter Medical School: Professor Henley was involved in advising on the statistical methods used in this study. He also provided QA by reviewing the statistical methods used, the results generated as well as their presentation in this report
We would also like to thank the Food Standards Agency team for their support and guidance throughout the project, particularly Sofia Maartensz and Nicholas Daniel. We would also like to express our gratitude to the Food Standards Agency steering group:
- Dr Ciara Walsh from the Technological University Dublin: Ciara is a researcher in the area of FHS. She sat on the project steering group and provided guidance for the study design, advice on the segmentation of results for analysis and the presentation of results
- Professor Andreia Costa Santos from the London School of Hygiene and Tropical Medicine: A health economist, Andreia sat on the project steering group and provided guidance for the study design, advice on statistical analysis methods and the presentation of results
- Zia Sadique from the London School of Hygiene and Tropical Medicine: Zia is a health economist who provided critique on the econometric approaches used
- Dr Eleonora Fichera from the University of Bath: Eleonora is also a health economist who provided guidance on the statistical methods and econometric approaches
We would also like to thank BMG Research for work on the non-FHS household survey dissemination in collaboration with RSM.
We would like to express our appreciation towards Allergy UK, the Anaphylaxis Campaign and Coeliac UK for distributing the FHS household surveys.
rsmuk.com
The matters raised in this report are only those which came to our attention during the course of our review and are not necessarily a comprehensive statement of all the weaknesses that exist or all improvements that might be made.
Recommendations for improvements should be assessed by you for their full impact before they are implemented. This report, or our work, should not be taken as a substitute for management’s responsibilities for the application of sound commercial practices. We emphasise that the responsibility for a sound system of internal controls rests with management and our work should not be relied upon to identify all strengths and weaknesses that may exist. Neither should our work be relied upon to identify all circumstances of fraud and irregularity should there be any.
This report is supplied on the understanding that it is solely for the use of the persons to whom it is addressed and for the purposes set out herein. Our work has been undertaken solely to prepare this report and state those matters that we have agreed to state to them. This report should not therefore be regarded as suitable to be used or relied on by any other party wishing to acquire any rights from RSM UK Consulting LLP for any purpose or in any context. Any party other than the Board which obtains access to this report or a copy and chooses to rely on this report (or any part of it) will do so at its own risk. To the fullest extent permitted by law, RSM UK Consulting LLP will accept no responsibility or liability in respect of this report to any other party and shall not be liable for any loss, damage or expense of whatsoever nature which is caused by any person’s reliance on representations in this report.
This report is released to our Client on the basis that it shall not be copied, referred to or disclosed, in whole or in part (save as otherwise permitted by agreed written terms), without our prior written consent.
We have no responsibility to update this report for events and circumstances occurring after the date of this report. RSM UK Consulting LLP is a limited liability partnership registered in England and Wales no.OC397475 at 6th floor, 25 Farringdon Street, London EC4A 4A.
If you have any accessibility issues with this report, please contact fsa.communications@food.gov.uk.