Research project
Survival of SARS-CoV-2 on the surfaces of food and food packaging materials
A study to measure the rate of inactivation of the SARS-CoV-2 virus on the surface of various types of food and food packaging.
Copyright notice
Crown Copyright 2022. This report has been produced by the University of Southampton under a contract placed by the Food Standards Agency (FSA). The views expressed herein are not necessarily those of the FSA. The University of Southampton warrants that all reasonable skill and care has been used in performing tests and preparing this report. Notwithstanding this warranty, the University of Southampton shall not be under any liability for loss of profit, business, revenues or any special indirect or consequential damage of any nature whatsoever or loss of anticipated saving or for any increased costs sustained by the client or his or her servants or agents arising in any way whether directly or indirectly as a result of reliance on this report or of any error or defect in this report.
Download the full report in PDF:
Abbreviations and codes
Abbreviations
| Abbreviation | Definition |
|---|---|
| BSA | Bovine serum albumin |
| COVID-19 | Coronavirus disease 2019 |
| CPE | Cytopathic effect |
| Deli | Delicatessen |
| DMEM | Dulbecco’s Minimal Essential Medium |
| DMNA | Division of Military and Naval Affairs |
| FSA | Food Standards Agency |
| FSS | Food Standards Scotland |
| HCoV | Human coronavirus |
| HEV | Hepatitis E virus |
| LOD | Limit of detection |
| MFMER | The Mayo Foundation for Medical Education and Research |
| MNV | Murine norovirus |
| MOI | Multiplicity of infection |
| PET | Polyethylene terephthalate |
| PFU | Plaque forming units |
| RH | Relative humidity |
| SARS-CoV-2 | Severe Acute Respiratory Syndrome Coronavirus 2 |
| SEM | Standard error of the mean |
| UKHSA | United Kingdom Health Security Agency |
| WHO | World Health Organization |
Foods and food packaging materials codes
| Code | Definition |
|---|---|
| AL | Aluminium can |
| A | Apple |
| BR | Brine |
| B | Broccoli |
| Bb | Brown bread crust |
| Ch | Cheddar cheese |
| CC | Composite drinks carton |
| Cr | Croissant |
| M | Mucin |
| O | Olive |
| Pc | Pain au chocolat |
| P | Pepper |
| PB | PET1 bottle |
| PT | PET1 tray |
| R | Raspberry |
| H | Sliced ham |
COVID-19, caused by the SARS-CoV-2 virus, was first reported in China in December 2019. The virus has spread rapidly around the world and is currently responsible for 500 million reported cases and over 6.4 million deaths.
A risk assessment published by the Foods Standards Agency (FSA) in 2020 concluded that it was very unlikely that you could catch coronavirus via food. This assessment included the worst-case assumption that, if food became contaminated during production, no significant inactivation of virus would occur before consumption. However, the rate of inactivation of virus on products sold at various temperatures was identified as a key uncertainty, because if inactivation does occur more rapidly in some situations, then a lower risk may be more appropriate. This project was commissioned to measure the rate of inactivation of virus on the surface of various types of food and food packaging, reducing that uncertainty. The results will be used to consider whether the assumption currently made in the risk assessment remains appropriate for food kept at a range of temperatures, or whether a lower risk is more appropriate for some.
We conducted a laboratory-based study, artificially contaminating infectious SARS-CoV-2 virus onto the surfaces of foods and food packaging. We measured how the amount of infectious virus present on those surfaces declined over time, at a range of temperatures and relative humidity levels, reflecting typical storage conditions. We tested broccoli, peppers, apple, raspberry, cheddar cheese, sliced ham, olives, brine from the olives, white and brown bread crusts, croissants and pain au chocolat. The foods tested were selected as they are commonly sold loose on supermarket shelves or uncovered at deli counters or market stalls, they may be difficult to wash, and they are often consumed without any further processing i.e. cooking. The food packaging materials tested were polyethylene terephthalate (PET1) trays and bottles; aluminium cans and composite drinks cartons. These were selected as they are the most commonly used food packaging materials or consumption of the product may involve direct mouth contact with the packaging.
Results showed that virus survival varied depending on the foods and food packaging examined. In several cases, infectious virus was detected for several hours and in some cases for several days, under some conditions tested. For a highly infectious agent such as SARS-CoV-2, which is thought to be transmissible by touching contaminated surfaces and then the face, this confirmation is significant.
For most foods tested there was a significant drop in levels of virus contamination over the first 24 hours. However, for cheddar cheese and sliced ham, stored in refrigerated conditions and a range of relative humidity, the virus levels remained high up to a week later, when the testing period was stopped. Both cheddar cheese and sliced ham have high moisture, protein and saturated fat content, possibly offering protection to the virus. When apples and olives were tested, the virus was inactivated to the limit of detection very quickly, within an hour, when the first time point was measured. We suggest that chemicals, such as flavonoids, present in the skin of apples and olives inactivate the virus. The rate of viral decrease was rapid, within a few hours, for croissants and pain au chocolat. These pastries are both coated with a liquid egg wash, which may have an inhibitory effect on the virus. Food packaging materials tested had variable virus survival. For all food packaging, there was a significant drop in levels of virus contamination over the first 24 hours, in all relative humidity conditions and at both 6°C and 21°C; these included PET1 bottles and trays, aluminium cans and composite drinks cartons.
There is also a potential risk of the droplets containing the virus, contaminating fomites such as foods and food packaging, leading to consumer and food handlers’ exposure. A risk assessment published by the Food Standards Agency (FSA) in 2020 (Qualitative Risk Assessment (food.gov.uk)) concluded that it was very unlikely that you could catch coronavirus via food. This assessment included the worst-case assumption that, if food became contaminated during production, no significant inactivation of virus would occur before consumption. However, the rate of inactivation of virus on products sold at various temperatures was identified as a key uncertainty, because if inactivation does occur more rapidly in some situations, then a lower risk may be more appropriate. This project was commissioned to measure the rate of inactivation of virus on the surface of a range of food and food packaging, reducing that uncertainty. The results will be used to consider whether the assumption currently made in the risk assessment remains appropriate for food kept at a range of temperatures, or whether a lower risk is more appropriate for some.
We conducted a laboratory-based study artificially contaminating infectious SARS-CoV-2 virus onto the surfaces of foods, including broccoli, peppers, apple, raspberry, cheddar cheese, sliced ham, olives, brine from the olives, white and brown bread crusts, croissants and pain au chocolat. The foods tested were selected as they are commonly sold loose on supermarkets shelves or uncovered at deli counters or market stalls, they may be difficult to wash, and they are often consumed without any further processing, i.e. cooking. Food packaging tested were: Polyethylene terephthalate (PET1) trays and bottles, aluminium cans and composite drinks cartons. These were selected as they are the most commonly used food packaging materials or consumption of the product may involve direct mouth contact with the packaging. We measured how the amount of infectious virus present on those surfaces declined over time, at a range of temperatures and relative humidity levels, reflecting typical storage conditions.
Results showed that virus survival was varied for the different foods and food packaging examined. In several cases, e.g. peppers, bread crust, sliced ham, and cheddar cheese, infectious virus was detected for several days under some conditions tested. On the surfaces of pastries, infectious virus could be found for several hours.
A significant decrease in virus levels of >90% (i.e. 1-log10 reduction) was seen on broccoli and peppers at 24 hours after artificial contamination, and low levels, above the limit of detection (LOD) remained for several days. The virus levels on raspberry dropped significantly by 97% (1.5-log10 reduction) after 24 hours incubation in ambient (21°C +/- 3°C) and chill conditions (6°C +/- 1°). When apple or olives were tested, the virus levels significantly decreased within just a few minutes of the virus being added, to less than the LOD of 25 PFU per sample. We speculate that chemicals, such as flavonoids, in the apple and olive skin are responsible for this inactivation. The recovery of active SARS-CoV-2 when added to brine, obtained from packaged olives, gradually decreased over time. There was less than a 1-log10 reduction after 1 day, reaching the limit of detection by day 4 under all conditions tested.
SARS-CoV-2 added to brown and white bread crust decreased >90% (i.e. 1-log10 reduction) after 24 hours. However, the rate of viral decrease was much faster for pastries, croissants and pain au chocolat, with >90% reduction (> 1-log10) within 6 hours and to less than the LOD of 25 PFU per sample. Both pastries are coated with a liquid egg wash, which may have an inhibitory effect on the virus. It has been suggested that arachidonic acid and other unsaturated fatty acids which are present in high levels in eggs, may serve as anti-viral compounds.
Virus added to either cheddar cheese or sliced ham, remained infectious at high levels, with only a 1-log10 reduction by 7 days, when the testing period was stopped. Both cheddar cheese and sliced ham are high in moisture, protein and saturated fat content, possibly offering protection to the virus.
Food packaging materials were also tested and had variable virus survival at the different incubation temperatures and humidity levels investigated. In ambient conditions, at 21°C, on PET1 bottles, there was a significant decrease in virus levels of >90% (i.e. 1-log10 reduction) after 24 hours. However, at 53% RH, virus levels did not reach the LOD of 25 PFU until day 3 (2.4-log10 decrease). At 6°C, virus was still detectable at 5 days after artificial contamination in some conditions. The virus survival was similar for PET1 trays, with a significant decrease in virus levels of >90% (i.e. 1-log10 reduction) after 24 hours but levels did not reach the LOD until day 6 at 6°C, 20% RH. When aluminium cans were tested, there was a significant decrease in virus levels of >90% (i.e. 1-log10 reduction) after 24 hours, on cans stored in ambient (23°C) conditions. In chilled conditions, the virus survived longer; at 6C and 80% RH, levels did not reach the LOD until day 4. For composite drinks cartons a significant decrease in virus levels of >90% (i.e. 1-log10 reduction) was observed after 24 hours stored in ambient (23°C) conditions. However, for cartons stored in some chilled conditions (6°C and 80% RH), the virus did not reach the LOD until day 4. The addition of mucin, to simulate respiratory mucus surrounding the virus particles, made no statistical difference to virus survival on any of the food packaging tested.
The World Health Organization (WHO) were notified in late December 2019, of a cluster of cases of pneumonia of unknown cause in Wuhan City, Hubei Province, China. Most early cases were associated with visiting Wuhan South China Seafood City market, which reportedly sold meat, poultry, seafood and live animals. In early 2020, WHO received further evidence, from the National Health Commission of the People’s Republic of China, identifying the cause of these infections as a novel coronavirus (WHO, 2020a). It has since been transmitted rapidly around the world and as of June 2022 is responsible for 543 million reported cases and over 6.4 million deaths globally (Worldometer, 2022). In England, there have been 19 million cases and 159,000 deaths (UKHSA, 2022).
The primary route of transmission for SARS-CoV-2 is inhalation of contaminated respiratory droplets (>100 µm particles) or aerosols (<100 µm particles) from symptomatic and asymptomatic patients produced during breathing, talking, coughing and sneezing, particularly in poorly ventilated indoor areas (Morawska et al., 2020). However, there is the possibility that SARS-CoV-2 might spread via direct contact with droplet-contaminated surfaces (fomites). This could lead to the virus being transferred from the hand to the eyes, nose and mouth (WHO, 2020b). One study estimated that there are an average of 17000 viral copies per sputum sample collected during a typical cough, which could be deposited on the surfaces of foods or food packaging (Yu, 2020). There is currently no documented evidence that food and food packaging materials are a significant source and/or vehicle for the transmission of SARS-CoV-2. A recent literature review on the potential for food borne transmission, stated that there is limited evidence of fomite-related transmission (Kingsbury, 2022). However, the virus might contaminate food and packaging materials during processing and whilst on retail display and could thus act as a vehicle of transmission. It is assumed the main route of SARS-CoV-2 transfer to foods and food packaging is cross-contamination from infected individuals.
A risk assessment published by the Foods Standards Agency (FSA) in 2020 concluded that it was very unlikely that you could catch coronavirus via food (FSA, 2020). This assessment included the worst-case assumption that, if food became contaminated during production, no significant inactivation of virus would occur before consumption. However, the rate of inactivation of virus on products sold at various temperatures was identified as a key uncertainty. This project was commissioned to reduce this uncertainty by measuring the rate of inactivation of virus on the surface of various types of food and food packaging. The results will be used to consider whether the assumption currently made in the risk assessment remains appropriate for food kept at a range of temperatures, or whether a lower risk is more appropriate for some. A recent report by SAGE-EMG (SAGE, 2020) states that ventilation is a key mitigation for controlling transmission of SARS-CoV-2 by aerosols (< 10 µm), between people who share the same indoor space. They state, however, that ventilation is not likely to have any significant impact on transmission via fomites, such as foods or food surfaces.
We conducted a laboratory-based study artificially contaminating infectious SARS-CoV-2 virus onto the surfaces of foods and food packaging. We then measured how the amount of infectious virus present on those surfaces changed over time. The food and packaging types studied included: fresh vegetables, fresh fruit, baked produce, delicatessen (deli) items, polyethylene terephthalate (PET) plastic bottles; PET material such as ready meal containers; aluminium cans and composite drinks cartons. They were studied at a range of temperatures and humidity levels and over time periods that reflect their typical storage conditions.
There is no consensus on the definition of ambient temperature. WHO guidance (WHO, 2022c) states that ‘ambient’ is not widely used due to significant variation in ambient temperatures. Generally, ‘ambient’ describes ‘room temperature’ or normal storage conditions, i.e. storage in a dry, clean, well-ventilated area at room temperatures between 15°C to 25°C or up to 30°C (depending on climatic conditions). The Division of Military and Naval Affairs (DMNA) recommend between 10°C and 21°C for ambient storage of foods (DMNA, 2006). The Mayo Foundation for Medical Education and Research recommend normal ambient relative humidity should be between 20-50% (MFMER, 2021). It is clear from the available literature and supermarket websites that there is little consensus as to what is considered ambient humidity or temperature. This varies between supermarkets and is dependent on the individual company’s guidelines, the outside temperature and relative humidity, whether the supermarket has air-conditioning and the size of the supermarket. While UK guidelines recommend that supermarkets maintain a temperature of 19-21°C in winter, and 21-23°C in summer (GMP Compliance, 2017), different supermarkets have varying policies. In an article by Pursglove, (2021), different supermarkets were approached for their policies on ambient temperature. In the article, Tesco stated ‘There is no policy on ambient air temperature’. Lidl said ‘We do regulate the store temperatures through a Building Management System, according to set guidelines and specifications. We have a minimum and maximum temperature for each area of the store, from 19-24°C for the sales area to 20-24°C’. Morrisons said ‘We do not have a specific set of guidelines for store temperatures and Asda have ‘temperatures between 19-24°C’ (Pursglove, 2021). UK guidelines state: ‘it is recommended that refrigerators and chilled display equipment should be set at 5°C or below. This is to make sure that chilled food is kept at 8°C or below’ (FSA, 2021). This is a legal requirement in England, Wales and Northern Ireland, and recommended in Scotland (FSA, 2021 and FSS, 2016).
To study conditions more representative of real-world scenarios, for packaging materials, we investigated SARS-CoV-2 survival in medium enriched with mucin. Salivary mucin has been described as one of the factors that prolong the survival of SARS-CoV-2 on surfaces (Riddell et al., 2020). Mucin is the principal glycoprotein of saliva and is the main non-water, gel-like component of the mucus layer that covers epithelial surfaces throughout the body (Çelebioğlu et al., 2020). We investigated whether added mucin had any effect on the survival of SARS-CoV-2 on the surfaces of some packaging materials: plastic bottles, composite drinks cartons and aluminium cans.
We conducted a laboratory-based study artificially contaminating infectious SARS-CoV-2 virus onto the surfaces of foods and food packaging. We then measured how the amount of infectious virus, present on those surfaces, declined over time. They were studied at a range of temperatures and humidity levels and over time periods that reflect their typical storage conditions.
5.1 Materials and Methods
The UK’s Advisory Committee on Dangerous Pathogens (ACDP) has agreed on the provisional classification of SARS-CoV-2 as a hazard group 3 pathogen, which means that by default it must be handled at Containment Level 3. All viral work with the Hazard Group 3 coronavirus was performed in a Class III Microbiological Safety Cabinet in an HSE-approved Containment Level 3 laboratory at the University of Southampton.
5.1.1 Cell line, viral strain and cell culture media
The kidney cell line, VERO E6, were supplied by from UK Heath Security Agency (UKHSA). For many years, Vero cells and derivatives, have been used extensively for coronavirus cell culture research, in particular the study of SARS-CoV-like viruses. In 2020, Ogando et al., (Ogando, 2020) and many others, reported that they used Vero E6 cells to isolate, propagate and study SARS-CoV-2. This may be due to a high expression level of the ACE-2 receptor that is used by both SARS-CoV-2 and SARS-CoV.
Cells were grown at 37°C and 5% CO2 in culture medium composed of 500 ml Dulbecco’s Minimal Essential Medium (DMEM) supplemented with 1% (v/v) GlutaMax-1, 1% (v/v) nonessential amino acids, 500 U/ml Penicillin, 500 µg/ml Streptomycin, and 10% (v/v) foetal bovine serum (all Thermo Fisher, UK). Cells were passaged twice a week with 0.2 – 2 ml (depending on flask size) Trypsin-EDTA (0.25%) (Thermo Fisher, UK) for 10 minutes at 37°C. Once detached the cells were centrifuged at 1800 rpm for 3 minutes, before being resuspended in fresh culture medium. Cells were grown in 25 ml, 75 ml or 175 ml flasks, depending on numbers of cells required. Cells were not used beyond passage 30 (P30) (which occurred before the onset of senescence, but susceptibility to infection diminished greatly from P30).
The human coronavirus SARS-CoV-2 strain B.1.1.7 VUI-202012/01 (the first “Variant Under Investigation” in December 2020), was obtained UKHSA. It should be noted that the results described in this report are only valid for this strain. The medium used for propagating viral stocks composed of 500 ml DMEM, 1% (v/v) GlutaMax-1, 13 ml HEPES (1M), 500 U/ml Penicillin: 500 µg/ml Streptomycin and 4% (v/v) foetal bovine serum (all Thermo Fisher, UK). SARS-CoV-2 virus stocks were prepared was by infecting Vero E6 at multiplicity of infection (MOI) of 0.01 for 4 to 7 days until a significant cytopathic effect (CPE) was observed. Infected cell supernatant was stored at -80°C.
Virus was assayed for infectious virus survival by plaque assay in 12-well plates, using Infection Medium composed of 500 ml DMEM, 1% (v/v) GlutaMax-1, 13 ml HEPES (1M); 500 U/ml Penicillin; 500 µg/ml Streptomycin and 2.5 µg/ml Amphotericin B (Thermo Fisher, UK). The plaque assay was overlaid with Avicel Overlay. Avicel Overlay consisted of a 2:1:1 mixture of 2X Overlay Medium: 2.4% (w/v) Avicel in sterile water: sterile water (all Sigma Aldrich, UK). Overlay Medium (2X) was composed of 10X DMEM; 7.5% (v/v) sodium bicarbonate; 2% (v/v) GlutaMax-1; 1000 U/ml Penicillin, 1000 µg/ml Streptomycin; 13 ml HEPES (1M); 10% (v/v) foetal bovine serum and 147 ml sterile water (Thermo Fisher, UK) to make a final volume of 250 ml. The virus titre of different batches was very variable, at between 5 x 10⁴ – 6 x 10⁵ PFU/ml. SARS-CoV-2 is not a high titre virus so we could not produce a high level of virus and then dilute it down for testing, instead we used what we had produced for each batch. We do not have the facilities in the high containment CL3 laboratory to concentrate the virus further. In our initial tests we used up to 5000 PFU for each test; in later tests we used up to 10,500 PFU/test.
5.1.2 Preparation of different temperature and relative humidity conditions
We used 21°C +/- 3°C as the standard ambient temperature and 53% +/-3% relative humidity (RH). These are the temperature and humidity levels recorded inside the high containment laboratory, which has essential equipment running and does not have air conditioning. We used 6°C +/- 1°C and 53% RH+/-3% or 40% RH+/-3% as the standard chill temperature and relative humidity, as recorded inside the refrigerator in our high containment laboratory using a Fisherbrand™ Traceable™ thermometer/humidity monitor (Fisher Scientific, UK). These conditions were used as a baseline for further tests and measured every 24 hours.
RH of 20% and 80% were chosen as the extremes of RH found in supermarkets (Woradechjumroen et al., 2014). To obtain defined RH of 20%, 50% and 80% (Casanova et al., 2010; de Goffau et al., 2009), saturated solutions were made by adding more than the solubility weights provided by the manufacturer. Each saturated solution was placed in an unlidded Petri dish, inside a sealed lunch box at room temperature (ambient) and in the refrigerator (chill) temperatures before recording the actual RH using a Fisherbrand™ Traceable™ Thermometer/Clock/Humidity Monitor which was left in situ during the experiments. Fresh saturated solutions were prepared for each food and food packaging tested. The chemicals used and the actual RH obtained by using each saturated solution are shown in Table 1. To note, supply problems meant that we sometimes had to use the different chemicals to create the same relative humidity conditions (as shown in Table 1).
Table 1 Chemicals used to create different relative humidity conditions
| Chemical | Relative humidity obtained |
|---|---|
| Saturated sodium chloride solubility approx. 37 g/100 ml |
80% +/- 3% |
| Saturated ammonium chloride solubility approx. 10 g/100 ml |
80% +/- 3% |
| Saturated magnesium nitrate solubility approx. 71g/100 ml |
50% +/- 3% |
| Calcium sulphate solubility approx. 0.2 g/100 ml |
20% +/- 3% |
5.1.3 Preparation of mucin
Some experiments on food packaging were conducted in the presence of mucin, namely aluminium cans, PET1 bottles and composite drinks carton, as these products involve direct mouth contact for consumption of the product. These tests were conducted in the presence of mucin (Sigma Aldrich, UK) at the 0.1% (w/v) concentration as used by Glenister et al. (1988). One gram of mucin was dissolved in 100 ml of water at 80°C for one hour and then autoclaved at 121°C for 15 min; it was subsequently diluted to 0.1% (w/v) in the SARS-CoV-2 virus stock.
5.1.4 Determination of optimum protocol for virus recovery
To determine the optimal protocol for virus recovery from each food, we tested and compared 3 methods, namely pulsification, vortexing with beads and swabbing. We tested each method for recovery of virus from broccoli, peppers, apples, raspberries, white bread crust, brown bread crust, croissant, pain au chocolat, ham, cheese and olives. Results are shown in 6.1 and 6.2.
We used the Pulsifier (Pulsifier II, Microgen Bioproduct%s Ltd, Camberley, UK) as described by Highmore et al., 2018. The Pulsifier method is a gentle, but very effective method for recovery of bacteria and viruses from foods (ISO 7218; Kang et al., 2007; Sanchez et al., 2012). The food samples were placed in a plastic bag in 10 ml Infection Medium, placed in the Pulsifier which was run for 30 seconds. The Pulsifier utilises a high frequency oscillating metal ring (approximately 3000 reciprocations/minute) to beat the plastic bag thus forcing the virus off the food surface.
Despite being a vigorous method, our experience recovering virus from metal coupons with beads/vortexing, shows that both viral recovery and virus viability are high (Warnes et al., 2015) and therefore this method is suitable for virus recovery from foods (Goyal and Aboubakr, 2016). Food samples were vortexed with a Grant PV-1 vortex mixer at 3000 rpm for 60 seconds in 10 ml Infection Medium containing 2 g of glass beads with diameter of 2 mm glass beads (Fisher Scientific, UK).
We also tested swabbing on all foods in this study. Although in some previous studies, swabbing was shown to lead to very poor recovery of viruses from complex foods (Moore and Griffith, 2007), a recent study showed that for recovery of SARS-CoV-2 from food surfaces, nylon flocked swabs were a valid tool for detection, allowing improved sample absorption and high quantity release of viruses from the sample surface (Arnaboldi et al., 2022). Swabbing was therefore performed using nylon tipped swabs (TCS Swabs, UK). The swab was dipped into Infection Medium before swabbing the sample. The swab was rotated during the swabbing and the surface swabbed in two directions to ensure the whole surface was swabbed. For foods with complex shapes, the whole or piece of individual food was carefully swabbed all over the surface. The swab was placed into 10 ml Infection Medium containing glass beads and vortexed for 30 seconds.
5.1.5 Preparation of foods and food packaging for testing
The foods tested were selected as they are commonly found loose on supermarkets shelves, they may be difficult to wash, and they are often consumed without any further processing i.e. cooking. The food packaging materials were selected as they are the most commonly used food packaging materials or consumption of the product may involve direct mouth contact. The foods studied for ascertaining baseline parameters were fresh vegetables (broccoli and red pepper), fresh fruit (apples and raspberries), baked products (croissants, pain au chocolat, brown bread crust and white bread crust), and delicatessen items (cheddar cheese, sliced ham, olives and olive brine). All tests were performed in triplicate. Each food type was left intact (raspberry and green olives); or cut into approx. 5 g pieces (broccoli, pepper, ham, cheese, brown bread crust, white bread crust, croissant, pain au chocolat); or cut into 3 cm x 3 cm pieces (apple) to make handling of the foods more practicable in the confines of the CL3 cabinet, as well as to perform vortexing with beads and pulsification protocols. The size and weight of each food was chosen to allow ease of handling within the confines of the Class III Microbiological Safety Cabinet. Three pieces or individual whole foods were used at each time point. 5 ml volumes of the brine that surrounded the olives were also tested. Brine is a solution of salt and water, with an extremely high salinity. It has been used historically in food production as a preservative since salt inhibits the growth of microorganisms. The brine tested was at a concentration of 4% NaCl and a pH of 4.5.
The food packaging studied were polyethylene terephthalate (PET1) containers (PET1 bottles and PET1 trays); aluminium cans and composite drinks cartons. Food packaging was cut into approx. 1 cm x 1 cm pieces and all tests performed in triplicate using 3 randomly selected pieces per time point. The size of each food packaging type was chosen to allow ease of handling within the confines of the Class III Microbiological Safety Cabinet.
5.1.6 Time course infectivity assay for foods artificially contaminated with SARS-CoV-2
We measured the survival of infectious virus present on food surfaces over time. All tests were performed in triplicate. Each food type was left intact (raspberry and green olives); or cut into approximately 5g pieces (broccoli, pepper, ham, cheese, brown bread crust, white bread crust, croissant, pain au chocolat); or cut into 3 cm x 3 cm pieces (apple). Three pieces of food or 3 individual foods, were used at each time point. 5 ml volumes of the brine that surrounded the olives was also tested.
Aliquots of 20 µl SARS-CoV-2 were added to each surface, to simulate respiratory droplet contact (Warnes and Keevil, 2015). A 10 µl calibrated micropipette was used to artificially contaminate the SARS-CoV-2 cell culture supernatant onto each sample surface or into the brine liquid. Aliquots of 20 µl (3 x 6.67 µl) (containing between 1000 and 5000 PFU) SARS-CoV-2 were added to the outer surfaces of each food, and immediately spread as evenly as possible with the tip of the micropipette over the entire outer surface of the sample using a back-and-forth motion. For brine, 20 µl SARS-CoV-2 was added to 5 ml brine and mixed thoroughly.
All samples, except brine, were then allowed to dry for 60 minutes at room temperature inside the high containment cabinet. Brine samples containing virus were allowed to stand for 60 minutes at room temperature inside the high containment cabinet. All samples were then placed in sealed lunch boxes at the required temperature and relative humidity.
Virus was removed from the test material at the various timepoints, using one of three methods described in 5.1.4: vortexing with beads, pulsification or swabbing. The results can be seen in Table 2.
5.1.7 Time course infectivity assay for packaging materials artificially contaminated with SARS-CoV-2
We measured the survival of infectious virus present on food packaging over time. All tests were performed in triplicate, using 3 randomly selected pieces per time point. Each food packaging piece was cut into several approx. 1 cm x 1 cm pieces; 3 pieces were used at each time point.
A 10 µl calibrated micropipette was used to artificially contaminate the SARS-CoV-2 cell culture supernatant onto each sample surface. Aliquots of 20 µl (3 x 6.67 µl) (equivalent to between 10000 and 10250 PFU, depending on viral stock used) SARS-CoV-2 were added to the outer surfaces of food packaging pieces and immediately spread as evenly as possible with the tip of the micropipette over the entire outer surface of the sample using a back-and-forth motion. Samples were allowed to dry for 60 minutes at room temperature inside the high containment cabinet and were then placed in sealed lunch boxes at the required temperature and relative humidity.
Virus was removed from the test material at the various timepoints, using the vortexing with beads method. Each time point was performed in triplicate, with an individual piece of each food packaging used for each of the triplicate samples.
5.1.8 Plaque assay
The resulting food or food packaging sample extracts were taken up in a 10 ml disposable syringe (SLS, UK) and push-filtered through a 0.45 µm low protein and extractables binding PES filter (Millipore, UK) to clarify the suspension and remove bacterial and fungal contaminants. Virus stocks and recovered virus titres were assayed for infectious virus by plaque assay (Dulbecco and Vogt, 1953), with the results described as plaque-forming units (PFU); see Figure 1.
Serial dilutions were performed if required, to ensure that countable plaques were obtained (neat, 10-1, 10-2, 10-3). Dilutions were prepared in Infection Medium, and 400 µl aliquots of each dilution plated onto confluent monolayers of Vero E6 cells that had been prepared by plating 2.5 x 10⁵ cells in 1 ml growth medium, 24 h earlier in 12-well plates. The inoculum was removed after 60 min and replaced with 1.5 ml Avicel Overlay. The plates were incubated at 37°C and 5% CO2 in air for 3 days. The monolayers were fixed for 30 minutes in 8% (w/v) paraformaldehyde, stained with 0.1% crystal violet, allowed to dry and plaques in the monolayer enumerated as in the equation:
PFU/sample = C x D x V
Where C is the smallest number of countable plaques per well; D is sample dilution in well and V is volume (ml) of packaging sample extract. The mean limit of detection (LOD) for the assay is determined as the lowest spiking concentration that produced plaques. For the assay described here the LOD is 25 PFU/sample (Warnes et al., 2015): in this study the limit of detection for the smallest number of countable plaques per well is 1, thus C = 1; 400 µl of sample was added to each well, thus D = (1000 µl/400 µl) = 2.5; and the volume of sample extract was 10 ml, thus V = 10.
This equates to 25 PFU/sample being the mean limit of detection (LOD). At each time point, 3 independent sample tests were performed, A, B and C. For each of these independent tests the assay was performed in duplicate, resulting in 2 wells per dilution of each sample, A, B and C. Means were then calculated to give PFU/sample shown in the results Tables 4 – 155 and Figures 2 - 27. Sometimes, there were no plaques visible, meaning that there were fewer than 25 infectious particles produced in the assay, (i.e. fewer than 25 PFU remained on the sample), giving a mean of <25 PFU/sample. In these cases, 25 PFU/sample have been plotted on the graphs and <25 PFU/sample recorded in the table. A blue line () on the graphs shows the LOD; all PFU below the LOD are shown as 25 PFU, since values below 25 PFU could not be calculated.
Figure 1 Dilution series for determining PFU. Adapted from Viral Titering-Plaque Assay Protocol, 2020

5.1.9 Statistical analysis
Where appropriate, the data sets for the food and food packaging tests are expressed as mean +/- standard error of the mean (SEM) and error bars shown on the graphs represent the SEM. The data sets were evaluated for statistical differences using one-way analysis of variance (ANOVA) or two-way analysis of variance (ANOVA) followed by Tukey’s multiple comparisons post hoc test, using GraphPad Prism (version 9.3.1, GraphPad Software, USA). Statistical significance was indicated where the p-value was less than 0.05 (p<0.05). ANOVA is a statistical test that is used to determine if there is a statistical difference between the means of two or more groups of data. If the ANOVA results indicate statistical significance, post-hoc analysis is performed. Post-hoc (in Latin ‘after this’) testing is used when a statistical test of three or more samples is statistically significant, and you wish to determine which individual samples are different from one another. The main ANOVA test tells you only that one or more of the samples is different from one or more of the other samples. In Tukey’s post-hoc test, every mean is compared with the mean of all other groups.
6.1 Baseline Parameters – foods
We determined the baseline parameters of all food tests in this project. Results are summarised here and can be seen in full in Appendix 9.1.1. Foods tested were broccoli, pepper, apple, raspberry, brown bread crust, white bread crust, croissant, pain au chocolat, sliced ham, cheddar cheese, olive and food-relevant brine.
We have shown using uninoculated controls that vortexing with beads, swabbing and pulsification recovery methods do not interfere with the Vero E6 infection assay. recovery. The processing methods, and recommended antibiotics in the cell culture media to remove or inhibit potential microbial contaminants, had no effect on the Vero E6 cells.
We tested whether the food sample extracts affected the SARS-CoV-2 virus directly, by adding the extract to the virus, before incubating with Vero E6 cells. The results are summarised here and shown in full in Appendix 9.1.1. The data sets of samples were compared by one-way analysis of variance (ANOVA). There was no significant inactivation of SARS-CoV-2 for 10 of the 12 foods tested over the 1-hour contact period (p>0.05). However, we showed that food sample extracts recovered from olives and apples can partially inactivate SARS-CoV-2 within 60 minutes of exposure, suggesting that there are chemicals in apple and olive that are capable of inactivating SARS-CoV-2 virus. This was investigated further and will be discussed in section 6.3.2.1. When brine was added to the virus for 60 minutes and then incubated with Vero E6 cells for 60 minutes, the resulting monolayer was intact, but much thinner than with all other sample extracts.
We have determined recovery efficiency by looking at inoculated time - zero controls for each method, namely vortexing with beads, pulsification and swabbing. For 10/12 foods tested, there was at least one method that gave good recovery, marked in bold in Table 2. The method that gave good recovery was used in all subsequent testing.
For apple and olive there was poor recovery with all methods investigated, probably due to virus inactivation rather than poor recovery per-se.
Table 2 Summary of percentage recovery efficiencies of inoculated SARS-CoV-2 on foods after 1 hour contact using the different extraction methods.
| Food | Pulsification | Bead/Vortex | Swab |
|---|---|---|---|
| Infection Medium only | 90 | 95 | Not tested |
| Pepper | 93 | 20 | 20 |
| Broccoli | 10 | 2 | 35 |
| Apple | 0.92 | 3.3 | 5.7 |
| Raspberry | 0 | 1.6 | 38 |
| Croissant | 28 | 63 | 11 |
| White bread crust | 26 | 35 | 1.2 |
| Brown bread crust | 27 | 36 | 1.9 |
| Pain au chocolat | 19 | 35 | 4.6 |
| Sliced ham | 34 | 39 | 8.6 |
| Cheddar Cheese | 28 | 59 | 6.8 |
| Olive | 0 | 2.2 | 1.2 |
| Brine | Not tested | 20 | Not tested |
6.2 Baseline parameters – food packaging
We determined the baseline parameters of all food packaging tests in this project. The food packaging tested were: PET1 bottles; PET1 trays, aluminium cans and composite drinks cartons. Full results can be seen in 9.2.1 and are summarised here.
Vortexing with beads for virus recovery, was used for all food packaging at all time points. Samples were vortexed for 60 seconds in 10 ml Infection Medium containing glass beads (Warnes et al., 2015).
We have shown using uninoculated controls that both bead/vortexing and pulsification recovery methods, coupled with the recommended antibiotics in the cell culture media, remove or inhibit potential microbial contaminants, or chemical inhibitors, that could interfere with the Vero E6 infection assay.
The data sets of samples were compared by one-way analysis of variance (ANOVA). There was no significant inactivation of SARS-CoV-2 for any of the food packaging tested over the 1 hr contact period (p>0.05).
We determined recovery efficiency by looking at inoculated zero - time controls for the bead/vortexing method, in the presence or absence of mucin. For all food packaging tested, there was good virus recovery, as shown in Table 3 and Figure 2. There were no significant differences in the presence or absence of mucin (p>0.05).
Figure 2 Comparison of PFU data for SARS-CoV-2 recovery on food packaging in the presence or absence of mucin after 1 hours’ incubation with virus.

Table 3 Summary of percentage recovery efficiencies of inoculated SARS-CoV-2 (in presence or absence of mucin) on food packaging after 1 hour contact using the vortexing with beads method.
| Food Packaging | Beads/Vortex |
|---|---|
| PET1 bottle | 68 |
| PET1 bottle with added mucin | 65 |
| PET1 tray | 45 |
| Aluminium can | 60 |
| Aluminium can with added mucin | 54 |
| Composite drinks carton | 72 |
| Composite drinks carton with added mucin | 58 |
6.3 Time course of SARS-CoV-2 survival on food surfaces
6.3.1 Fresh vegetables
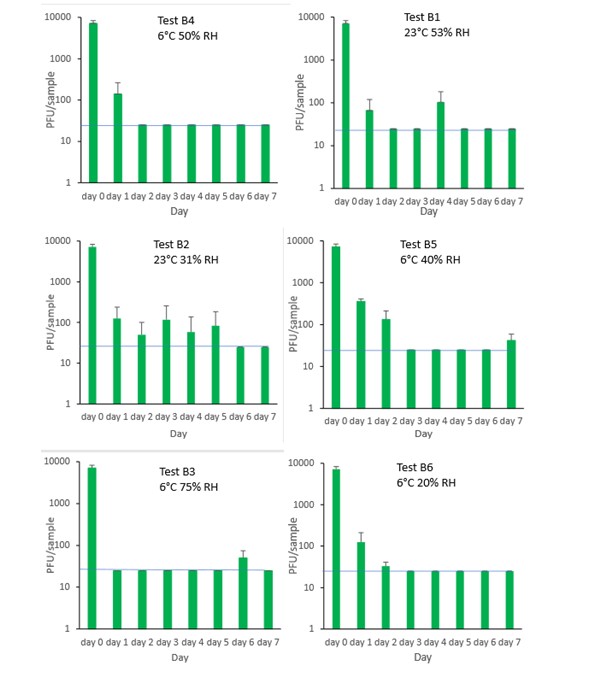
6.3.1.1 Broccoli
The results (triplicate tests) for broccoli incubated for up to 7 days with SARS-CoV-2 are shown in Figure 3 (in full in 9.1.2.1). The following code is used throughout: B (Broccoli). The results showed that broccoli remained intact after processing by swabbing and this was the best method for virus recovery. Artificially contaminated samples were incubated at ambient and chilled temperatures, as broccoli is displayed and stored in retail environments at room temperature (23°C) and in chill (6°C) conditions. However, it became difficult to incubate the tests for longer than 3 days at ambient temperature due the pronounced deterioration of the broccoli. Consequently, after completing 2 tests, further tests in ambient conditions were discontinued. It is unlikely that consumers would buy broccoli in such an advanced state of decomposition. The remaining 4 tests concentrated on chill temperature.
There was little difference in inactivation of virus in broccoli at any humidity tested. Furthermore, there was little difference of chill versus ambient temperature on virus inactivation. At ambient temperature and at chilled temperatures, at the contamination concentration used, SARS-CoV-2 reaches low levels, slightly above the LOD, within 1 day on broccoli. At 24 hours (day 1), there is more than 1-log10 reduction (i.e. >90% decrease) in virus levels in all test conditions. Levels of virus recovered subsequently remained low, with some fluctuations, until they were completely undetectable by day 5.
At 23°C, there was a significant difference (p<0.05) between PFU at day 0 and all subsequent time points for B1 and B2 (days 1, 2, 3, 4, 5, 6, 7). At 6°C, there was a significant difference (p<0.05) between PFU at day 0 and all subsequent time points for B3, B4, B5 and B6. There were no other statistical differences between any samples, at any RH, temperature or time point.
Figure 3 All PFU data for virus inactivation on broccoli shown as individual graphs.
The blue line () marks the limit of detection of 25 PFU/sample
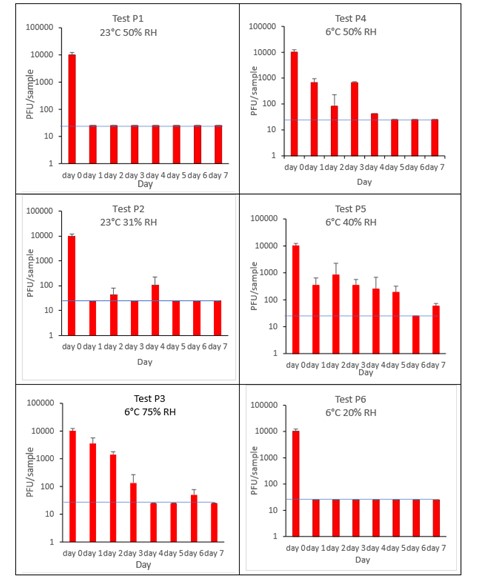
6.3.1.2 Pepper
The results (triplicate tests) for pepper incubated for up to 7 days with SARS-CoV-2 are shown in Figure 4 (and in 9.1.2.2). The following code is used throughout: P (Pepper).
The results showed that pepper remained intact after processing by pulsification and this was the best method for virus recovery from pepper. Artificially contaminated samples were incubated at ambient (23°C) and chilled (6°C) temperatures, as peppers are displayed and stored in retail environments at room temperature and in chill conditions. However, it became difficult to incubate the tests for longer than 3 days at ambient temperature due to the pronounced deterioration of the peppers, caused by fungal growth. Consequently, after completing 2 tests, further tests in ambient conditions were discontinued. It is unlikely that consumers would buy peppers in such an advanced state of decomposition. The remaining 4 tests concentrated on chill temperature.
The results show that in chilled conditions, SARS-CoV-2 inactivates slowly, to undetectable levels at the LOD by 5 days on pepper. For pepper, this happens faster at low relative humidity of 20% (P6) compared to higher humidity. In ambient conditions, the inactivation happens at a faster rate, with levels reaching near the limit of detection by day 1 (P1).
At 23°C, there was a significant difference (p<0.05) between PFU at day 0 and all subsequent time points for P1 and P2 (days 1, 2, 3, 4, 5, 6, 7). At 6°C, there was a significant difference (p<0.05) between PFU at day 0 and all subsequent time points for P3, P4, P5 and P6 (days 1, 2, 3, 4, 5, 6, 7). There were no other statistical differences between the samples at any RH, temperature, or time point.
Figure 4 All PFU data for virus inactivation on pepper shown as individual graphs.
The blue line () marks the limit of detection of 25 PFU/sample
6.3.2 Fresh fruit
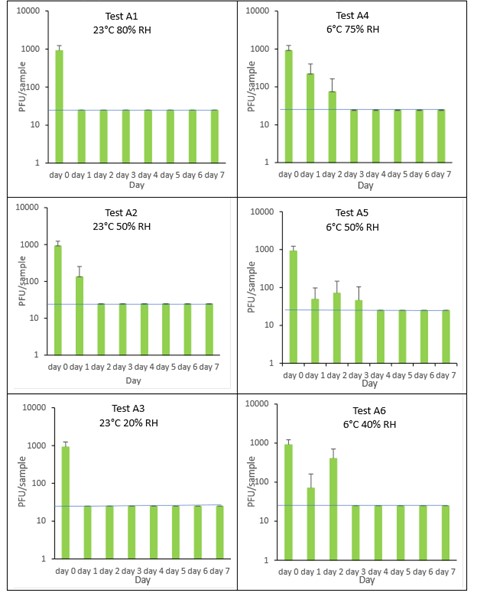
6.3.2.1 Apple
The results (triplicate tests) for apple incubated for up to 7 days with SARS-CoV-2 are shown in Figure 5 (and in 9.1.3.1). The following code is used throughout: A (apple).
The results showed that apple remained intact after processing by swabbing and this was the best method for virus recovery from apple. Apples cut into 3 cm x 3 cm pieces remained intact after processing by swabbing. Artificially contaminated samples were incubated at ambient (23°C) and chilled (6°C) temperatures, as apples are displayed and stored in retail environments at room temperature and in chill conditions.
Apple skin was shown to partially inactivate SARS-CoV-2 very quickly, with a low recovery efficiency of 4.6% from apple skin after 60 minutes incubation with SARS-CoV-2. After this rapid early inactivation, it took between 1 and 3 days for complete inactivation of SARS-CoV-2 on apple skin. This happened faster, at the higher temperature of 23˚C compared to the lower chill temperature of 6°C. The different humidity tested did not affect virus survival. In all tests on apple, we found virus was undetectable or levels were near the limit of detection by day 3 post-artificial contamination. We cannot determine if the decline in infectivity observed on apple skin is due to viral decay on the apple’s surface or a chemical from the apple skin inhibiting viral infectivity in Vero E6 cell culture. Further work, outside the scope of this study is needed to investigate this further.
At 23°C, there was a significant difference (p<0.05) between PFU at day 0 and all subsequent time points for A1, A2, and A3 (days 1, 2, 3, 4, 5, 6, 7). At 6°C, there was a significant difference (p<0.05) for A5 and A6 (days 1, 2, 3, 4, 5, 6, 7). There were no other statistical differences between the samples at any RH, temperature, or time point.
Figure 5 All PFU data for virus inactivation on apple shown as individual graphs.
The blue line () marks the limit of detection of 25 PFU/sample
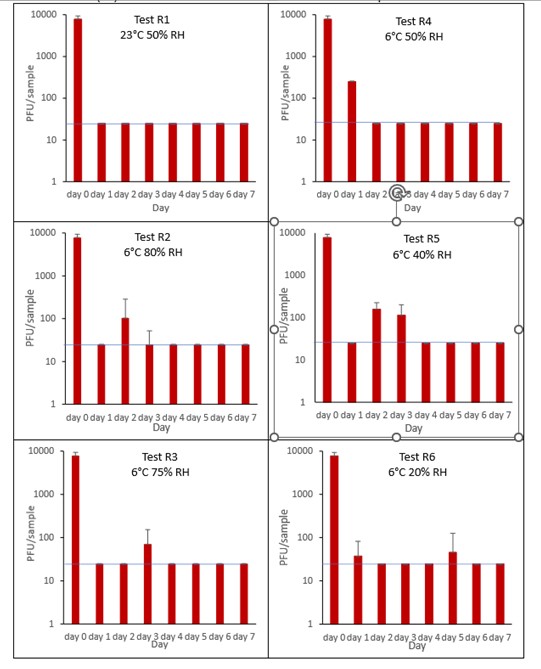
6.3.2.2 Raspberry
The results (triplicate tests) for raspberry incubated for up to 7 days with SARS-CoV-2 are shown in in Figure 6 (and in 9.1.3.2). The following code is used throughout: R (Raspberry).
Results showed that swabbing was the best method for virus recovery from raspberry. Single whole raspberries remained intact after processing by swabbing. It should be noted that the intricate structure, with its irregular surface, may make recovery from raspberry variable, as the virus may get stuck in the small crevices, not being accessible to the swab. Artificially contaminated samples were incubated at ambient (23°C) and chilled (6°C) temperatures, as raspberries are displayed and stored in retail environments at room temperature and in chill conditions. Tests were extended for up to 7 days even though it became clear that fruit decay occurred much earlier. Raspberries, and other soft fruits, are often consumed within a few days of collection and would not be bought by the consumer if they were showing signs of spoilage.
It is clear from the results that it can take between 1 and 5 days to reach the LOD for SARS-CoV-2 on raspberry surfaces. For raspberry, only one ambient temperature was tested as the fruit very quickly showed signs of spoilage. We cannot, therefore, make a temperature comparison. It is clear, though, that at 6˚C the virus is sometimes did not reach the limit of detection until later in the time course, with SARS-CoV-2 being detected as late as 5 days at the lowest humidity tested (R6, 6°C, 20% RH).
At 23°C, there was a significant difference (p<0.05) between PFU at day 0 and all subsequent time points for R1 (days 1, 2, 3, 4, 5, 6, 7). At 6°C, there was a significant difference (p<0.05) between PFU at day 0 and all subsequent time points for R2, R3, R4, R5 and R6 (days 1, 2, 3, 4, 5, 6, 7). There were no other statistical differences between the samples at any RH, temperature, or time point.
Figure 6 All PFU data for virus inactivation on raspberry shown as individual graphs.
The blue line () marks the limit of detection of 25 PFU/sample
6.3.3 Baked products and pastries
6.3.3.1 White bread crust
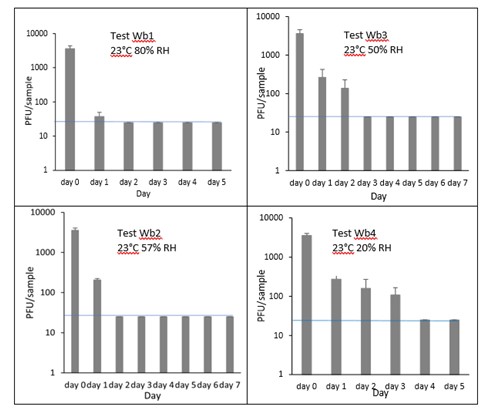
The results (triplicate tests) for white bread crust incubated for up to 7 days with SARS-CoV-2 are shown in Figure 7 (and in 9.1.4.1). The following code is used throughout: Wb (White bread crust).
Results showed that vortexing with beads was the best method for virus recovery from white bread crust. Artificially contaminated samples were incubated at ambient (23°C) temperature only, as baked goods are displayed and stored in retail environments at room temperature and not in chill conditions. The first two experiments were extended for up to 7 days, but it became clear that virus inactivation and food decay occurred much earlier. We therefore curtailed the time course to 5 days for subsequent tests on white bread crust.
In all conditions tested and at the contamination concentration used, by day 1 there was a 1-log10 reduction (i.e. >90% decrease) in virus levels on white bread crusts. Depending upon the particular conditions tested, the virus levels declined to undetectable levels, with a greater than 2-log10 reduction over 4 days, i.e. >99% of virus reached the limit of detection within 4 days. The slowest inactivation of virus was at the lowest humidity tested (Wb4 23°C 20% RH). Virus levels remained at low, but detectable until day 4 when levels reached the limit of detection.
At 23°C, there was a significant difference (p<0.05) between PFU at day 0 and all subsequent time points for Wb1, Wb2, Wb3 and Wb4 (days 1, 2, 3, 4, 5, 6, 7). There were no other statistical differences between the samples at any RH, temperature, or time point.
Figure 7 All PFU data for virus inactivation on white bread crust shown as individual graphs.
The blue line () marks the limit of detection of 25 PFU/sample
6.3.3.2 Brown bread crust
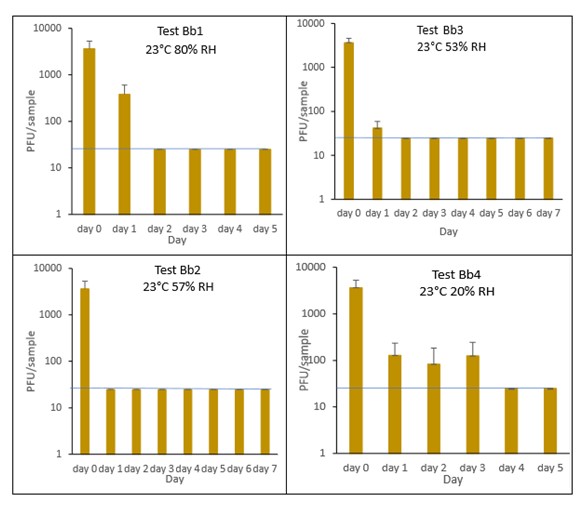
The results (triplicate tests) for brown bread crust incubated for up to 7 days with SARS-CoV-2 are shown in Figure 8 (and in 9.1.4.2). The following code is used throughout: Bb (Brown bread crust).
Results showed that vortexing with beads was the best method for virus recovery from brown bread crust. Artificially contaminated samples were incubated at ambient (23°C) temperature only, as baked goods are displayed and stored in retail environments at room temperature and not in chill conditions. The first two experiments were extended for up to 7 days, but it became clear that virus inactivation and food decay occurred much earlier. We therefore curtailed the time course to 5 days for subsequent tests on brown bread crust.
In all conditions tested and at the contamination concentration used, by day 1 there was a 1-log10 reduction (i.e. >90% decrease) in virus levels on brown bread crusts. Depending upon the particular condition tested, the virus levels declined to undetectable levels, with a greater than 2-log10 reduction over 4 days, i.e. >99% of virus reached the limit of detection within 4 days. The slowest inactivation of virus was at the lowest humidity tested (Bb4 23°C 20% RH). Virus levels remained at low, but detectable until day 4 when levels reached the limit of detection.
At 23°C, there was a significant difference (p<0.05) between PFU at day 0 and all subsequent time points for Bb2, Bb3 and Bb4 (days 1, 2, 3, 4, 5, 6, 7). There were no other statistical differences between the samples at any RH, temperature, or time point.
Figure 8 All PFU data for virus inactivation on brown bread crust shown as individual graphs.
The blue line () marks the limit of detection of 25 PFU/sample
6.3.3.3 Croissant
The results (triplicate tests) for croissant incubated for up to 7 days with SARS-CoV-2 are shown in Figure 9 and Figure 10 (and in 9.1.4.3). The following code is used throughout: Cr (croissant).
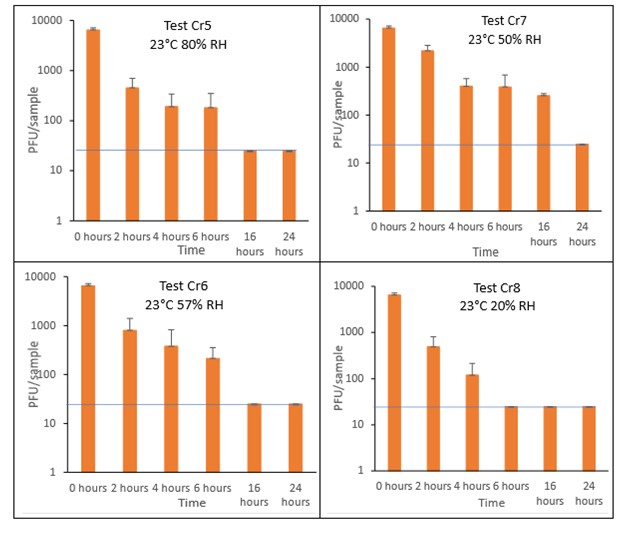
Results showed that vortexing with beads was the best method for virus recovery from croissant. Artificially contaminated samples were incubated at ambient (23°C) temperature only, as baked goods are displayed and stored in retail environments at room temperature and not in chill conditions. The first experiments were extended for up to 7 days, but it became clear that virus inactivation and food decay occurred much earlier. We therefore curtailed the time course to 5 days for the final test (Cr1) on croissant. At the end of the 7-day tests, it was clear that for croissant, inactivation occurred within 1 day. We therefore decided to narrow down the intervals in the first 24 hours to smaller intervals. We performed tests at 2, 4, 6 and 16 hours for croissant.
The virus inactivation happened quickly for croissants, with a greater than 2-log10 reduction (i.e. >99%) in virus levels by day 1. For shorter time intervals the results showed that levels of infectious SARS-CoV-2 decreased slowly over the first 6 hours and by 16 hours were at the limit of detection. The different humidity tested do not appear to make much difference to survival in this short time period.
At 23°C, in the 7-day time course, there was a significant difference (p<0.05) between PFU at day 0 and all subsequent time points for Cr1, Cr2, Cr3 and Cr4 (days 1, 2, 3, 4, 5, 6, 7). There were no other statistical differences between any samples, at any RH, at any time point. At 23°C, in the 24-hour time course, there was a significant difference (p<0.05) between PFU at day 0 and all subsequent time points for Cr5, Cr6, Cr7 and Cr8 (2, 4, 6, 16 and 24 hours). There were no other statistical differences between the samples at any RH, temperature, or time point.
Figure 9 All PFU data for virus inactivation for up to 7 days on croissant, shown as individual graphs.
The blue line () marks the limit of detection of 25 PFU/sample
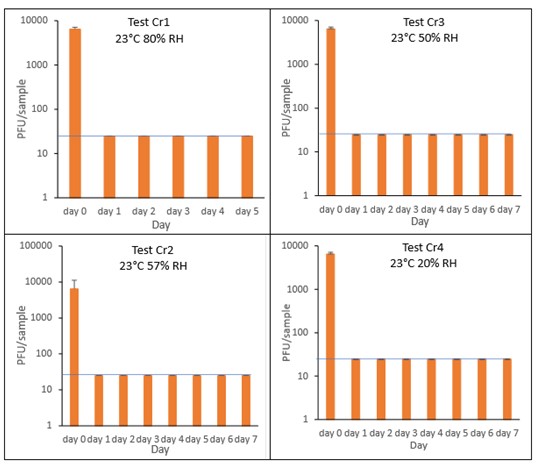
Figure 10 All PFU data for virus inactivation for up to 24 hours on croissant, shown as individual graphs.
The blue line () marks the limit of detection of 25 PFU/sample
6.3.3.4 Pain au chocolat
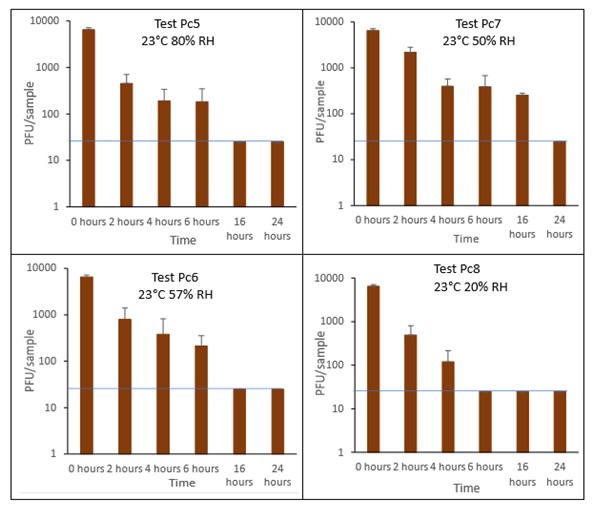
The results (triplicate tests) for pain au chocolat incubated for up to 7 days with SARS-CoV-2 are shown in Figure 11 and Figure 12 (and in 9.1.4.4). The following code is used throughout: Pc (Pain au chocolat).
Results showed that vortexing with beads was the best method for virus recovery from pain au chocolat. Artificially contaminated samples were incubated at ambient (23°C) temperature only, as baked goods are displayed and stored in retail environments at room temperature and not in chill conditions. The first two experiments were extended for up to 7 days, but it became clear that virus inactivation and food decay occurred much earlier. We therefore curtailed the time course to 5 days for subsequent tests on pain au chocolat. At the end of the 7-day tests, it was clear that for croissant, inactivation occurred within 1 day. We therefore decided to narrow down the intervals in the first 24 hours to smaller intervals: 2, 4, 6 and 16 hours for the pain au chocolat.
The virus inactivation happened quickly for pain au chocolat, with a greater than 2-log10 reduction (i.e. >99%) in virus levels by day 1. We therefore investigated shorter intervals and the results showed that levels of infectious SARS-CoV-2 decreased slowly over the first 6 hours and by 16 hours were at the limit of detection. The different humidity tested do not appear to make much difference to survival in this short time period.
At 23°C, in the 7-day time course, there was a significant difference (p<0.05) between PFU at day 0 and all subsequent time points for Pc2, Pc2, Pc3 and Pc4 (days 1, 2, 3, 4, 5, 6, 7). At 23°C, in the 24-hour time course, there was a significant difference (p<0.05) between PFU at time 0 and all subsequent time points for Pc5 and Pc8 (2, 4, 6, 16 and 24 hours). There were no other statistical differences between the samples at any RH, temperature, or time point.
Figure 11 All PFU data for virus inactivation for up to 7 days on pain au chocolat, shown as individual graphs.
The blue line () marks the limit of detection of 25 PFU/sample
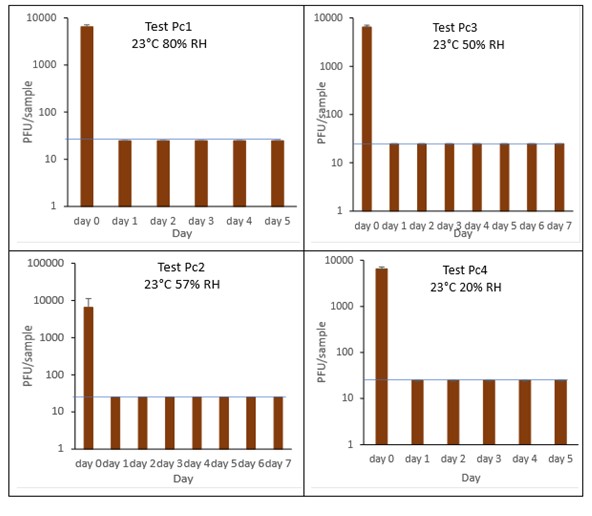
Figure 12 All PFU data for virus inactivation for up to 24 hours on pain au chocolat, shown as individual graphs.
The blue line () marks the limit of detection of 25 PFU/sample
6.3.4 Delicatessen items
6.3.4.1 Sliced ham
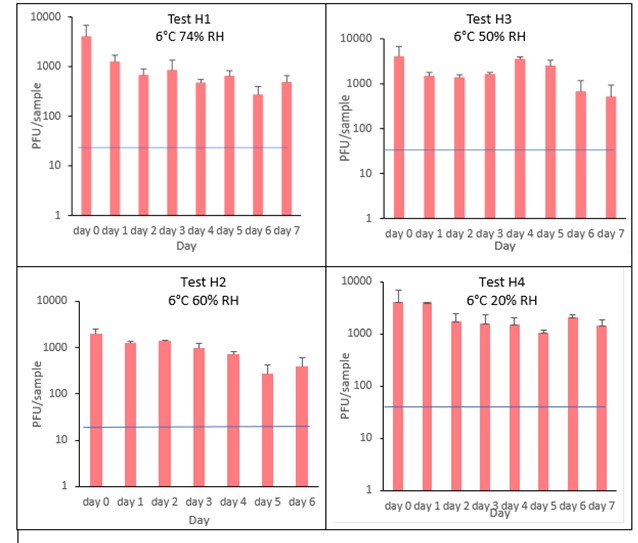
The results (triplicate tests) for sliced ham incubated for up to 7 days with SARS-CoV-2 are shown in Figure 13 (and in 9.1.5.1). The following code is used throughout: H (Ham).
The results showed that ham remained intact after vortexing with beads and this was the best method for virus recovery from ham. Artificially contaminated samples were incubated at chilled (6°C) temperatures, as ham is displayed and stored in retail environments in chill conditions. In all conditions tested and at the contamination concentration used, by day 1 there is about 0.5-log10 reduction (i.e. 70% decrease) in virus levels on sliced ham, depending upon the particular conditions tested. The virus levels remained relatively stable reaching a plateau over the testing period, with a maximum of about 1-log10 reduction by 7 days. There were only minor differences between all conditions tested.
At 6°C, there were no significant differences (p>0.05) between PFU at day 0 and day 1 for H1, H2, H3 and H4, under all test conditions. Similarly, under all test conditions, for H1, H2, H3 and H4, there were no significant differences (p>0.05) between PFU at day 1 and day 2; between PFU at day 2 and day 3; between PFU at day 3 and day 4; between PFU at day 4 and day 5; between PFU at day 5 and day 6 and between PFU at day 6 and day 7.
Figure 13 All PFU data for virus inactivation on ham shown as individual graphs.
The blue line () marks the limit of detection of 25 PFU/sample
6.3.4.2 Cheddar cheese
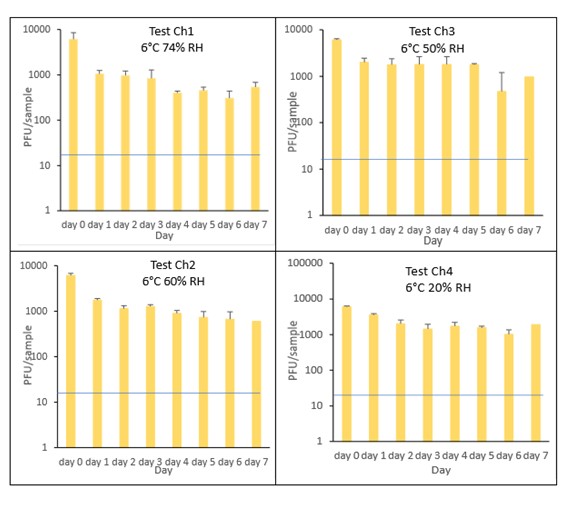
The results (triplicate tests) for cheddar cheese incubated for up to 7 days with SARS-CoV-2 are shown in Figure 14 (and in 9.1.5.2). The following code is used throughout: Ch (cheese).
The results showed that cheese remained intact after vortexing with beads and this was the best method for virus recovery. Artificially contaminated samples were incubated at chilled (6°C) temperatures, as cheese is displayed and stored in retail environments in chill conditions. In all conditions tested and at the contamination concentration used, by day 1 there was a maximum of 0.7-log10 reduction (i.e. 80% decrease) in virus levels on cheddar cheese, depending upon the particular conditions tested. The virus levels remained relatively stable reaching a plateau over the testing period, with a maximum of about 1-log10 reduction by 7 days. There were only minor differences between all conditions tested.
At 6°C, there were no significant differences (p>0.05) between PFU at day 0 and day 1 for Ch1, Ch2, Ch3 and Ch4, under all test conditions. Similarly, under all test conditions, for Ch1, Ch2, Ch3 and Ch4, there were no significant differences (p>0.05) between PFU at day 1 and day 2; between PFU at day 2 and day 3; between PFU at day 3 and day 4; between PFU at day 4 and day 5; between PFU at day 5 and day 6 and between PFU at day 6 and day 7.
Figure 14 All PFU data for virus inactivation on cheese shown as individual graphs.
The blue line () marks the limit of detection of 25 PFU/sample
6.3.4.3 Olive
The results (triplicate tests) for olive incubated for up to 2 days with SARS-CoV-2 are shown in Figure 15 (and in 9.1.5.3). The following code is used throughout: O (Olive).
The results showed that olives remained intact after processing by swabbing and this was the best method for virus recovery from olives, even though the recovery was very low (2.2%) after the 1 hour initial contact. Artificially contaminated samples were incubated at chilled (6°C) temperatures, as olives are displayed and stored in retail environments in chill conditions. From the results at the end of day 1, it was clear that for olive, inactivation occurred within a very short time period. We therefore decided to curtail the test at 1 day and narrow down the intervals in the first 60 minutes after artificially contaminating the olive with virus. We therefore did not run complete 7-day time course tests under different conditions for olive.
The results show there is more than 97% recovery (1.7-log10 reduction) of SARS-CoV-2 at 1 minute after artificial contamination and undetectable levels at the LOD at 24 hours. The data set of samples were compared by ordinary one-way analysis of variance (ANOVA). At 6°C, there was a significant difference (p<0.0001) between PFU at 0 minutes and all subsequent time points.
Figure 15 PFU data for virus inactivation on olive.
The blue line () marks the limit of detection of 25 PFU/sample

6.3.4.4 Brine
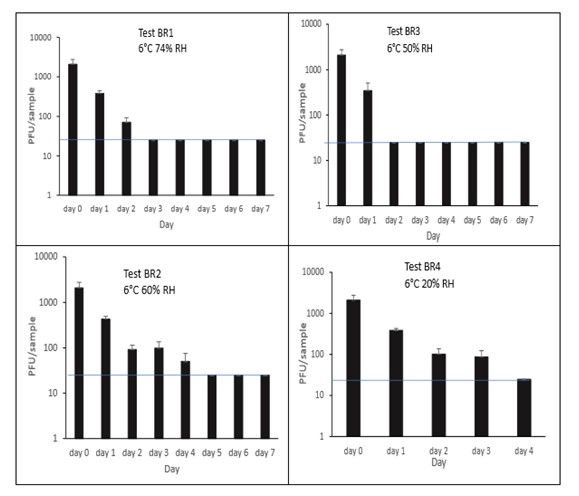
The results (triplicate tests) for brine incubated for up to 7 days with SARS-CoV-2 are shown in Figure 16 (and in 9.1.5.4). The following code is used throughout: BR (Brine).
Artificially contaminated brine samples were incubated at chill (6°C) temperature only, as deli items are displayed and stored in refrigerated conditions. For brine, being a liquid, processing was performed by vortexing. Three of the tests were extended to 7 days as standard. The final test on brine was stopped at 4 days rather than extending to 7 days, as there was no detectable virus at 4 days under all other conditions tested.
Recovery of active SARS-CoV-2 when added to brine, gradually decreased over time. As expected, the different relative humidity did not have an appreciable effect on viral infectivity. In all tests, there was less than a 1-log10 reduction after 1 day, with complete inactivation occurring by day 4 under all conditions tested. There was a significant difference (p<0.05) between PFU at day 0 and all subsequent time points (days 1, 2, 3, 4, 5, 6, 7). There were no other statistical differences between any samples, at any RH, at any time point.
Figure 16 All PFU data for virus inactivation on brine shown as individual graphs.
The blue line () marks the limit of detection of 25 PFU/sample
6.4 Time course of SARS-CoV-2 survival on food packaging materials
6.4.1 PET1 plastic bottles in the presence or absence of mucin
The results (triplicate tests) for PET1 bottles incubated for up to 7 days with SARS-CoV-2 are shown in Figure 17, Figure 18 and Figure 19 (and in 9.2.2.1 and 9.2.2.2). The following codes are used throughout: PB (PET1 bottle); and PBM (PET1 bottle with 0.1% w/v mucin added to the virus inoculum).
Vortexing with beads, was used for virus recovery from PET1 bottles. Artificially contaminated PET1 bottles were incubated at ambient (21°C) and chill (6°C) temperatures, as PET1 bottles are displayed and stored in refrigerated and ambient conditions. Under all conditions tested and at the contamination concentration used, at 21°C, the virus survives at 53% RH, with a 99% decrease not seen until day 3 on PET1 bottle. However, the virus is not as stable at 20% RH and 80% RH at 21°C, with rapid inactivation of >99% decrease in viral levels by day 1 after artificial contamination. Under chill conditions, at 6°C, the virus remains detectable over several days in all 3 relative humidity conditions tested. At day 1 there is less than 1-log10 reduction (i.e. <90% decrease) in virus levels. Depending upon conditions tested, the virus levels dropped slowly, with some fluctuations. The virus did not decline to undetectable levels, with a greater than 2-log10 reduction (i.e. >99% decrease), until at least day 5, with virus remaining detectable until day 6 in some conditions.
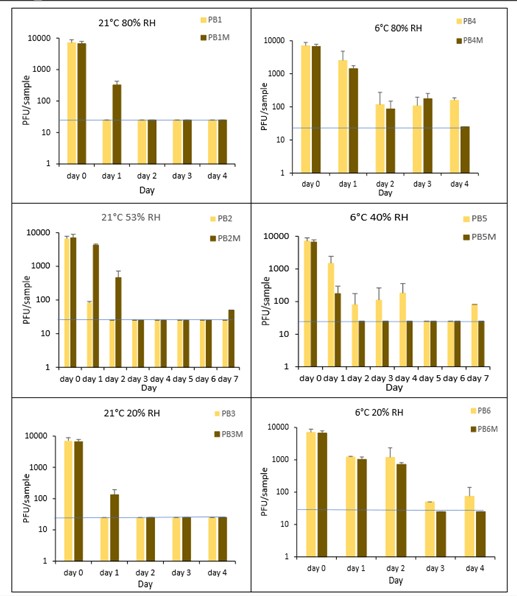
The effect of adding mucin was variable; in some conditions the virus reached the limit of detection more slowly with added mucin; in others it is inactivated more rapidly with mucin added. At ambient temperature there is complete inactivation of virus by day 3, both with and without mucin. When virus was added without mucin at 53% RH, there was a small reduction in infectious virus at day 1, gradually declining to undetectable levels by day 3. However, with mucin present in the viral inoculum, there was a faster decrease and complete inactivation occurred a day earlier at day 2. For virus at 20% and 80% RH in the presence of mucin, there was a significant decrease (p<0.05) in virus levels at day 1, with complete inactivation at day 2. In the absence of mucin, at these RH values, there is complete inactivation by day 1. By contrast, in chilled conditions, the time to complete inactivation is longer than at ambient temperatures. At 40% RH, complete inactivation is not seen until day 5 in the absence of mucin, whereas there is complete inactivation by day 2 if mucin is present. At 20% and 80% RH, the virus survival is very similar and is almost overlapping. In conclusion, there are some variations in virus survival if mucin is added to the SARS-CoV-2 inoculum, but the addition of mucin to the inoculum does not have any dramatic effect on virus survival on PET1 bottles.
There was a significant difference (p<0.05) between PFU at day 0 and all subsequent time points for PB1, PB3, PB4, PB5 and PB6. There was no significant difference between PB2 at day 0 and PB2 day 1. There was a significant difference (p<0.05) between PFU at day 1 and all subsequent time points for PB2. At 21°C, PB2, at day 1 had significantly higher levels (p<0.05) of virus remaining compared to both PB1 and PB3 at day 1. At all other time points the differences between PB1, PB2 and PB3 were not significant. At 6°C, there were no significant differences between PB4, PB5 and PB6 at any time point. There were no other statistical differences between the samples at any RH, temperature, or time point.
Figure 17 All PFU data for virus inactivation on PET1 bottles shown as individual graphs.
The blue line () marks the limit of detection of 25 PFU/sample
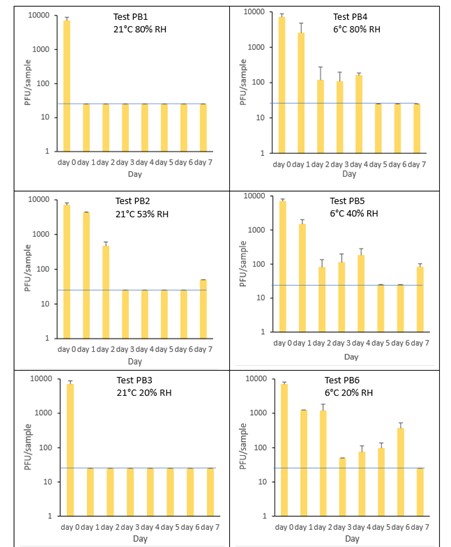
Figure 18 All PFU data for virus inactivation on PET1 bottles with mucin shown as individual graphs.
The blue line () marks the limit of detection of 25 PFU/sample
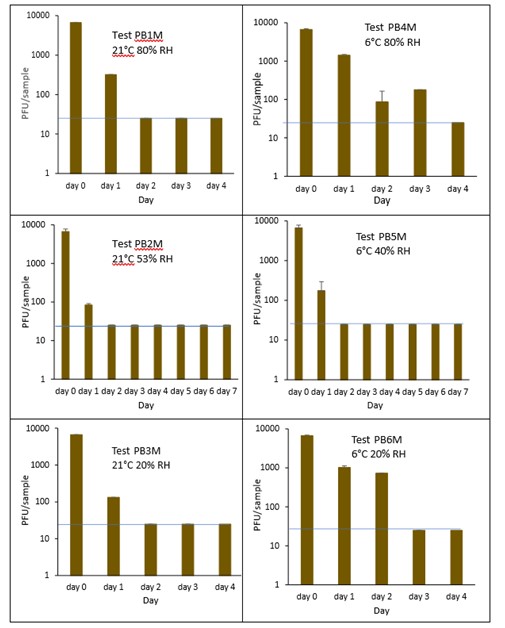
Figure 19 Comparison of PFU data for SARS-CoV-2 recovery on PET1 bottles in the presence or absence of mucin over time.
The blue line () marks the limit of detection of 25 PFU/sample
6.4.2 PET1 plastic trays
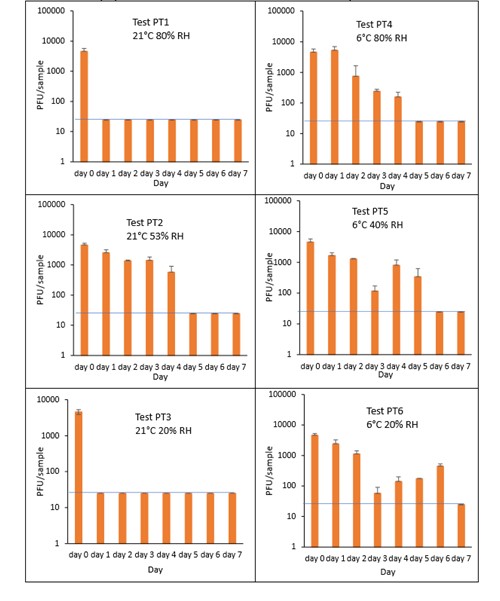
The results (triplicate tests) for PET1 trays incubated for up to 7 days with SARS-CoV-2 are shown in Figure 20 (and in 9.2.2.3). The following code is used throughout: PT (PET1 tray).
Vortexing with beads was used for virus recovery from PET1 trays. Artificially contaminated PET1 trays were incubated at ambient (21°C) and chill (6°C) temperatures, as PET1 trays are displayed and stored in refrigerated and ambient conditions. Under all conditions tested and at the contamination concentration used, at 21°C, the virus survives at 53% RH, with a 99% decrease not seen until day 5 for PET1 tray. However, the virus is not as stable at 20% RH and 80% RH at 21°C, with rapid inactivation of >99% decrease in viral levels by day 1 after artificial contamination. By contrast, under chill conditions at 6°C, the time to complete inactivation is longer. In all 3 RH conditions tested and at the contamination concentration used, the virus remains detectable over several days at 6°C. At day 1 there is less than 1-log10 reduction (i.e. <90% decrease) in virus levels. Depending upon the conditions tested, the virus levels dropped only slowly, with some fluctuations. The virus did not decline to undetectable levels, with a greater than 2-log10 reduction (i.e. >99% decrease), until at least day 5, with virus remaining detectable until day 6 in some conditions.
At 21°C, there was a significant difference (p<0.05) between PFU at day 0 and all subsequent time points for PT1 and PT3 (days 1, 2, 3, 4, 5, 6, 7). There was no significant difference between PT2, day 0 and PT2, day 1; nor between PT2, day 0 and PT2 day 2, nor between PT2, day 0 and PT2, day 3. There was no significant difference between PT4, day 0 and PT4 day 1. There was no significant difference between PT5, day 0 and PT5 day 1; nor between PT5, day 0 and PT5, day 2. There was no significant difference between PT6, day 0 and PT6 day 1; nor between PT6, day 0 and PT^, day 2. PT2 at day 1 had significantly higher levels (p<0.05) of virus remaining compared to both PT1 and PT 3 at day 1. At all other time points the differences between PT1, PT2 and PT3 were not significant (p>0.05).
At 6°C, PT4 at day 1, had significantly higher levels (p<0.05) of virus remaining compared to both PT5 and PT 6 at day 1. At all other time points the differences between PT4, PT5 and PT6 were not significant. PT4 at day 1, had significantly higher levels (p<0.05) of virus remaining compared to PT1. At all other time points the differences between PT4 and PT1 were not significant. PT6 at day 1, had significantly higher levels (p<0.05) of virus remaining compared to PT3. At all other time points the differences between PT6 and PT3 were not significant. At all-time points there was no significant differences between ambient and chilled at 53% RH and 40% RH (PT2 and PT5, respectively).
Figure 20 All PFU data for virus inactivation on PET1 trays shown as individual graphs.
The blue line () marks the limit of detection of 25 PFU/sample
6.4.3 Aluminium cans in the presence or absence of mucin
The results (triplicate tests) for aluminium cans incubated for up to 7 days with SARS-CoV-2 are shown in Figure 21, Figure 22, Figure 23 and Figure 24 (and in 9.2.2.4 and 9.2.2.5). The following codes are used throughout: AL (aluminium can); and ALM (aluminium can with 0.1% w/v mucin added to the virus inoculum).
Vortexing with beads, was used for virus recovery from aluminium cans. Artificially contaminated aluminium cans were incubated at ambient (21°C) and chill (6°C) temperatures, as aluminium cans are displayed and stored in refrigerated and ambient conditions. Under most conditions tested and at the contamination concentration used, by day 1 there is a more than 1-log10 reduction (i.e. >90% decrease) in virus levels on AL. Depending upon the condition tested, the virus levels decline rapidly to undetectable levels, with a greater than 2-log10 reduction over 4 days, i.e. >99% of virus reached the limit of detection within 4 days on AL. At 21°C >99% inactivation occurs within 1-2 days, depending on the relative humidity. There were, however, no significant differences between any of the RH tested, at days 2-7 at 21°C. At 6°C the virus survives for longer at all humidity tested, with a decrease of just 1-log10 until day 3, after which time the virus levels decrease to undetectable levels by day 4. However, there were no significant differences between any of the RH tested at days 2-7 at 6°C. There were no significant differences between any of the RH and temperatures tested, between days 2-7.
The addition of mucin to the SARS-CoV-2 inoculum was investigated for its effect on the duration of virus survival on aluminium cans (Figure 23). Under all conditions tested and at the contamination concentration used, the effect of adding mucin to the SARS-CoV-2 inoculum was variable. At 21°C, the virus survived for the same durations in the presence or absence of mucin, with virus inactivation occurring by day 1 for 53% and 20% RH and day 2 for 80% RH. There were, however, no significant differences between any of the RH tested, at days 2-7 at 21°C. Since virus levels reached the LOD quickly at 21°C and 53% RH, we also investigated whether the addition of mucin changed the rate of virus inactivation in the first 24 hours at 21°C and 53% RH. Figure 24 shows that there were no significant differences at any time point tested up to 24 hours, in the presence or absence of added mucin. At 6°C, there was longer virus survival under all RH tested, in the presence or absence of mucin. There were, however, no significant differences between any of the RH tested, at days 2-7 at 6°C. There were also no significant differences between any of the RH and temperatures tested, between days 2-7.
At all 3 RHs tested, the virus inactivation in the presence of mucin was slower than in the absence of mucin. At 20% and 50% RH, the rate of inactivation was slightly slower with mucin, but complete inactivation occurred by day 3. At 80% RH at 6°C, levels did not reach undetectable levels until day 4. There was more infectious virus remaining with mucin present, at all time-points until day 4. However, these differences were not significant (p>0.05).
At both 6°C and 21°C, there was a significant difference (p<0.05) between PFU at day 0 and all subsequent time points (days 1, 2, 3, 4, 5, 6, 7) for AL1, AL2, AL3, AL4, AL5 and AL6. There were no significant differences between any of the RH tested, at days 2-7 at 21°C. There were no significant differences between any of the RH tested at days 2-7 at 6°C. In the presence of mucin, there was a significant difference (p<0.05) between PFU at day 0 and all subsequent time points (days 1, 2, 3, 4, 5, 6, 7) for AL1M, AL2M, AL3M, AL4M, AL5M and AL6M. There were no significant differences between any of the RH tested, at days 2-7 at 21°C in the presence of mucin. There were no significant differences between any of the RH and temperatures tested, in the presence or absence of added mucin, between days 1-7. There were no significant differences between the samples in the presence or absence of mucin at early time points, 1-6 hours.
Figure 21 All PFU data for virus inactivation on aluminium cans shown as individual graphs.
The blue line marks the limit of detection of 25 PFU/sample
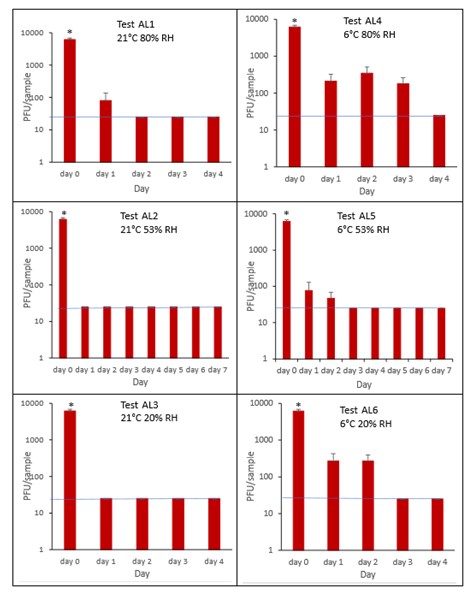
Figure 22 All PFU data for virus inactivation on aluminium cans with mucin shown as individual graphs.
The blue line marks the limit of detection of 25 PFU/sample
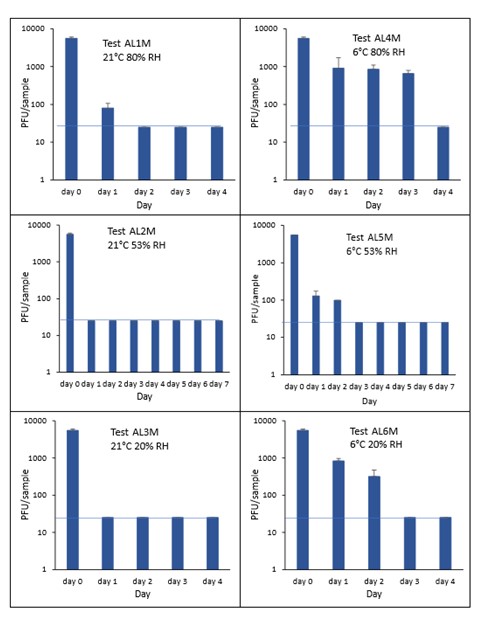
Figure 23 Comparison of PFU data for SARS-CoV-2 recovery on aluminium cans in the presence or absence of mucin over time.
The blue line marks the limit of detection of 25 PFU/sample
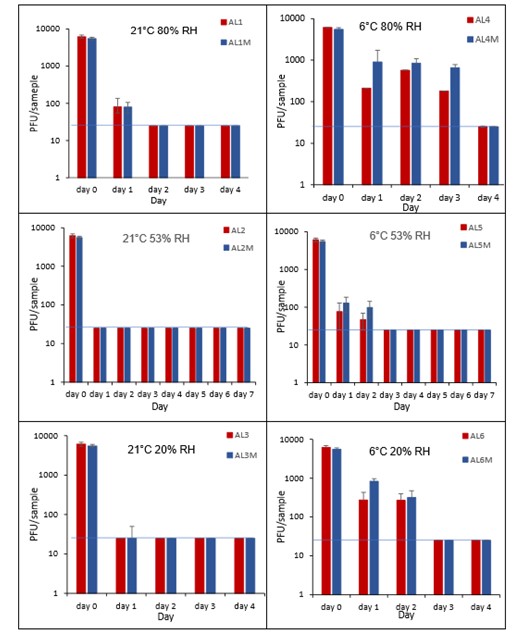
Figure 24 Comparison PFU data for SARS-CoV-2 inactivation on aluminium cans in the presence or absence of mucin over 24 hours at 21°C and 53% RH.
The blue line marks the limit of detection of 25 PFU/sample

Composite drinks cartons in the presence or absence of mucin
The results (triplicate tests) for composite drinks cartons incubated for up to 7 days with SARS-CoV-2 are shown in in Figure 25, Figure 26 and Figure 27 (and in 9.2.2.6 and 9.2.2.7). The following codes are used throughout: CC (composite drinks carton); and CCM (composite drinks carton with 0.1% w/v mucin added to the virus inoculum).
Vortexing with beads, was used for virus recovery from composite drinks cartons. Artificially contaminated composite drinks cartons were incubated at ambient (21°C) and chill (6°C) temperatures, as composite drinks cartons are displayed and stored in refrigerated and ambient conditions. Under most conditions tested and at the contamination concentration used, by day 1 there is a more than 1-log10 reduction (i.e. >90% decrease) in virus levels on composite drinks cartons. Depending upon the particular conditions tested, the virus levels decline rapidly to undetectable levels, with a greater than 2-log10 reduction over 4 days, i.e. >99% of virus is reached the limit of detection within 4 days on composite drinks cartons. At 21°C >99% inactivation occurs within 1-2 days, depending on the relative humidity. At a low temperature (6°C) the virus survives for longer at 53% and 80% RH, but not at 20% RH.
The addition of mucin to the SARS-CoV-2 inoculum was investigated for its effect on the duration of virus survival on composite drinks cartons. Under all conditions tested and at the contamination concentration used, the effect of adding mucin to the SARS-CoV-2 inoculum was variable.
At 21°C, at all RHs tested, 20%, 53% and 80% RH, the virus survived for the same durations in the presence or absence of mucin, with >99% decrease occurring by day 1 for 20%, 53% and 80% RH. Under chill conditions, at 6°C, there was longer virus survival at both 53% and 80% RH, in the presence or absence of mucin. At 6°C, 20% and 53% tested, the virus inactivation in the presence or absence of mucin occurred at a similar rate. At 80% RH, the rate of inactivation was slightly faster if mucin was present, with >99% virus inactivation occurring by day 2. However, at 80% RH at 6°C, there was not complete inactivation until day 4 without mucin.
In the presence of mucin, there was a significant difference (p<0.05) between PFU at day 0 and all subsequent time points (days 1, 2, 3, 4, 5, 6, 7) for CC1, CC2, CC3, CC4, CC5 and CC6. There were no significant differences between any of the RH tested, at days 2-7 at 21°C without added mucin. There were no significant differences between any of the RH tested at days 2-7 at 6°C with added mucin. In the presence of mucin, there was a significant difference (p<0.05) between PFU at day 0 and all subsequent time points (days 1, 2, 3, 4, 5, 6, 7) for CC1M, CC2M, CC3M, CC4M, CC5M and CC6M. There were no significant differences between any of the RH tested, at days 2-7 at 21°C with added mucin. There were no significant differences between any of the RH tested at days 2-7 at 6°C with added mucin. There were no other significant differences between any of the RH and temperatures tested, in the presence or absence of added mucin, between days 1-7.
Figure 25 All PFU data for virus inactivation on composite drinks cartons shown as individual graphs.
The blue line () marks the limit of detection of 25 PFU/sample
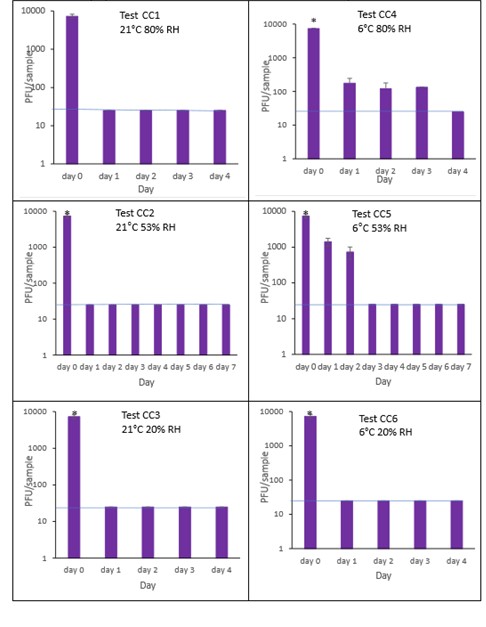
Figure 26 All PFU data for virus inactivation on composite drinks cartons with mucin shown as individual graphs.
The blue line () marks the limit of detection of 25 PFU/sample
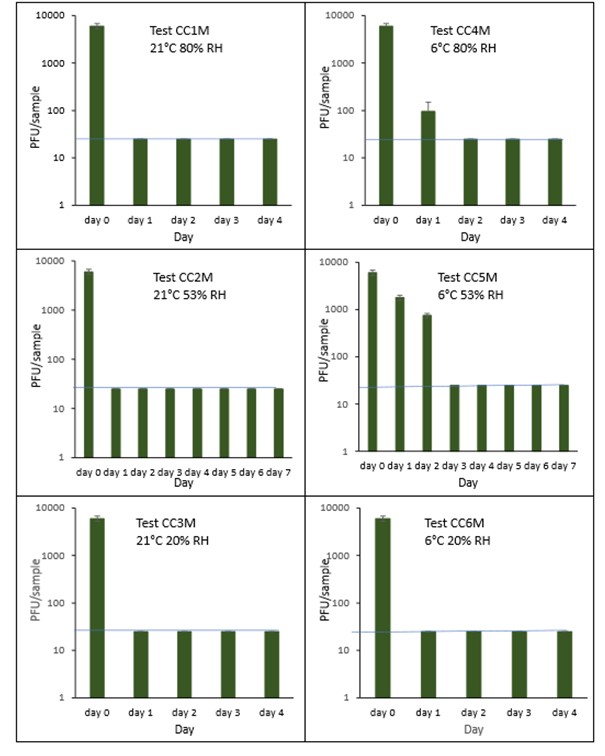
Figure 27 Comparison of PFU data for SARS-CoV-2 recovery on composite drinks cartons in the presence or absence of mucin over time.
The blue line () marks the limit of detection of 25 PFU/sample
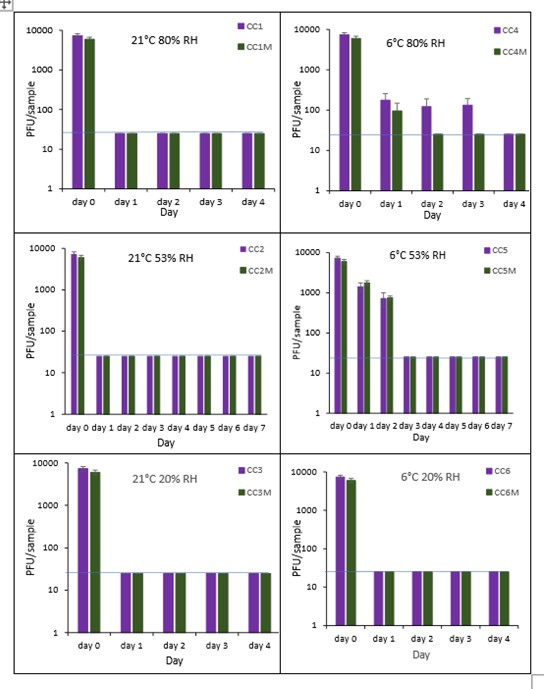
We conducted a laboratory-based study artificially contaminating infectious SARS-CoV-2 virus onto the surfaces of foods and food packaging. We then measured how the amount of infectious virus present on those surfaces declined over time. The foods tested were selected because they are commonly sold loose on supermarkets shelves or uncovered at deli counters or market stalls, they may be difficult to wash, and they are often consumed without any further processing i.e. cooking. The food packaging materials were selected as they are the most used food packaging materials or consumption of the product may involve direct mouth contact with the packaging. They were studied at a range of temperatures and humidity levels and over time periods that reflect their typical storage conditions. SARS-CoV-2 virus was added to the foods and food packaging at a volume that represents respiratory droplets landing on their surfaces. The concentration of virus added was determined by titre of virus we propagated in the method widely used in COVID studies, i.e. using the cell line Vero E6, which expresses the ACE2 receptor for SARS-CoV-2 attachment and entry. Infectious virus was recovered from the foods by the method that gave the highest recovery titre of the three methods tested. These methods were pulsification, vortexing with beads or swabbing. For food packaging, we used vortexing with beads for virus recovery (Warnes et al., 2015). Recovered infectious virus was quantified by plaque assay infection of Vero E6 cells and statistical significance of virus survival between the different incubation parameters and food or packaging materials determined using two-way ANOVA followed by Tukey’s multiple comparisons post-hoc tests. For all tests, the LOD was 25 PFU/sample. Therefore, the virus may have survived at low levels, fewer than 25 PFU, throughout the duration of the 7-day tests under the conditions tested. We cannot determine whether this low level of contamination could have an effect on virus transmission and whether this would have any potential health risks.
Results showed that virus survival varied depending on the foods and food packaging examined. For most foods tested there was a significant drop in levels of virus contamination over the first 24 hours. In several cases, e.g., peppers, bread crust, ham, and cheese, infectious virus was detected for several days under some conditions. Even on the surfaces of croissants and pain au chocolate, infectious virus could be found for several hours. For a highly infectious agent such as SARS-CoV-2, which can be transmitted through touching contaminated surfaces and then the face, these findings are highly noteworthy.
7.1 SARS-CoV-2 survival on food surfaces
7.1.1 Fresh vegetables
There have been few studies on survival of Coronaviradae on fresh vegetables. On iceberg lettuce the virus could not be detected after 4 days at 4oC (Yépiz-Gómez, 2013). In one study (Dhakal et al., 2021), mushrooms demonstrated a reduction in infectious viral titres for SARS-CoV-2 over 24 hours. The authors suggest that this antiviral activity may be due in part to ganodermadiol, a sterol in mushrooms, which has been shown to be effective against other viruses. In the same 24 hour-study, levels of SARS-CoV-2 were relatively stable on spinach and lettuce. The virus is expected to survive better at chill temperatures on foods and packaging materials compared to ambient temperatures (Anelich et al., 2020) but for fresh vegetables presented in this report the difference between survival at chill and ambient conditions, is not so clear cut. For example, this study’s results suggests that on the surface of broccoli, SARS-CoV-2 survives for the longest time, up to 5 days, at the ambient temperature of 23°C and 31% RH. On pepper the virus survives for longest (up to 7 days) at the chill temperature of 6°C and 40% RH. The differences are however not statistically significant.
7.1.2 Fresh fruit
There have been few studies on the survival of Coronaviridae on fresh fruit. HuCoV-229E has been used as a safer surrogate for SARS-CoV, and latterly SARS-CoV-2, and when inoculated onto strawberries could not be detected during the initial recovery determination tests (Yépiz-Gómez, 2013). Apple skin can partially inactivate SARS-CoV-2 within 60 minutes of contact, suggesting that there are chemicals in apple that have antiviral properties. Apple skin contains phenolic derivatives such as catechin, procyanidin, caffeic acid and chlorogenic acid, among other components, which are also found in the pulp and have strong antibacterial activity (Alberto et al., 2006) and anti-viral activity (Blondin-Brosseau et al., 2021). Moreover, the skin contains flavonoids, not present in pulp, such as quercetin glycosides and cyanidin glycosides. Of note, quercetin (3,3′,4′5,7-pentahydroxyflavone) at approximately 4.4mg/100g, is a well-known flavonoid with antioxidant properties; its antiviral properties have been investigated in numerous studies, including inhibiting polymerases, proteases, reverse transcriptase, suppressing DNA gyrase, and binding viral capsid proteins (Colunga Biancatelli et al., 2020). SARS-CoV 3CL protease is an important enzyme associated with viral transcription and replication to ultimately aid in viral infection through involvement in the maturation of viral particles and cleavage of the viral capsid. The ability to inhibit the activity of this viral protease could restrict viral replication. Quercetin inhibits SARS-CoV 3CL protease by binding to its GLN189 site, similarly, expressed by SARS-CoV-2 and this provides a direct mechanistic rationale for its experimental clinical use to treat COVID-19. There is an ongoing randomized control trial in Turkey examining the role of quercetin in COVID-19 treatment (Onal, 2020). In the trial, 95 patients with COVID-19 are receiving a 1,000-mg active treatment dose and 113 healthcare workers are receiving a 500-mg dose as prophylaxis. At the time of writing no trial data have been released. A recent study using a related coronavirus, HuCoV-229E, artificially inoculated onto apple skin, demonstrated that viral infectivity declines within a few hours post-contamination on apples, and no infectious virus was detected at 24 h post-contamination (Blondin-Brosseau et al., 2021). The authors demonstrated a similar low recovery efficiency, of just 5.81%, in similar conditions as tested here (21°C and between 30-40% RH), in line with the recovery efficiency in this report of 4.6% from apple skin. The results suggest that the acidic pH of apple skin (approximately pH 3) may influence the infectivity of this related coronavirus, HCoV-229E, by interfering with the virus’s spike protein. It is also possible that any protective or cleaning coating added to the apples during factory processing may be toxic to SARS-CoV-2. These coatings may include a thin layer of protective natural wax to prevent dehydration (Schwarcz, 2017). Further investigation is needed to determine which factors are important for inactivation of SARS-CoV-2 on apple skin.
The SARS-CoV-2 virus is expected to survive better at chill temperatures on foods compared to ambient temperatures (Anelich et al., 2020). Although direct comparisons between studies are difficult due to differences in processing methods, the study described here suggests this may be the case for raspberries. There is variable survival of SARS-CoV-2 of at least some, albeit small levels of virus, on raspberry. This might be due to the irregular surface topography of raspberries, making recovery inconsistent. The pitted surfaces of raspberries may protect the virus from desiccation. Flavonoids are also found in raspberries but may not have as great an anti-viral effect as those found in apples, as their levels are much lower (approximately 1 mg/100g) (Määttä-Riihinen et al., 2004).
7.1.3 Baked products and pastries
Several studies have investigated the survival of SARS-CoV-2 under a number of different environmental conditions and have shown that viral persistence under indoor conditions is complex and may be driven by many factors, including surface type, surface porosity, droplet or aerosol size, temperature, relative humidity and matrix (Aboubakr et al., 2020). Direct comparisons between studies are also difficult due to differences in processing methods. One study found that survival on some surfaces was better in low humidity conditions of 20% RH (Biryukov et al., 2020), matching the observation of longer survival at low humidity levels, observed in our study for white bread crusts and brown bread crusts.
Although not statistically significant, it is interesting that under some conditions, virus inactivation was slower over time on white bread crusts than on brown bread crusts. We speculate that possible explanations could be the presence of inhibitory substances, such as arabinoxylan, present in the higher levels of fibre found in brown bread. However, white bread has extra processing compared to brown bread, with the addition of bleaching agents which could potentially be inhibitory as well. It would be interesting to investigate the effects of the separate ingredients on the inactivation of SARS-CoV-2, although this is beyond the scope of this study.
We do not know why the pastries, croissants and pain au chocolat, inactivate the virus so quickly, but we can speculate. The pastries are both coated with a liquid egg wash (Retailer, personal communication), which may have an inhibitory effect on the virus. Eggs have one of the highest levels of arachidonic acid in the human diet. It has been suggested that arachidonic acid and other unsaturated fatty acids which are present in high levels in eggs, may serve as anti-viral compounds (Das, 2020). These anti-viral compounds were suggested to be active against enveloped viruses and the paper suggests they might be active against SARS-CoV-2. Indeed, SARS-CoV-2 was unable to propagate in embryonated chicken eggs, unlike influenza virus (Barr et al., 2020).
7.1.4 Delicatessen items
There have been other studies looking at SARS-CoV-2 survival on deli items, but as far as we know, this study is the first to investigate the virus’s survival under defined relative humidity conditions on sliced ham and cheddar cheese. In one study, it was found that SARS-CoV-2 can survive on processed meats for up to 21 days kept in refrigerated conditions (Jia et al., 2022). The authors suggest that these types of deli items have a high saturated fat, protein and moisture content which could prolong potential infectivity of SARS-CoV-2, probably by preventing their desiccation and inactivation. Another research group found similar results, although they only looked at virus survival times up to 24 hours at 4°C on chicken thigh, salmon and prawns (Dhakal et al., 2021). As in this study, they also found that deli items high in protein and saturated fat, with a relatively high-water content, supported longer virus survival. The mechanism of how SARS-CoV-2 and other enveloped viruses attach to foods has yet to be determined. However, these studies and the findings in this report, showing the long survival time of SARS-CoV-2 on sliced ham and cheddar cheese, with their high protein, saturated fat and water content, highlight the importance of proper food handling to prevent any contamination by virus prior to consumption.
The recovery of virus from olives was very low, even after contact of just one minute. Since we used intact whole olives, it is likely that any inactivation of SARS-CoV-2 is due to chemicals on the skin. Although there has been little published work on the anti-SARS-CoV-2 properties of olive skin, olives are a rich source of bioactive polyphenols which have been reported to exhibit antiviral activity against various viruses (Yamada et al., 2009). OliveNet™ is an active directory of phytochemicals obtained from different parts of the olive tree (Bonvino et al., 2018). The research by OliveNet™ identified polyphenols, such as olive secoiridoids as inhibitors of SARS-CoV-2 entry and replication. Olives are also composed of other polyphenols-like flavonoids (i.e., quercetins, also found in apples), triterpenes, and lignans all of which have potential anti-viral effects (Hashmi et al., 2015). Hydroxytyrosol is one of the main phenolic compounds in olives and its postulated biological activities are antioxidant, anti-inflammatory, anticancer, antimicrobial and antiviral. Hydroxytyrosolis’ antiviral activity has been reported against influenza-A virus and human immunodeficiency virus (HIV) (Bedoya et al., 2016; Takeda et al., 2021). Although no direct evidence has been shown, these antiviral effects might indicate that hydroxytyrosolis is effective against the viral envelope, making SARS-CoV-2 more fragile and hence inactivated in its presence. Several models have suggested that triterpenes, including those found in low levels on olive skin, also have promising structural motifs as SARS-CoV-2 protease inhibitors (Alhadrami et al., 2021).
This study showed that SARS-CoV-2 could survive up to 4 days in brine. A study on enveloped viruses, similar to SARS-CoV-2, found that increased salinity had a detrimental effect on virus stability, reporting lower survival of human and swine influenza viruses as NaCl (sodium chloride or salt) concentrations increased (Poulson et al., 2016). However, another study observed two H5N1 avian influenza viruses: one (A/whooper swan/Mongolia/244/2005) was most stable in water with no added salts (<100 ppm saline) while the other (A/duck meat/Anyang/2001) persisted longest at 15,000 ppm (Brown et al., 2007). The mechanism behind these varying responses to salinity is unknown, but this difference might be due to the host from which the lipid bilayer of the virus was derived and the glycosylation moieties of the surface proteins (Poulson et al. 2016). It appears that the antiviral effect of sodium chloride is strongly dependant on the salt concentration, pH value and on the type of virus.
7.2 Time course of SARS-CoV-2 survival on food packaging materials
7.2.1 PET1 bottles and trays
Potential fomite transmission of SARS-CoV-2 has been studied widely in the last year. This report confirms the findings of previous studies on other enveloped viruses (Warnes et al., 2015; Casanova et al., 2010).
Other studies have used different methods of testing, with many studies looking at RNA recovery rather than viable virus recovery. These different methods make it hard to compare experimental conditions, most previous authors observed long survival of infectious viral particles on plastic and other inanimate surfaces, ranging from hours to weeks. One study showed that SARS-CoV-2 inoculated on glass showed a 2-log10 reduction of culturable virus after 14 days at 4oC (Chin et al., 2020). In this study, on PET1 bottles and PET1 trays, it is unclear why the virus survives for longer at 21°C, 53% RH, compared to 20% and 80% RH. Several studies have investigated the survival of SARS-CoV-2 under several different environmental conditions and have shown that viral persistence under indoor conditions is complex and may be driven by many factors, including surface type, surface porosity, virus in droplets or aerosols, temperature, relative humidity and matrix (Aboubakr et al., 2020). Different inoculum concentrations and volumes, ambient temperatures and relative humidity cause discrepancies and make comparisons difficult. However, most studies broadly agree with our findings, that SARS-CoV-2 can survive on plastic for between 3 days and 7 days, at either 21-23°C or at 4°C (van Doremalen et al., 2020; Liu et al., 2021; Gidari et al., 2021 and Chin et al., 2020). The study by van Doremalen, (2020), was important in providing the first evidence that SARS-CoV-2 could survive for many days on inanimate surfaces (van Doremalen et al., 2020). We have also previously shown survival of the similar HuCoV-229E on plastics for 4-5 days (Warnes et al., 2015). Another study (Casanova et al., 2010) using surrogate viruses, found that virus survival was enhanced by the lower temperature of 4°C, but the relationship between survival and relative humidity was not so clear. The authors suggest that multiple mechanisms may contribute to viral inactivation on surfaces. If viral capsids accumulate at the air-water interface of a solution, structural damage can occur causing viral inactivation. Desiccation (removal of water) may also be important, thus viral inactivation on surfaces may involve both desiccation and interaction at the air-water interface, with the contribution of each depending on both temperature and relative humidity. It is hard to dissect which of the mechanisms is more important in this study.
7.2.2 Aluminium cans
As far as we can ascertain, there have been no other studies on survival of SARS-CoV-2 on coated aluminium cans. There was little difference in virus inactivation in the presence or absence of mucin, and only small differences between different temperatures or relative humidity levels. There have, however, been a few studies investigating the survival of human coronavirus (HCoV) strains on aluminium metal (Kampf et al., 2020; Sizun et al., 2000). Both showed that there was rapid loss of infectivity on aluminium for different HCoV strains and survival was less than 12 hours on aluminium at room temperature. In their review, Kampf found that HCoV-229E and HCoV-OC43 survived for less than 8 hours on aluminium at 21°C; while Sizun showed that very little virus remained after 3 hours on aluminium for HCoV-OC43 and 12 hours for HCoV-229E at 21°C.
However, aluminium drinks cans are complex products; the cans are not pure aluminium. Aluminium cans are made from over 98% aluminium alloys, consisting of 95% aluminium and smaller amounts of manganese, magnesium, chrome, iron, silicon and copper. Aluminium cans are generally then coated with an organic layer to protect the integrity of the cans from effects of the highly acidic foods and drinks and protect against corrosion of the metal leading to leakage of the can and spoilage of the food (Geueke et al., 2016). Since the 1950s, epoxy-based resins are the most used class of aluminium can coatings and in 2013 their market share was estimated to be >95%, including the aluminium cans tested in this study (Anon, 2022a). Epoxy coatings protect the metal from corrosion, can withstand a wide range of food and drinks, and resist heat and acidic conditions. They adhere well to the aluminium surfaces and exhibit sufficient flexibility during most production processes. The most common epoxy coatings are synthesized from bisphenol A (BPA) and epichlorohydrin forming bisphenol A-diglycidyl ether epoxy resins. Most aluminium cans are coated both internally and externally with very thin films, of between 1 and 10 µm thickness. The thin epoxy lacquer coating is then covered with a layer of white base coat paint to provide a stable surface for the various printing inks that are applied, before finally being covered in a varnish lacquer (MPDA 2022). Therefore, the drinks can surface in this study is quite complex and is not pure aluminium. As of yet, there are no other studies to look at the survival of SARS-CoV-2 or any other viruses on epoxy resin varnish.
7.2.3 Composite drinks cartons
As far as we can ascertain, there have been no other studies on survival of SARS-CoV-2 on composite drinks cartons. The virus can persist in an infectious state on composite drinks cartons for several days under certain storage conditions. In some conditions, namely chilled, higher humidity conditions (6°C, 53% and 80% RH) contamination of composite drinks cartons can sustain infectious virus for a significant length of time (up to 4 days). This and other similar findings may warrant decontamination protocols for composite drinks cartons to mitigate further contamination of surfaces and hands.
Composite drinks cartons are complex products. As with PET1 bottles and aluminium cans, the risk of virus transmission comes from drinking straight from the carton as well as touching the carton and then putting their hands to their face. The manufacturer of the fruit juice drinks cartons used in this study produces more than 15 billion composite drinks cartons every year and is the world's third largest supplier of packaging for beverages (Anon, 2022b). A typical composite drinks carton is 75% paperboard, 20% polyethylene and 5% aluminium. The main component, paperboard, provides stability and strength. On the internal surface of the paperboard, a thin barrier layer of aluminium protects against oxygen and light to maintain the nutritional value and flavours of the food in the package. Between the paperboard and aluminium foil is polyethylene enabling the paperboard to stick to the aluminium foil. There are also several layers of polyethylene to prevent moisture getting in or out to keep the products inside fresh, as well polyethylene coated paper for printing on the outer surface. Therefore, the drinks carton surface onto which the SARS-CoV-2 is artificially contaminated, in this study is quite complex.
7.2.4 Effect of mucin
There were variations on virus inactivation in the presence or absence of mucin. It is unclear from the literature, whether SARS-CoV-2 survives for longer on surfaces in the presence of mucin, with only a few studies being performed. Mixing of highly concentrated inocula with respiratory mucus and saliva increased the infectiousness of influenza virus, allowing its transmission for up to 17 days, confirming the protective role of mucus and saliva for the survival of respiratory viruses (Szpiro et al., 2020). An older study, however, showed that human rhinovirus type 14 suspended in tryptose phosphate broth could survive for more than 20 hours incubation, but for less time when suspended in bovine mucin or in nasal secretions (Sattar et al., 1987). In one study, SARS-CoV-2 virus was diluted in a defined organic matrix, consisting of bovine serum albumin (BSA), mucin and tryptone, following the International Standard ASTM E2197 (ASTM 2018), designed to mimic the composition of body secretions (Riddell et al., 2020). However, this defined organic matrix is not a close compositional match to saliva or respiratory secretions. Other studies have also looked at the inoculation of virus in droplets in a clinically relevant matrix, consisting of an artificial saliva/mucus mixture, and have shown that coronavirus stability is consistently reduced when dry surfaces are inoculated with clinically relevant matrices (Bueckert et al., 2020). Saliva or secretions often contain interfering proteins, which may decrease virus stability in a real-world situation. It was beyond the scope of this study to look at the survival of SARS-CoV-2 in mucus and saliva. It will be important in any future studies to investigate more complex matrices, such as properly defined saliva, nasal secretions, as well as respiratory sputum.
The time for inactivation of SARS-CoV-2 on food packaging was variable, depending on the packaging investigated. The literature suggests that survival of SARS-CoV-2 in the environment is dependent on many factors and often dependent on the experimental design (Abraham et al., 2020). Possible variations include: the virus strains used; culture conditions used; inoculum matrix; presence or absence of additional proteins; volume of virus added; titre of virus used; temperature and relative humidity used; length of time for incubation; porosity of the surface being tested; efficiency of recovery methods used; dehydration of the inoculated virus and exposure to sunlight (Baker and Gibson, 2022). These results highlight the complexity and variability within studies across different laboratories and make comparisons with our study’s results difficult.
7.3 General conclusions
In both chilled and ambient conditions at a range of relative humidity levels, some foods and food packaging material can sustain infectious virus for a significant length of time. It should be noted that foods and packaging considered as part of this study were artificially inoculated with SARS-CoV-2 and therefore are not a reflection of contamination levels found on these foods at retail, and lower levels of contamination will require less time to decline to undetectable levels. Several surveillance studies have been performed for the presence or absence of SARS-CoV-2 (Li et al., 2022; Arnaboldi et al., 2022) showing that the proportion of foods or food packaging with surface SARS-CoV-2 contamination is extremely low, but not negligible. Actual virus levels on these foods and food packaging were not measured and virus levels in retail environments have not yet been monitored, as far as we can ascertain.
High saturated fat and high protein foods, such as sliced ham and cheddar cheese, seem to support longer SARS-CoV-2 virus survival, with infectious virus surviving for at least 7 days. By contrast, some foods, such as apples and olives, contain naturally occurring bioactive chemicals which may exhibit potential antiviral properties and therefore contribute to rapid SARS-CoV-2 inactivation. This effect was seen within a few minutes. Some baked products, such as croissants and pain au chocolat, have an egg wash coating, which may have an intermediate antiviral effect. In tests on these pastries, virus survived for a few hours. The results described in this report, on SARS-CoV-2 survival on different food types for short or longer periods of time, reinforce the need to rigorously follow the guidance on maintaining appropriate hygienic handling measures and display of unpackaged foods.
When considering packaged foods, this study and other similar findings have shown that SARS-CoV-2 may be able to survive, for a prolonged period of time on food packaging. Future studies should recognise that incubating infectious agents on bare aluminium is not the same as on a coated aluminium can, nor on plain cardboard when considering coated drinks cartons.
The public may be interested in the finding that virus may persist in an infectious state, on foods and food packaging surfaces, for several days under certain common conditions. There is the possibility of transmission through contaminated food if the food is in direct contact with the mouth and mucus membranes. The potential implications for public health are unclear since inhalation of respiratory aerosols and droplets is considered to be the main route of SARS-CoV-2 transmission.
Aboubakr H.A., Sharafeldin T.A. and Goyal S.M., 2020
Stability of SARS-CoV-2 and other coronaviruses in the environment and on common touch surfaces and the influence of climatic conditions: A review. Trans bound. Emerg. Dis. 68(2):296-312.
https://doi.org/10.1111/tbed.13707
Abraham J.P., Plourde B.D. and Cheng L., 2020
Using heat to kill SARS-CoV-2. Reviews in Medical Virology: p. e2115,
https://doi.org/10.1002/rmv.2115
Alberto M.R., Canavosio M.A.R. and Manca de Nadra M.R., 2006
Antimicrobial effect of polyphenols from apple skins on human bacterial pathogens. Electronic Journal of Biotechnology 9 (3), Issue 3.
https://doi.org/10.2225/vol9-issue3-fulltext-1
Alhadrami H.A., Sayed A.M., Sharif A.M., Azhar E.I. and Rateb M.E., 2021
Olive-Derived Triterpenes Suppress SARS COV-2 Main Protease: A Promising Scaffold for Future Therapeutics. Molecules, 26, 2654. https://doi.org/10.3390/molecules26092654
Anelich L.E.C.M., Lues R., Farber, J.M. and Parreira V.R., 2020
SARS-CoV-2 and Risk to Food Safety. Frontiers in Nutrition.
https://doi.org/10.3389/fnut.2020.580551
Anon, 2022a
Do Coca Cola cans and bottles contains BPAs.
Do Coca-Cola cans and bottles contain BPA? | FAQ | Coca-Cola Canada
Anon, 2022b
Pure PakTM cartons.
Pure-Pak® cartons - Elopak
Arnaboldi S., Mangeri L., Galuppini E., Righi F., Tilola M., Scarazzato A., Bertasi B., Finazzi G., Varisco G., Filipello V. and Losio M-N., 2022
Is SARS-CoV-2 a Concern for Food Safety? A Very Low Prevalence from a Food Survey during the COVID-19 Pandemic in Northern Italy. Foods. 2022; 11(14):2096.
https://doi.org/10.3390/foods11142096
ASTM E2197, 2018
Standard Quantitative Disk Carrier Test Method for Determining Bactericidal, Virucidal, Fungicidal, Mycobactericidal, and Sporicidal Activities of Chemicals.
Standard Quantitative Disk Carrier Test Method for Determining Bactericidal, Virucidal, Fungicidal, Mycobactericidal, and Sporicidal Activities of Chemicals (astm.org)
Baker C.A. and Gibson K.E., 2022
Persistence of SARS-CoV-2 on Surfaces and Relevance to the Food Industry, Current Opinion in Food Science 100875
https://doi.org/10.1016/j.cofs.2022.100875
Barr I.G., Rynehart C., Whitney P. and Druce J., 2020
SARS-CoV-2 does not replicate in embryonated hen’s eggs or in MDCK cell lines. Eurosurveillance 25, 2001122.
https://doi.org/10.2807/1560-7917.ES.2020.25.25.2001122
Bedoya L.M., Beltrán M., Obregón-Calderón P., García-Pérez J., De La Torre H.E., González N., et al., 2016
Hydroxytyrosol: A new class of microbicide displaying broad anti-HIV-1 activity. AIDS 30, 2767–2776.
https://doi.org/10.1097/qad.0000000000001283
Biryukov J., Boydston J.A., Dunning R.A. et al., 2020
Increasing Temperature and Relative Humidity Accelerates Inactivation of SARS-CoV-2 on Surfaces. mSphere 5(4): e00441-20.
https://doi.org/10.1128/mSphere.00441-20
Blondin-Brosseau M., Harlow J., Doctor T. and Nasheri N., 2021
Examining the persistence of human Coronavirus 229E on fresh produce. Food Microbiology 98:e103780
https://doi.org/10.1016/j.fm.2021.103780
Bonvino N.P., Liang J., McCord E.D, Zafiris E., Benetti N., Ray N.B. et al., 2018
OliveNetTM: a comprehensive library of compounds from Olea europaea. Database, 1 – 0.
https://doi.org/10.1093/database/bay016
Brown J.D, Swayne D.E, Cooper R.J., Burns R.E. and Stallknecht D.E., 2007
Persistence of H5 and H7 avian influenza viruses in water. Avian Dis., 51 (1 Suppl.), 285-289.
https://doi.org/10.1637/7636-042806R.1
Bueckert M., Gupta R., Gupta A., Garg M. and Mazumder A., 2020
Infectivity of SARS-CoV-2 and Other Coronaviruses on Dry Surfaces: Potential for Indirect Transmission. Materials (Basel, Switzerland), 13 (22), 5211-5217. https://doi.org/10.3390/ma13225211
Casanova L. M., Jeon S., Rutala W. A., Weber D. J. and Sobsey M. D., 2010
Effects of air temperature and relative humidity on coronavirus survival on surfaces. Applied and Environmental Microbiology, 76(9), 2712–2717. https://doi.org/10.1128/AEM.02291-09
Çelebioğlu H.Y., Lee S. and Chronakis I.S., 2020
Interactions of salivary mucins and saliva with food proteins: a review, Critical Reviews in Food Science and Nutrition, 60:1, 64 – 83.
https://doi.org/10.1080/10408398.2018.1512950
Chin A., Chu J., Perera M., Hui K., Yen H. L., Chan, M. et al., 2020
Stability of SARS-CoV-2 in different environmental conditions. The Lancet. Microbe, 1(1), e10.
https://doi.org/10.1016/S2666-5247(20)30003-3
Colunga Biancatelli R.M.L., Berrill M., Catravas J.D. and Marik P.E., 2020
Quercetin and Vitamin C: An Experimental, Synergistic Therapy for the Prevention and Treatment of SARS-CoV-2 Related Disease (COVID-19). Front. Immunol. 11:1451.
https://doi.org/10.3389/fimmu.2020.01451
Das U.N., 2020
Can Bioactive Lipids Inactivate Coronavirus (COVID-19)? Arch Med Res. 51,282-286.
https://doi.org/10.1016/j.arcmed.2020.03.004
de Goffau M. C., Yang X., van Dijl J. M. and Harmsen H. J., 2009
Bacterial pleomorphism and competition in a relative humidity gradient. Environmental Microbiology, 11(4), 809–822.
https://doi.org/10.1111/j.1462-2920.2008.01802.x
Dhakal J., Jia M., Joyce J.D., Moore G.A., Ovissipour R. and Bertke A.S., 2021 Survival of Severe Acute Respiratory Syndrome Coronavirus 2 (SARS-CoV-2) and Herpes Simplex Virus 1 (HSV-1) on foods stored at refrigerated temperature. Foods,10(5):1005.
https://doi.org/10.3390/foods10051005
DMNA Division of Military and Naval Affairs, 2006
Storing food at the proper temperature.
NFSEM_A_proper_temps_F (ny.gov)
Dulbecco R. and Vogt M.,1953
Some problems of animal virology as studied by the plaque technique.
Cold Spring Harbor Symp. Quant. Biol., 18, 273-279.
https://doi.org/10.1101/sqb.1953.018.01.039
Food Standards Agency, 2020
What is the risk of food or food contact materials and surfaces being a source or transmission route of SARS-CoV-2 for UK consumers?
Qualitative risk assessment on the risk of food or food contact materials as a transmission route for SARS-CoV-2 | Food Standards Agency
Food Standards Agency, 2021
Safer food, better business for retailers: chilled storage and display.
Safer food, better business for retailers | Food Standards Agency
Food Standards Scotland, 2016
Scotland - Chill holding requirements.
Guidance on Temperature Control (foodstandards.gov.scot)
Geueke B., 2016
Dossier – Can coatings. Food Packaging Forum.
https://doi.org/10.5281/zenodo.200633
Gidari A., Sabbatini S., Bastianelli S., Pierucci S., Busti C., Bartolini D. et al., 2021
SARS-CoV-2 Survival on Surfaces and the Effect of UV-C Light. Viruses, 13(3), 408.
https://doi.org/10.3390/v13030408
Glenister D.A., Salamon K.E., Smith K., Beighton D. and Keevil C.W., 1988
Enhanced Growth of Complex Communities of Dental Plaque Bacteria in Mucin-Limited Continuous Culture.
Microbial Ecology in Health and Disease, 1:1, 31-38.
https://doi.org/10.3109/08910608809140176
GMP Compliance, 2017
What are the regulatory Definitions for "Ambient", "Room Temperature" and "Cold Chain"?.
What are the regulatory Definitions for "Ambient", "Room Temperature" and "Cold Chain"? - ECA Academy (gmp-compliance.org)
Goyal S.M. and Aboubakr H.A., 2016
Methods for Virus Recovery from Foods.
In: Goyal S., Cannon J. (eds) Viruses in Foods. Food Microbiology and Food Safety. Springer, Cham.
Methods for Virus Recovery from Foods | SpringerLink
Hashmi M. A., Khan A., Hanif M., Farooq U. and Perveen S., 2015
Traditional uses, phytochemistry, and pharmacology of Olea europaea (olive). Evid. Based Complement. Altern. Med. 2015:541591.
https://doi.org/10.1155/2015/541591
Highmore C. J., Warner, J. C., Rothwell S. D., Wilks S. A. and Keevil C. W., 2018
Viable-but-Nonculturable Listeria monocytogenes and Salmonella enterica Serovar Thompson Induced by Chlorine Stress Remain Infectious.
mBio, 9 (2), e00540-18.
https://doi.org/10.1128/MBIO.00540-18
International Society for Infectious Diseases, 2019
Undiagnosed Pneumonia - China (Hubei): Request For Information.
ProMED 20191230.6864153
Promed Post - ProMED-mail (promedmail.org)
ISO 7218:2007. Microbiology of food and animal feeding stuffs, 2007
General requirements and guidance for microbiological examinations.
ISO - ISO 7218:2007 - Microbiology of food and animal feeding stuffs — General requirements and guidance for microbiological examinations
Jia M., Taylor T.M., Senger S.M., Ovissipour R. and Bertke A.S., 2022
SARS-CoV-2 remains infectious on refrigerated Deli food, meats, and fresh produce for up to 21 days. Foods, 11, 286.
https://doi.org/10.3390/foods11030286
Kampf G., Todt D., Pfaender S. and Steinmann E., 2020
Persistence of coronaviruses on inanimate surfaces and their inactivation with biocidal agents. Journal of Hospital Infection, 104, 246-251.
https://doi.org/10.1016/j.jhin.2020.01.022
Kang D-H., Dougherty R.H. and Fung D.Y.C., 2007
Comparison of Pulsifier and Stomacher to detach microorganisms from lean meat tissues. Journal of Rapid Methods & Automation in Microbiology 9, 27-32.
https://doi.org/10.1111/j.1745-4581.2001.tb00225.x
Kingsbury J.M., 2022
Potential for food borne transmission of COVID-19: Literature review update version 7. New Zealand Food Safety Science and Research Centre.
Cawthron Short Report Template 15 page or less (nzfssrc.org.nz)
Li F., Wang J., Liu Z. and Li N., 2020
Surveillance of SARS-CoV-2 Contamination in Frozen Food-Related Samples — China, July 2020 – July 2021[J]. China CDC Weekly, 2022, 4(22): 465-470.
https://doi.org/10.46234/ccdcw2022.105
Liu, Y., Li T., Deng Y., Liu S., Zhang D., Li H. et al., 2021
Stability of SARS-CoV-2 on environmental surfaces and in human excreta. The Journal of Hospital Infection, 107, 105–107. https://doi.org/10.1016/j.jhin.2020.10.021
Määttä-Riihinen, K. R., Kamal-Eldin, A., Mattila, P. H., González-Paramás, A. M., & Törrönen, A. R. 2004
Distribution and contents of phenolic compounds in eighteen Scandinavian berry species. Journal of Agricultural and Food Chemistry, 52(14), 4477–4486.
https://doi.org/10.1021/jf049595y
MFMER - Mayo Foundation for Medical Education and Research, 2021
Humidifiers: Ease Skin breathing symptoms.
Humidifiers: Ease skin, breathing symptoms - Mayo Clinic
Moore G. and Griffith C., 2007
Problems associated with traditional hygiene swabbing: the need for in‐house standardization. Journal of Applied Microbiology, 103, 1090-1103.
https://doi.org/10.1111/j.1365-2672.2007.03330.x
Morawska L., and Milton D. K., 2020
It Is Time to Address Airborne Transmission of Coronavirus Disease 2019 (COVID-19). Clinical Infectious Diseases: an official publication of the Infectious Diseases Society of America, 71(9), 2311–2313.
https://doi.org/10.1093/cid/ciaa939
MPDA Metal Packaging Manufacturers Association, 2022
2 -piece drinks cans.
HOW 2piecedrinks low res (mpma.org.uk)
Ogando N. S., Dalebout T. J., Zevenhoven-Dobbe J. C., Limpens R., van der Meer Y., Caly L., Druce J., de Vries J., Kikkert M., Bárcena M., Sidorov I., and Snijder E. J., 2020
SARS-coronavirus-2 replication in Vero E6 cells: replication kinetics, rapid adaptation and cytopathology. The Journal of General Virology, 101(9), 925–940.
https://doi.org/10.1099/jgv.0.001453
Onal H., 2020
Effect of Quercetin on Prophylaxis and Treatment of COVID-19
Effect of Quercetin on Prophylaxis and Treatment of COVID-19 - Tabular View - ClinicalTrials.gov
Poulson R.L., Tompkins S.M., Berghaus R.D., Brown J.D. and Stallknecht D.E., 2016
Environmental stability of swine and human pandemic influenza viruses in water under variable conditions of temperature, salinity, and pH. Appl. Environ. Microbiol. 82:3721–3726.
https://doi.org/10.1128/AEM.00133-16
Pursglove A., 2021
Why your supermarket is chillier than the Artic. Mail Online
Brrr! Why your supermarket is CHILLIER than the Arctic | Daily Mail Online
Riddell S., Goldie S., Hill A., Eagles D. & Drew T. W., 2020
The effect of temperature on persistence of SARS-CoV-2 on common surfaces.
Virology Journal, 17(1), 145.
https://doi.org/10.1186/s12985-020-01418-7
Scientific Advisory Group for Emergencies (SAGE), 2020
Role of Ventilation in Controlling SARS-CoV-2 Transmission
S0789_EMG_Role_of_Ventilation_in_Controlling_SARS-CoV-2_Transmission.pdf (publishing.service.gov.uk)
Sanchez G., Elizaquivel P. and Aznar R., 2012
A single method for recovery and concentration of enteric viruses and bacteria from fresh-cut vegetables. International Journal of Food Microbiology 152, 9-13.
https://doi.org/10.1016/j.ijfoodmicro.2011.10.002
Sattar S. A., Karim Y. G., Springthorpe V. S. and Johnson-Lussenburg C. M., 1987
Survival of human rhinovirus type 14 dried onto nonporous inanimate surfaces: effect of relative humidity and suspending medium. Canadian Journal of Microbiology, 33(9), 802–806.
https://doi.org/10.1139/m87-136
Schwarcz J. 2017
Why do they spray wax on apples?
Why do they spray wax on apples? | Office for Science and Society - McGill University
Sizun J., Yu M.W.N. and Talbot P.J., 2000
Survival of human coronaviruses 229E and OC43 in suspension and after drying on surfaces: a possible source of hospital-acquired infections. Journal of Hospital Infection, 46, 55-60.
https://doi.org/10.1053/jhin.2000.0795
Szpiro L., Pizzorno A., Durimel L., Julien T., Bouchami D., Marie Y. et al., 2020
Role of interfering substances in the survival of coronaviruses on surfaces and their impact on the efficiency of hand and surface disinfection. medRxiv 2020.08.22.20180042.
https://doi.org/10.1101/2020.08.22.20180042
Takeda Y., Jamsransuren Y., Matsuda S., Crea R. and Ogawa H., 2021
The SARS-CoV-2-inactivating activity of hydroxytyrosol-rich aqueous olive pulp extract (HIDROX®) and its use as a virucidal cream for topical application. Viruses, 13, 232.
https://doi.org/10.3390/v13020232
UKHSA, 2022
Coronavirus (COVID-19 ) in the UK: England Summary
England Summary | Coronavirus (COVID-19) in the UK (data.gov.uk)
van Doremalen N., Bushmaker T., Morris D. H., Holbrook M. G., Gamble A., Williamson B. N. et al., 2020
Aerosol and Surface Stability of SARS-CoV-2 as Compared with SARS-CoV-1. The New England Journal of Medicine, 382(16), 1564–1567. https://doi.org/10.1056/NEJMc2004973
Viral Titering-Plaque Assay Protocol, 2020
Creative Biogene Technology.
Viral Titering-Plaque Assay Protocol - Creative Biogene (creative-biogene.com)
Warnes S. L., Little Z. R. and Keevil C. W., 2015
Human coronavirus 229E remains infectious on common touch surface materials.
mBio, 6(6), e01697-15.
https://doi.org/10.1128/mBio.01697-15
Woradechjumroen D., Li H. and Yu Y., 2014
Energy Interaction among HVAC and Supermarket Environment. International Journal of Architectural, Civil and Construction Sciences 8,(12) 1236 – 1243.
Energy Interaction among HVAC and Supermarket Environment (researchgate.net)
World Health Organization, 2020a
Origins of SARS-CoV-2 virus.
Virus origin / Origins of the SARS-CoV-2 virus (who.int)
World Health Organization, 2020b
Transmission of SARS-CoV-2: implications for infection prevention precautions: scientific brief.
Transmission of SARS-CoV-2: implications for infection prevention precautions: scientific brief, 09 July 2020 (who.int)
World Health Organization, 2020c
Guidelines for the storage of Essential Medicines and other Health Commodities.
Essential Medicines and Health Products Information Portal (digicollections.net)
Worldometer, 2020.
COVID-19 CORONAVIRUS PANDEMIC
COVID Live - Coronavirus Statistics - Worldometer (worldometers.info)
Yamada K., Ogawa H., Hara A., Yoshida Y., Yonezawa Y., Karibe, K. et al., 2009
Mechanism of the antiviral effect of hydroxytyrosol on influenza virus appears to involve morphological change of the virus. Antiviral Research 83, 35–44.
https://doi.org/10.1016/j.antiviral.2009.03.002
Yépiz-Gómez M.S., Gerba C.P. and Bright K.R., 2013
Survival of Respiratory Viruses on Fresh Produce. Food Environmental Virology 5, 150–156.
https://doi.org/10.1007/s12560-013-9114-4
Yu F., Yan L., Wang N., Yang S., Wang L., Tang Y. et al., 2020
Quantitative Detection and Viral Load Analysis of SARS-CoV-2 in Infected Patients. Clinical Infectious Diseases : an official publication of the Infectious Diseases Society of America, 71(15), 793–798.
https://doi.org/10.1093/cid/ciaa345
Download a PDF version of the Appendices report:
9.1 SARS-CoV-2 survival on food surfaces
9.1.1 Baseline parameters all foods
Baseline parameters for all food tests were determined and are shown in Table 4, Table 5, Table 6 and Table 7.
Table 4 Effect of food sample extracts (without SARS-CoV-2 virus) made by beads/vortexing on Vero E6
| Food sample | Observable CPE % |
|---|---|
| Broccoli | 0 |
| Pepper | 0 |
| Apple | 0 |
| Raspberry | 0 |
| White bread crust | 0 |
|
Brown bread crust |
0 |
| Pain au chocolat | 0 |
| Croissant | 0 |
| Sliced ham | 0 |
| Cheddar Cheese | 0 |
| Olive | 0 |
| Brine | 0 |
All tests were performed in triplicate. CPE – cytopathic effect
Table 5 Effect of food sample extracts (without SARS-CoV-2 virus) made by pulsification on Vero E6
| Food sample | Any observable CPE % |
|---|---|
| Broccoli | 0 |
| Pepper | 0 |
| Apple | 0 |
| Raspberry | 0 |
| White bread crust | 0 |
|
Brown bread crust |
0 |
| Pain au chocolat | 0 |
| Croissant | 0 |
| Sliced ham | 0 |
| Cheddar Cheese | 0 |
| Olive | 0 |
| Brine | 0 |
All tests were performed in triplicate CPE - cytopathic effect.
* Brine - there was no direct effect on the viability of the Vero E6 cells, with no cell death nor plaques being observed. However, the observed monolayer was thinner and less confluent than that observed with Infection Medium alone.
Table 6 Effect of food sample extracts after beads/vortexing on SARS-CoV-2.
| Food sample | Mean titre recovered (PFU/sample) | Mean % recovery |
|---|---|---|
| Infection Medium + SARS CoV-2 | 4750 | 95 |
| Broccoli + SARS CoV-2 | 4750 | 95 |
| Pepper + SARS CoV-2 | 4250 | 85 |
| Apple + SARS CoV-2 | 69 | 1.4 |
| Raspberry + SARS CoV-2 | 4500 | 90 |
| White bread crust + SARS CoV-2 | 4500 | 90 |
| Brown bread crust + SARS CoV-2 | 4750 | 95 |
| Croissant + SARS CoV-2 | 4750 | 95 |
| Pain au Chocolat + SARS CoV-2 | 4125 | 83.5 |
| Ham + SARS CoV-2 | 4750 | 95 |
| Cheddar Cheese + SARS CoV-2 | 4607 | 92 |
| Olive + SARS CoV-2 | 225 | 4.5 |
All tests were performed in triplicate, with 5000 PFU added to each sample.
Table 7 Effect of food sample extracts after pulsification on SARS-CoV-2.
| Food sample | Mean titre recovered (PFU/sample) | Mean % recovery |
|---|---|---|
| Infection Medium + SARS CoV-2 | 900 | 90 |
| Broccoli + SARS CoV-2 | 860 | 86 |
| Pepper + SARS CoV-2 | 875 | 87.5 |
| Apple + SARS CoV-2 | 500 | 50 |
| Raspberry + SARS CoV-2 | 845 | 84.5 |
| White bread crust + SARS CoV-2 | 850 | 85 |
| Brown bread crust + SARS CoV-2 | 870 | 87 |
| Croissant + SARS CoV-2 | 860 | 86 |
| Pain au Chocolat + SARS CoV-2 | 890 | 89 |
| Ham + SARS CoV-2 | 880 | 88 |
| Cheddar Cheese + SARS CoV-2 | 880 | 88 |
| Olive + SARS CoV-2 | 37.5 | 3.75 |
All tests performed in triplicate with 1000 PFU added to each sample.
9.1.2 Fresh vegetables
9.1.2.1 Broccoli
The results for broccoli incubated for up to 7 days with SARS-CoV-2 can be seen in Table 8, Table 9, Table 10, Table 11, Table 12 and Table 13. For all tests, the means; SEM of the mean and log10 reduction of PFU over time are shown. The mean log10 decrease (shown to 2 significant figures (s.f.)) compares the PFU recovered at each time point to the PFU recovered at day 0, not to the initial inoculum. All tests were performed in triplicate. The limit of detection for this assay is 25 PFU/sample. Therefore, 2.3 is the maximum log10-reduction detectable with this assay design, equivalent to 25 PFU or fewer infectious virus remaining. Log10 decrease was calculated to 2 s.f.
Table 8 Test B1: Broccoli, 23˚C, 53% RH
| Time | Mean number of plaques (PFU/sample) +/-SEM | Mean log10 decrease from day 0 |
|---|---|---|
| Day 0 | 7167 +/- 1155 | n/a |
| Day 1 | 67+/-64 | 2.0 |
| Day 2 | <25 | >2.5 |
| Day 3 | <25 | >2.5 |
| Day 4 | 104 +/- 79 | 1.85 |
| Day 5 | <25 | >2.5 |
| Day 6 | <25 | >2.5 |
| Day 7 | <25 | >2.5 |
Table 9 Test B2 Brocooli, 23c 31% RH
| Time | Mean number of plaques (PFU/sample) +/-SEM | Mean log10 decrease from day 0 |
|---|---|---|
| Day 0 | 7167 +/- 1155 | n/a |
| Day 1 | 125 +/- 115 | 1.8 |
| Day 2 | 50 +/- 50 | 2.2 |
| Day 3 | 117 +/- 141 | 1.8 |
| Day 4 | 53+/- 80 | 2.1 |
| Day 5 | 83 +/- 101 | 1.9 |
| Day 6 | <25 | >2.5 |
| Day 7 | <25 | >2.5 |
Table 10 Test B3 Broccoli, 6c, 75% RH
| Time | Mean number of plaques (PFU/sample) +/-SEM | Mean log10 decrease from day 0 |
|---|---|---|
| Day 0 | 7167 +/- 1155 | n/a |
| Day 1 | <25 | >2.5 |
| Day 2 | <25 | >2.5 |
| Day 3 | <25 | >2.5 |
| Day 4 | <25 | >2.5 |
| Day 5 | <25 | >2.5 |
| Day 6 | 50 +/- 25 | 2.2 |
| Day 7 | <25 | >2.5 |
Table 11 Test B4 Broccoli, 6 degrees 50% RH
| Time | Mean number of plaques (PFU/sample) +/-SEM | Mean log10 decrease from day 0 |
|---|---|---|
| Day 0 | 7167 +/- 1155 | n/a |
| Day 1 | 142 +/- 123 | 1.7 |
| Day 2 | <25 | >2.5 |
| Day 3 | <25 | >2.5 |
| Day 4 | <25 | >2.5 |
| Day 5 | <25 | >2.5 |
| Day 6 | <25 | >2.3 |
| Day 7 | <25 | >2.3 |
Table 12 Test B5 Broccoli, 6 degrees 40% RH
| Time | Mean number of plaques (PFU/sample) +/-SEM | Mean log10 decrease from day 0 |
|---|---|---|
| Day 0 | 7167 +/- 1155 | n/a |
| Day 1 | 358 +/- 52 | 1.3 |
| Day 2 | 133 +/- 80 | 1.7 |
| Day 3 | <25 | >2.5 |
| Day 4 | <25 | >2.5 |
| Day 5 | <25 | >2.5 |
| Day 6 | <25 | >2.5 |
| Day 7 | 42 +/- 17 | >2.5 |
Table 13 Test B6 Broccoli 6 degrees 20% RH
| Time | Mean number of plaques (PFU/sample) +/-SEM | Mean log10 decrease from day 0 |
|---|---|---|
| Day 0 | 7167 +/- 1155 | n/a |
| Day 1 | 125 +/- 87 | 1.8 |
| Day 2 | 33 +/- 8 | 2.3 |
| Day 3 | <25 | >2.5 |
| Day 4 | <25 | >2.5 |
| Day 5 | <25 | >2.5 |
| Day 6 | <25 | >2.5 |
| Day 7 | <25 | >2.5 |
9.1.2.2 Pepper
The results for pepper incubated for up to 7 days with SARS-CoV-2 can be seen in Table 14, Table 15, Table 16, Table 17, Table 18 and Table 19. For all tests, the means; SEM of the mean and log10 reduction of PFU over time are shown. The mean log10 decrease (shown to 2 significant figures) compares the PFU recovered at each time point to the PFU recovered at day 0, not to the initial inoculum. All tests were performed in triplicate. The limit of detection for this assay is 25 PFU/sample. Therefore, 2.6 is the maximum log10-reduction detectable with this assay design, equivalent to 25 PFU or fewer infectious virus remaining. Log10 decrease was calculated to 2 s.f.
Table 14 Test P1: Pepper, 23˚C, 53% RH
| Time | Mean number of plaques (PFU/sample) +/-SEM | Mean log10 decrease from day 0 |
|---|---|---|
| Day 0 | 10167 +/- 2255 | n/a |
| Day 1 | <25 | >2.6 |
| Day 2 | <25 | >2.6 |
| Day 3 | <25 | >2.6 |
| Day 4 | <25 | >2.6 |
| Day 5 | <25 | >2.6 |
| Day 6 | <25 | >2.6 |
| Day 7 | <25 | >2.6 |
Table 15 Test P2 Pepper 23c 31% RH
| Time | Mean number of plaques (PFU/sample) +/-SEM | Mean log10 decrease from day 0 |
|---|---|---|
| Day 0 | 10167 +/- 2255 | n/a |
| Day 1 | <25 | >2.6 |
| Day 2 | 42 +/- 38 | >2.6 |
| Day 3 | <25 | >2.6 |
| Day 4 | 108 +/- 123 | 1.9 |
| Day 5 | <25 | >2.6 |
| Day 6 | <25 | >2.6 |
| Day 7 | <25 | >2.6 |
Table 16 Test P3 Pepper 6c 75% RH
| Time | Mean number of plaques (PFU/sample) +/-SEM | Mean log10 decrease from day 0 |
|---|---|---|
| Day 0 | 10167 +/- 2255 | n/a |
| Day 1 | 3582 +/- 2036 | 0.45 |
| Day 2 | 1417 +/- 381 | 0.85 |
| Day 3 | 133 +/- 133 | 1.9 |
| Day 4 | <25 | >2.6 |
| Day 5 | <25 | >2.6 |
| Day 6 | 50 +/- 25 | 2.2 |
| Day 7 | <25 | >2.6 |
Table 17 Test P4 Pepper 6c 50% RH
| Time | Mean number of plaques (PFU/sample) +/-SEM | Mean log10 decrease from day 0 |
|---|---|---|
| Day 0 | 10167 +/- 2255 | n/a |
| Day 1 | 667 +/- 289 | 1.2 |
| Day 2 | 83 +/- 144 | 2.1 |
| Day 3 | 67 +/- 57 | 2.2 |
| Day 4 | 58 +/- 33 | 2.2 |
| Day 5 | <25 | >2.6 |
| Day 6 | <25 | >2.6 |
| Day 7 | <25 | >2.6 |
Table 18 Test P5 Pepper 6c 40% RH
| Time | Mean number of plaques (PFU/sample) +/-SEM | Mean log10 decrease from day 0 |
|---|---|---|
| Day 0 | 10167 +/- 2255 | n/a |
| Day 1 | 342 +/- 302 | 1.5 |
| Day 2 | 833 +/- 1443 | 1.1 |
| Day 3 | 341 +/- 224 | 1.5 |
| Day 4 | 250 +/- 433 | 1.6 |
| Day 5 | 192 +/- 128 | 1.7 |
| Day 6 | <25 | >2.6 |
| Day 7 | 58 +/- 14 | 2.2 |
Table 19 Test P6 Pepper 6c 20% RH
| Time | Mean number of plaques (PFU/sample) +/-SEM | Mean log10 decrease from day 0 |
|---|---|---|
| Day 0 | 10167 +/- 2255 | n/a |
| Day 1 | <25 | >2.6 |
| Day 2 | <25 | >2.6 |
| Day 3 | <25 | >2.6 |
| Day 4 | <25 | >2.6 |
| Day 5 | <25 | >2.6 |
| Day 6 | <25 | >2.6 |
| Day 7 | <25 | >2.6 |
9.1.3 Fresh Fruit
9.1.3.1 Apple
The results for apple incubated for up to 7 days with SARS-CoV-2 can be seen in Table 20, Table 21, Table 22, Table 23, Table 24 and Table 25. For all tests, the means; SEM of the mean and log10 reduction of PFU over time are shown. The mean log10 decrease (shown to 2 significant figures) compares the PFU recovered at each time point to the PFU recovered at day 0, not to the initial inoculum. All tests were performed in triplicate. The limit of detection for this assay is 25 PFU/sample. Therefore, 1.6 is the maximum log10-reduction detectable with this assay design, equivalent to 25 PFU or fewer infectious virus remaining. Log10 decrease was calculated to 2 s.f.
Table 20 Test A1: Apple, 23˚C, 80% RH
| Time | Mean number of plaques (PFU/sample) +/-SEM | Mean log10 decrease from day 0 |
|---|---|---|
| Day 0 | 917 +/- 314 | n/a |
| Day 1 | <25 | >1.6 |
| Day 2 | <25 | >1.6 |
| Day 3 | <25 | >1.6 |
| Day 4 | <25 | >1.6 |
| Day 5 | <25 | >1.6 |
| Day 6 | <25 | >1.6 |
| Day 7 | <25 | >1.6 |
Table 21 Test A2 Apple 23c 53% RH
| Time | Mean number of plaques (PFU/sample) +/-SEM | Mean log10 decrease from day 0 |
|---|---|---|
| Day 0 | 917 +/- 314 | n/a |
| Day 1 | 138 +/- 68 | 0.82 |
| Day 2 | <25 | >1.6 |
| Day 3 | <25 | >1.6 |
| Day 4 | <25 | >1.6 |
| Day 5 | <25 | >1.6 |
| Day 6 | <25 | >1.6 |
| Day 7 | <25 | >1.6 |
Table 22 A3 Broccoli 23c 20% RH
| Time | Mean number of plaques (PFU/sample) +/-SEM | Mean log10 decrease from day 0 |
|---|---|---|
| Day 0 | 917 +/- 314 | n/a |
| Day 1 | <25 | >1.6 |
| Day 2 | <25 | >1.6 |
| Day 3 | <25 | >1.6 |
| Day 4 | <25 | >1.6 |
| Day 5 | <25 | >1.6 |
| Day 6 | <25 | >1.6 |
| Day 7 | <25 | >1.6 |
Table 23 Test A4 Apple 6c 75% RH
| Time | Mean number of plaques (PFU/sample) +/-SEM | Mean log10 decrease from day 0 |
|---|---|---|
| Day 0 | 917 +/- 314 | n/a |
| Day 1 | 221 +/- 105 | 0.62 |
| Day 2 | 83 +/- 49 | 1.04 |
| Day 3 | <25 | >1.6 |
| Day 4 | <25 | >1.6 |
| Day 5 | <25 | >1.6 |
| Day 6 | <25 | >1.6 |
| Day 7 | <25 | >1.6 |
Table 24 Test A5 Apple 6c 50% RH
| Time | Mean number of plaques (PFU/sample) +/-SEM | Mean log10 decrease from day 0 |
|---|---|---|
| Day 0 | 917 +/- 314 | n/a |
| Day 1 | 58 +/- 21 | 1.2 |
| Day 2 | 79 +/- 37 | 1.1 |
| Day 3 | 54 +/- 29 | 1.3 |
| Day 4 | <25 | >1.6 |
| Day 5 | <25 | >1.6 |
| Day 6 | <25 | >1.6 |
| Day 7 | <25 | >1.6 |
Table 25 Test A6 Apple 6c 40% RH
| Time | Mean number of plaques (PFU/sample) +/-SEM | Mean log10 decrease from day 0 |
|---|---|---|
| Day 0 | 917 +/- 314 | n/a |
| Day 1 | 92 +/- 44 | 0.99 |
| Day 2 | 408 +/- 175 | 0.35 |
| Day 3 | <25 | >1.6 |
| Day 4 | <25 | >1.6 |
| Day 5 | <25 | >1.6 |
| Day 6 | <25 | >1.6 |
| Day 7 | <25 | >1.6 |
9.1.3.2 Raspberry
The results for raspberry incubated for up to 7 days with SARS-CoV-2 can be seen in Table 26, Table 27, Table 28, Table 29, Table 30 and Table 31. For all tests, the means; SEM of the mean and log10 reduction of PFU over time are shown. The mean log10 decrease (shown to 2 significant figures) compares the PFU recovered at each time point to the PFU recovered at day 0, not to the initial inoculum. All tests were performed in triplicate. The limit of detection for this assay is 25 PFU/sample. Therefore, 2.5 is the maximum log10-reduction detectable with this assay design, equivalent to 25 PFU or fewer infectious virus remaining. Log10 decrease was calculated to 2 s.f.
Table 26 Test R1 Raspberry 23c 50% RH
| Time | Mean number of plaques (PFU/sample) +/-SEM | Mean log10 decrease from day 0 |
|---|---|---|
| Day 0 | 7833 +/- 1527 | n/a |
| Day 1 | <25 | >2.5 |
| Day 2 | <25 | >2.5 |
| Day 3 | <25 | >2.5 |
| Day 4 | <25 | >2.5 |
| Day 5 | <25 | >2.5 |
| Day 6 | <25 | >2.5 |
| Day 7 | <25 | >2.5 |
Table 27 Test R2 Raspberry 6c 80% RH
| Time | Mean number of plaques (PFU/sample) +/-SEM | Mean log10 decrease from day 0 |
|---|---|---|
| Day 0 | 7833 +/- 1527 | n/a |
| Day 1 | <25 | >2.5 |
| Day 2 | 121 +/- 96 | 1.8 |
| Day 3 | 33 +/- 8 | >2.5 |
| Day 4 | <25 | >2.5 |
| Day 5 | <25 | >2.5 |
| Day 6 | <25 | >2.5 |
| Day 7 | <25 | >2.5 |
Table 28 Test R3 Raspberry 6c 75% RH
| Time | Mean number of plaques (PFU/sample) +/-SEM | Mean log10 decrease from day 0 |
|---|---|---|
| Day 0 | 7833 +/- 1527 | n/a |
| Day 1 | <25 | >2.5 |
| Day 2 | <25 | >2.5 |
| Day 3 | 79 +/- 43 | 2.1 |
| Day 4 | <25 | >2.5 |
| Day 5 | <25 | >2.5 |
| Day 6 | <25 | >2.5 |
| Day 7 | <25 | >2.5 |
Table 29 Test R4 Raspberry 6c 50% RH
| Time | Mean number of plaques (PFU/sample) +/-SEM | Mean log10 decrease from day 0 |
|---|---|---|
| Day 0 | 7833 +/- 1527 | n/a |
| Day 1 | <267 +/- 242 | 1.5 |
| Day 2 | <25 | >2.5 |
| Day 3 | <25 | >2.5 |
| Day 4 | <25 | >2.5 |
| Day 5 | <25 | >2.5 |
| Day 6 | <25 | >2.5 |
| Day 7 | <25 | >2.5 |
Table 30 Test R5 Raspberry 6c 40% RH
| Time | Mean number of plaques (PFU/sample) +/-SEM | Mean log10 decrease from day 0 |
|---|---|---|
| Day 0 | 7833 +/- 1527 | n/a |
| Day 1 | <25 | >2.5 |
| Day 2 | 158 +/- 68 | 1.7 |
| Day 3 | 113 +/- 88 | 1.8 |
| Day 4 | <25 | >2.5 |
| Day 5 | <25 | >2.5 |
| Day 6 | <25 | >2.5 |
| Day 7 | <25 | >2.5 |
Table 31 Test R6 Raspberry 6c 20% RH
| Time | Mean number of plaques (PFU/sample) +/-SEM | Mean log10 decrease from day 0 |
|---|---|---|
| Day 0 | 7833 +/- 1527 | n/a |
| Day 1 | 46 +/- 21 | 2.2 |
| Day 2 | <25 | >2.5 |
| Day 3 | 33 +/- 8 | >2.5 |
| Day 4 | <25 | >2.5 |
| Day 5 | 63 +/- 38 | 2.1 |
| Day 6 | <25 | >2.5 |
| Day 7 | <25 | >2.5 |
9.1.4 Baked products and pastries
9.1.4.1 White bread crust
The results for white bread crust incubated for up to 7 days with SARS-CoV-2 can be seen in Table 32, Table 33, Table 34 and Table 35. For all tests, the means; SEM of the mean and log10 reduction of PFU over time are shown. The mean log10 decrease (shown to 2 significant figures) compares the PFU recovered at each time point to the PFU recovered at day 0, not to the initial inoculum. All tests were performed in triplicate. The limit of detection for this assay is 25 PFU/sample. Therefore, 2.2 is the maximum log10-reduction detectable with this assay design, equivalent to 25 PFU or fewer infectious virus remaining. Log10 decrease was calculated to 2 s.f.
Table 32 Test Wb1 White bread 23c 80% RH
| Time | Mean number of plaques (PFU/sample) +/-SEM | Mean log10 decrease from day 0 |
|---|---|---|
| Day 0 | 3583+/- 804 | n/a |
| Day 1 | 37.5 +/- 22 | 2.0 |
| Day 2 | <25 | >2.2 |
| Day 3 | <25 | >2.2 |
| Day 4 | <25 | >2.2 |
| Day 5 | <25 | >2.2 |
Table 33 Test Wb2 White bread 23c 57% RH
| Time | Mean number of plaques (PFU/sample) +/-SEM | Mean log10 decrease from day 0 |
|---|---|---|
| Day 0 | 3583+/- 804 | n/a |
| Day 1 | 208 +/- 29 | 1.2 |
| Day 2 | <25 | >2.2 |
| Day 3 | <25 | >2.2 |
| Day 4 | <25 | >2.2 |
| Day 5 | <25 | >2.2 |
| Day 6 | <25 | >2.2 |
| Day 7 | <25 | >2.2 |
Table 34 Test Wb3 White bread 23c 50% RH
| Time | Mean number of plaques (PFU/sample) +/-SEM | Mean log10 decrease from day 0 |
|---|---|---|
| Day 0 | 3583+/- 804 | n/a |
| Day 1 | 271 +/- 280 | 1.1 |
| Day 2 | 138 +/- 154 | 1.4 |
| Day 3 | <25 | >2.2 |
| Day 4 | <25 | >2.2 |
| Day 5 | <25 | >2.2 |
| Day 6 | <25 | >2.2 |
| Day 7 | <25 | >2.2 |
Table 35 Test Wb4 White bread 23c 20% RH
| Time | Mean number of plaques (PFU/sample) +/-SEM | Mean log10 decrease from day 0 |
|---|---|---|
| Day 0 | 3583+/- 804 | n/a |
| Day 1 | 275 +/- 303 | 1.1 |
| Day 2 | 167 +/- 194 | 1.3 |
| Day 3 | 117 +/- 101 | 1.5 |
| Day 4 | <25 | >2.2 |
| Day 5 | <25 | >2.2 |
9.1.4.2 Brown bread crust
The results for brown bread crust incubated for up to 7 days with SARS-CoV-2 can be seen in, Table 36 Table 37, Table 38 and Table 39. For all tests, the means; SEM of the mean and log10 reduction of PFU over time are shown. The mean log10 decrease (shown to 2 significant figures) compares the PFU recovered at each time point to the PFU recovered at day 0, not to the initial inoculum. All tests were performed in triplicate. The limit of detection for this assay is 25 PFU/sample. Therefore, 2.2 is the maximum log10-reduction detectable with this assay design, equivalent to 25 PFU or fewer infectious virus remaining. Log10 decrease was calculated to 2 s.f.
Table 36 Test Bb1: Brown bread, 23˚C, 80% RH
| Time | Mean number of plaques (PFU/sample) +/-SEM | Mean log10 decrease from day 0 |
|---|---|---|
| Day 0 | 3667 +/- 1627 | n/a |
| Day 1 | 379 +/- 221 | 0.99 |
| Day 2 | <25 | >2.2 |
| Day 3 | <25 | >2.2 |
| Day 4 | <25 | >2.2 |
| Day 5 | <25 | >2.2 |
Table 37 test Bb2 Brown bread 23c 57% RH
| Time | Mean number of plaques (PFU/sample) +/-SEM | Mean log10 decrease from day 0 |
|---|---|---|
| Day 0 | 3667 +/- 1627 | n/a |
| Day 1 | <25 | >2.2 |
| Day 2 | <25 | >2.2 |
| Day 3 | <25 | >2.2 |
| Day 4 | <25 | >2.2 |
| Day 5 | <25 | >2.2 |
Table 38 Test Bb3 Brown bread 23c 50% RH
| Time | Mean number of plaques (PFU/sample) +/-SEM | Mean log10 decrease from day 0 |
|---|---|---|
| Day 0 | 3667 +/- 1627 | n/a |
| Day 1 | 42 +/- 29 | 1.9 |
| Day 2 | <25 | >2.2 |
| Day 3 | <25 | >2.2 |
| Day 4 | <25 | >2.2 |
| Day 5 | <25 | >2.2 |
| Day 6 | <25 | >2.2 |
| Day 7 | <25 | >2.2 |
Table 39 Test Bb4 Brown bread 23c 20% RH
| Time | Mean number of plaques (PFU/sample) +/-SEM | Mean log10 decrease from day 0 |
|---|---|---|
| Day 0 | 3667 +/- 1627 | n/a |
| Day 1 | 129 +/- 106 | 1.5 |
| Day 2 | 83 +/- 102 | 1.6 |
| Day 3 | 12.5 +/- 121 | 1.5 |
| Day 4 | <25 | >2.2 |
| Day 5 | <25 | >2.2 |
9.1.4.3 Croissant
The results for croissant incubated for up to 7 days with SARS-CoV-2 can be seen in Table 40, Table 41, Table 42, Table 43, Table 44, Table 45, Table 46 and Table 47. For all tests, the means; SEM of the mean and log10 reduction of PFU over time are shown. The mean log10 decrease (shown to 2 significant figures) compares the PFU recovered at each time point to the PFU recovered at day 0, not to the initial inoculum. All tests were performed in triplicate. The limit of detection for this assay is 25 PFU/sample. Therefore, 2.4 is the maximum log10-reduction detectable with this assay design, equivalent to 25 PFU or fewer infectious virus remaining. Log10 decrease was calculated to 2 s.f.
Table 40 test Cr1 Croissant 23c 80% RH
| Time | Mean number of plaques (PFU/sample) +/-SEM | Mean log10 decrease from day 0 |
|---|---|---|
| Day 0 | 6500 +/- 661 | n/a |
| Day 1 | <25 | >2.4 |
| Day 2 | <25 | >2.4 |
| Day 3 | <25 | >2.4 |
| Day 4 | <25 | >2.4 |
| Day 5 | <25 | >2.4 |
Table 41 Test Cr2 Croissant 2c 57% RH
| Time | Mean number of plaques (PFU/sample) +/-SEM | Mean log10 decrease from day 0 |
|---|---|---|
| Day 0 | 6500 +/- 661 | n/a |
| Day 1 | <25 | >2.4 |
| Day 2 | <25 | >2.4 |
| Day 3 | <25 | >2.4 |
| Day 4 | <25 | >2.4 |
| Day 5 | <25 | >2.4 |
| Day 6 | <25 | >2.4 |
| Day 7 | <25 | >2.4 |
Table 42 Test Cr3 Croissant 23c 50% RH
| Time | Mean number of plaques (PFU/sample) +/-SEM | Mean log10 decrease from day 0 |
|---|---|---|
| Day 0 | 6500 +/- 661 | n/a |
| Day 1 | <25 | >2.4 |
| Day 2 | <25 | >2.4 |
| Day 3 | <25 | >2.4 |
| Day 4 | <25 | >2.4 |
| Day 5 | <25 | >2.4 |
| Day 6 | <25 | >2.4 |
| Day 7 | <25 | >2.4 |
Table 43 Test cr4 Croissant 23c 20% RH
| Time | Mean number of plaques (PFU/sample) +/-SEM | Mean log10 decrease from day 0 |
|---|---|---|
| Day 0 | 6500 +/- 661 | n/a |
| Day 1 | <25 | >2.4 |
| Day 2 | <25 | >2.4 |
| Day 3 | <25 | >2.4 |
| Day 4 | <25 | >2.4 |
| Day 5 | <25 | >2.4 |
Table 44 Test Cr5 Croissant 23c 80% RH
| Time | Mean number of plaques (PFU/sample) +/-SEM | Mean log10 decrease from day 0 |
|---|---|---|
| 0 hours | 6500 +/- 661 | n/a |
| 2 hours | 492 +/- 321 | 1.1 |
| 4 hours | 120 +/- 95 | 1.7 |
| 6 hours | <25 | >2.4 |
| 16 hours | <25 | >2.4 |
| 24 hours | <25 | >2.4 |
Table 45 Test Cr6 Croissant 23c 57% RH
| Time | Mean number of plaques (PFU/sample) +/-SEM | Mean log10 decrease from day 0 |
|---|---|---|
| 0 hours | 6500 +/- 661 | n/a |
| 2 hours | 797 +/- 600 | 0.91 |
| 4 hours | 378 +/- 600 | 1.2 |
| 6 hours | 241 +/- 141 | 1.5 |
| 16 hours | <25 | >2.4 |
| 24 hours | <25 | >2.4 |
Table 46 Test Cr7 Croissant 23c 50% RH
| Time | Mean number of plaques (PFU/sample) +/-SEM | Mean log10 decrease from day 0 |
|---|---|---|
| 0 hours | 6500 +/- 661 | n/a |
| 2 hours | 2203 +/- 624 | 0.47 |
| 4 hours | 400 +/- 174 | 1.2 |
| 6 hours | 387 +/- 295 | 1.2 |
| 16 hours | 255 +/- 25 | 1.4 |
| 24 hours | <25 | >2.4 |
Table 47 test Cr8 Croissant 23c 20% RH
| Time | Mean number of plaques (PFU/sample) +/-SEM | Mean log10 decrease from day 0 |
|---|---|---|
| 0 hours | 6500 +/- 661 | n/a |
| 2 hours | 453 +/- 251 | 1.2 |
| 4 hours | 191 +/- 148 | 1.5 |
| 6 hours | 182 +/- 166 | 1.6 |
| 16 hours | <25 | >2.4 |
| 24 hours | <25 | >2.4 |
9.1.4.4 Pain au chocolat
The results for pain au chocolat incubated for up to 7 days with SARS-CoV-2 can be seen in Table 48, Table 49, Table 50, Table 51, Table 52, Table 53, Table 54 and Table 55. For all tests, the means; SEM of the mean and log10 reduction of PFU over time are shown. The mean log10 decrease (shown to 2 significant figures) compares the PFU recovered at each time point to the PFU recovered at day 0, not to the initial inoculum. All tests were performed in triplicate. The limit of detection for this assay is 25 PFU/sample. Therefore, 2.2 is the maximum log10-reduction detectable with this assay design, equivalent to 25 PFU or fewer infectious virus remaining. Log10 decrease calculated to 2 s.f.
Table 48 Test Pc1: Pain au chocolat, 23˚C, 80% RH
| Time | Mean number of plaques (PFU/sample) +/-SEM | Mean log10 decrease from day 0 |
|---|---|---|
| Day 0 | 3583 +/- 382 | n/a |
| Day 1 | <25 | >2.2 |
| Day 2 | <25 | >2.2 |
| Day 3 | <25 | >2.2 |
| Day 4 | <25 | >2.2 |
| Day 5 | <25 | >2.2 |
Table 49 Test Pc2 Pain au chocolat 23c 57% RH
| Time | Mean number of plaques (PFU/sample) +/-SEM | Mean log10 decrease from day 0 |
|---|---|---|
| Day 0 | 3583 +/- 382 | n/a |
| Day 1 | <25 | >2.2 |
| Day 2 | <25 | >2.2 |
| Day 3 | <25 | >2.2 |
| Day 4 | <25 | >2.2 |
| Day 5 | <25 | >2.2 |
| Day 6 | <25 | >2.2 |
| Day 7 | <25 | >2.2 |
Table 50 Test Pc3 Pain au chocolat 23c 50% RH
| Time | Mean number of plaques (PFU/sample) +/-SEM | Mean log10 decrease from day 0 |
|---|---|---|
| Day 0 | 3583 +/- 382 | n/a |
| Day 1 | <25 | >2.2 |
| Day 2 | 33 +/- 10 | 2.0 |
| Day 3 | <25 | >2.2 |
| Day 4 | <25 | >2.2 |
| Day 5 | <25 | >2.2 |
| Day 6 | <25 | >2.2 |
| Day 7 | <25 | >2.2 |
Table 51 test Pc4 Pain au chocolat 23c 20% RH
| Time | Mean number of plaques (PFU/sample) +/-SEM | Mean log10 decrease from day 0 |
|---|---|---|
| Day 0 | 3583 +/- 382 | n/a |
| Day 1 | <25 | >2.2 |
| Day 2 | <25 | >2.2 |
| Day 3 | <25 | >2.2 |
| Day 4 | <25 | >2.2 |
| Day 5 | <25 | >2.2 |
Table 52 test Pc5 Pain au chocolat 23c 80% RH
| Time | Mean number of plaques (PFU/sample) +/-SEM | Mean log10 decrease from day 0 |
|---|---|---|
| 0 hours | 3583 +/- 382 | n/a |
| 2 hours | 953 +/- 713 | 0.58 |
| 4 hours | 1061 +/- 441 | 0.53 |
| 6 hours | 74 +/- 24 | 1.7 |
| 16 hours | <25 | >2.2 |
| 24 hours | <25 |
>2.2 |
Table 53 Test Pc6 Pain au chocolat 23c 57% RH
| Time | Mean number of plaques (PFU/sample) +/-SEM | Mean log10 decrease from day 0 |
|---|---|---|
| 0 hours | 3583 +/- 382 | n/a |
| 2 hours | 1450 +/- 1567 | 0.39 |
| 4 hours | 705 +/- 253 | 0.71 |
| 6 hours | 42 +/- 14 | 1.9 |
| 16 hours | <25 | >2.2 |
| 24 hours | <25 |
>2.2 |
Table 54 Test Pc7 Pain au chocolat 23c 50% RH
| Time | Mean number of plaques (PFU/sample) +/-SEM | Mean log10 decrease from day 0 |
|---|---|---|
| 0 hours | 3583 +/- 382 | n/a |
| 2 hours | 1427 +/- 23 | 0.40 |
| 4 hours | 255 +/- 169 | 1.2 |
| 6 hours | 93 +/- 23 | 1.6 |
| 16 hours | 60 +/- 30 | 1.8 |
| 24 hours | <25 |
>2.2 |
Table 55 Test Pc8 Pain au chocolat 23c 20% RH
| Time | Mean number of plaques (PFU/sample) +/-SEM | Mean log10 decrease from day 0 |
|---|---|---|
| 0 hours | 3583 +/- 382 | n/a |
| 2 hours | 499 +/- 439 | 0.86 |
| 4 hours | 191 +/- 23 | 1.3 |
| 6 hours | <25 | >2.2 |
| 16 hours | <25 | >2.2 |
| 24 hours | <25 |
>2.2 |
9.1.5 Delicatessen items
9.1.5.1 Sliced ham
The results for ham incubated for up to 7 days with SARS-CoV-2 can be seen in Table 56, Table 57, Table 58 and Table 59. For all tests, the means; SEM of the mean and log10 reduction of PFU over time are shown. The mean log10 decrease (shown to 2 significant figures) compares the PFU recovered at each time point to the PFU recovered at day 0, not to the initial inoculum. All tests were performed in triplicate. The limit of detection for this assay is 25 PFU/sample. Therefore, 2.4 is the maximum log10-reduction detectable with this assay design, equivalent to 25 PFU or fewer infectious virus remaining. Log10 decrease was calculated to 2 s.f.
Table 56 Test H1: Ham, 6˚C, 74% RH
| Time | Mean number of plaques (PFU/sample) +/-SEM | Mean log10 decrease from day 0 |
|---|---|---|
| Day 0 | 4000 +/- 1607 | n/a |
| Day 1 | 1240 +/- 266 | 0.51 |
| Day 2 | 667 +/- 131 | 0.78 |
| Day 3 | 840 +/- 295 | 0.68 |
| Day 4 | 467 +/- 48 | 0.93 |
| Day 5 | 640 +/- 106 | 0.80 |
| Day 6 | 267 +/- 74 | 1.2 |
| Day 7 | 480 +/- 101 | 0.92 |
Table 57 Test H2: Ham, 6˚C, 60% RH
| Time | Mean number of plaques (PFU/sample) +/-SEM | Mean log10 decrease from day 0 |
|---|---|---|
| Day 0 | 4000 +/- 1607 | n/a |
| Day 1 | 1950 +/- 304 | 0.31 |
| Day 2 | 1233 +/- 67 | 0.51 |
| Day 3 | 1333 +/- 44 | 0.48 |
| Day 4 | 950 +/- 153 | 0.62 |
| Day 5 | 700 +/- 76 | 0.76 |
| Day 6 | 267 +/- 93 | 1.2 |
| Day 7 | 383 +/- 130 | 1.0 |
Table 58 Test H3: Ham, 6˚C, 50% RH
| Time | Mean number of plaques (PFU/sample) +/-SEM | Mean log10 decrease from day 0 |
|---|---|---|
| Day 0 | 4000 +/- 1607 | n/a |
| Day 1 | 1467 +/- 176 | 0.44 |
| Day 2 | 1367 +/- 120 | 0.47 |
| Day 3 | 1600 +/- 100 | 0.40 |
| Day 4 | 3533 +/- 240 | 0.054 |
| Day 5 | 2467 +/- 521 | 0.21 |
| Day 6 | 667 +/- 291 | 0.78 |
| Day 7 | 508 +/- 243 | 0.90 |
Table 59 Test H4: Ham, 6˚C, 20% RH
| Time | Mean number of plaques (PFU/sample) +/-SEM | Mean log10 decrease from day 0 |
|---|---|---|
| Day 0 | 4000 +/- 1607 | n/a |
| Day 1 | 3917 +/- 83 | 0.0091 |
| Day 2 | 1700 +/- 436 | 0.37 |
| Day 3 | 1567 +/- 410 | 0.41 |
| Day 4 | 1500 +/- 300 | 0.43 |
| Day 5 | 1033 +/- 88 | 0.59 |
| Day 6 | 2033 +/- 174 | 0.29 |
| Day 7 | 1383 +/- 268 | 0.46 |
9.1.5.2 Cheddar Cheese
The results for cheddar cheese incubated for up to 7 days with SARS-CoV-2 can be seen in Table 60, Table 61, Table 62 and Table 63. For all tests, the means; SEM of the mean and log10 reduction of PFU over time are shown. The mean log10 decrease (shown to 2 significant figures) compares the PFU recovered at each time point to the PFU recovered at day 0, not to the initial inoculum. All tests were performed in triplicate. The limit of detection for this assay is 25 PFU/sample. Therefore, 2.4 is the maximum log10-reduction detectable with this assay design, equivalent to 25 PFU or fewer infectious virus remaining. Log10 decrease was calculated to 2 s.f.
Table 60 Test Ch1: Cheese, 6˚C, 74% RH
| Time | Mean number of plaques (PFU/sample) +/-SEM | Mean log10 decrease from day 0 |
|---|---|---|
| Day 0 | 6083 +/- 1416 | n/a |
| Day 1 | 1053+/- 114 | 0.76 |
| Day 2 | 973 +/- 139 | 0.80 |
| Day 3 | 840 +/- 260 | 0.86 |
| Day 4 | 400 +/- 23 | 1.2 |
| Day 5 | 453 +/- 48 | 1.1 |
| Day 6 | 307 +/- 74 | 1.3 |
| Day 7 | 533 +/- 87 | 1.1 |
Table 61 Test Ch2: Cheese 6c 60% RH
| Time | Mean number of plaques (PFU/sample) +/-SEM | Mean log10 decrease from day 0 |
|---|---|---|
| Day 0 | 6083 +/- 1416 | n/a |
| Day 1 | 1750 +/- 397 | 0.54 |
| Day 2 | 1133 +/- 83 | 0.73 |
| Day 3 | 1267 +/- 109 | 0.68 |
| Day 4 | 892 +/- 74 | 0.83 |
| Day 5 | 733 +/- 88 | 0.91 |
| Day 6 | 666 +/- 145 | 0.96 |
| Day 7 | 600 +/- 173 | 1.0 |
Table 62 Test Ch3 Cheese 6c 50% RH
| Time | Mean number of plaques (PFU/sample) +/-SEM | Mean log10 decrease from day 0 |
|---|---|---|
| Day 0 | 6083 +/- 1416 | n/a |
| Day 1 | 2000 +/- 200 | 0.48 |
| Day 2 | 1767 +/- 260 | 0.54 |
| Day 3 | 1800 +/- 346 | 0.53 |
| Day 4 | 1800 +/- 493 | 0.53 |
| Day 5 | 1767 +/- 491 | 0.53 |
| Day 6 | 467 +/- 67 | 1.1 |
| Day 7 | 967 +/- 426 | 0.8 |
Table 63 Test Ch4 Cheese 6c 20% RH
| Time | Mean number of plaques (PFU/sample) +/-SEM | Mean log10 decrease from day 0 |
|---|---|---|
| Day 0 | 6083 +/- 1416 | n/a |
| Day 1 | 3533 +/- 145 | 0.24 |
| Day 2 | 2033 +/- 186 | 0.48 |
| Day 3 | 1433 +/- 318 | 0.63 |
| Day 4 | 1733 +/- 291 | 0.55 |
| Day 5 | 1567 +/- 273 | 0.59 |
| Day 6 | 1017 +/- 93 | 0.78 |
| Day 7 | 1933 +/- 203 | 0.5 |
9.1.5.3 Olive
The results for olive incubated for up to 96 hours with SARS-CoV-2 can be seen in Table 64. For all tests, the means; SEM of the mean and log10 reduction of PFU over time are shown. The mean log10 decrease (shown to 2 significant figures) compares the PFU recovered at each time point to the PFU recovered at day 0, not to the initial inoculum. All tests were performed in triplicate. The limit of detection for this assay is 25 PFU/sample. Therefore, 2.6 is the maximum log10-reduction detectable with this assay design, equivalent to 25 PFU or fewer infectious virus remaining. Log10 decrease was calculated to 2 s.f.
Table 64 Test O1: Olive, 6˚C, 60% RH
| Time | Mean number of plaques (PFU/sample) +/-SEM | Mean log10 decrease from day 0 |
|---|---|---|
| 0 minutes | 10250 | n/a |
| 1 minute | 545 +/- 274 | 1.3 |
| 15 minutes | 567 +/- 69 | 1.3 |
| 30 minutes | 490 +/- 176 | 1.3 |
| 60 minutes | 207 +/- 37 | 1.7 |
| 24 hours | <25 | >2.6 |
| 48 hours | <25 | >2.6 |
| 96 hours | <25 | >2.6 |
9.1.5.4 Brine
The results for brine incubated for up to 7 days with SARS-CoV-2 can be seen in Table 65, Table 66, Table 67 and Table 68. For all tests, the means; SEM of the mean and log10 reduction of PFU over time are shown. The mean log10 decrease (shown to 2 significant figures) compares the PFU recovered at each time point to the PFU recovered at day 0, not to the initial inoculum. All tests were performed in triplicate. The limit of detection for this assay is 25 PFU/sample. Therefore, 1.9 is the maximum log10-reduction detectable with this assay design, equivalent to 25 PFU or fewer infectious virus remaining. Log10 decrease was calculated to 2 s.f.
Table 65 Test BR1: Brine, 6˚C, 74% RH
| Time | Mean number of plaques (PFU/sample) +/-SEM | Mean log10 decrease from day 0 |
|---|---|---|
| Day 0 | 2083 +/- 682 | n/a |
| Day 1 | 303 +/- 58 | 0.84 |
| Day 2 | 71 +/- 22 | 1.47 |
| Day 3 | <25 | >1.9 |
| Day 4 | <25 | >1.9 |
| Day 5 | <25 | >1.9 |
| Day 6 | <25 | >1.9 |
| Day 7 | <25 | >1.9 |
Table 66 Test Br2 Brine 6c 60% RH
| Time | Mean number of plaques (PFU/sample) +/-SEM | Mean log10 decrease from day 0 |
|---|---|---|
| Day 0 | 2083 +/- 682 | n/a |
| Day 1 | 430 +/- 58 | 0.69 |
| Day 2 | 92 +/- 22 | 1.4 |
| Day 3 | 98 +/- 38 | 1.3 |
| Day 4 | 50 +/- 25 | 1.6 |
| Day 5 | <25 | >1.9 |
| Day 6 | <25 | >1.9 |
| Day 7 | <25 | >1.9 |
Table 67 Test BE3 Brine 6c 50% RH
| Time | Mean number of plaques (PFU/sample) +/-SEM | Mean log10 decrease from day 0 |
|---|---|---|
| Day 0 | 2083 +/- 682 | n/a |
| Day 1 | 346 +/- 165 | 0.78 |
| Day 2 | <25 | >1.9 |
| Day 3 | <25 | >1.9 |
| Day 4 | <25 | >1.9 |
| Day 5 | <25 | >1.9 |
| Day 6 | <25 | >1.9 |
| Day 7 | <25 | >1.9 |
Test 68 Test BR4 Brine 6c 20% RH
| Time | Mean number of plaques (PFU/sample) +/-SEM | Mean log10 decrease from day 0 |
|---|---|---|
| Day 0 | 2083 +/- 682 | n/a |
| Day 1 | 383 +/- 42 | 0.74 |
| Day 2 | 102 +/- 36 | 1.3 |
| Day 3 | 87 +/- 36 | 1.4 |
| Day 4 | <25 | 1.9 |
9.2 SARS CoV-2 survival on food packaging materials
9.2.1 Baseline parameters all food packaging materials
Baseline parameters for all food packaging tests were determined and are shown in Table 69, Table 70 and Table 71.
Table 69 Effect of packaging sample extracts without virus on Vero E6 cells.
| Packaging sample | Observable CPE % |
|---|---|
| PET1 bottle no virus | 0 |
| PET1 tray no virus | 0 |
| Aluminium can no virus | 0 |
| Composite drinks carton | 0 |
Table 70 Effect of packaging sample extracts on SARS-CoV-2
| Packaging Sample | Mean number of plaques (PFU/sample) | Mean % recovery |
|---|---|---|
| Infection Medium + SARS-CoV-2 | 10250 | 100 |
| PET1 bottle + SARS-CoV-2 | 9900 | 96.5 |
| PET1 tray + SARS-CoV-2 | 10000 | 97.5 |
| Aluminium can + SARS-CoV-2 | 9250 | 90 |
| Composite drinks cartons + SARS-CoV-2 | 9333 | 91 |
Table 71 Recovery of artificially contaminated SARS-CoV-2 from food packaging in the presence or absence of 0.1% mucin
| Packaging Sample | Mean number of plaques (PFU/sample) | Mean % recovery |
|---|---|---|
| PET1 bottle + SARS-CoV-2 | 7050 +/- 1826 | 69 |
| PET1 bottle + SARS-CoV-2 + mucin | 6667 +/- 1121 | 65 |
| PET1 tray + SARS-CoV-2 | 4583 +/- 682 | 45 |
| Aluminium can + SARS-CoV-2 | 6167 +/- 1258 | 60 |
| Aluminium can + SARS-CoV-2 + mucin | 5542 +/- 494 | 54 |
| Composite drinks cartons + SARS-CoV-2 | 7333 +- 882 | 71.5 |
| Composite drinks cartons + SARS-CoV-2 + mucin | 6000 +/- 764 | 58.5 |
All tests performed in triplicate with 10250 PFU added to each sample.
9.2.2 Packaging materials
9.2.2.1 PET1 Plastic bottles
The results for PET1 bottles incubated without mucin for up to 7 days with SARS-CoV-2 can be seen in Table 72, Table 73, Table 74, Table 75, Table 76 and Table 77. For all tests, the means; SEM of the mean and log10 reduction of PFU over time are shown. The mean log10 decrease (shown to 2 significant figures) compares the PFU recovered at each time point to the PFU recovered at day 0, not to the initial inoculum. All tests were performed in triplicate. The limit of detection for this assay is 25 PFU/sample. Therefore, 2.5 is the maximum log10-reduction detectable with this assay design, equivalent to 25 PFU or fewer infectious virus remaining. Log10 decrease was calculated to 2 s.f.
Table 72 Test PB1: PET1 bottle, 21˚C, 80% RH
| Time | Mean number of plaques (PFU/sample) +/-SEM | Mean log10 decrease from day 0 |
|---|---|---|
| Day 0 | 7050 +/- 1826 | n/a |
| Day 1 | <25 | >2.5 |
| Day 2 | <25 | >2.5 |
| Day 3 | <25 | >2.5 |
| Day 4 | <25 | >2.5 |
| Day 5 | <25 | >2.5 |
| Day 6 | <25 | >2.5 |
| Day 7 | <25 | >2.5 |
Table 73 Test PB2 PET1 bottle 21c 53% RH
| Time | Mean number of plaques (PFU/sample) +/-SEM | Mean log10 decrease from day 0 |
|---|---|---|
| Day 0 | 7050 +/- 1826 | n/a |
| Day 1 | 4250 +/- 350 | 0.23 |
| Day 2 | 467 +/- 257 | 1.19 |
| Day 3 | <25 | >2.5 |
| Day 4 | <25 | >2.5 |
| Day 5 | <25 | >2.5 |
| Day 6 | <25 | >2.5 |
| Day 7 | 50 +/- 25 | 2.1 |
Table 74 Test PB3 PET1 bottle 21c 20% RH
| Time | Mean number of plaques (PFU/sample) +/-SEM | Mean log10 decrease from day 0 |
|---|---|---|
| Day 0 | 7050 +/- 1826 | n/a |
| Day 1 | <25 | >2.5 |
| Day 2 | <25 | >2.5 |
| Day 3 | <25 | >2.5 |
| Day 4 | <25 | >2.5 |
| Day 5 | <25 | >2.5 |
| Day 6 | <25 | >2.5 |
| Day 7 | <25 | >2.5 |
Table 75 Test PB4 PET1 bottle 6c 80% RH
| Time | Mean number of plaques (PFU/sample) +/-SEM | Mean log10 decrease from day 0 |
|---|---|---|
| Day 0 | 7050 +/- 1826 | n/a |
| Day 1 | 2508 +/- 2278 | 0.45 |
| Day 2 | 117 +/- 159 | 1.8 |
| Day 3 | 108+/- 88 | 1.8 |
| Day 4 | 158 +/- 29 | 1.6 |
| Day 5 | <25 | >2.5 |
| Day 6 | <25 | >2.5 |
| Day 7 | <25 |
>2.5 |
Table 76 Test PB5 PET1 bottle 6c 40% RH
| Time | Mean number of plaques (PFU/sample) +/-SEM | Mean log10 decrease from day 0 |
|---|---|---|
| Day 0 | 7050 +/- 1826 | n/a |
| Day 1 | 1478 +/-971 | 0.68 |
| Day 2 | 80 +/- 95 | 1.96 |
| Day 3 | 111 +/- 150 | 1.8 |
| Day 4 | 181 +/- 175 | 1.6 |
| Day 5 | <25 | >2.5 |
| Day 6 | <25 | >2.5 |
| Day 7 | 82 +/- 35 | 1.9 |
Table 77 Test PB6 PET1 bottle 6c 20% RH
| Time | Mean number of plaques (PFU/sample) +/-SEM | Mean log10 decrease from day 0 |
|---|---|---|
| Day 0 | 7050 +/- 1826 | n/a |
| Day 1 | 1271 +/- 58 | 0.76 |
| Day 2 | 1183 +/- 1141 | 0.78 |
| Day 3 | 50 +/- 0 | 2.1 |
| Day 4 | 75 +/- 66 | 2.0 |
| Day 5 | 95 +/- 73 | 1.9 |
| Day 6 | 365 +/- 279 | 1.3 |
| Day 7 | <25 | >2.5 |
9.2.2.2 PET1 Plastic bottles with added mucin
The results for PET1 bottles incubated with added mucin for up to 7 days with SARS-CoV-2 can be seen in Table 78, Table 79, Table 80, Table 81, Table 82 and Table 83. For all tests, the means; SEM of the mean and log10 reduction of PFU over time are shown. The mean log10 decrease (shown to 2 significant figures) compares the PFU recovered at each time point to the PFU recovered at day 0, not to the initial inoculum. All tests were performed in triplicate. The limit of detection for this assay is 25 PFU/sample. Therefore, 2.4 is the maximum log10-reduction detectable with this assay design, equivalent to 25 PFU or fewer infectious virus remaining. Log10 decrease was calculated to 2 s.f.
Table 78 Test PB1M: PET1 bottle, mucin, 21˚C, 80% RH
| Time | Mean number of plaques (PFU/sample) +/-SEM | Mean log10 decrease from day 0 |
|---|---|---|
| Day 0 | 6667 +/- 1121 | n/a |
| Day 1 | 327 +/- 99 | 1.3 |
| Day 2 | <25 | >2.4 |
| Day 3 | <25 | >2.4 |
| Day 4 | <25 | >2.4 |
Table 79 Test PB2M : PET1 bottle mucin 21c 53% RH
| Time | Mean number of plaques (PFU/sample) +/-SEM | Mean log10 decrease from day 0 |
|---|---|---|
| Day 0 | 6667 +/- 1121 | n/a |
| Day 1 | 83 +/- 8 | 1.9 |
| Day 2 | <25 | >2.4 |
| Day 3 | <25 | >2.4 |
| Day 4 | <25 | >2.4 |
| Day 5 | <25 | >2.4 |
| Day 6 | <25 | >2.4 |
| Day 7 | <25 | >2.4 |
Table 80 Test PB3M PET! bottle, mucin, 21c 20% RH
| Time | Mean number of plaques (PFU/sample) +/-SEM | Mean log10 decrease from day 0 |
|---|---|---|
| Day 0 | 6667 +/- 1121 | n/a |
| Day 1 | 133 +/- 60 | 1.7 |
| Day 2 | <25 | >2.4 |
| Day 3 | <25 | >2.4 |
| Day 4 | <25 | >2.4 |
Table 81 Test PB4M PET1 bottle mucin 6c 80% RH
| Time | Mean number of plaques (PFU/sample) +/-SEM | Mean log10 decrease from day 0 |
|---|---|---|
| Day 0 | 6667 +/- 1121 | n/a |
| Day 1 | 1430 +/- 334 | 0.67 |
| Day 2 | 87 +/- 62 | 1.9 |
| Day 3 | 178 +/- 77 | 1.6 |
| Day 4 | <25 | >2.4 |
Table 82 Test PB5M PET1 bottle mucin 6c 40% RH
| Time | Mean number of plaques (PFU/sample) +/-SEM | Mean log10 decrease from day 0 |
|---|---|---|
| Day 0 | 6667 +/- 1121 | n/a |
| Day 1 | 175 +/- 120 | 1.6 |
| Day 2 | <25 | >2.4 |
| Day 3 | <25 | >2.4 |
| Day 4 | <25 | >2.4 |
| Day 5 | <25 | >2.4 |
| Day 6 | <25 | >2.4 |
| Day 7 | <25 | >2.4 |
Table 83 Test PB6M PET1 bottle mucin 6c 20% RH
| Time | Mean number of plaques (PFU/sample) +/-SEM | Mean log10 decrease from day 0 |
|---|---|---|
| Day 0 | 6667 +/- 1121 | n/a |
| Day 1 | 1026 +/- 204 | 0.81 |
| Day 2 | 725 +/- 98 | 0.96 |
| Day 3 | <25 | >2.4 |
| Day 4 | <25 | >2.4 |
9.2.2.3 PET1 Trays
The results for PET1 trays incubated for up to 7 days with SARS-CoV-2 can be seen in Table 85, Table 86, Table 87, Table 88 and Table 89. For all tests, the means; SEM of the mean and log10 reduction of PFU over time are shown. The mean log10 decrease (shown to 2 significant figures) compares the PFU recovered at each time point to the PFU recovered at day 0, not to the initial inoculum. All tests were performed in triplicate. The limit of detection for this assay is 25 PFU/sample. Therefore, 2.3 is the maximum log10-reduction detectable with this assay design, equivalent to 25 PFU or fewer infectious virus remaining. Log10 decrease was calculated to 2 s.f.
Table 84 Test PT1: PET1 tray, 21°C, 80% RH
| Time | Mean number of plaques (PFU/sample) +/-SEM | Mean log10 decrease from day 0 |
|---|---|---|
| Day 0 | 4583 +/- 682 | n/a |
| Day 1 | <25 | >2.3 |
| Day 2 | <25 | >2.3 |
| Day 3 | <25 | >2.3 |
| Day 4 | <25 | >2.3 |
| Day 5 | <25 | >2.3 |
| Day 6 | <25 | >2.3 |
| Day 7 | <25 | >2.3 |
Table 85 Test PT2 PET1 tray 21c 53% RH
| Time | Mean number of plaques (PFU/sample) +/-SEM | Mean log10 decrease from day 0 |
|---|---|---|
| Day 0 | 4583 +/- 682 | n/a |
| Day 1 | 2583 +/- 1010 | 0.25 |
| Day 2 | 1375 +/- 125 | 0.52 |
| Day 3 | 1417 +/- 722 | 0.51 |
| Day 4 | 575 +/- 588 | 0.90 |
| Day 5 | <25 | >2.3 |
| Day 6 | <25 | >2.3 |
| Day 7 | <25 | >2.3 |
Table 86 Test PT3 PET1 tray 21c 20% RH
| Time | Mean number of plaques (PFU/sample) +/-SEM | Mean log10 decrease from day 0 |
|---|---|---|
| Day 0 | 4583 +/- 682 | n/a |
| Day 1 | <25 | >2.3 |
| Day 2 | <25 | >2.3 |
| Day 3 | <25 | >2.3 |
| Day 4 | <25 | >2.3 |
| Day 5 | <25 | >2.3 |
| Day 6 | <25 | >2.3 |
| Day 7 | <25 | >2.3 |
Table 87 Test Pt4 PET1 tray 6c 80% RH
| Time | Mean number of plaques (PFU/sample) +/-SEM | Mean log10 decrease from day 0 |
|---|---|---|
| Day 0 | 4583 +/- 682 | n/a |
| Day 1 | 5250 +/- 1750 | -0.06 |
| Day 2 | 750 +/- 901 | 0.79 |
| Day 3 | 242 +/- 38 | 1.3 |
| Day 4 | 158 +/- 63 | 1.5 |
| Day 5 | <25 | >2.3 |
| Day 6 | <25 | >2.3 |
| Day 7 | <25 | >2.3 |
Table 88 Test PT5 PET1 tray 6c 40% RH
| Time | Mean number of plaques (PFU/sample) +/-SEM | Mean log10 decrease from day 0 |
|---|---|---|
| Day 0 | 4583 +/- 682 | n/a |
| Day 1 | 1667 +/- 629 | 0.44 |
| Day 2 | 1300 +/- 87 | 0.55 |
| Day 3 | 117 +/- 95 | 1.6 |
| Day 4 | 808 +/-664 | 0.75 |
| Day 5 | 342 +/- 485 | 1.1 |
| Day 6 | <25 | >2.3 |
| Day 7 | <25 | >2.3 |
Table 89 Test PT6 PET1 tray 6c 20% RH
| Time | Mean number of plaques (PFU/sample) +/-SEM | Mean log10 decrease from day 0 |
|---|---|---|
| Day 0 | 4583 +/- 682 | n/a |
| Day 1 | 2433 +/- 1436 | 0.28 |
| Day 2 | 1142 +/- 500 | 0.6 |
| Day 3 | 58 +/- 58 | 1.9 |
| Day 4 | 142 +/- 101 | 1.5 |
| Day 5 |
175 +/- 5 |
1.4 |
| Day 6 | 450 +/- 132 | 1.0 |
| Day 7 | <25 | >2.3 |
9.2.2.4 Aluminium cans
The results for aluminium cans incubated without mucin for up to 7 days with SARS-CoV-2 can be seen in Table 90, Table 91, Table 92, Table 93, Table 94, Table 95 and Table 96. For all tests, the means; SEM of the mean and log10 reduction of PFU over time are shown. The mean log10 decrease (shown to 2 significant figures) compares the PFU recovered at each time point to the PFU recovered at day 0, not to the initial inoculum. All tests were performed in triplicate. The limit of detection for this assay is 25 PFU/sample. Therefore, 2.4 is the maximum log10-reduction detectable with this assay design, equivalent to 25 PFU or fewer infectious virus remaining. Log10 decrease was calculated to 2 s.f.
Table 90 Test AL1: Aluminium can, 21˚C, 80% RH
| Time | Mean number of plaques (PFU/sample) +/-SEM | Mean log10 decrease from day 0 |
|---|---|---|
| Day 0 | 6167 +/- 1258 | n/a |
| Day 1 | <25 | >2.4 |
| Day 2 | <25 | >2.4 |
| Day 3 | <25 | >2.4 |
| Day 4 | <25 | >2.4 |
Table 91 Test AL2 Aluminium can 21c 53% RH
| Time | Mean number of plaques (PFU/sample) +/-SEM | Mean log10 decrease from day 0 |
|---|---|---|
| Day 0 | 6167 +/- 1258 | n/a |
| Day 1 | <25 | >2.4 |
| Day 2 | <25 | >2.4 |
| Day 3 | <25 | >2.4 |
| Day 4 | <25 | >2.4 |
| Day 5 | <25 | >2.4 |
| Day 6 | <25 | >2.4 |
| Day 7 | <25 | >2.4 |
Table 92 Test AL3 Aluminium can 21c 20% RH
| Time | Mean number of plaques (PFU/sample) +/-SEM | Mean log10 decrease from day 0 |
|---|---|---|
| Day 0 | 6167 +/- 1258 | n/a |
| Day 1 | <25 | >2.4 |
| Day 2 | <25 | >2.4 |
| Day 3 | <25 | >2.4 |
| Day 4 | <25 | >2.4 |
Table 93 Test AL4 Aluminium can 21c 80% RH
| Time | Mean number of plaques (PFU/sample) +/-SEM | Mean log10 decrease from day 0 |
|---|---|---|
| Day 0 | 6167 +/- 1258 | n/a |
| Day 1 | 21 +/- 116 | 1.5 |
| Day 2 | 346 +/- 165 | 1.3 |
| Day 3 | 181 +/- 79 | 1.6 |
| Day 4 | <25 | >2.4 |
Table 94 Test AL5 Aluminium can 21c 53% RH
| Time | Mean number of plaques (PFU/sample) +/-SEM | Mean log10 decrease from day 0 |
|---|---|---|
| Day 0 | 6167 +/- 1258 | n/a |
| Day 1 | 77 +/- 52 | 1.9 |
| Day 2 | 47 +/- 22 | 2.1 |
| Day 3 | <25 | >2.4 |
| Day 4 | <25 | >2.4 |
| Day 5 | <25 | >2.4 |
| Day 6 | <25 | >2.4 |
| Day 7 | <25 | >2.4 |
Table 95 Test AL6 Aluminium can 21c 20% RH
| Time | Mean number of plaques (PFU/sample) +/-SEM | Mean log10 decrease from day 0 |
|---|---|---|
| Day 0 | 6167 +/- 1258 | n/a |
| Day 1 | 272 +/- 157 | 1.4 |
| Day 2 | 271 +/- 125 | 1.4 |
| Day 3 | <25 | <2.4 |
| Day 4 | <25 | >2.4 |
Table 96 Test AL7 Aluminium can 21c 53% RH
| Time | Mean number of plaques (PFU/sample) +/-SEM | Mean log10 decrease from day 0 |
|---|---|---|
| 0 hours | 6167 +/- 1258 | n/a |
| 3 hours | 3342 +/- 472 | 0.27 |
| 6 hours | 883 +/- 252 | 0.84 |
| 24 hours | <25 | <2.4 |
9.2.2.5 Aluminium cans with added mucin
The results for aluminium cans incubated with added mucin for up to 7 days with SARS-CoV-2 can be seen in Table 97, Table 98, Table 99, Table 100, Table 101, Table 102 and Table 103. For all tests, the means; SEM of the mean and log10 reduction of PFU over time are shown. The mean log10 decrease (shown to 2 significant figures) compares the PFU recovered at each time point to the PFU recovered at day 0, not to the initial inoculum. All tests were performed in triplicate. The limit of detection for this assay is 25 PFU/sample. Therefore, 2.3 is the maximum log10-reduction detectable with this assay design, equivalent to 25 PFU or fewer infectious virus remaining. Log10 decrease was calculated to 2 s.f.
Table 97 Test AL1M: Aluminium can, mucin, 21˚C, 80% RH
| Time | Mean number of plaques (PFU/sample) +/-SEM | Mean log10 decrease from day 0 |
|---|---|---|
| Day 0 | 5542 +/- 494 | n/a |
| Day 1 | 80 +/- 26 | 1.8 |
| Day 2 | <25 | >2.3 |
| Day 3 | <25 | <2.3 |
| Day 4 | <25 | >2.3 |
Table 98 Test AL2M Aluminium can mucin 21c 53% RH
| Time | Mean number of plaques (PFU/sample) +/-SEM | Mean log10 decrease from day 0 |
|---|---|---|
| Day 0 | 5542 +/- 494 | n/a |
| Day 1 | <25 | >2.3 |
| Day 2 | <25 | >2.3 |
| Day 3 | <25 | <2.3 |
| Day 4 | <25 | >2.3 |
| Day 5 | <25 | >2.3 |
| Day 6 | <25 | >2.3 |
| Day 7 | <25 | >2.3 |
Table 99 Test AL3M Aluminium can mucin 21c 20% RH
| Time | Mean number of plaques (PFU/sample) +/-SEM | Mean log10 decrease from day 0 |
|---|---|---|
| Day 0 | 5542 +/- 494 | n/a |
| Day 1 | <25 | >2.3 |
| Day 2 | <25 | >2.3 |
| Day 3 | <25 | <2.3 |
| Day 4 | <25 | >2.3 |
Table 100 Test AL4M Aluminium can mucin 6c 80% RH
| Time | Mean number of plaques (PFU/sample) +/-SEM | Mean log10 decrease from day 0 |
|---|---|---|
| Day 0 | 5542 +/- 494 | n/a |
| Day 1 | 908 +/- 812 | 0.79 |
| Day 2 | 843 +/- 249 | 0.82 |
| Day 3 | 657 +/- 131 | 0.93 |
| Day 4 | <25 | >2.3 |
Table 101 Test AL5M Aluminium can mucin 6c 53% RH
| Time | Mean number of plaques (PFU/sample) +/-SEM | Mean log10 decrease from day 0 |
|---|---|---|
| Day 0 | 5542 +/- 494 | n/a |
| Day 1 | 129 +/- 55 | 1.6 |
| Day 2 | 99 +/- 45 | 1.8 |
| Day 3 | <25 | <2.3 |
| Day 4 | <25 | >2.3 |
| Day 5 | <25 | >2.3 |
| Day 6 | <25 | >2.3 |
| Day 7 | <25 | >2.3 |
Table 102 Test AL6M Aluminium can mucin 6c 20% RH
| Time | Mean number of plaques (PFU/sample) +/-SEM | Mean log10 decrease from day 0 |
|---|---|---|
| Day 0 | 5542 +/- 494 | n/a |
| Day 1 | 833 +/- 137 | 0.82 |
| Day 2 | 318 +/- 156 | 1.2 |
| Day 3 | <25 | <2.3 |
| Day 4 | <25 | >2.3 |
Table 103 Test AL7M Aluminium can mucin 21c 53% RH
| Time | Mean number of plaques (PFU/sample) +/-SEM | Mean log10 decrease from day 0 |
|---|---|---|
| 0 hours | 5542 +/- 494 | n/a |
| 3 hours | 3193 +/- 482 | 0.24 |
| 6 hours | 542 +/- 96 | 1.0 |
| 24 hours | <25 | <2.3 |
9.2.2.6 Composite drinks cartons
The results for composite drinks cartons incubated without mucin for up to 7 days with SARS-CoV-2 can be seen in Table 104, Table 105, Table 106, Table 107, Table 108, Table 109, and Table 110. For all tests, the means; SEM of the mean and log10 reduction of PFU over time are shown. The mean log10 decrease (shown to 2 significant figures) compares the PFU recovered at each time point to the PFU recovered at day 0, not to the initial inoculum. All tests were performed in triplicate. The limit of detection for this assay is 25 PFU/sample. Therefore, 2.5 is the maximum log10-reduction detectable with this assay design, equivalent to 25 PFU or fewer infectious virus remaining. Log10 decrease was calculated to 2 s.f.
Table 104 Test CC1: Composite drinks carton, 21˚C, 80% RH
| Time | Mean number of plaques (PFU/sample) +/-SEM | Mean log10 decrease from day 0 |
|---|---|---|
| Day 0 | 7333 +/- 882 | n/a |
| Day 1 | <25 | >2.5 |
| Day 2 | <25 | >2.5 |
| Day 3 | <25 | <2.5 |
| Day 4 | <25 | >2.5 |
Table 105 Test CC2 Composite drinks carton 21c 53% RH
| Time | Mean number of plaques (PFU/sample) +/-SEM | Mean log10 decrease from day 0 |
|---|---|---|
| Day 0 | 7333 +/- 882 | n/a |
| Day 1 | <25 | >2.5 |
| Day 2 | <25 | >2.5 |
| Day 3 | <25 | <2.5 |
| Day 4 | <25 | >2.5 |
| Day 5 | <25 | >2.5 |
| Day 6 | <25 | >2.5 |
| Day 7 | <25 | >2.5 |
Table 106 Test CC3 Composite drinks carton 21c 20% RH
| Time | Mean number of plaques (PFU/sample) +/-SEM | Mean log10 decrease from day 0 |
|---|---|---|
| Day 0 | 7333 +/- 882 | n/a |
| Day 1 | <25 | >2.5 |
| Day 2 | <25 | >2.5 |
| Day 3 | <25 | <2.5 |
| Day 4 | <25 | >2.5 |
Table 107 Test CC4 Composite drinks carton 6c 80% RH
| Time | Mean number of plaques (PFU/sample) +/-SEM | Mean log10 decrease from day 0 |
|---|---|---|
| Day 0 | 7333 +/- 882 | n/a |
| Day 1 | 175 +/- 78 | 1.6 |
| Day 2 | 121 +/- 67 | 1.8 |
| Day 3 | 133 +/- 58 | 1.7 |
| Day 4 | <25 | >2.5 |
Table 108 Test CC5 Composite drinks carton 6c 53% RH
| Time | Mean number of plaques (PFU/sample) +/-SEM | Mean log10 decrease from day 0 |
|---|---|---|
| Day 0 | 7333 +/- 882 | n/a |
| Day 1 | 1413 +/- 365 | 0.72 |
| Day 2 | 727 +/- 280 | 1.0 |
| Day 3 | <25 | >2.5 |
| Day 4 | <25 | >2.5 |
| Day 5 | <25 | >2.5 |
| Day 6 | <25 | >2.5 |
| Day 7 | <25 | >2.5 |
Table 109 Test CC6 Composite drinks carton 6c 20% RH
| Time | Mean number of plaques (PFU/sample) +/-SEM | Mean log10 decrease from day 0 |
|---|---|---|
| Day 0 | 7333 +/- 882 | n/a |
| Day 1 | <25 | >2.5 |
| Day 2 | <25 | >2.5 |
| Day 3 | <25 | >2.5 |
| Day 4 | <25 | >2.5 |
9.2.2.7 Composite drinks cartons with mucin
The results for composite drinks cartons incubated with added mucin for up to 7 days with SARS-CoV-2 can be seen in Table 110, Table 111, Table 112, Table 113, Table 114 and Table 115. For all tests, the means; SEM of the mean and log10 reduction of PFU over time are shown. The mean log10 decrease (shown to 2 significant figures) compares the PFU recovered at each time point to the PFU recovered at day 0, not to the initial inoculum. All tests were performed in triplicate. The limit of detection for this assay is 25 PFU/sample. Therefore, 2.4 is the maximum log10-reduction detectable with this assay design, equivalent to 25 PFU or fewer infectious virus remaining. Log10 decrease calculated to 2 s.f.
Table 110 Test CC1M: Composite drinks carton, mucin, 21˚C, 80% RH
| Time | Mean number of plaques (PFU/sample) +/-SEM | Mean log10 decrease from day 0 |
|---|---|---|
| Day 0 | 6000 +/- 764 | n/a |
| Day 1 | <25 | >2.4 |
| Day 2 | <25 | >2.4 |
| Day 3 | <25 | >2.4 |
| Day 4 | <25 | >2.4 |
Table 111 Test CC2M: Composite drinks carton, mucin, 21˚C, 53% RH
| Time | Mean number of plaques (PFU/sample) +/-SEM | Mean log10 decrease from day 0 |
|---|---|---|
| Day 0 | 6000 +/- 764 | n/a |
| Day 1 | <25 | >2.4 |
| Day 2 | <25 | >2.4 |
| Day 3 | <25 | >2.4 |
| Day 4 | <25 | >2.4 |
| Day 5 | <25 | >2.4 |
| Day 6 | <25 | >2.4 |
| Day 7 | <25 | >2.4 |
Table 112 Test CC3M: Composite drinks carton, mucin, 21˚C, 20% RH
| Time | Mean number of plaques (PFU/sample) +/-SEM | Mean log10 decrease from day 0 |
|---|---|---|
| Day 0 | 6000 +/- 764 | n/a |
| Day 1 | <25 | >2.4 |
| Day 2 | <25 | >2.4 |
| Day 3 | <25 | >2.4 |
| Day 4 | <25 | >2.4 |
Table 113 Test CC4M: Composite drinks carton, mucin, 6˚C, 80% RH
| Time | Mean number of plaques (PFU/sample) +/-SEM | Mean log10 decrease from day 0 |
|---|---|---|
| Day 0 | 6000 +/- 764 | n/a |
| Day 1 | 175 +/- 67 | 1.5 |
| Day 2 | <25 | >2.4 |
| Day 3 | <25 | >2.4 |
| Day 4 | <25 | >2.4 |
Table 114 Test CC5M: Composite drinks carton, mucin, 6˚C, 53% RH
| Time | Mean number of plaques (PFU/sample) +/-SEM | Mean log10 decrease from day 0 |
|---|---|---|
| Day 0 | 6000 +/- 764 | n/a |
| Day 1 | 1777 +/- 220 | 0.53 |
| Day 2 | 750 +/- 75 | 0.90 |
| Day 3 | <25 | >2.4 |
| Day 4 | <25 | >2.4 |
| Day 5 | <25 | >2.4 |
| Day 6 | <25 | >2.4 |
| Day 7 | <25 | >2.4 |
Table 115 Test CC6M: Composite drinks carton, mucin, 6˚C, 20% RH
| Time | Mean number of plaques (PFU/sample) +/-SEM | Mean log10 decrease from day 0 |
|---|---|---|
| Day 0 | 6000 +/- 764 | n/a |
| Day 1 | <25 | >2.4 |
| Day 2 | <25 | >2.4 |
| Day 3 | <25 | >2.4 |
| Day 4 | <25 | >2.4 |