Research project
Does proactively asking about allergens before ordering by Food Business Operator staff improve customer outcomes?
A randomised controlled trial conducted in partnership with a national Food Business Organisation.
Roughly 5% of the UK population report having a food hypersensitivity, which includes both food intolerances and allergic reactions (Turner et al., 2021). People may be more likely to have allergic reactions when eating out of home: the majority of deaths due to food allergens between 1992 and 2012 occurred as a result of food being bought from food businesses (Turner et al., 2015). However, research suggests that customers with allergies may be reluctant to actively seek information about allergens (Barnett et al., 2017; Barnett, Vasileiou and Lucas, 2020). Therefore, the Food Standard Agency (FSA) commissioned the Behavioural Practice to run a field trial, partnering with a national Food Business Organisation (FBO), to test whether staff proactively asking customers about allergens would increase customers’ confidence that they could identify ingredients that they have allergies or intolerances to, their comfort in asking about ingredients, and their perceptions of food safety regarding food and drink sold by the FBO.
We worked with 18 branches of a national FBO. Between 28th March 2022 and 30th June 2022, staff in half of those branches (the ‘intervention’ group) were told to ask “Do you have any food allergies or intolerances?” before customers placed their order. Staff in the other half of the branches were not instructed to say this. They carried on with usual practice, to serve as a ‘control’ group, in order to be able to compare whether the proactive request made a difference. Customers who entered the FBO and who placed a food order at the till were asked to complete a survey about their experience, which measured their confidence in identifying ingredients, comfort in asking about ingredients, and perceptions of food safety in the FBO. We also asked them if an employee had asked whether they had a food allergy or intolerance before they made their purchase. We pre-specified that we would measure the ‘efficacy’ of the intervention when it was correctly delivered. In other words, that we would compare the responses of customers in the intervention group who reported being asked about allergies and intolerances with customers in the control group who said they were not asked.
We found that customers in the intervention group who were proactively asked about allergens were more confident that they could identify ingredients, with almost 83.2% ‘very’ or ‘somewhat’ confident they could identify ingredients, compared to 77.2% who were not asked in the control group. (These figures relate to all customers who answered the survey and who indicated that they received the expected intervention, regardless of whether they indicated they had a food hypersensitivity or not). Those in the intervention group who were proactively asked about allergens also reported they would be more comfortable asking about ingredients, with a majority (69.5%) ‘very’ comfortable, while in the control group only half of those who were not asked (50.8%) were ‘very’ comfortable. However, there was no detectable difference in their perceptions of food safety regarding food and drink sold by the FBO. The intervention also increased customer satisfaction amongst those who received it, on three different customer satisfaction metrics.
This suggests that, if FBO staff proactively ask customers about allergens before ordering, this may help them identify ingredients in order to prevent them from suffering adverse reactions to the food. If it also improves the customer experience, then it can benefit businesses too, a win-win situation.
Background
Roughly 5% of the UK population report having a food hypersensitivity, which includes both food intolerances and allergic reactions (Turner et al., 2021), and 60% of those (3% of the UK population) have immunoglobulin E (IgE) mediated food allergy (Food Standards Agency, 2020b). People may be more likely to have allergic reactions when eating out of home: the majority of deaths due to food allergens between 1992 and 2012 occurred as a result of food being bought from food businesses (Turner et al., 2015). However, qualitative research suggests that customers with allergies may be reluctant to actively seek information about allergens (Barnett et al., 2017; Barnett, Vasileiou and Lucas, 2020). Confidence may be lower in younger age groups in particular: a survey of those aged 16-24 in the UK found 54% did not respond they were ‘very’ or ‘quite’ confident when asking for allergen information (Kovacs, 2018). Following on from a successful feasibility study, commissioned by the Food Standard Agency (FSA) and run by the Behavioural Practice, from 3rd-20th March 2020, the FSA commissioned the Behavioural Practice to run a full field trial, to test whether FBO staff proactively asking customers about allergens would make customers feel more confident that they could identify ingredients, feel more comfortable to ask about ingredients, and increase consumers’ perceptions of food safety regarding food and drink sold at the given chain.
Methods
We ran a clustered randomised trial with a matched pairs design, where the clusters were branches of a national FBO. Participants were customers who entered the FBO between 28th March 2022 and 30th June 2022, who placed a food order at the till, and who chose to complete a survey about their experience (all customers were given a leaflet with a QR code that would take them to the survey). Half of the branches implemented the intervention, where they asked customers whether they had any allergens on ordering, and half of the branches were a control who were not instructed to ask and carried on with usual practice. Staff in branches in the intervention arm were told to ask, “Do you have any food allergies or intolerances?” before customers placed their order. If a customer replied in the affirmative, the FBO’s standard protocol in handling these cases were followed, which involved directing customers to scan a QR code to access allergen information.
The primary outcome measures were three questions on the survey, which were shown in a random order using 5-point Likert scales: confidence in ability to identify ingredients if need be (1 = “Not at all confident” to 5 = “Very confident”), comfort asking about ingredients (1 = “Not at all comfortable” to 5 = “Very comfortable”), and perception of food safety in the FBO (1 = “Very unconcerned” to 5 = “Very concerned”). Secondary outcomes were three questions on common customer satisfaction metrics (also shown in a random order with responses on 5-point Likert scales): customer satisfaction, customer trust in the business, and whether the customer would recommend the business to a friend or family member. We also asked whether customers declared an allergy and/or food intolerance on their visit. Fidelity had been poor in the feasibility study, so we pre-registered a per-protocol analysis in order to investigate the effect of the intervention, when it was delivered as intended. We measured fidelity using a question on the survey, which asked if an employee had asked whether they have a food allergy or intolerance.
Staff in the treatment arm knew that they were delivering an intervention, staff in the control arm knew that they were a business-as-usual arm that was being used to compare the effectiveness of changes that were being implemented in other branches. Customers did not know about the trial arms. Randomization was done using pair matching on footfall, location (London/ non-London) and whether or not the branch had seating, treating each pair as a strata for stratified randomisation.
Results
We randomised 18 branches, 9 in each arm. We received n = 936 survey completions across the two trial conditions (n = 395 in the treatment arm, and n = 541 in the control arm), which were all analysed. In addition, there were a number of incomplete surveys, which we did not analyse, (n = 427 in the treatment arm, n = 289 in the control arm), the majority of which (635 of 716) dropped out on the initial information and consent pages.
There were n = 198 males who completed the survey and received the allocated intervention and the modal age group of participants was 16-25 (n = 239 or 45.1%). There were n = 89 (16.8%) who reported having an allergy or food intolerance (n = 30 in the treatment arm, n = 59 in the control arm); we were not powered for sub-group analysis.
Customers in the treatment arm who received the intervention were more confident in their ability to identify ingredients if need be than those in the control who did not receive the intervention. Among those in the treatment group, almost 83.2% were either ‘very’ or ‘somewhat’ confident they could identify ingredients, compared to 77.2% in the control group. Controlling for the influence of demographic covariates, those in the treatment group were, on average, 0.26 points more confident than those in the control group (β = 0.26, p < 0.01).
Those in the intervention arm expressed a greater level of comfort in asking a member of staff for information about product ingredients. For those in the treatment group, a majority (69.5%) would be ‘very’ comfortable, while in the control group, only half (50.8%) would be ‘very’ comfortable. Controlling for the influence of demographic covariates, those in the treatment group were, on average, 0.36 points more comfortable than those in the control group (β = 0.36, p < 0.001).
However, the intervention did not have an effect on customers’ level of concern regarding the safety of the food that is sold in the FBO. Overall, a majority (65.3%) were ‘very’ or ‘fairly’ unconcerned about the quality of food that is sold in the FBO, compared to 68.1% in the control. The intervention did not have a significant impact on level of concern in the primary model (β = -0.02, p = 0.920), a result which was supported by the ordinal prohbit model in the sensitivity analysis (OR = 0.90, p = 0.351).
Fidelity to the intervention was poor. In the treatment arm, 39.0% of participants (154 of 395) said they were asked whether they had a food allergy or intolerance (which was higher than the 30.0% who were asked as a part of business as usual in the control arm). Fidelity in the treatment arm varied between branches, ranging from 20.8% to 75.9%. None of the primary outcomes were effective in an intention to treat analysis.
There were improvements on all the secondary outcomes: customer satisfaction, customer trust in the business, and whether the customer would recommend the business to a friend or family member. Customers were also more likely to report having declared an allergy or intolerance in the treatment arm (OR = 8.58, p < 0.001).
Conclusion
Staff proactively asking customers about food allergies and intolerances increased customers’ confidence in identifying ingredients and made them feel more comfortable to ask about ingredients. It also improved a variety of metrics relating to customer satisfaction and increased the number of self-reported declarations of an allergy or intolerance. However, fidelity to the intervention was low, so while the study found it to be efficacious, future work should investigate how it can be improved in order to make it more effective.
The study was preregistered on Open Science Framework before trial launch and any data collection. The study was funded by the Food Standards Agency.
Roughly 5% of the UK population report having a food hypersensitivity, which includes both food intolerances (difficulty digesting certain foods and having an unpleasant physical reaction to them) and allergic reactions (when the body’s immune system reacts unusually to specific foods) (Turner et al., 2021), and 60% of those (3% of the UK population) have IgE-mediated food allergy (Food Standards Agency, 2020b). Such allergies, caused by an allergen-specific immunoglobulin E (IgE) antibody, can lead to rapid and potentially life-threatening allergic reactions. Hospital admissions for food anaphylaxis are increasing: from 1998 to 2018 they increased from 1.23 to 4.04 per 100,000 population per year, an annual increase of 5.7% (Baseggio Conrado et al., 2021). Allergies tend to have the most severe symptoms, whereas intolerances are not life-threatening, but individuals with either need to know the ingredients in their food in order to avoid adverse reactions.
An analysis of deaths due to food allergens between 1992 and 2012 found that the majority of incidences (59%) occurred as a result of food being bought from food businesses, with about a quarter of those originating from take-aways (Turner et al., 2015). A particular hazard of eating out of home is that even if consumers are aware of their own food allergies, they may not know all the ingredients of their purchases. In 2021, after the death of a minor who had an allergic reaction to a baguette that did not require allergen labelling, the UK Government introduced ‘Natasha’s Law’, which requires any business producing pre-packaged for direct sale food to label it with a full ingredients list, with allergenic ingredients emphasised within the list. This supplements previous legislation from 2014, which required Food Business Operators (FBOs)—restaurants, cafes, takeaways and businesses that produce, manufacture or pre-pack food—to inform customers if their food and drink products contain any of 14 key allergens, either explicitly in writing or with a clear instruction about how to obtain the information (e.g. asking staff) (Food Standards Agency, 2022).
FBOs selling non-pre-packaged food in the UK are not obliged to provide full written information. A report into provision of food allergen information, prepared in the lead up to the 2014 legislation, found that 20% of businesses selling non-pre-packaged food only provided allergen information orally and 7% provided no information at all, and that training of staff was variable (Smeaton and IFF Research, 2013). There was a consensus amongst businesses that training was needed for staff about how to impart allergen information to customers and clients (Smeaton and IFF Research, 2013). That study also reported that the most common reason for not giving information about all the 14 food allergens was ‘no customer demand’. Similarly, a study involving staff from 28 takeaway businesses found unanimous agreement that it is the customers’ responsibility to inform them of food allergies (Soon, 2018).
However, consumers with allergies and hypersensitivities may be reluctant to actively seek information about ingredients. Two surveys of adults with food hypersensitivities conducted in the UK found that many feel that asking questions about the food may lead to them being perceived as fussy, and therefore risks them being embarrassed, and that asking might increase the risk of misinformation and mistakes (Barnett et al., 2017; Knibb, Hawkins and Rigby, 2021). A survey conducted in the UK of adults with food hypersensitivities found that 12% (of the 885 respondents) said they would never ask staff in a restaurant or take-away for allergen information before ordering and 14% would ask only about half the time or occasionally (Knibb, Hawkins and Rigby, 2021). The respondents were asked how comfortable they felt about asking for allergen information and 39% were not comfortable (did not respond either ‘very’ or ‘fairly’ comfortable); 36% were not confident (did not respond that they were ‘very’ or ‘fairly’ confident) that the information provided verbally by staff when eating out allows them to identify foods that cause a reaction. Confidence may be lower in younger age groups: a separate survey of those aged 16-24 in the UK found 54% did not respond they were ‘very’ or ‘quite’ confident when asking for allergen information (Kovacs, 2018). Further, how comfortable participants were in asking for information from staff when eating out, and how confident they were in the verbal information provided when eating out, were negatively correlated with impairment to quality of life (both with medium effect sizes); feeling more comfortable in asking staff for information about food when eating out predicted better quality of life (Knibb, Hawkins and Rigby, 2021) in a regression analysis (standardised beta = 0.21).
A survey conducted in the UK in 2018 showed that barriers to actively seeking information could be addressed if staff were more proactive in communicating allergen information (see causal pathway in Figure 1 for a visual representation) (Kovacs, 2018). When asked which actions would help them manage their condition, 72% of 16-24 year olds said that it would help if waiting staff could pro-actively ask if anyone on the table has a food allergy or intolerance when taking the reservation or the food order (Kovacs, 2018). Further, if staff take the lead, that could be good for businesses if it increases the amount of business they get from people with hypersensitivities. The majority of respondents in a survey of 16-24 year olds with food hypersensitivity reported having avoided eating out in the last six months due to their hypersensitivity (63% of those with a food allergy and 51% of those with a food intolerance) (Kovacs, 2018). In addition, customers with food allergies and intolerances say that the best eating out experiences involve knowledgeable and attentive staff (Barnett et al., 2017). This is not surprising, since knowledgeable staff should indicate a safer experience (Young et al., 2019).
Figure 1: Casual pathway: how staff proactively asking about allergens can improve outcomes

3.1 Feasibility Trial
To assess whether it would be possible to improve confidence around allergens reporting, the FSA commissioned a feasibility study, designed and run by the Behavioural Practice, from 3rd to 20th March 2020. Staff in branches of a multinational FBO were trained to ask customers “Do you suffer from any food allergies or intolerances?” at point of sale and to follow up with relevant information on allergens for customers who answered “Yes” (McPhedran et al., 2021). This was a matched pairs cluster quasi-randomised trial, with five pairs of branches at one large FBO selected for participation. After service, customers in all ten branches (five intervention, five control) were asked to complete an in-store survey on a tablet. They were asked about their perception of the safety of the food sold in the FBO, their trust in the FBO, their confidence to ask about allergens, their satisfaction with the visit, and their allergen status. The trial was scheduled to run for two months but had to be curtailed due to the pandemic. UK government directives resulted in the temporary closure of the FBO.
The aim of the feasibility study was to investigate the practicability of a fully powered trial. Specifically: (1) the willingness of FBOs to participate, (2) the willingness of customers to participate, (3) consistency of staff delivery of the intervention, (4) suitability of the survey as a method of measuring outcomes, and (5) appropriateness of the analytical approach.
Results suggested that a full trial would be feasible, with the main difficulty being FBO recruitment, which was adversely affected by the pandemic. The survey response rate was about 0.3%, which was sufficient to run the analysis (and informed design and power calculation considerations for this trial) but was lower than expected—possibly due to people not wanting to handle the tablets during the pandemic. The intervention was relatively consistently delivered in the treatment group, with between 65.4% and 100% of treatment-branch customers who completed the survey saying they had been asked. However, many customers in the control arm were asked about allergens (30.8%-65.6% across the five branches). This suggested the need for increased fidelity checks on both control and intervention groups, and the desirability of a sensitivity analysis. It was hypothesized that staff in the control arm might have been encouraged to ask about allergens due to the mode of delivery of the survey, via a tablet in-store, which may have encouraged staff to take the survey before the trial began (as well as discouraging customers from responding, since people were wary about touching surfaces due to Covid-19.) Therefore, we also changed the method of delivery of the survey to a QR code that was given to customers on leaflets and displayed on table toppers in-store.
In the feasibility trial, the survey measures were sensitive enough to run a multi-level analysis in order to get an estimate of the intra-class correlation coefficient to inform the power analysis for this trial. The feasibility study was not powered to investigate performance on outcome measures; however, the numerical effects of being asked about allergens at point of sale were in the direction that was expected. Safety concerns about the food was numerically lower amongst those who were asked about allergens (M = 2.31 vs M = 2.49), trust numerically higher (M = 4.38 vs M = 4.36) and confidence about asking staff for information about ingredients numerically higher (M = 4.68 vs M = 4.57). (All measured on 5-point Likert scales.) It was not possible to collect information on allergens declarations, which we had expected to get from till data, because of data sharing issues.
At the same time as the feasibility trial was taking place, the FSA commissioned a UK-wide public consultation, which involved a range of stakeholders (food businesses, patient groups, health care and academia, local authorities and the FSA) to identify unanswered research questions (Turner et al., 2021). That consultation concluded that “improving traceability of allergens in the food supply chain” was one of five priority themes. Under that theme, the priority research questions were: How should information be communicated (through the food supply chain) to consumers with Food Hyper-Sensitivities, to (a) improve consumer confidence in terms of possible allergen content?, and (b) reduce the incidence of unintended allergen exposure? The present research aims to address these questions.
This fully powered randomized controlled trial builds on the feasibility study to investigate the efficacy of being proactively asked about allergies or intolerances by food business staff. This study measured the impact of this intervention on perceptions of food safety, confidence in identifying ingredients that may cause allergies or intolerances, confidence in asking about allergens, and likelihood of declaring allergies or intolerances.
This trial had the following three primary objectives:
- To investigate whether proactively asking customers if they have any food allergies or intolerances at point of purchase makes them feel more confident that they could identify ingredients (for example if they have allergies or intolerances to them).
- To investigate whether proactively asking customers if they have any food allergies or intolerances at point of purchase makes them feel more comfortable to ask about ingredients.
- To investigate whether proactively asking customers if they have any food allergies or intolerances at point of purchase positively impacts customers’ perceptions of food safety regarding food and drink sold at the given chain.
As a secondary objective, we assessed the impact of the intervention on common customer satisfaction metrics: customer satisfaction, customer trust in the business, and whether the customer would recommend the business to a friend or family member.
A final exploratory objective, which investigated but for which we are not fully powered, was to investigate whether proactively asking customers if they have any food allergies/intolerances at point of purchase will increase the number of customers declaring allergies and/or food intolerances.
5.1 Trial Design
This trial took the form of a matched pairs cluster randomised trial, where the clusters were 18 branches of a national FBO. Half of the branches implemented the intervention, where they asked customers whether they had any food allergies or intolerances on ordering, and half of the branches were a control who were not instructed to say this (and carried on with usual practice).
5.2 Participants
To ensure the relevance and feasibility of the intervention, we recruited an FBO that sells food that is not pre-packaged/ that is packaged after ordering, and which does not use self-service machines. The trial was implemented in 18 outlets, 9 in the intervention arm and 9 in the control. There were 9 outlets in London (5 in control arm and 4 in intervention arm) and 9 outside London (4 in control arm and 5 in intervention arm); two outlets were kiosks which did not have seating.
Participants were customers who entered the FBO between 28th March 2022 and 30th June 2022 (inclusive), who placed a food order at the till, and who chose to complete a survey about their experience.
5.3 Intervention
5.3.1 Intervention and procedure
Staff in branches in the intervention arm were instructed by branch managers to ask “Do you have any food allergies or intolerances?” before customers placed their order. If a customer replied in the affirmative, the FBO’s standard protocol in handling these cases were followed, which involved directing customers to scan a QR code to access allergen information.
In the control branches, all branches continued with their standard practice, which was not to proactively ask, but to direct any customer who asked staff about allergens to scan the QR code for information.
In both the treatment and control groups, customers had the option of scanning a QR code to participate in a survey (see Appendix 2 for the full survey). If they ordered takeaway, then a leaflet with the QR code was placed in their takeaway bag. If they were dining in, then the leaflet was placed on the tray with their order. Restaurants with seating also displayed table toppers with the QR code directing customers to the survey. The staff at branches were asked to direct the customer to the QR code, and to invite them to complete the survey.The materials leaflet and table toppers advertised that participants completing the survey could be entered into a prize draw for 25 Love2Shop vouchers each worth £50.
The prize draw was conducted via an automated computer process through which 25 email addresses were randomly drawn from response data after deleting duplicated email addresses. After the prize draw, the randomly selected winners were sent an email notifying them that they had won and including a unique redeem code.
All customers were able to withdraw from the survey at any time before completion of the survey, either by not starting or by not completing the survey. Once the survey data was submitted the data collected was stored anonymously, meaning it was not possible to for participants to withdraw data after submission.
5.3.2 Implementation Checks
To confirm fidelity to our intervention and business compliance, fieldworkers were used to serve as mystery shoppers. Each participating store was visited by a field worker in Week 1 and then again in Week 4. The fieldworkers recorded whether they were asked about allergens and intolerances or not (they did not know which arms the branches the visited were in). They also recorded whether they received the leaflet and the proportion of tables that had the table topper.
Throughout the trial fieldwork, and in addition to the mystery shopping visits, analysts also monitored survey responses weekly – particularly Q7 (“Thinking back to when you were served, did the [INSERT CHAIN NAME] employee ask you whether you have a food allergy or intolerance before you made your purchase?”) – to establish whether the intervention was being delivered in treatment branches and not delivered in control branches. In response to the first visit and the low compliance observed (see results section) a meeting with branch managers was scheduled and they were contacted by email to remind them of the trial requirements. Across the trial, branch managers were met in Week 1 and Week 11 to reinforce intervention delivery processes. Additionally, reminder emails were sent to all the branches during weeks 1, 6, and 12, and a branch specific email to branches reporting low response rates during week 7.
5.4 Outcomes
The primary outcome measures were collected via questions presented in random order in the survey and rated on 5-point Likert scales. They were:
1. How confident are you that, if needed, you could find out the ingredients in any food or drink products at [INSERT CHAIN NAME]? Ranging from 1 “Not confident at all” to 5 “Very confident”
2. How comfortable would you feel in asking a member of staff at [INSERT CHAIN NAME] for information about the ingredients in the foods or beverages they are selling? Ranging from 1 “Not comfortable at all” to 5 “Very comfortable”
3. How concerned or unconcerned are you about the safety of the food that is sold in [INSERT CHAIN NAME]? Ranging from 1 “Very unconcerned” to 5 “Very concerned''
These were based on the questions from the feasibility study, which were taken from the Public Attitudes Tracker (Food Standards Agency, 2020a), FSA’s flagship survey, and modified following the suggestions of a peer reviewer, so that they more directly targeted the issues that the intervention was designed to address.
The secondary outcome measures were:
4. Thinking back to when you were served, did you declare an allergy or intolerance? Yes or No
5. How satisfied are you with your overall experience at [INSERT CHAIN NAME] today? 5-point Likert scale ranging from 1 “Very unsatisfied” to 5 “Very satisfied”
6. How much do you trust or distrust [INSERT CHAIN NAME] as a business responsible for the sale of food and beverages? 5-point Likert scale ranging from 1 “I distrust it a lot” to 5 “I trust it a lot”
7. How likely are you to recommend [INSERT CHAIN NAME] to your friends or family? 5-point Likert scale ranging from 1 “Very unlikely” to 5 “Very likely”
We asked the following question as a part of our fidelity check and sensitivity analysis:
8. Whether the customer was asked about food hypersensitivities: ‘Thinking back to when you were served, did the [INSERT CHAIN NAME] employee ask you whether you have a food allergy or intolerance before you made your purchase?’ (Y/N)
5.5 Sample size
Prior to the trial, power calculations were conducted to illustrate the relationship between the sample size, effect size, significance level and statistical power.
Our power calculations suggested we should have 30 premises (15 in the trial arm and 15 in the control), with 125 survey respondents per branch, in order to have an 80% chance of detecting a similar-sized effect to that we found in the feasibility trial on one of our primary outcome measures (specifically, the effect of the intervention on confidence about asking staff for information on ingredients, which was small, Cohen’s d = 0.2). These calculations assumed an intraclass correlation coefficient (ICC) of 𝜌 = 0.03, a conservative assumption given the results of the feasibility trial (where the ICCs were ~𝜌 = 0.01).
5.6 Randomisation
We used pair matching to maximise efficiency, and therefore the statistical power of the trial, by reducing the variance between clusters (Rutterford, Copas and Eldridge, 2015). We used pair matching on the following criteria:
- weekly customer footfall
- location (London/ non-London)
- two kiosks with no seating (one in London and one outside London) were matched with each other
We did not match on Food Hygiene Rating Scheme (FHRS) score because most scored 5, the highest possible value (footnote 1). We did not have access to branch customer satisfaction scores.
In each matched pair, one branch was randomly allocated to the treatment group, while the other was allocated to the control group. This process was executed via stratified random assignment (where each FBO type is a strata), conducted using R’s randomizr package (Coppock, 2019).
5.7 Blinding
Management at the FBOs were aware of their participation in a trial, and the fact that some branches received the intervention while others did not. The researchers and data handlers were not blinded to condition and FBO type.
Staff at the branches were aware of their participation in a study, as we needed them to place the QR codes leading to the customer survey in visible locations. However, staff in control branches were not told the purpose of the trial, in an effort to reduce contamination bias. Store managers were told that other stores had been asked to make changes, in order to improve the customer experience, and that it was important for their stores to continue with business as usual so that we could see if the changes made a difference.
Staff in intervention branches were asked to proactively ask customers whether the customer had any allergies or intolerances, and as such may have been able to deduce the purpose of the study. The managers knew the purpose of the study.
Customers at the branches were not aware of their participation in a study when ordering. They were aware of their participation if they choose to take part in the survey. The purpose of the study was not disclosed at the start of the survey, but participants were debriefed on a final screen after completing the survey.
5.8 Statistical methods
5.8.1 Primary analysis
As Moerbeek (2006) and Raudenbush (1997) recommend, hierarchical models should be used for analysis of cluster randomised trials. In line with this recommendation, we used a series of pre-registered two-level hierarchical linear models in our primary analysis (https://osf.io/973d8/). These models illustrated if there was a treatment effect, controlling for the impacts of individual-level covariates – food hypersensitivity, age and gender – some of which were unbalanced across trial arms due to the implementation of clustered randomisation.
There were several model permutations, as follows:
Models in which our primary outcomes were the dependent variable (Yij); and
Models which our secondary outcomes were the dependent variable (Yij) (footnote 2)
The equation for these models (written in the single equation form outlined by (Hox, Moerbeek and Van de Schoot, 2017)) was:
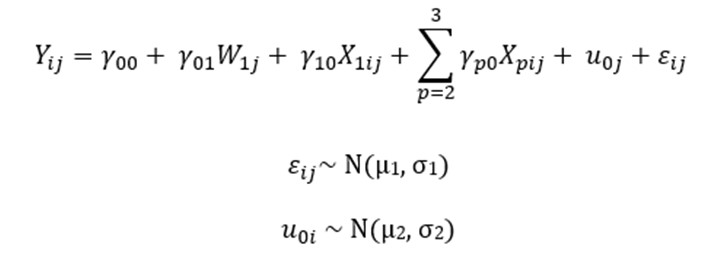
Where:

represents the score on the primary or secondary outcome variables for the ith person in cluster j;

represents the model intercept;

represents the influence of the intervention on the outcome variable(s);

represents the influence of the food hypersensitivity on the outcome variable(s);

represents the influence of gender and age on the outcome variables;

is the random intercept for cluster j

is the individual error term.
Where mixed models resulted in a singular fit – due to trivially small or non-existent intraclass correlation coefficients – linear models without the random intercept for clusters (
) were run. Likelihood ratio tests were used to establish that these fixed effects models had better fit.
Given the issues with intervention fidelity noted in the feasibility trial (McPhedran et al., 2021), per-protocol analysis (Gupta, 2011) – which only included customers for whom the intervention was delivered as intended (that is, they reported being asked by branch staff about food hypersensitivities as measured by Q7 in the survey) (footnote 3) – was of primary interest.
5.8.2 Additional analysis
In addition to the primary analysis, a series of three models were conducted as part of sensitivity analysis. This analysis was conducted to assess the robustness of the findings of the primary models to changes in functional form and/or specification.
The first series of sensitivity models was conducted using the same specification as the primary models, but included an additional interaction term
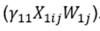
. This interaction term was included to assess whether the intervention had a differential effect for those with food hypersensitivities.
The second series of sensitivity analysis was conducted using ordinal mixed effects models with a probit link function. This series established whether the treatment effects remained if a different type of model was used.
The third and final series of sensitivity analysis was conducted using a ‘intention-to-treat’ approach. In this approach, customers in the treatment branches were considered as the treatment group, irrespective of receipt of the intervention. This was a tertiary model of interest, as it represented low-fidelity delivery in the real world.
5.8.3 Confidence level and the familywise error rate
In this trial, we tested three primary and three secondary hypotheses. In order to maintain the familywise error rate at α = 0.05, we tested each hypothesis using a Bonferroni-corrected value α = 0.05/6 = 0.0083.
-
Branches in Scotland were scored on a different pass/ fail system and all passed. One English branch had a 3-star rating. All other branches had 5-stars.
-
In the case of the declaration of food allergy or intolerance, a mixed logit model will be used.
-
Q7 is: “Thinking back to when you were served, did the [INSERT CHAIN NAME] employee ask you whether you have a food allergy or intolerance before you made your purchase?”
6.1 Recruitment
Fieldwork for the trial was conducted from 28th March to 30th June 2022 in 18 branches of a national FBO. There were n = 936 survey completions across the two trial arms (n = 395 in the treatment arm, and n = 541 in the control arm), with an average completion time of 160.02 seconds (SD = 118.29 seconds). There were n = 348 males who completed the survey and the modal age group of participants was 16-25 (n = 423 or 45.2%). The study analysed age in bands because some participants preferred not to state their age, but did respond to a follow up question about what age group they were in. 16.6% (n = 155) of respondents reported that they had a food hypersensitivity.
In total, n = 530 participants received the correct treatment and were analysed (n = 154 in the treatment arm and n = 376 in the control arm). There were n = 198 males that were analysed. Most participants that were analysed were aged 16-25 (n = 239 or 45.1%). Among these participants, 16.8% (n = 89) reported that they had a food hypersensitivity.
Attrition was higher in the treatment arm (n = 427 incomplete surveys, or 52%) than in the control arm (n = 289 incomplete surveys, or 35%). However, the majority of dropouts – 635 of 716 in total – were on the first and second page, which were an information and consent page respectively. The trial flow can be seen below in Figure 2.
Figure 2: Trial flow (cluster and participant level)

Balance checks were conducted to investigate whether there was significant difference between treatment and control groups for three demographic variables: age, gender and hypersensitivity. There was an imbalance in gender in the per protocol groups, X2(1, n = 511) = 5.95, p = 0.015, with 72 males in the treatment group and 126 in the control group. The results are reported in Table 3.
Table 1: Balance of covariates in treatment and control arms (n, %) by demographic variable
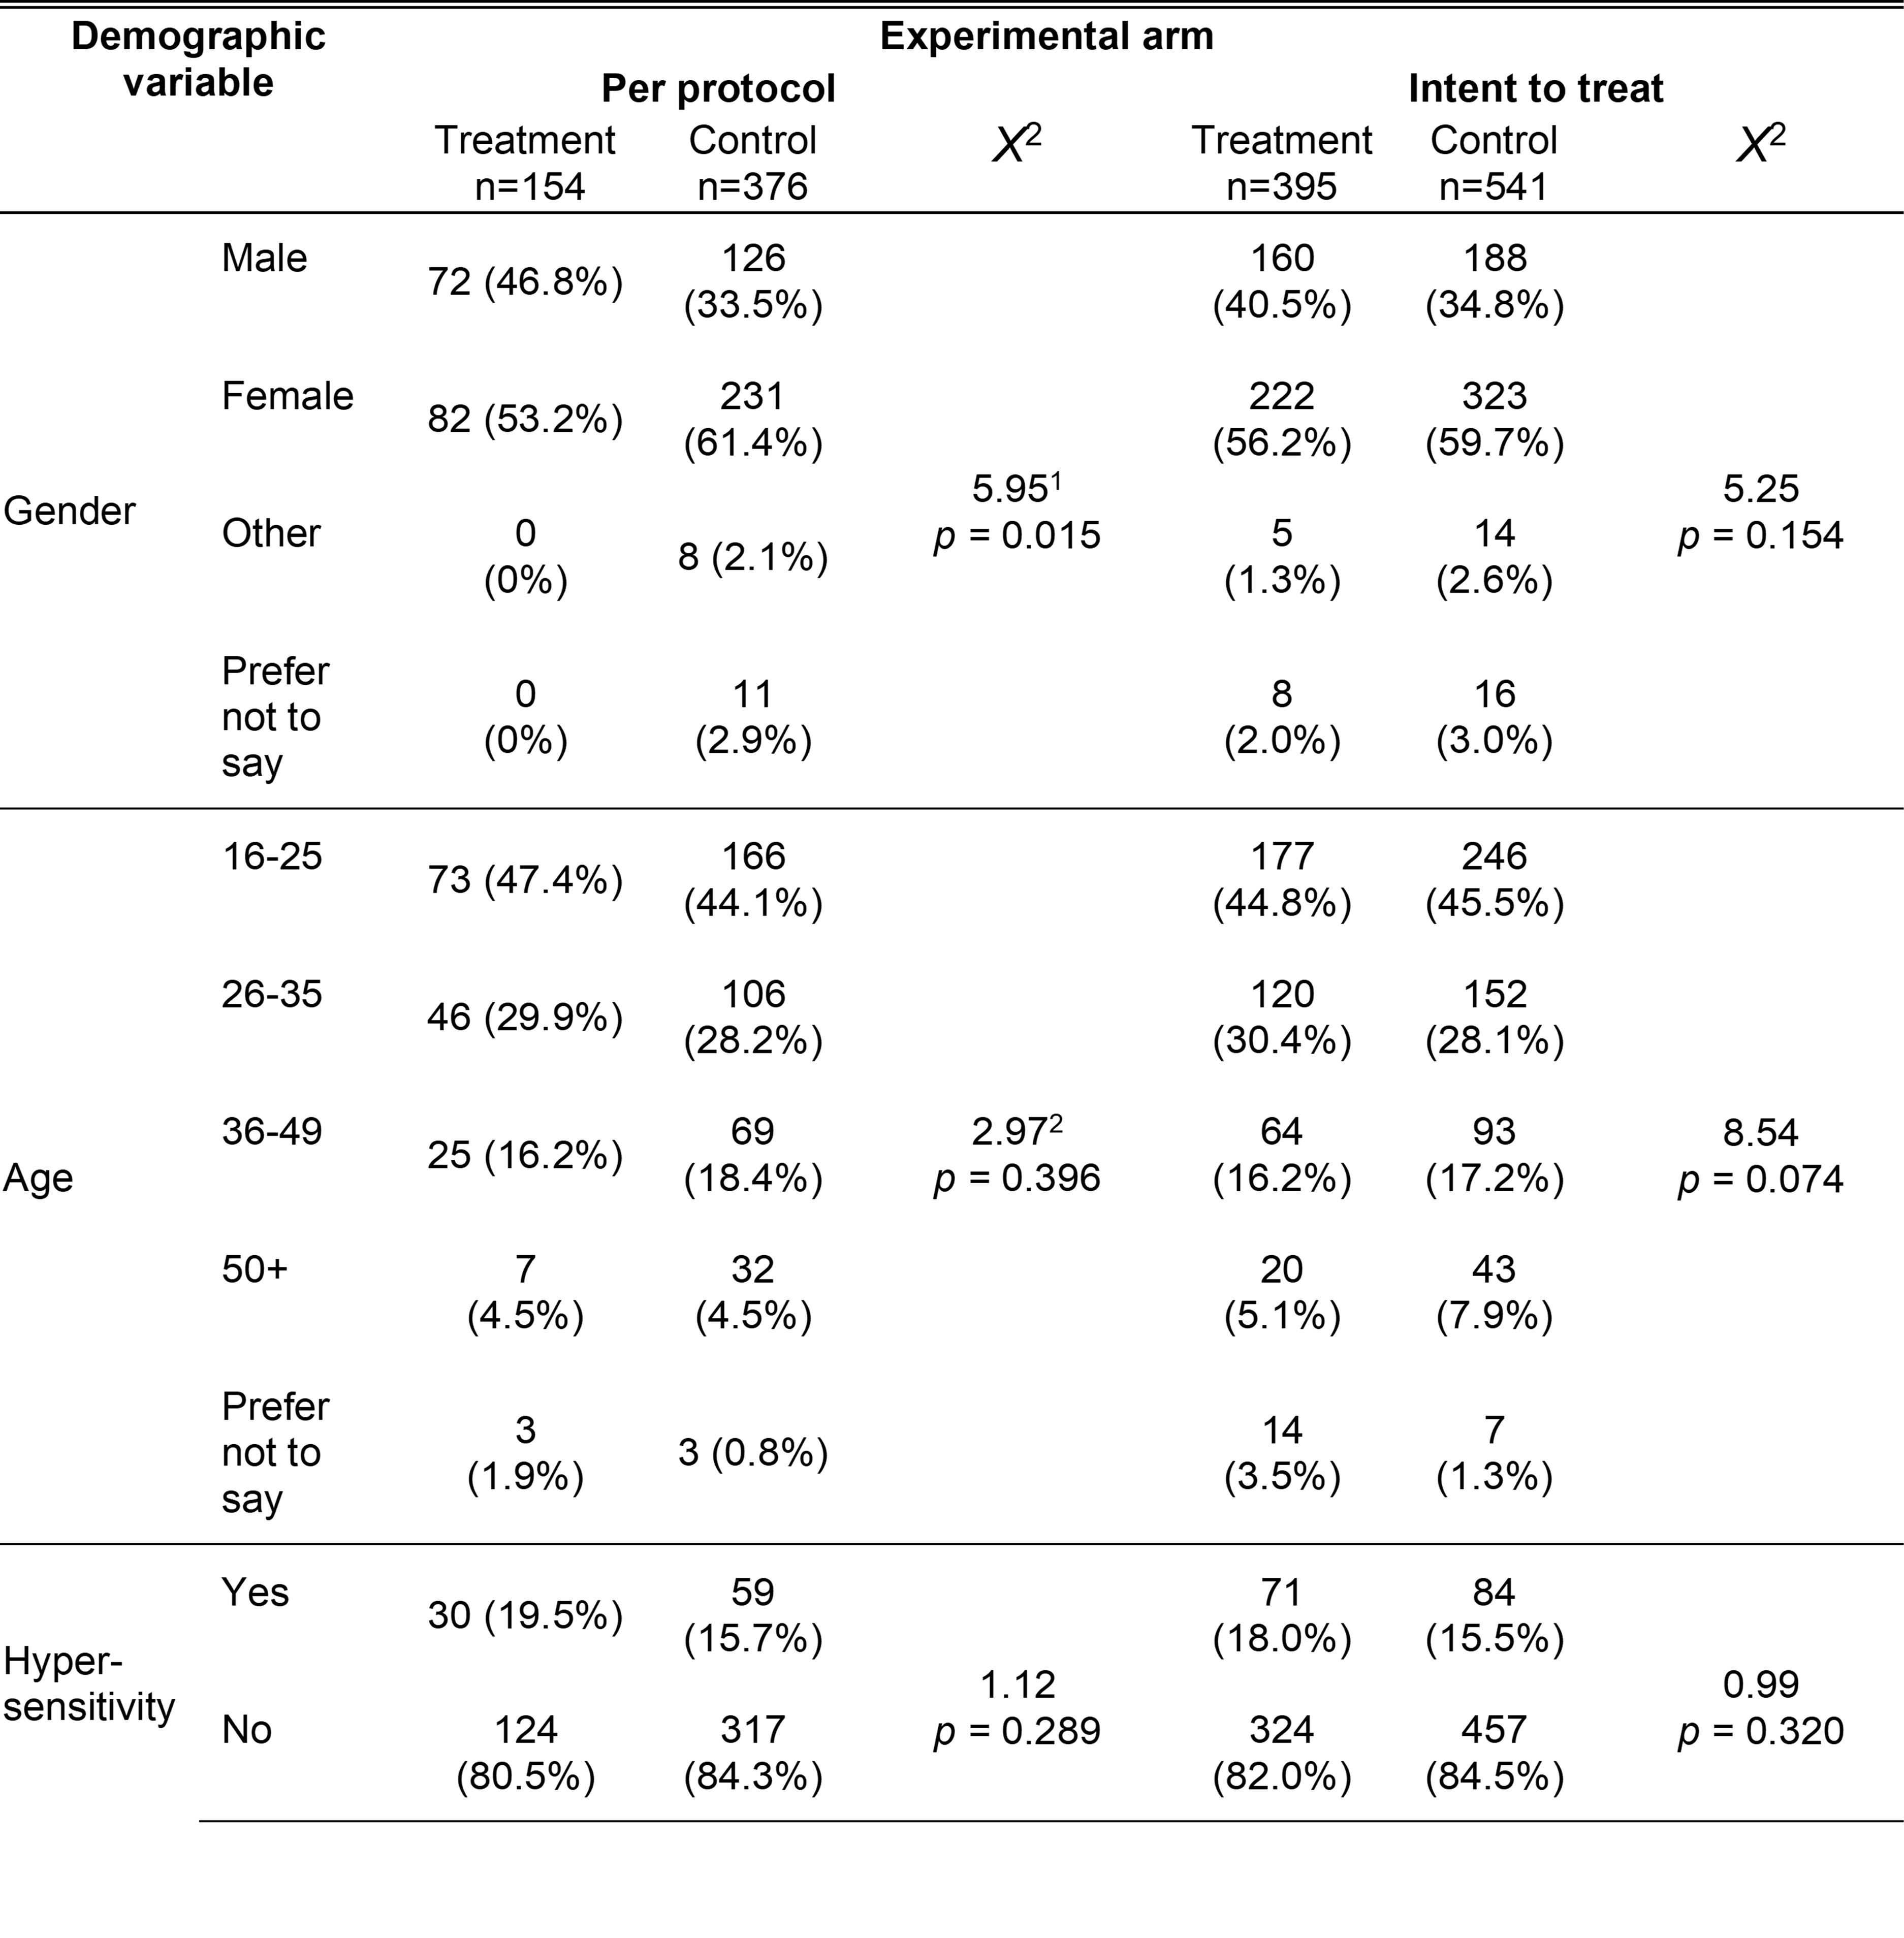
Demographic variable is a common header for the first and second columns. Under demographic variable, gender is a common header for the fourth to seventh rows; age is a common header for the eighth to twelfth rows and hypersensitivity is a common header for the thirteenth and fourteenth rows. Experimental arm is a common header from the third to the eighth columns and is divided into per protocol and intent to treat sub headers with each spanning three columns (treatment descriptives, control descriptives and the Chi-square statistic).
1. 'Other' and 'Prefer not to say' were dropped as cell sizes for the treatment group were too small.
2. 'Prefer not to say' were dropped as cell sizes for treatment and control groups were too small.
6.2 Intervention delivery
Overall, 39.0% of participants (154 of 395) in the treatment arm said they were asked whether they had a food allergy or intolerance. The staff in the control arm were told to go about business as usual, so they were not dissuaded from asking about allergens if they would have done anyway; 30.5% (165 of 541) of participants in the control arm said they were asked about allergens, which is less than the proportion who were asked in the treatment arm, X2(3, n = 936) = 7.32, p < 0.01. Fidelity in the treatment arm varied between branches, ranging from 20.8% to 75.9% (see Table 4).
Table 2: Intervention fidelity by location: grey column represents survey responses showing the intervention delivered as intended in each arm (that were included in the per protocol analysis)
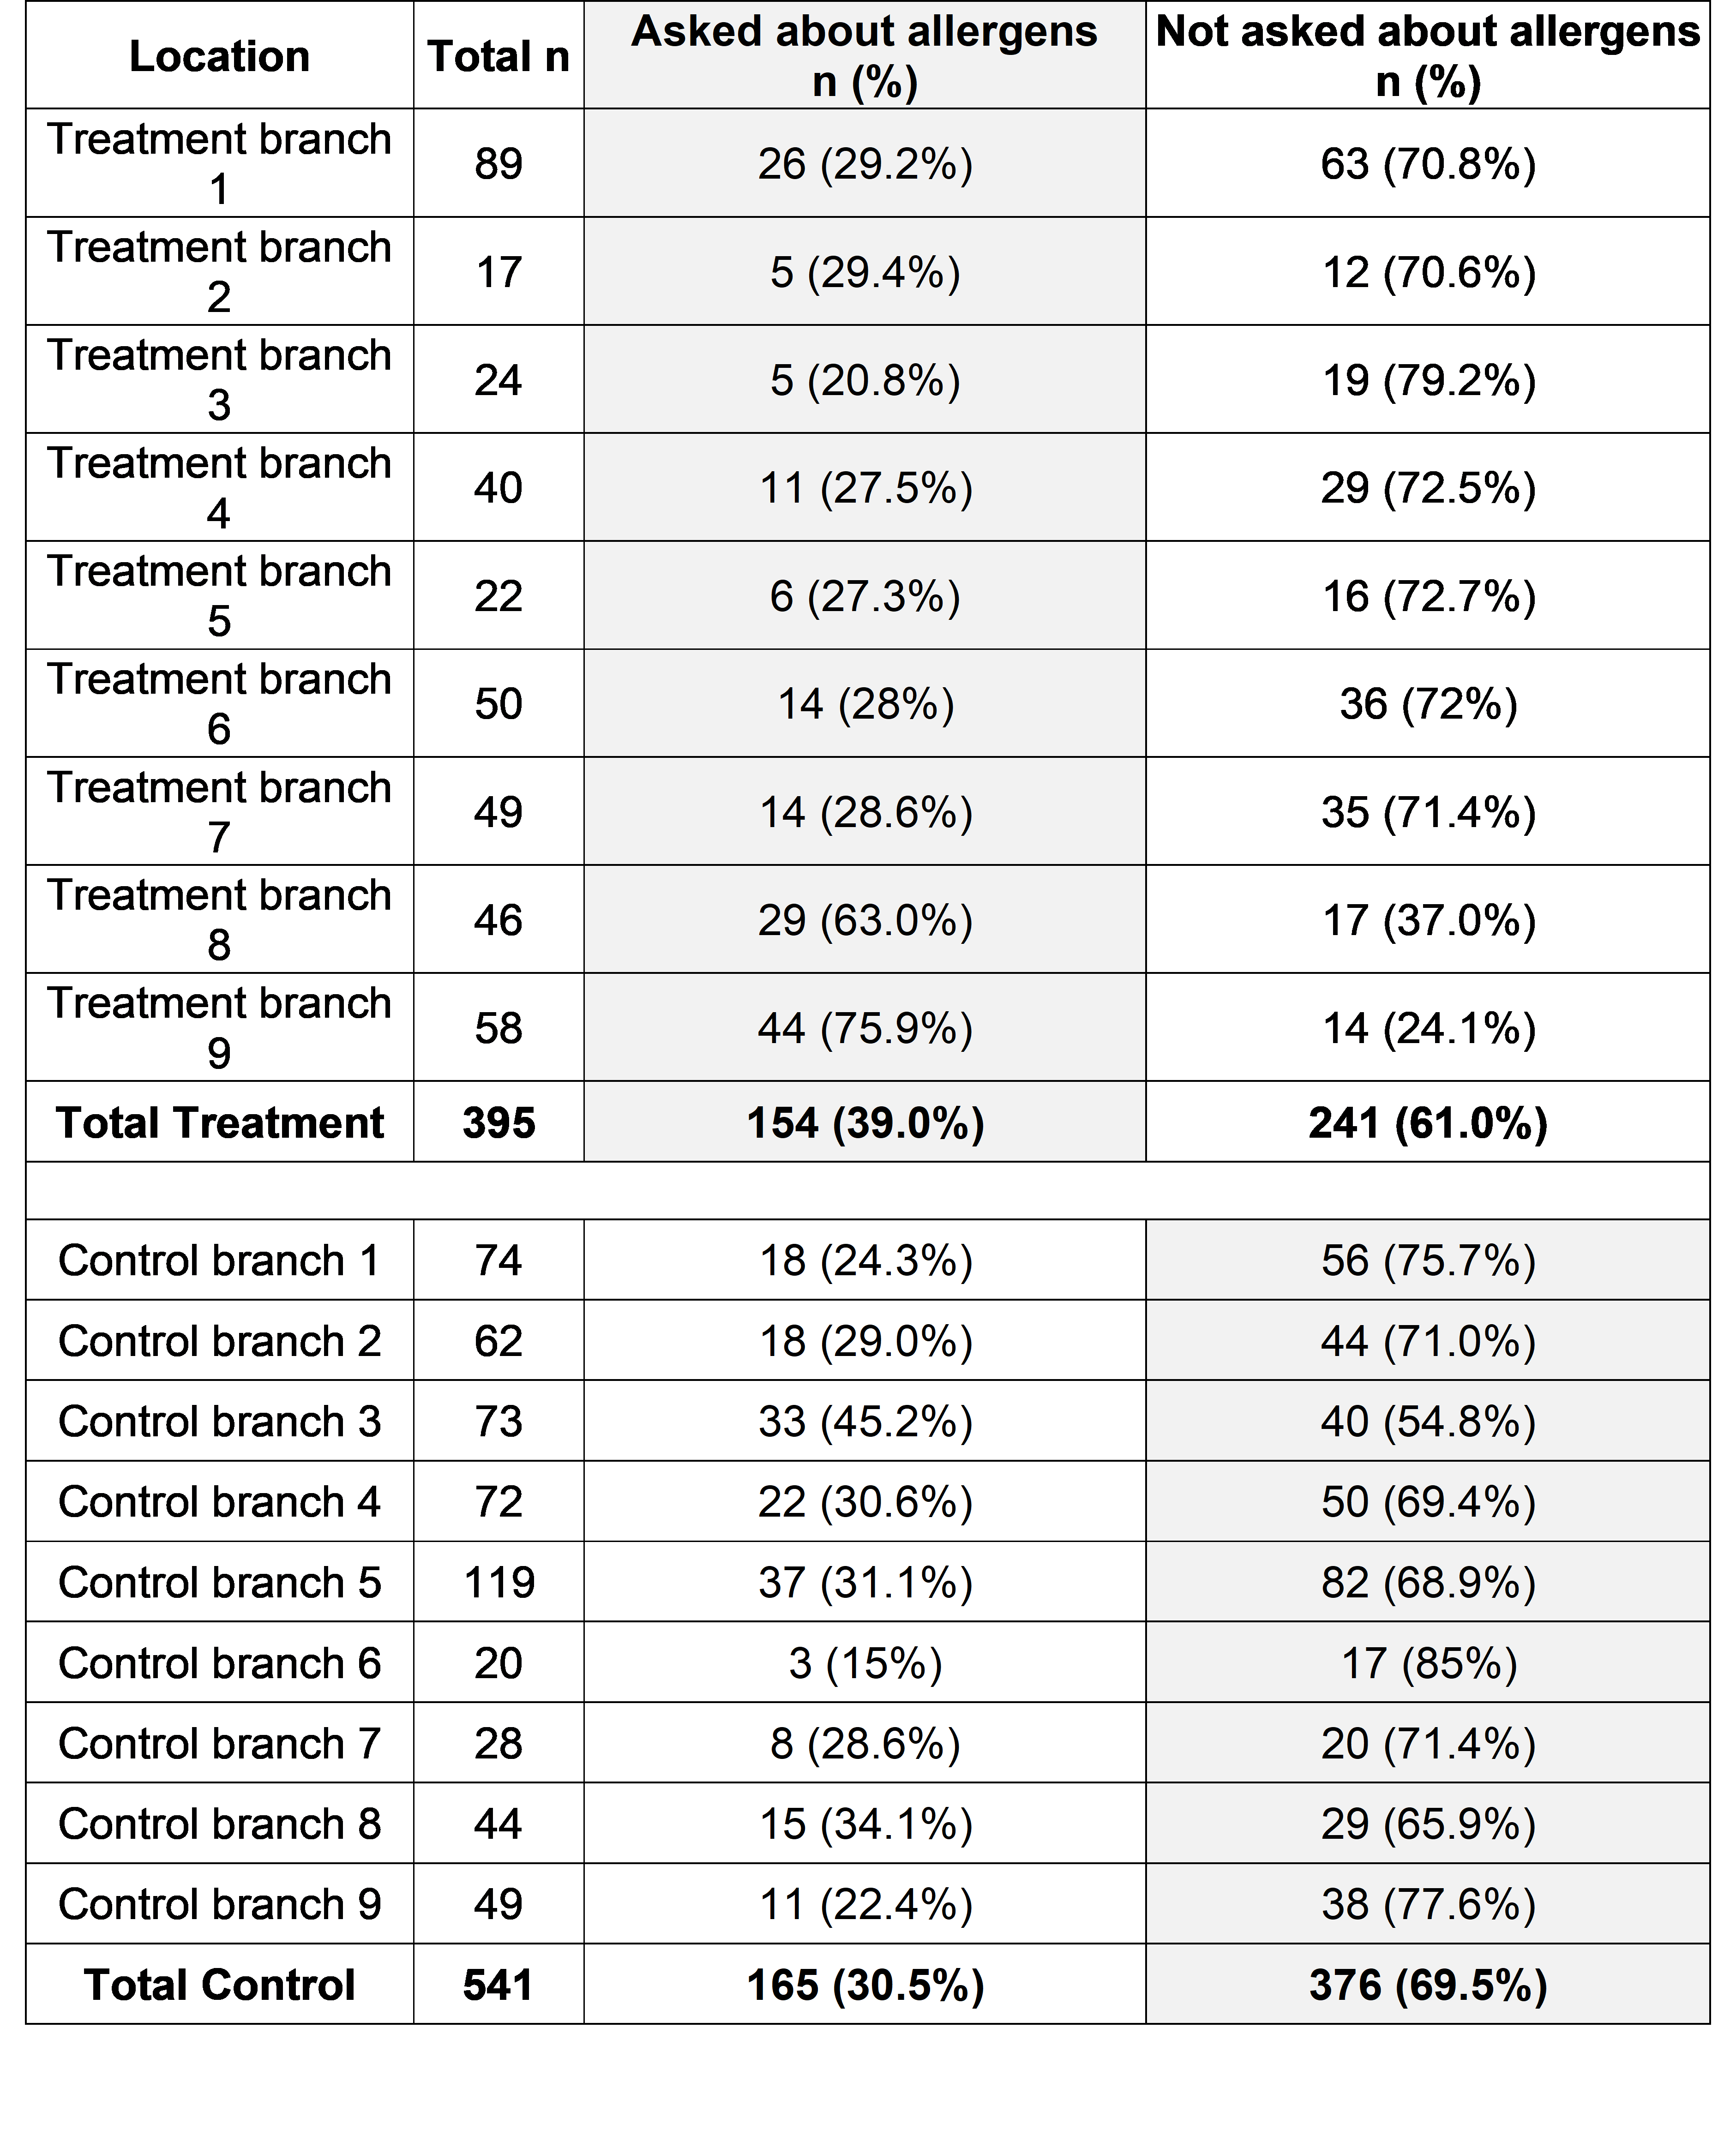
| Location | Total n | Asked about allergens n (%) | Not asked about allergens n (%) |
|---|---|---|---|
| Treatment branch 1 | 89 | 26 (29.2%) | 63 (70.8%) |
| Treatment branch 2 | 17 | 5 (29.4%) | 12 (70.6%) |
| Treatment branch 3 | 24 | 5 (20.8%) | 19 (79.2%) |
| Treatment branch 4 | 40 | 11 (27.5%) | 29 (72.5%) |
| Treatment branch 5 | 22 | 6 (27.3%) | 16 (72.7%) |
| Treatment branch 6 | 50 | 14 (28%) | 36 (72%) |
| Treatment branch 7 | 49 | 14 (28.6%) | 35 (71.4%) |
| Treatment branch 8 | 46 | 29 (63.0%) | 17 (37.0%) |
| Treatment branch 9 | 58 | 44 (75.9%) | 14 (24.1%) |
| Total treatment | 395 | 154 (39.0%) | 241 (61.0%) |
| Control branch 1 | 74 | 18 (24.3%) | 56 (75.7%) |
| Control branch 2 | 62 | 18 (29.0%) | 44 (71.0%) |
| Control branch 3 | 73 | 33 (45.2%) | 40 (54.8%) |
| Control branch 4 | 72 | 22 (30.6%) | 50 (69.4%) |
| Control branch 5 | 119 | 37 (31.1%) | 82 (68.9%) |
| Control branch 6 | 20 | 3 (15%) | 17 (85%) |
| Control branch 7 | 28 | 8 (28.6%) | 20 (71.4%) |
| Control branch 8 | 44 | 15 (34.1%) | 29 (65.9%) |
| Control branch 9 | 49 | 11 (22.4%) | 38 (77.6%) |
| Total control | 541 | 165 (30.5%) | 376 (69.5%) |
Fidelity observed during the mystery shopping visits (i.e. treatment branches asking about allergens, and control branches not doing so) was relatively low at 42.9%, and was similar between both visits. However, this was mainly due to treatment branches not proactively asking about allergens: across the implementation checks only one treatment branch was compliant and asked about allergies and intolerances as instructed (5.6%), while in 18 visits to control branches the mystery shoppers observed intervention fidelity, i.e. not asking about allergens, 14 times (77.8%).
During the first visits, mystery shoppers also noticed only three branches had put out table toppers, one treatment (5.6%) and two control (11.1%). At the time of the first visit, not all the branches had had table toppers delivered. By the second visits table toppers had been put out in 13 of the 16 branches that had tables, six treatment (33.3%) and seven control (38.9%). Compliance with handing out the leaflets containing QR codes in take-away bags increased from only one branch (control) during the first visit to five branches, two treatment (11.1%) and three control (16.7%), during the second visit.
6.3 Primary outcomes
Table 3: Response distribution, primary outcomes
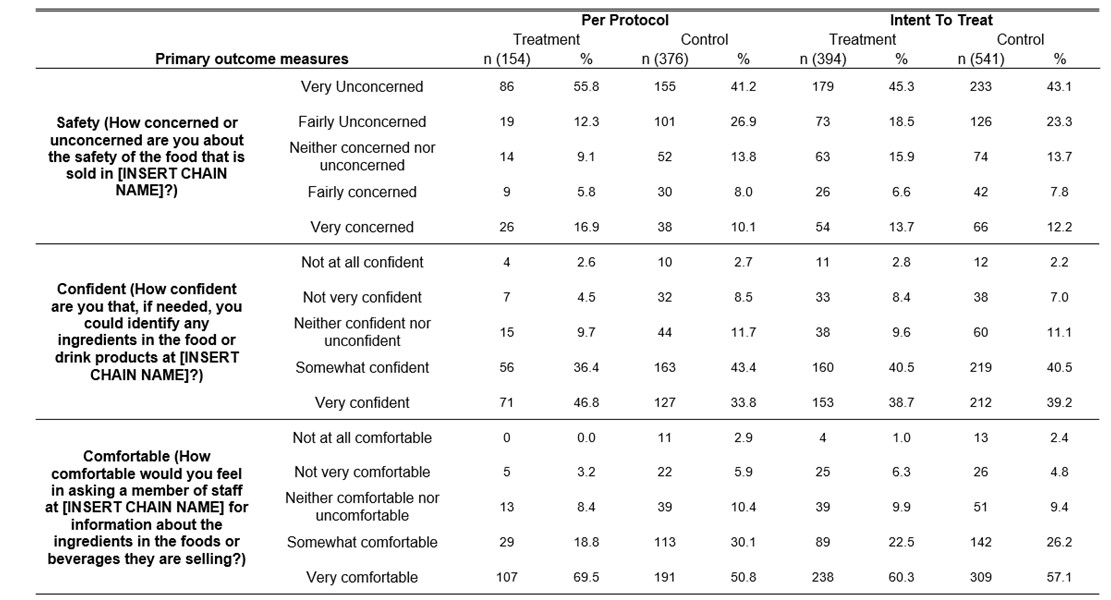
Customers in the treatment group who reported being proactively asked about their food hypersensitivities reported greater confidence that they could identify ingredients in the products served at the FBO than those in the control group who reported not being asked. Among those in the treatment group, almost 83.2% were either ‘very’ or ‘somewhat’ confident they could identify ingredients, compared to 77.2% in the control group (see Table 3 and Figure 3). Controlling for the influence of demographic covariates (gender and age), those in the treatment group were, on average, 0.26 points more confident than those in the control group (β = 0.26, p < 0.01). See Table 4 for the full model. This result was corroborated by the ordinal probit model (OR = 1.36, p < 0.01).
The intervention also increased customers’ level of comfort in asking a member of staff for information about product ingredients. For those in the treatment group, a majority (69.5%) were ‘very’ comfortable, while in the control group, only half (50.8%) were ‘very’ comfortable (see Table 3 for the breakdown of the figures and Figure 4 for a violin plot of the results). Controlling for the influence of demographic covariates, those in the treatment group were, on average, 0.36 points more comfortable than those in the control group (β = 0.36, p < 0.001). See Table 4 for the full model. This result was again supported by the ordinal probit model (OR = 1.66, p < 0.001).
However, the intervention did not have an effect on customers’ level of concern regarding the safety of the food that is sold in the FBO. Overall, a majority (65.3%) were ‘very’ or ‘fairly’ unconcerned about the quality of food that is sold in the FBO, compared to 68.1% in the control (see Table 3). The intervention did not have a significant impact on level of concern in the primary model (β = -0.02, p = 0.920). See Table 4 for the full model. The result which was supported by the ordinal probit model in the sensitivity analysis (OR = 0.90, p = 0.351).
The ICC was 0.01 for comfort asking staff about ingredients and perceptions of food safety. For confidence in identifying ingredients the mixed models resulted in a singular fit – due to trivially small or non-existent intraclass correlation coefficients. Likelihood ratio tests established that a fixed effects model, without the random intercept for clusters, had better fit. See Table 4 for full models, including details of random effects.
Figure 3: Level of confidence in identifying ingredients in the food and drink products by treatment, violin plot
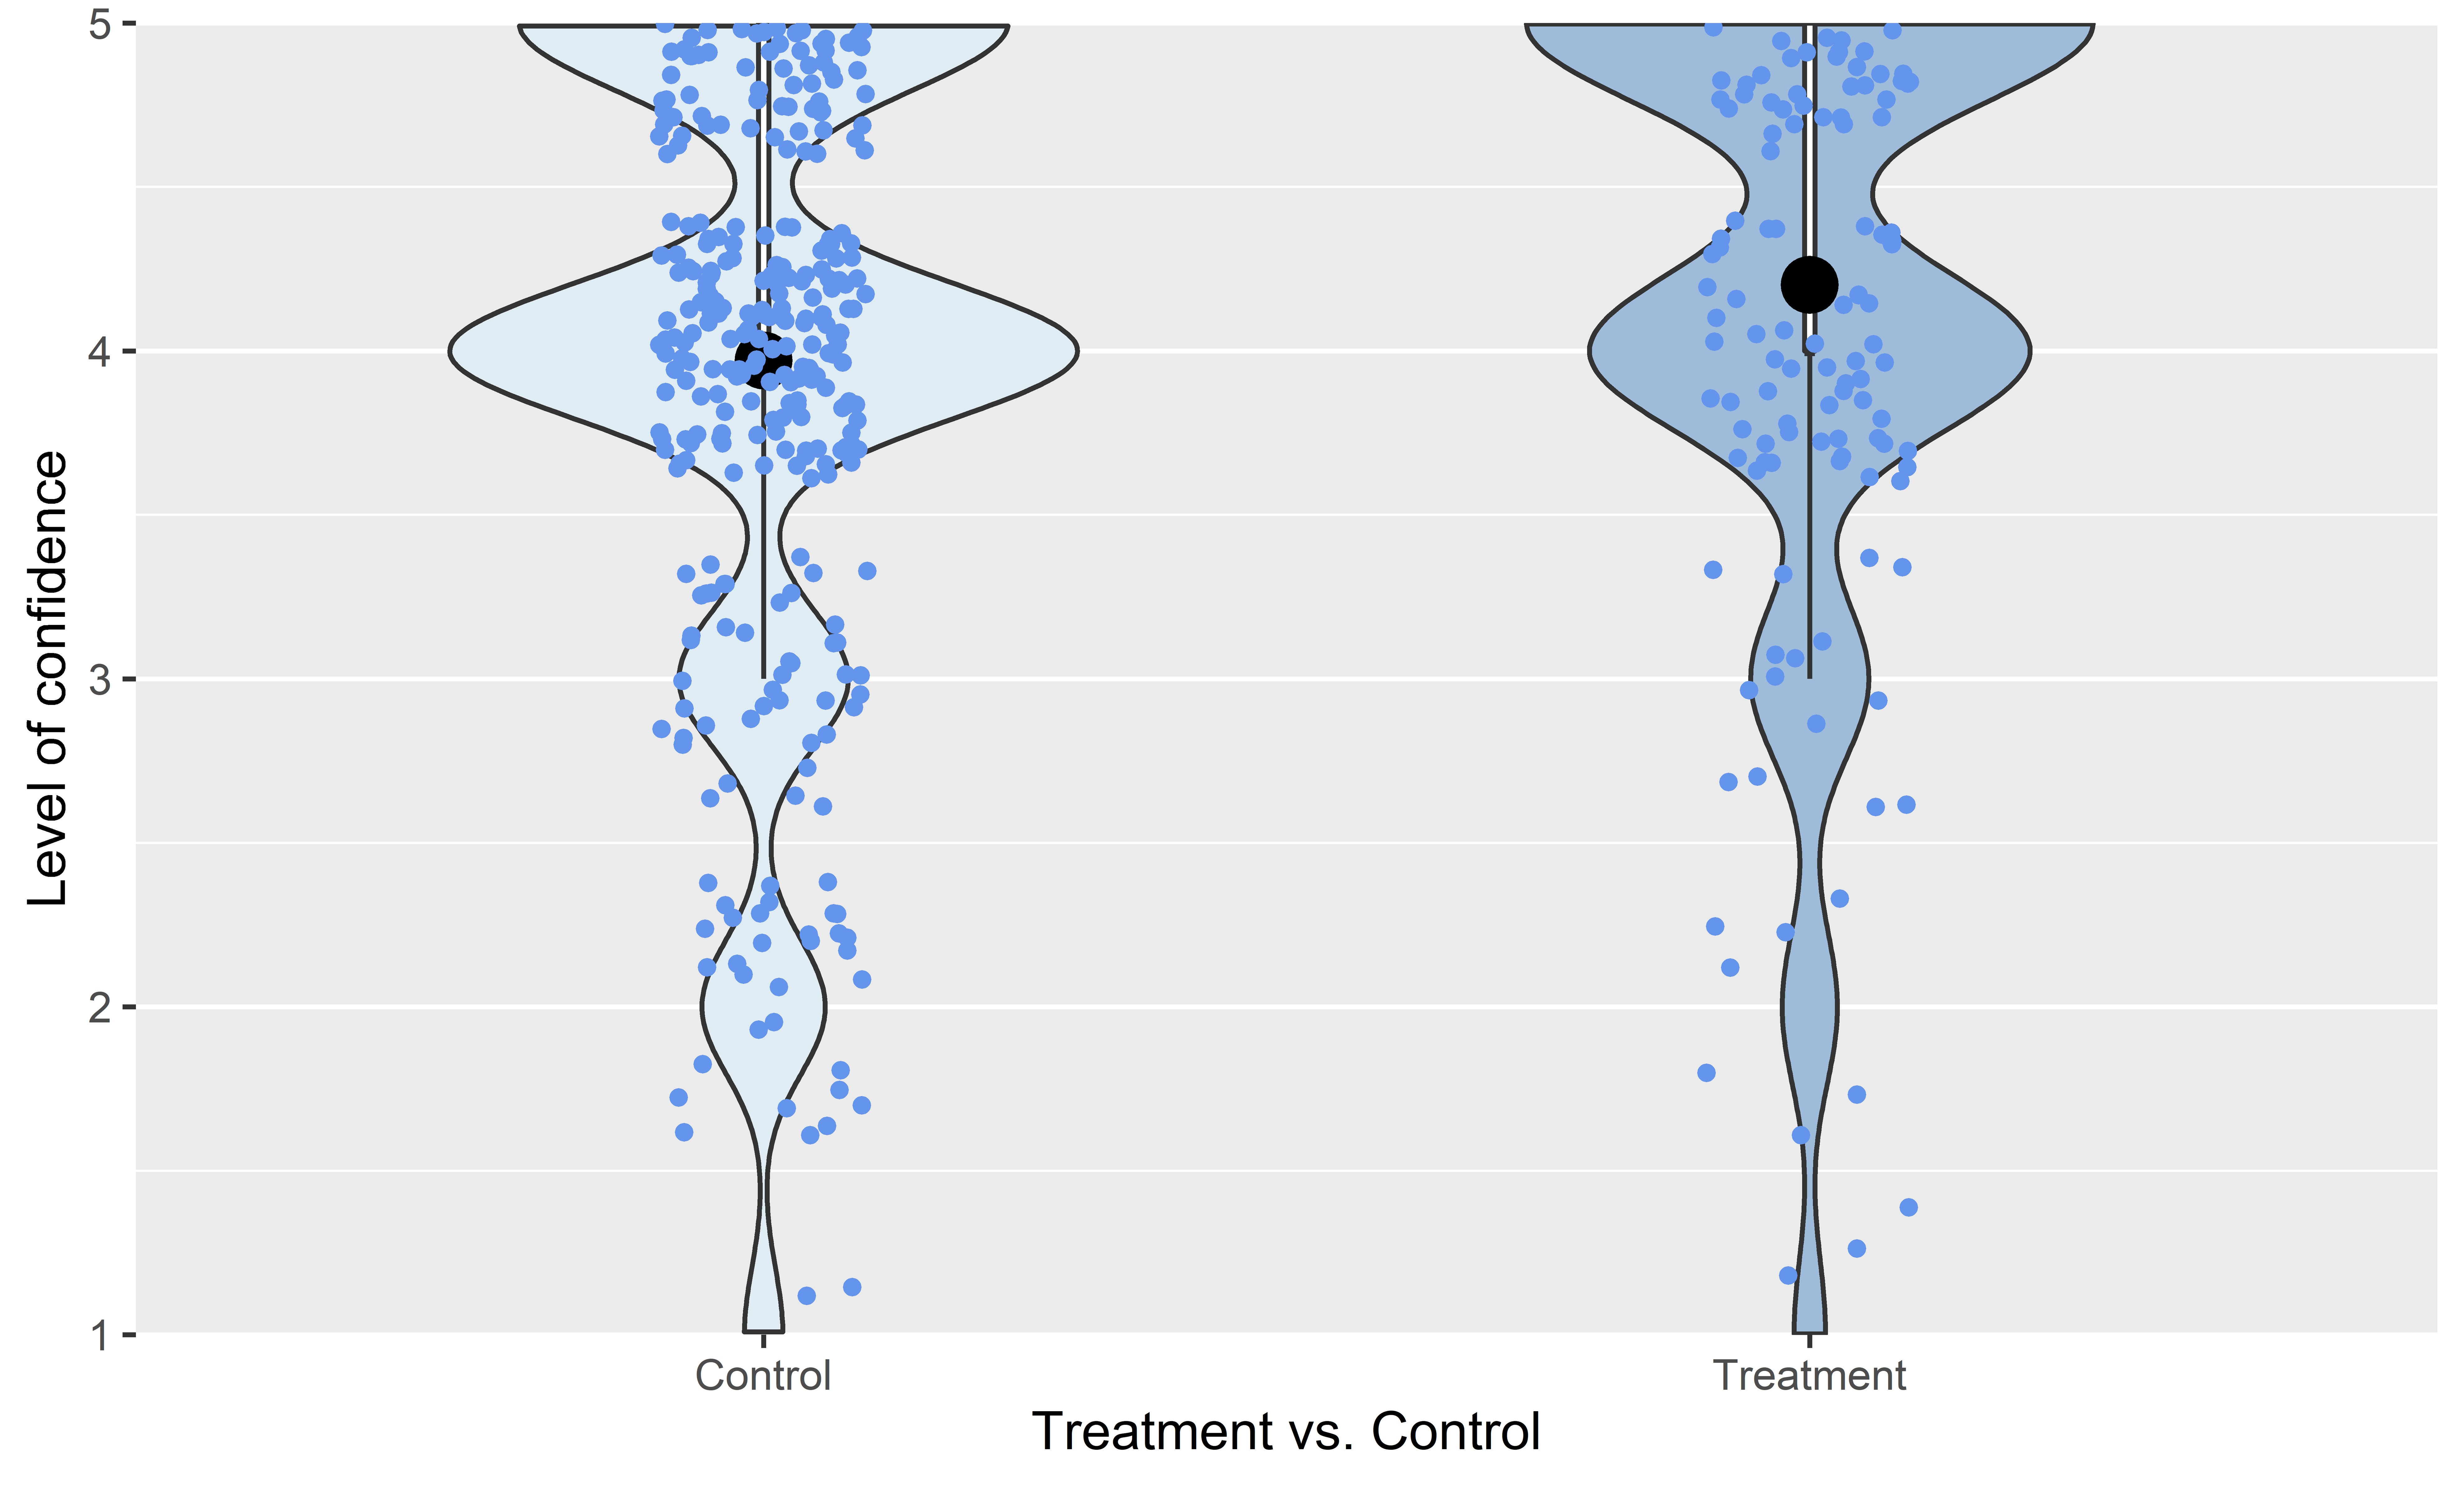
Figure 4: Level of comfort in asking a member of staff for information about the ingredients in the foods or beverages by treatment, violin plot
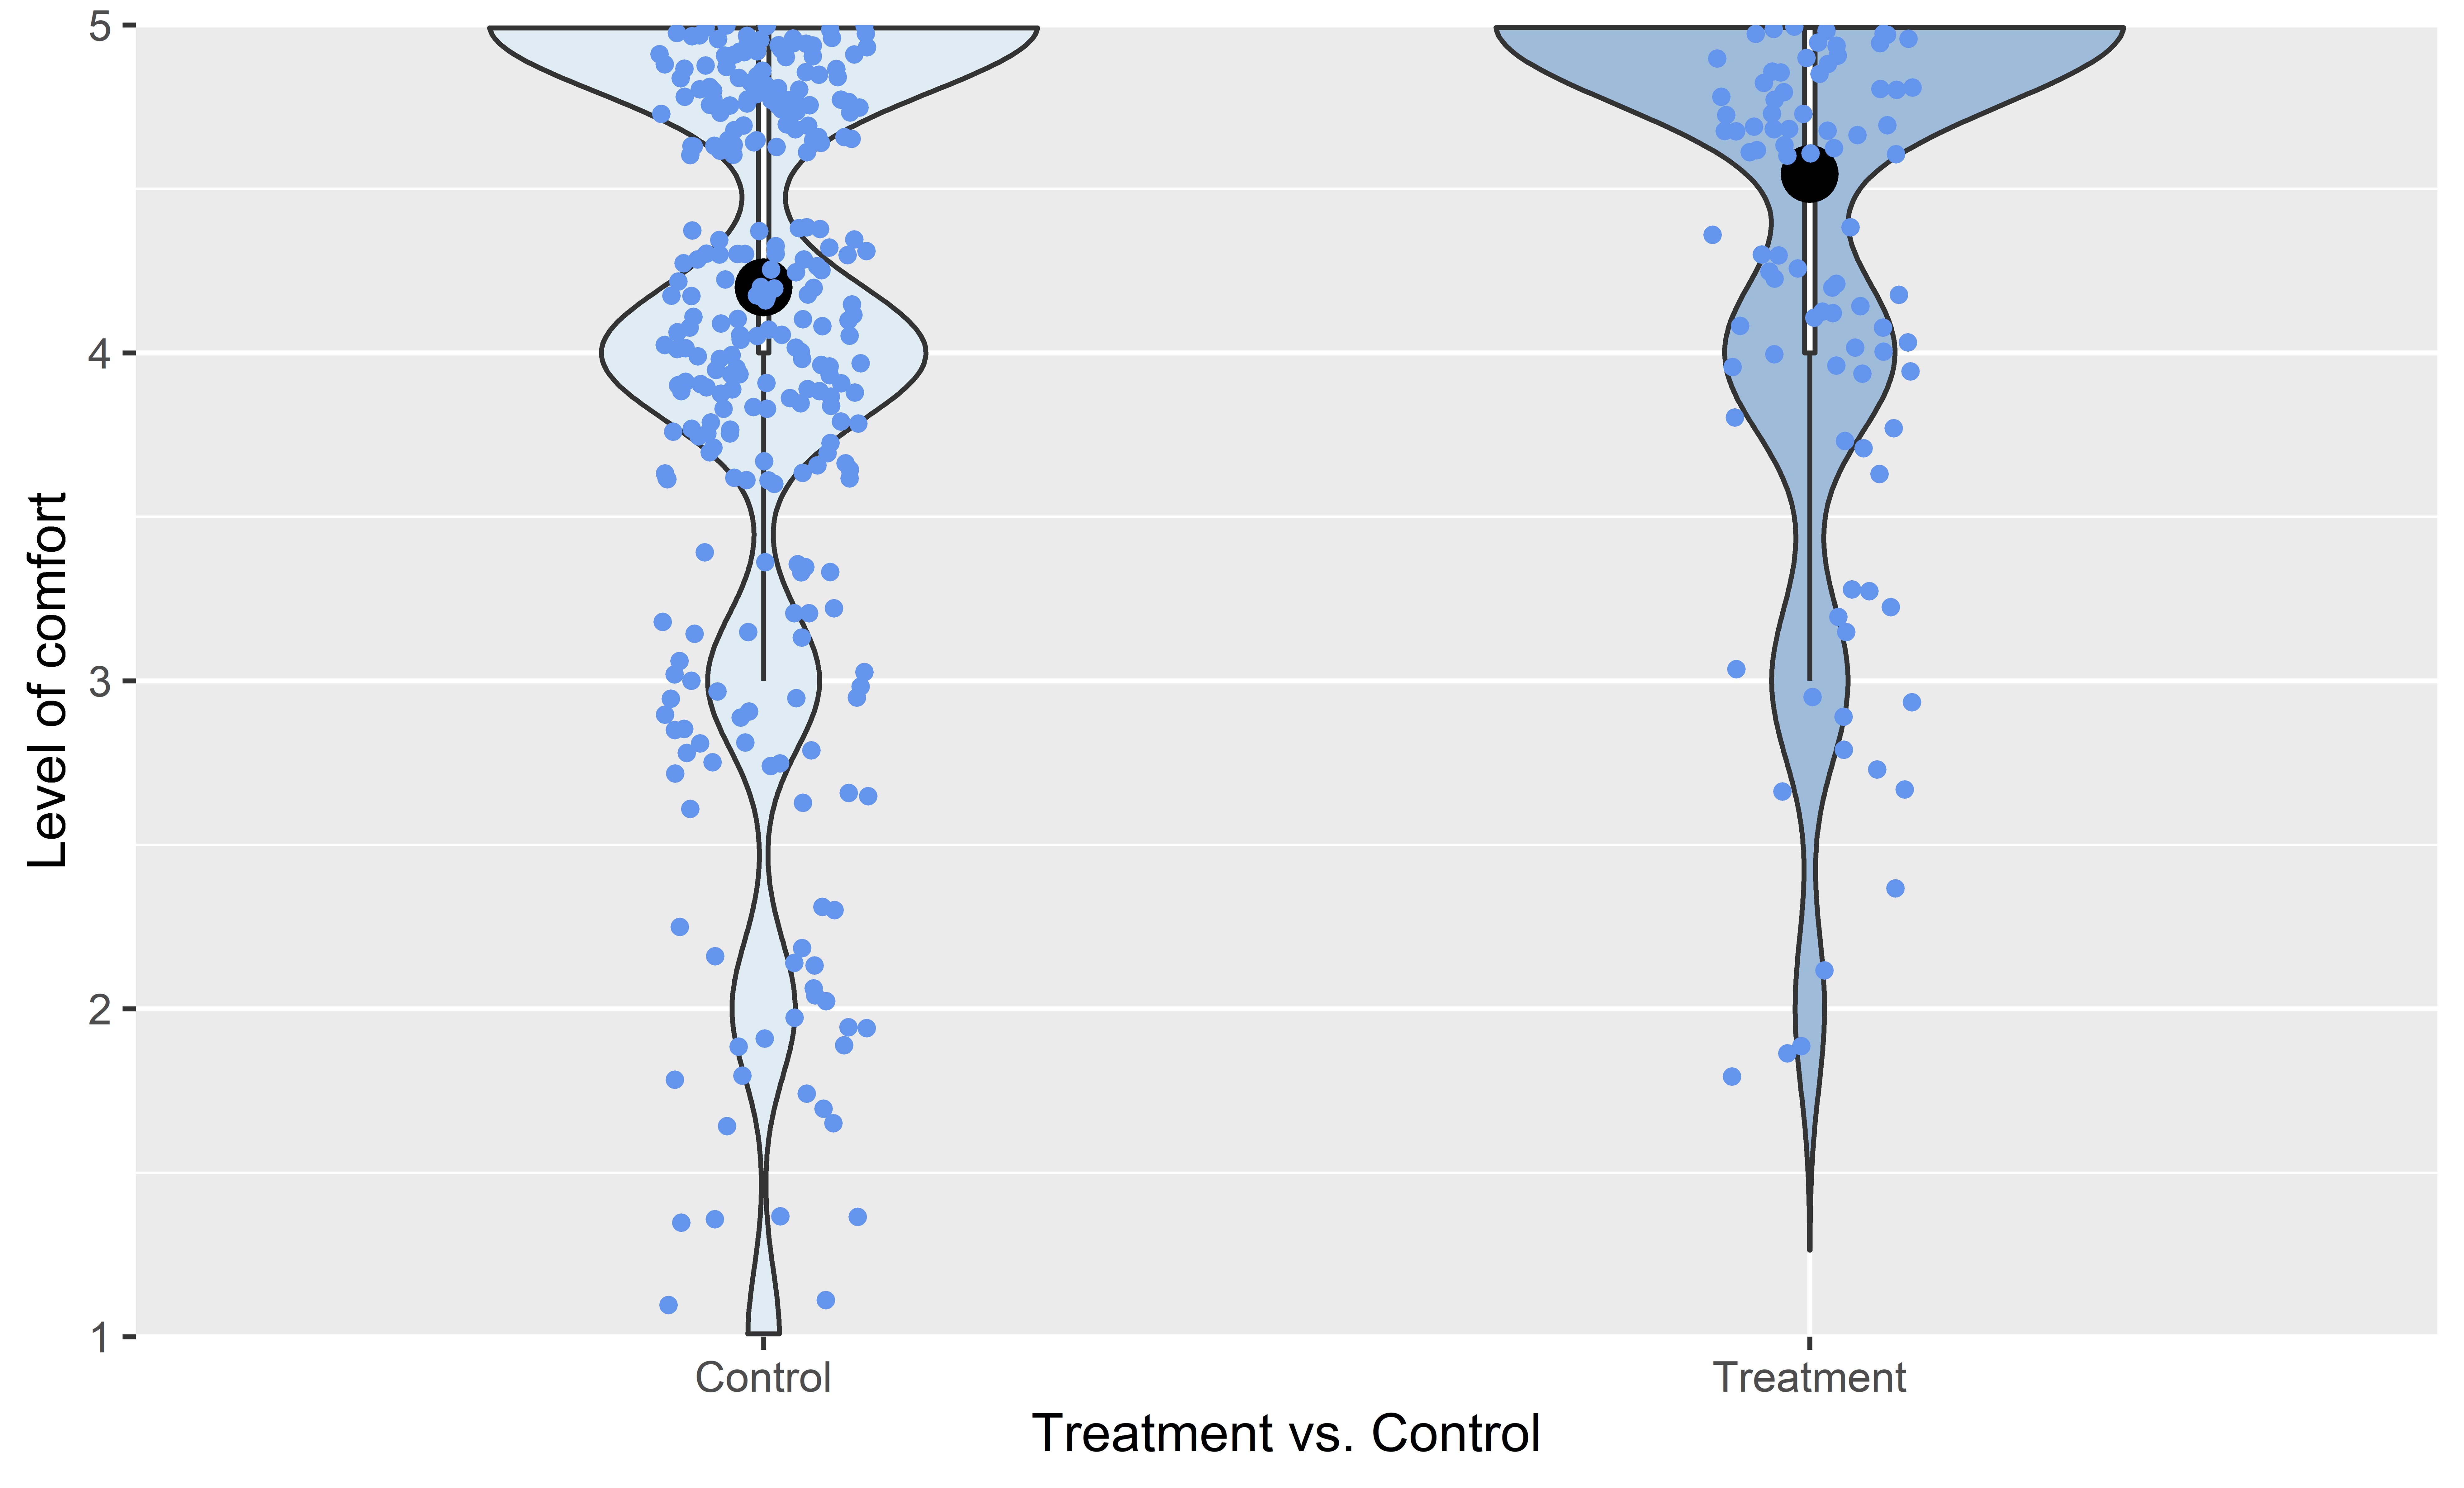
Table 4: Model outputs, primary outcomes
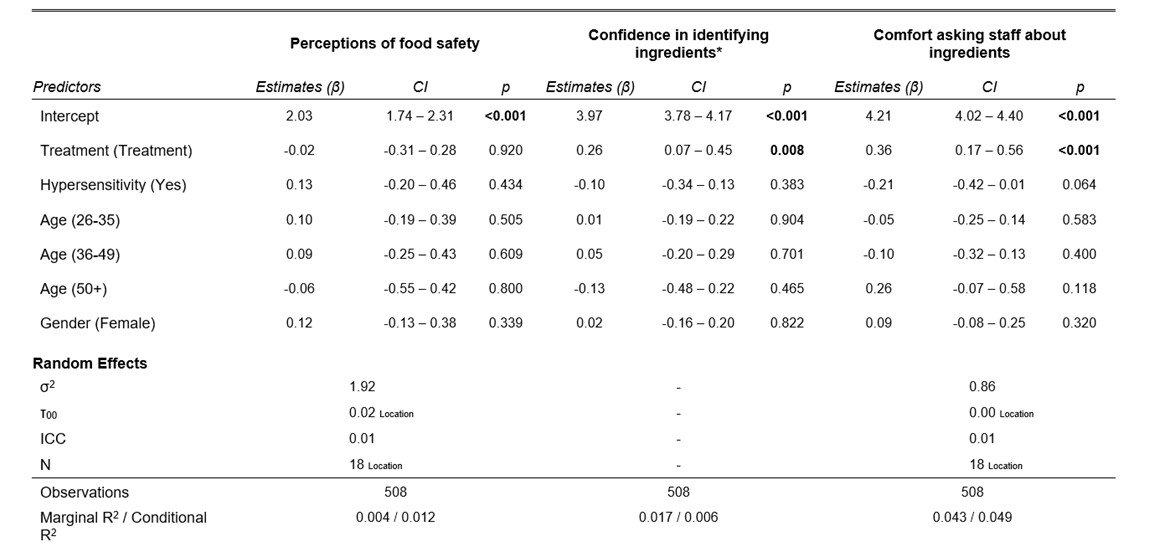
*This model was conducted using a model without a random intercept, which had significantly better fit χ2(1) = 19.476, p < 0.001.
6.4 Secondary outcomes
There were four secondary outcomes in this trial and the intervention had a positive effect on all four (see Table 5).
Trust in the FBO was enhanced by proactively asking customers about their hypersensitivities. The proportion of customers in the treatment group reporting they trusted the business or trusted it a lot was 91.6%, compared to 81.6% in the control group. Holding covariates constant, those in the treatment group trusted the FBO 0.33 points more than those in the control group (β = 0.33, p < 0.001). (See Table 6 for the full model.) A similar result was observed in the respective ordinal probit model (OR = 1.75, p < 0.001).
Customers’ satisfaction with their visit to the FBO increased. The proportion of customers in the treatment group reporting they were Fairly Satisfied or Very Satisfied was 92.8%, compared to 85.4% in the control group. Controlling for covariates, those in the treatment group were, on average, 0.33 points more satisfied than those in the control group (β = 0.33, p = 0.004). (See Table 6 for the full model.) This result was corroborated by the sensitivity analysis’ ordinal probit model (OR = 1.52, p < 0.01).
For the third secondary outcome – likelihood to recommend the FBO to family or friends – there was also a statistically significant difference between the treatment and control groups, controlling for covariates (β = 0.28, p = 0.033). (See Table 6 for the full model.) The proportion of customers in the treatment group reporting they were Fairly Likely or Very Likely to recommend the FBO was 90.2%, compared to 85.3% in the control group.
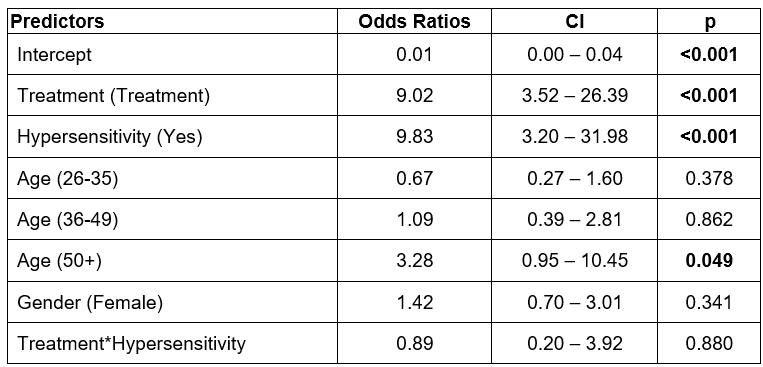
Finally, the treatment had a pronounced positive effect on the odds of declaring one’s (self-reported) allergy or intolerance. Controlling for covariates, those who received the treatment had significantly higher odds of declaring their hypersensitivity (OR = 8.58, p < 0.001). To put the magnitude of this treatment effect in perspective, the impact of having a hypersensitivity on declaration was similar (OR = 9.19, p < 0.001). See Table 6 for the full model.
Table 5: Response distribution, secondary outcomes
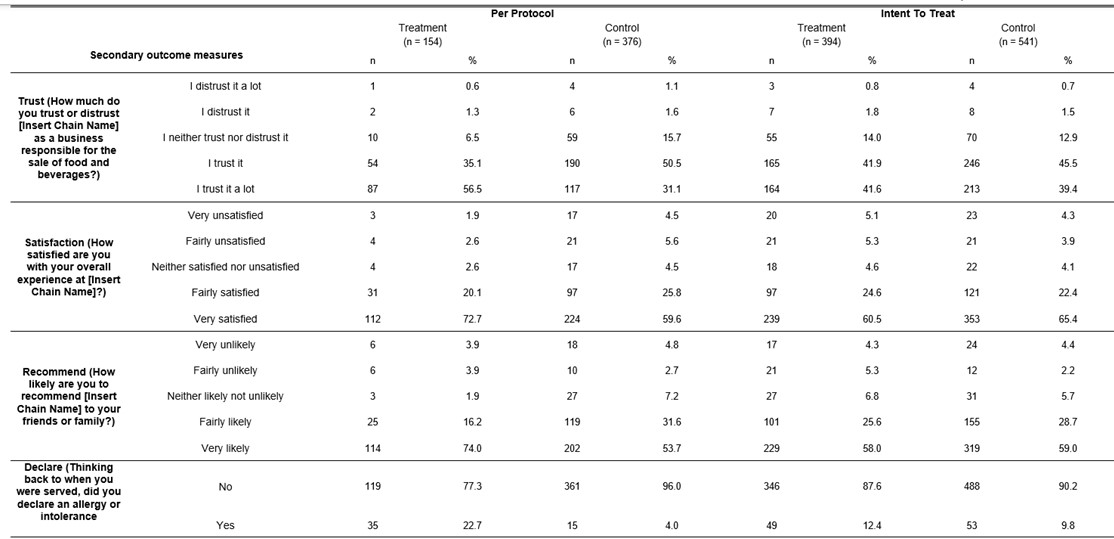
Table 6: Model outputs, secondary outcomes
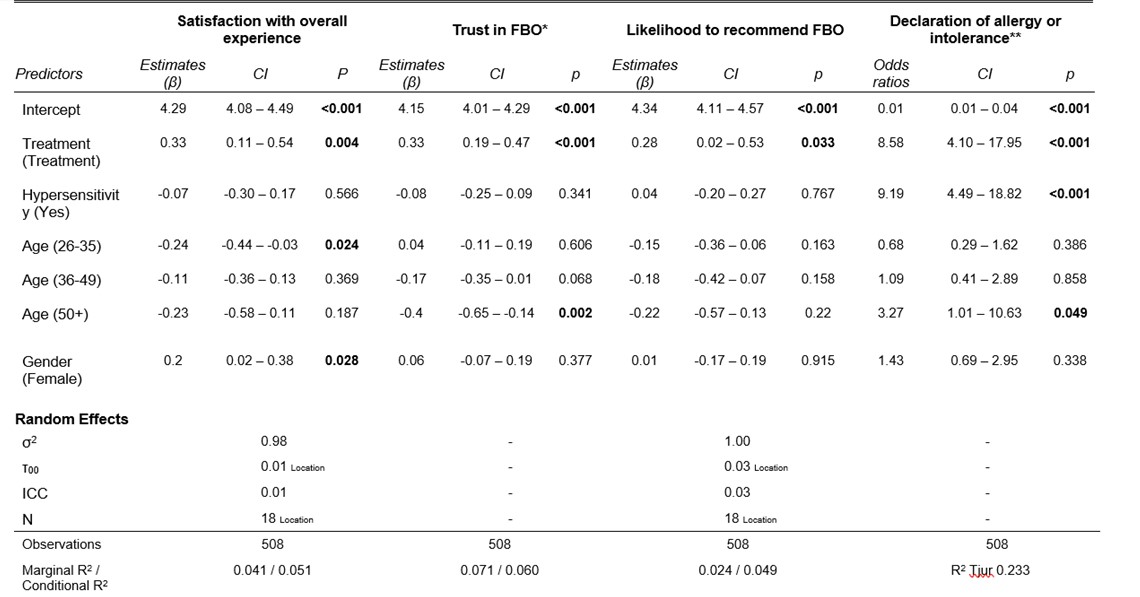
*This model was conducted using a model without a random intercept, which had significantly better fit (χ2(1) = 23.830, p < 0.001).
**This model was conducted using a model without a random intercept, which had a better fit (AIC = 246.200, vs. 248.230)
6.5 Sensitivity analysis
We ran two sensitivity analyses.
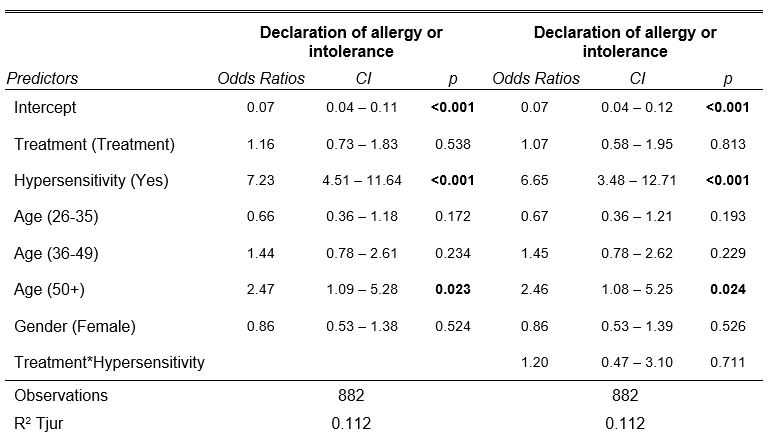
First, the models which included the additional interaction term (intervention*hypersensitivity) had similar results to the primary models (see Table 7 in Appendix 1). For all of the outcome variables, the patterns of significance were similar to those observed in the primary analysis above. Specifically, there was a significant treatment effect observed for the intervention for: confidence in identifying ingredients (β = 0.25 , p < 0.05); comfort asking about ingredients (β = 0.35, p < 0.01); satisfaction (β = 0.37, p < 0.01); trust (β = 0.35, p < 0.001); likelihood to recommend the FBO (β = 0.32, p < 0.05); and declaration (OR = 9.02, p < 0.001). For all of these outcomes, the interaction term was non-significant, meaning that differential treatment effects were not observed for customers with hypersensitivities.
Second, the final series of sensitivity analysis was conducted using a ‘intention-to-treat’ approach (see Table 8 and Table 9 in Appendix 1). For all of the outcome variables, a null treatment effect was observed.
In this in-business cluster randomised trial, we found that FBO staff proactively asking customers about their food hypersensitivities improved customers’ confidence that they can identify ingredients in their order and their comfort in asking about allergens. On a five-item Likert-scale response variable, almost 83.2% in the treatment group were either ‘very’ or ‘somewhat’ confident they could identify ingredients, compared to 77.2% in the control group (β = 0.26, p < 0.01). The proportion who were ‘very’ comfortable asking about ingredients increased from 50.8% to a 69.5% (β = 0.36, p < 0.001). In addition, the intervention had a pronounced positive effect on the odds of declaring one’s (self-reported) allergy or intolerance (OR = 8.58, p < 0.001). This effect was large: to put its magnitude in perspective, its observed effect was similar to the impact of having a hypersensitivity on declaration (OR = 9.19, p < 0.001). However, we did not observe an effect of the intervention on customer perceptions of food safety at the food business, with a majority (65.3%) being ‘very’ or ‘fairly’ unconcerned about the quality of food that is sold in the FBO, compared to 68.1% in the control (β = -0.02, p = 0.920).
It is perhaps unsurprising that proactively asking consumers about allergens would increase their confidence that they can identify product ingredients, their comfort in asking, and the likelihood of reporting that they declared an allergy or intolerance. Our finding that proactively asking increased confidence is also consistent with the numerical direction of results in the feasibility study that preceded this trial (McPhedran et al., 2021). However, the feasibility study also had numerical effects in the direction of increasing perception of food safety, whereas we did not find a difference between groups.
This null result on food safety may be a result of allergen information’s relatively weak influence on perceptions of food safety, compared to other factors. Previous research suggests that the most important determinant of the perception of food safety in restaurants is the cleanliness of the kitchen and, after that, chemical issues such as pesticides (Kidd, 2000; Brewer and Prestat, 2002; Henson et al., 2006; Lee et al., 2012). Admittedly, some of these surveys did not include questions about allergens, but at least one study did and found that they were less influential on perceptions of food safety than food hygiene and chemicals (Brewer and Prestat, 2002). Alternatively, it may be possible that this null effect was the result of a selection bias, since the sample in this trial only included customers who had decided to visit and order from this particular restaurant, and were presumably less concerned about food safety there. Previous research has found that consumers tend to eat at restaurants where they trust the food (Lee et al., 2012).
Our findings do not suggest the intervention had a greater impact on the perceptions of confidence, comfort or safety of people with allergies or hypersensitivities: sensitivity analyses with an interaction term found null effects of the interaction. Given the greater importance of allergen and ingredient information for these customers, we might have expected to see a greater effect among this subgroup. However, our sample of customers who reported having an allergy or food intolerance was low (n = 89, or 16.8%, in the per-protocol analysis) and we were not powered to detect this effect. In general, it should be noted that the underlying motivation for allergens prompts in FBOs is to improve confidence of consumers with food hypersensitivities; nevertheless, our participants were not restricted to this group. Unfortunately, it might be impractical to run a sufficiently large trial to be powered to detect effects solely amongst those with food hypersensitivities.
The intervention additionally improved key customer satisfaction metrics: customer satisfaction (β = 0.33, p < 0.01) and trust in the FBO (β = 0.33, p < 0.001). Businesses are not currently mandated to ask consumers about the food hypersensitivities proactively (Food Standards Agency, 2022), and while some do so already, others do not (Smeaton and IFF Research, 2013). However, our research suggests that the intervention would be beneficial to business as well as customers, which is a win-win situation; on this basis, businesses should strongly consider implementing such an approach.
We did not find any effect of our intervention in intention-to-treat models, likely because intervention fidelity was poor. Overall, in the treatment arm, only 39.0% of participants said they were asked whether they had a food allergy or intolerance, compared to 30.5% in the control arm (which was business as usual, so staff were not dissuaded from asking about allergens). Given this low level of compliance, if businesses wish to implement the intervention, then further research on measures to support employees’ implementation would be beneficial. In this trial, we provided a briefing document and had a call with managers. However, additional protocols for managers on how to implement this via their staff—and materials to support managers having conversations with their staff—would likely have improved fidelity. Fidelity in the treatment arm showed a wide variation between branches, ranging from 20.8% to 75.9%. This result is consistent with there being a strong influence of the branch manager or with the idea that there are network effects in implementing food safety (Verwaart and Valeeva, 2011; Abdirahman et al., 2018). It is plausible that the behaviour of staff within the branch influences that of the other staff. Other research has found that food safety culture depends on norms, practices, and standards (Bolanos, 2020); this is often discussed in the context of the whole organisation, but similar points could be made about the importance of culture of individual branches or units within a larger organisation.
In addition to investigating how to improve implementation and to investigating effects on those with food hypersensitivities, another interesting extension to this trial would be an examination of the effect of the intervention on children and their carers. Our sample was restricted to people who were 16 or over (entering a younger age led to the survey immediately ending). However, the fastest increase in hospital admissions for food anaphylaxis is in children under 15 years. From 1998 to 2018 their hospital admissions increased from 2.1 to 9.2 admissions per 100 000 population, an annual increase of 6.6% (Baseggio Conrado et al., 2021). Therefore, this is an important group to address.
The key limitation in the design of the trial is possible bias due to low coverage, self-selection of customers into the survey and due to any differential (biased or non-random) attrition of customers during the survey. We ran the trial in a national FBO, in branches both inside and outside London. Nevertheless, all branches were in cities and, of course, the type of people who go to a particular FBO is not random. In particular, the sample tended to be quite young, the modal age group being between 16 and 25. This sample composition is consistent with a national UK survey’s finding that the group that eats out most often is 19-29 year olds (41.0% eat out 1-2 a week or more) (Adams et al., 2015). However, the survey found that all age groups tended to eat out regularly: 25.7% of 50-59 year olds ate out 1-2 times a week or more, whereas only 4.5% of our trial sample was over 50 years old. It is likely that the demographic of the trial’s FBO is different from the demographics of the population of people who eat out, but it is also possible that young people were more likely to self-select into a survey with a prize draw. We do not know the footfall in the branches during the trial, so we do not know the percentage of customers who responded to the survey (and therefore the ultimate extent of selection bias). We also note that attrition was higher in the treatment branch than in the control; we have no explanation for this.
The trial is further limited by the small sample of respondents with (self-declared) allergies and intolerances, which meant we were not powered to detect any impacts within this group. However, we had covariates indicating self-reported food hypersensitivities in our models and none of them were statistically significant; we did not find any evidence that those with food hypersensitivities gave different answers from those without. We also note that we did not measure severity of reported allergies and intolerances, which could contribute to a selection bias. It is possible that those with the most severe, life-threatening allergies are less likely to eat out due to safety concerns, so the sample may only represent those with milder conditions.
Another limitation of this trial is that it was only conducted in one FBO: as such, we cannot be sure that the results generalise to other types of food business. Specifically, in this trial, we partnered with a national FBO; in the feasibility study we partnered with an international FBO. Future research should seek to run a similar trial in small, independent FBOs, which may be less likely to have a policy on asking about allergens. The FSA has previously found that larger FBOs are more likely to give staff formal allergen management training (FSA, 2021). Additionally, anecdotally, during recruitment we found that many chains are already implementing a policy of asking proactively about food hypersensitivities.
At the outset of this trial, we planned to recruit a selection of different types of FBO. Recruitment was not successful primarily due to general pressures on FBOs and FBO staff in the current economic environment, but also many of the chains that we approached had already implemented a policy. Because of difficulties in recruitment, we had fewer branches in each arm than we had planned for, but this did not have a detrimental impact on our ability to detect treatment effects, because our pre-trial power calculations conservatively assumed an intraclass correlation coefficient of 𝜌 = 0.03, whereas—as in the feasibility study—our ICC was lower, at 𝜌 = 0.01 for comfort and perceptions of food safety, while for confidence in identifying ingredients a fixed effect models (without the clusters) had the best fit. This means that the behaviour of consumers within specific branches was variable, suggesting little branch-specific dependence in terms of the chosen outcomes, which implies that we were more highly powered than the power calculations would suggest.
Future research should seek to investigate whether this trial’s intervention is effective in other types of business and for other types of consumers, in particular among those with allergies and/or hypersensitivities. However, given its effectiveness in this population (and in the preceding feasibility study); the low chance of adverse effects; and the positive observed effects on a range of consumer outcomes, implementation of the intervention, with iterative intervention optimisation and fidelity support measures is recommended.
- Abdirahman, Z.-Z. et al. (2018) ‘Food safety implementation in the perspective of network learning’, International Journal of Food Studies, 7(2). Available at: https://doi.org/10.7455/ijfs/7.2.2018.a2
- Adams, J. et al. (2015) ‘Frequency and socio-demographic correlates of eating meals out and take-away meals at home: cross-sectional analysis of the UK national diet and nutrition survey, waves 1–4 (2008–12)’, International Journal of Behavioral Nutrition and Physical Activity, 12(1), p. 51. Available at: https://doi.org/10.1186/s12966-015-0210-8.
- Barnett, J. et al. (2017) ‘The preferences of those with food allergies and/or intolerances when eating out (FS305013)’, p. 99.
- Barnett, J., Vasileiou, K. and Lucas, J.S. (2020) ‘Conversations about food allergy risk with restaurant staff when eating out: A customer perspective’, Food Control, 108, p. 106858. Available at: https://doi.org/10.1016/j.foodcont.2019.106858.
- Baseggio Conrado, A. et al. (2021) ‘Food anaphylaxis in the United Kingdom: analysis of national data, 1998-2018’, BMJ, 372, p. n251. Available at: https://doi.org/10.1136/bmj.n251.
- Bolanos, J.A. (2020) ‘Organisations, Culture & Food Safety’.
- Brewer, M.S. and Prestat, C.J. (2002) ‘Consumer attitudes toward food safety issues’, Journal of Food Safety, 22(2), pp. 67–83. Available at https://doi.org/10.1111/j.1745-4565.2002.tb00331.x
- Coppock, A. (2019) ‘Design and analysis of experiments with randomizr’. Available at: https://cran.r-project.org/web/packages/randomizr/vignettes/randomizr_v….
- Food Standards Agency (2020a) Public Attitudes Tracker - Wave 19. Food Standards Agency (PDF).
- Food Standards Agency (2020b) Using NHS Data to monitor trends in the occurrence of severe, food induced allergic reactions, Food Standards Agency. (Accessed: 10 December 2021).
- Food Standards Agency (2022) ‘Allergen guidance for food businesses’. (Accessed: 12 October 2021).
- FSA (2021) ‘The Food Industry’s Provision of Allergen Information to Consumers’, p. 134.
- Gupta, S.K. (2011) ‘Intention-to-treat concept: A review’, Perspectives in Clinical Research, 2(3), pp. 109–112. Available at: https://doi.org/10.4103/2229-3485.83221.
- Henson, S. et al. (2006) ‘Consumer Assessment of the Safety of Restaurants: The Role of Inspection Notices and Other Information Cues’, Journal of Food Safety, 26(4), pp. 275–301. Available at: https://doi.org/10.1111/j.1745-4565.2006.00049.x.
- Hox, J.J., Moerbeek, M. and Van de Schoot, R. (2017) Multilevel analysis: Techniques and applications. Routledge.
- Kidd, M. (2000) ‘Food safety–consumer concerns’, Nutrition & Food Science [Preprint]. Available at DOI: 10.1108/00346650010314250
- Knibb, R., Hawkins, L. and Rigby, D. (2021) FoodSensitive Study: Wave One Survey. Food Standards Agency. Available at: https://doi.org/10.46756/sci.fsa.sov133.
- Kovacs, S. (2018) Young people and food allergies / intolerances. Food Standards Agency (PDF).
- Lee, L.E. et al. (2012) ‘Consumer perceptions on food safety in Asian and Mexican restaurants’, Food Control, 26(2), pp. 531–538. Available at: https://doi.org/10.1016/j.foodcont.2012.02.010.
- McPhedran, R. et al. (2021) ‘Food allergen communication: An in-business feasibility trial’, Food Control, 130, p. 108287. Available at: https://doi.org/10.1016/j.foodcont.2021.108287.
- Moerbeek, M. (2006) ‘Cluster Randomised Trials: Design and Analysis’, in Springer Handbook of Engineering Statistics. London: Springer-Verland London Limited.
- Raudenbush, S.W. (1997) ‘Statistical analysis and optimal design for cluster randomized trials’, Psychological Methods, 2(2), pp. 173–185. Available at: https://doi.org/10.1037/1082-989X.2.2.173.
- Rutterford, C., Copas, A. and Eldridge, S. (2015) ‘Methods for sample size determination in cluster randomized trials’, International Journal of Epidemiology, 44(3), pp. 1051–1067. Available at: https://doi.org/10.1093/ije/dyv113.
- Smeaton, D. and IFF Research (2013) ‘Baseline Study on the Provision of Allergy Information to Consumers for Foods which are not prepacked’.
- Soon, J.M. (2018) ‘“No nuts please”: Food allergen management in takeaways’, Food Control, 91, pp. 349–356. Available at: https://doi.org/10.1016/j.foodcont.2018.04.024.
- Turner, P.J. et al. (2015) ‘Increase in anaphylaxis-related hospitalizations but no increase in fatalities: An analysis of United Kingdom national anaphylaxis data, 1992-2012’, Journal of Allergy and Clinical Immunology, 135(4), pp. 956-963.e1. Available at: https://doi.org/10.1016/j.jaci.2014.10.021.
- Turner, P.J. et al. (2021) ‘Identifying key priorities for research to protect the consumer with food hypersensitivity: A UK Food Standards Agency Priority Setting Exercise’, Clinical & Experimental Allergy, 51(10), pp. 1322–1330. Available at: https://doi.org/10.1111/cea.13983.
- Verwaart, T. and Valeeva, N.I. (2011) ‘An Agent-based Model of Food Safety Practices Adoption’, in S. Osinga, G.J. Hofstede, and T. Verwaart (eds) Emergent Results of Artificial Economics. Berlin, Heidelberg: Springer (Lecture Notes in Economics and Mathematical Systems), pp. 103–114. Available at: https://doi.org/10.1007/978-3-642-21108-9_9.
- Young, I. et al. (2019) ‘Effectiveness of Food Handler Training and Education Interventions: A Systematic Review and Meta-Analysis’, Journal of Food Protection, 82(10), pp. 1714–1728. Available at: https://doi.org/10.4315/0362-028X.JFP-19-108.
Table 7: Model outputs, interaction models
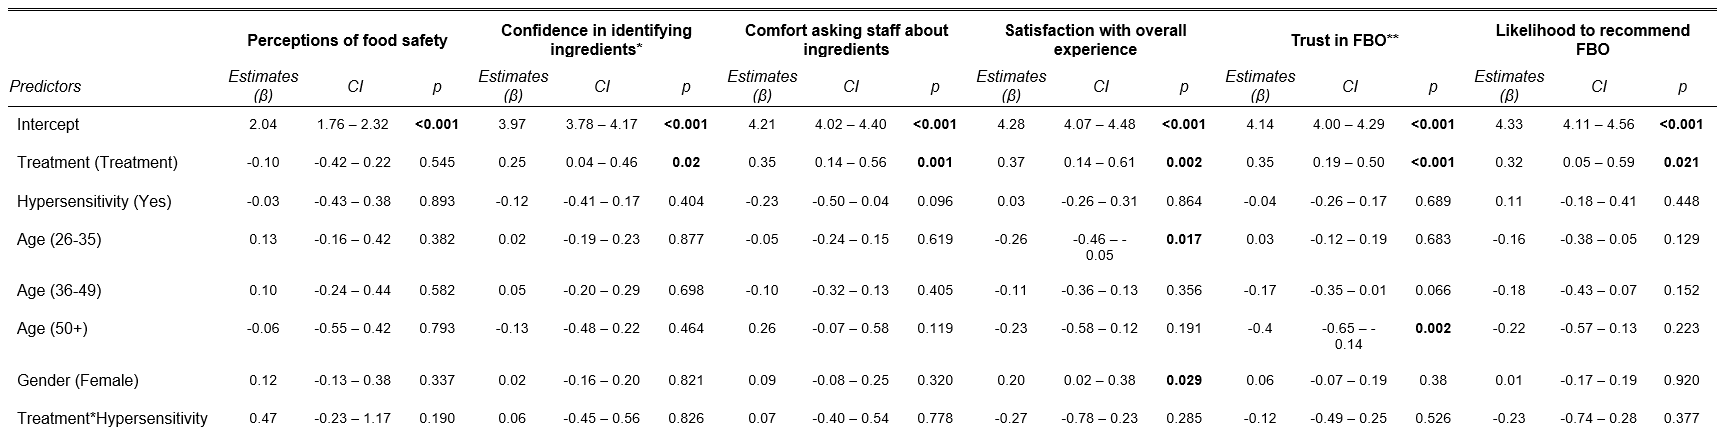
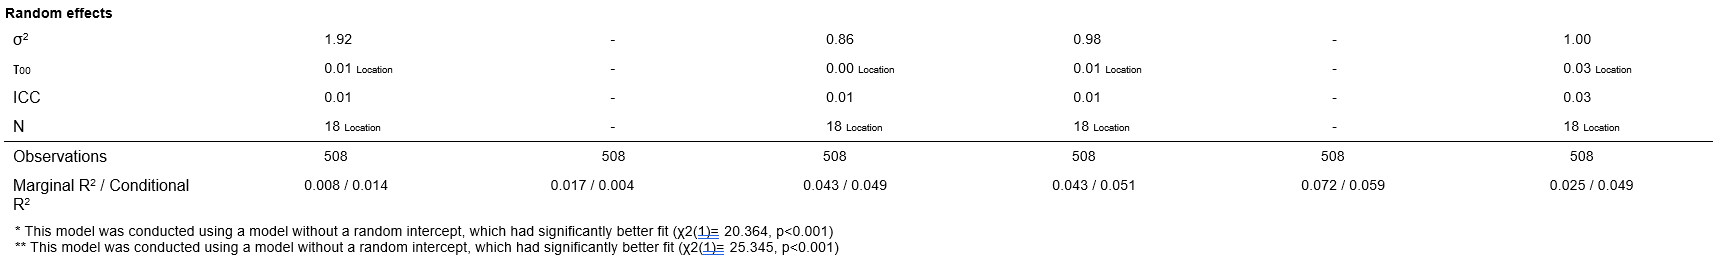
Table 8: Model outputs, intent-to-treat models (primary outcomes)
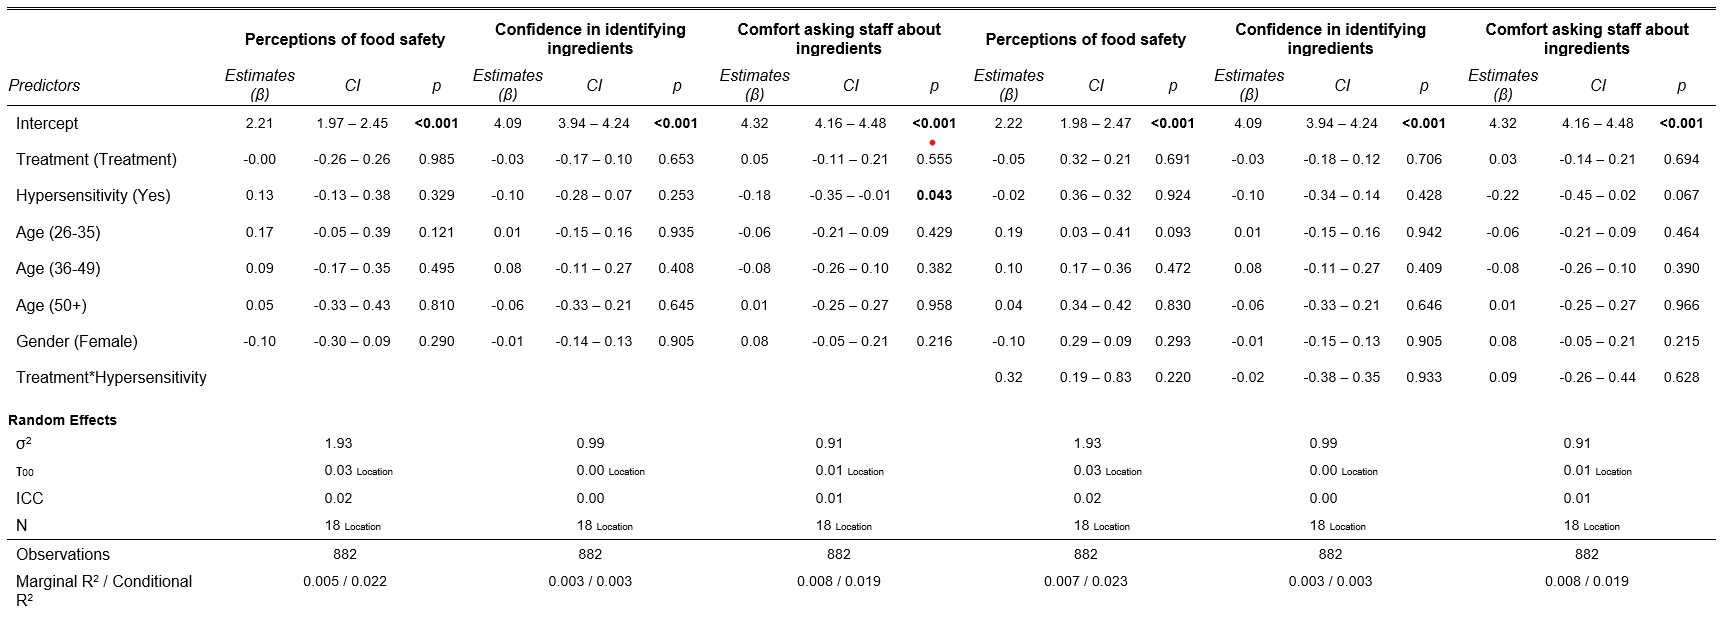
Table 9: Model outputs, intent-to-treat models (secondary outcomes)
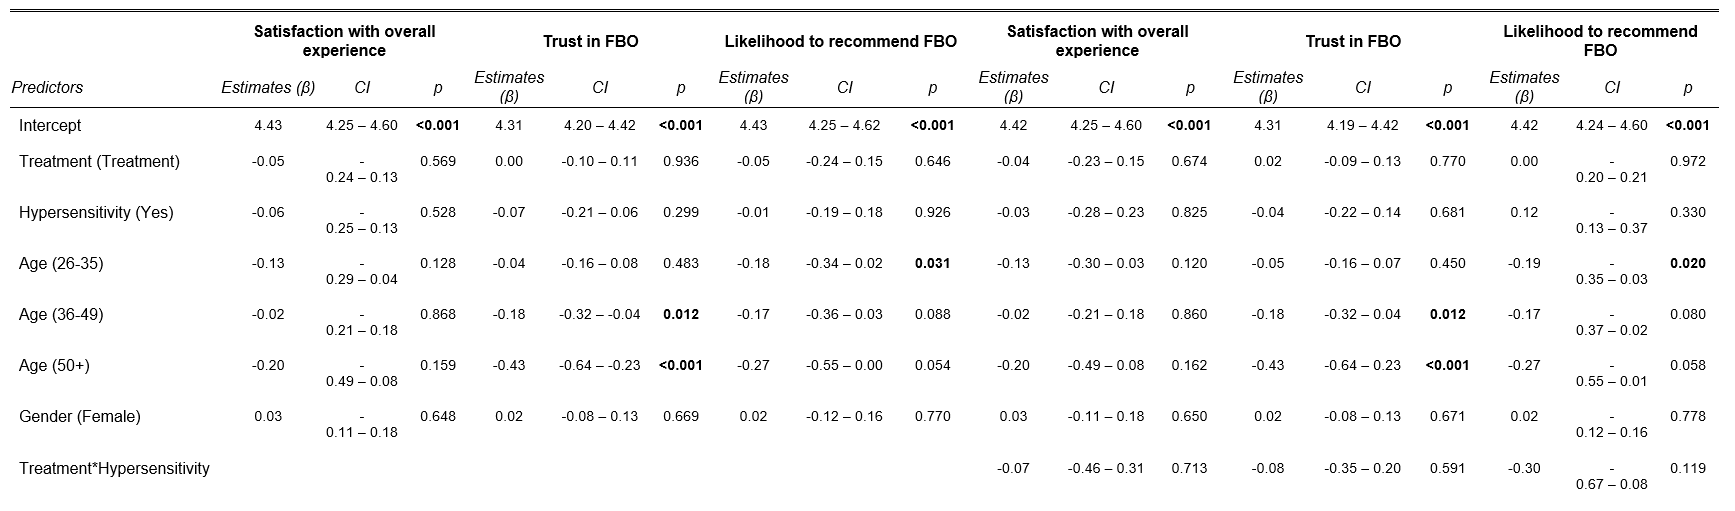
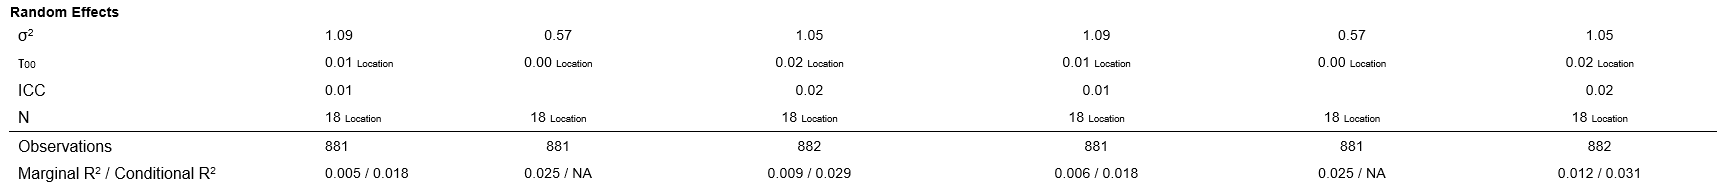
Table 10: Model outputs, interaction models II - Declaration of allergy or intolerance
| Predictors | Odds Ration | CI | p |
|---|---|---|---|
| Intercept | 0.01 | 0.00 to 0.04 | <0.001 |
| Treatment (Treatment) | 9.02 | 3.52 - 26.39 | <0.001 |
| Hypersensitivity (Yes) | 9.83 | 3.20 - 31.98 | <0.001 |
| Age (26 to 35) | 0.67 | 0.27 - 1.60 | 0.378 |
| Age (36 to 49) | 1.09 | 0.39 - 2.81 | 0.862 |
| Age (50+) | 3.28 | 0.95 - 10.45 | 0.049 |
| Gender (Female) | 1.42 | 0.70 - 3.01 | 0.341 |
| Treatment Hypersensitivity | 0.89 | 0.20 - 3.92 | 0.880 |
Observations: 508
R Tiur 0.231
* This model was conducted using a model without a random intercept, which had a better fit (AIC = 248.200, vs 250.207)
Table 11 Model outputs, intent-to-treat models (secondary outcomes II)
Introduction
Hi! Thanks for visiting [INSERT CHAIN NAME]. We’d like to ask you a few quick questions about your experience in our store today. After completing this survey, you can win one of 25 Love2Shop coupons worth £50 each.
Your participation will help to improve the way we serve people like you, your family and friends. Your answers will be kept completely anonymous and it should only take a minute of your time.
This study has undergone ethics review in accordance with the LSE Research Ethics Policy and Procedure. For more information about the study, you can read the Information Sheet here.
If you are under 16 years of age, please do not complete this survey.
If you have any concerns or complaints regarding the conduct of this research, please contact the please contact the LSE Research Governance Manager at research.ethics@lse.ac.uk.
Q1. Consent
Do you consent to take part in this survey?
1 Yes I consent
2 No I do not consent
Q2. Safety
How concerned or unconcerned are you about the safety of the food that is sold in [INSERT CHAIN NAME]?
1 Very unconcerned
2 Fairly unconcerned
3 Neither concerned nor unconcerned
4 Fairly concerned
5 Very concerned
Q3. Confidence
How confident are you that, if needed, you could identify any ingredients in the food or drink products at [INSERT CHAIN NAME]?
1 Not at all confident
2 Not very confident
3 Neither confident nor unconfident
4 Somewhat confident
5 Very confident
Q4. Comfort
How comfortable would you feel in asking a member of staff at [INSERT CHAIN NAME] for information about the ingredients in the foods or beverages they are selling?
1 Not at all comfortable
2 Not very comfortable
3 Neither comfortable nor uncomfortable
4 Somewhat comfortable
5 Very comfortable
Note: We randomised the order of questions 2, 3 and 4.
Q5. Allergy
Have you experienced either of the following adverse reactions after consuming certain foods or drinks, or do you have coeliac disease? Please select all that apply.
Allergy definition: A food allergy is a fast and potentially serious response to food by your immune system, triggering symptoms such as a rashes, wheezing and itching.
Intolerance definition: A food intolerance includes symptoms such as diarrhoea and stomach cramps caused by difficulties in digesting certain substances. However, no allergic reaction takes place.
1 I have experienced a food allergy
2 I have experienced a food intolerance
3 I have coeliac disease
4 None of these apply to me *Exclusive
Q6. Compliance
Thinking back to when you were served, did the [INSERT CHAIN NAME] employee ask you whether you have a food allergy or intolerance before you made your purchase?
1 Yes
2 No
Q7. Declaration
Thinking back to when you were served, did you declare an allergy or intolerance?
1 Yes
2 No
Q8. Gender
What is your gender?
1 Male
2 Female
3 Other
4 I prefer not to say
Q9. Age
How old are you?
1 16-25
2 26-35
3 36-49
4 50-65
5 66+
6 I prefer not to say
Q10. Satisfaction
How satisfied are you with your overall experience at [INSERT CHAIN NAME] today?
1 Very unsatisfied
2 Fairly unsatisfied
3 Neither satisfied nor unsatisfied
4 Fairly satisfied
5 Very satisfied
Q11. Trust
How much do you trust or distrust [INSERT CHAIN NAME] as a business responsible for the sale of food and beverages?
1 I distrust it a lot
2 I distrust it
3 I neither trust nor distrust it
4 I trust it
5 I trust it a lot
Q12. Recommendation
How likely are to you to recommend [INSERT CHAIN NAME] to your friends or family?
1 Very unlikely
2 Fairly unlikely
3 Neither likely nor unlikely
4 Fairly likely
5 Very likely
Note: We randomised the order of questions 10, 11 and 12
Email and consent
Many thanks for taking the time to complete this survey. Your answers will help us to improve food safety in the future.
If you would like to be entered into a prize draw to win 25 Love2Shop vouchers worth £50 each, please insert your email into the box below. If successful we will email you on the email address you provide below by [INSERT TIME OF OPENING DRAW]. We will only use your email address to send you the voucher and your email address will be stored securely. Your email address will also be stored separately from your survey responses to ensure anonymity. All data would be collected in accordance with strict data protection legislation and has been approved by a university Ethics Boards.
Each email address provided will only have one chance to win the draw. The draw will close on [INSERT TIME OF OPENING DRAW], at which point winners will receive an email to inform them they have won. If you have won a prize coupon, you will need to claim this within 14 days of notification.
To find out more about our privacy policy go to: https://uk.kantar.com/surveys.
If you consent to the terms and conditions of entry and to Kantar using your email for this purpose please click on "Yes" and provide your email below. If you would not like to be entered in the draw, please click on "No".
1 Yes I consent, my email address is *Open
2 No, I do not consent and/or do not wish to enter the competition.
Debrief
Thank you for submitting your answers, you have finished the survey and can close the browser window. We wanted to let you know the online survey aims to understand whether food business workers proactively asking about customer’s food allergies and intolerances improves customer safety and satisfaction in food businesses. It was created in a way that ensures we cannot identify anyone who has completed the survey. Given the importance of this study to maintaining food safety we would ask that you do not share this information with anyone who has yet to complete the survey. If you have any questions or concerns about this please email the Research Team at KPUKfeedback@kantar.com
Revision log
Published: 26 April 2023
Last updated: 12 April 2024