Research project
Optimising extraction and RT-qPCR-based detection of hepatitis E virus (HEV) from pork meat and products (HEVDETECT)
The aim of this project is to address the lack of standardised methods for the detection of HEV in pork meat and pork products.
Acknowledgments
The work in this report was conducted by Glasgow Caledonian University (GCU), Campden BRI (CBRI) and Jorvik Food and Environmental Virology (JorFEV). The contractors would like to thank the Food Standards Agency for the funding opportunity to execute the project and the support provided by the project co-ordinator Dr Victoria Cohen. We would also like to thank the technical teams at GCU for their commitment to this project, the partners for their participation in the ring trial and to all of the staff involved in the tender application and resulting final report.
Lay Summary
Hepatitis E is an infection of the liver caused by the hepatitis E virus (HEV). HEV infection usually produces a mild disease, hepatitis E. However, disease symptoms can vary from no apparent symptoms to liver failure. There are 4 main types (genotypes) of the virus that cause concern in humans. Genotypes 1 and 2 infections are mainly restricted to humans but 3 and 4 can be identified in numerous other animal species including pigs. Transmission routes of HEV genotypes 3 and 4 have been identified to include the consumption of food products derived from infected animals and shellfish, and via transfusion of infected blood products.
Hepatitis E infection is still an emerging issue in the UK and there is evidence to suggest an association of this virus with undercooked pork and pork products. Currently, there is no standardized method for evaluating the stability of HEV that may be present in food during cooking processes. There is also lack of a suitable method that can detect only infectious HEV.
The proposed project aimed to address a key gap in resources for methodology related to the detection of HEV in pork and pork products. Currently the lack of a standardised method for the detection of HEV has resulted in individual laboratories either utilising their own methods or adapting methods from previously published work. This leads to a high degree of variability between the interpretation of results and does nothing to progress or provide benefit to the food industry. By interrogating the existing published methods, the project sought to refine and optimise elements of existing protocols in order to enhance the performance characteristics of the method and to simplify the methodology wherever possible. The aim was to produce a validated method which is both robust and repeatable which can be easily integrated into food laboratories capable of performing virus related work.
Overall, the final method chosen was devoid of hazardous reagents and utilised easily accessible equipment. To verify the robustness of the method, an international collaborative trial was performed, with 4 UK and 3 European participant laboratories. The participating laboratories conducted analyses of pork liver samples artificially contaminated with various levels of HEV (including uncontaminated samples). The trial showed that the HEV DETECT method was just as reproducible between laboratories as it was repeatable within a laboratory.
It is envisaged that the developed system will be put forward as a suitable candidate for ISO certification as a standard method. The establishment of these methods in UK laboratories could result in the availability of independent testing services for both domestic and imported pork /pork-based products. The availability of this method is in essence innovation. This work is essential to industry to help support further research to ensure that public health safety and confidence in pork and other “HEV risk” food products is maintained and improved.
A critical review of published literature was performed, which compiled information on methods developed to detect HEV in foods, focussing on pork products. The most important information which was derived, was that there was one foremost candidate RT-PCR assay, used in many studies, which mediated detection of a broad range of HEV genotypes. Other information from the review included details of a variety of extraction methods for a range of matrices, and use of various SPCs.
Further to this, a review was undertaken to identify the most likely pork products consumed in the UK to select appropriate food matrices to test. In reviewing the data from the 3 datasets available, no conclusions could be arrived at with regard to specific product types consumed across the UK e.g., premium vs. economy pork sausages, salami, chorizo, hams etc. The general conclusion showed that pork sausages are one of the highest consumed products across the UK and consequently this matrix was included in the next phase of the project along with those identified in the literature to be the most likely source of HEV contamination.
The main aim of this project was to provide the FSA (and pork meat and related industries) with a means of evaluating the presence of hepatitis E virus in food products – something which has been difficult to do with any level of confidence thus far due to the absence of a standardised and validated method. The development / optimization of an extraction method from these complex matrices which are applicable for PCR detection is of major importance and can be used to incorporate new control measures into the pork industry’s food safety management plans. Since HEV will be internalized in the product e.g., in the sausage meat or liver, a non-destructive means of extracting the virus was essential. Likewise, the identification of a simple, safe and effective method was also an aim.
As previously indicated there are a number of different methods described and none are consistent. To address the specification to develop a simple and universal method, we aimed to work with current in-house methods adapted at both GCU and CBRI and compare them with each other, and to the best published protocols identified by Task 1 the literature search. In addition, the incorporation of a full suite of controls were to be included in the study as this was lacking in many of the previous reports. In summary, four protocols were tested; two in-house protocols from the partners GCU and CBRI, and two published protocols Martin-Latil et al (2014) and Di Bartolo et al (2015). In addition to the four protocols tested, 3 methods of RT-PCR detection were also used. The most appropriate method was determined via the effectiveness of recovery for the controls, for the target and the for the sample process control (SPC). Lack of inhibition in the RT-PCR, and the most cost effective, safe and simple method was also taken in to account. Overall, it was identified that the most appropriate method that met all criteria was the in-house GCU protocol. Extraction efficiencies were good in all food matrices tested and no hazardous reagents were utilised in the process. It was also shown that the use of a 2 step RT-PCR protocol gave the most consistent results. Based on these data, this method was developed as a standard operating procedure and prepared for the next stage of validation.
A collaborative trial of the final method was performed, with 4 UK and 3 European participant laboratories. Ideally, a collaborative trial should include more (at least 8) participants, but there was not a sufficient number of suitably experienced laboratories available for the trial. However, initially it was intended only to include the UK laboratories, therefore increasing the number of participants and consequently the trial data set represented added values to the project.
The participating laboratories conducted analyses of pork liver samples artificially contaminated with various levels of HEV (including uncontaminated samples). The resulting data set was statistically analysed by procedures established in several similar international collaborative trials to evaluate the robustness of molecular-based microbial detection methods. Among other parameters, the repeatability and reproducibility of the HEV DETECT method were evaluated by determining the accordance and concordance. In plain language, accordance is the probability of getting an identical result from two unknown samples analysed in the same laboratory, in other words the repeatability. The method was 82.2% repeatable for identification of HEV-contaminated samples, and 66.7% repeatable for identification of uncontaminated samples. Concordance is the probability of getting the same result from two identical samples, where one is analysed in one laboratory and the other is analysed in a different laboratory: in other words, reproducibility. The method was 69.6% reproducible for identification of HEV-contaminated samples, and 70% reproducible for identification of uncontaminated samples. Determination of the concordance odds ratios showed that he HEV DETECT method was just as reproducible between laboratories as it was repeatable within a laboratory.
Task 1 Objective 1: Critical review
A critical review of studies on development of reverse transcriptase polymerase chain reaction (RT-PCR) based detection of HEV in foods was conducted in the initial stages of the project. The review described published HEV detection methods, with emphasis on those which have been successfully used in subsequent studies and surveys. The review focused on pork products and similar foodstuffs (e.g. from boar), but methods for detection of HEV in shellfish were summarised in an annex. One hundred and five papers were included in the review.
Various sample treatment procedures have been published, but it was difficult during the review to identify the most optimal method. Sample treatment procedures generally involved homogenisation, followed by nucleic acid extraction. The most commonly used procedures appear to be based on either tissue grinding or cell disruption.
Particularly in more recent studies, a sample process control (SPC) to monitor the efficiency of the extraction procedure has been included in the methods. In most cases, the SPC was a non-target virus added extraneously to the sample. Various SPC viruses have been used e.g., FCV, MNV, bacteriophage MS2. Some commercial analyses are performed using mengovirus (MgV). These viruses may not accurately reflect the characteristics of HEV and the effects of the extraction procedure on the virus.
RT-PCR assays have been used both qualitatively and quantitatively. It is clear from the review that the HEV RT-PCR of Jothikumar et al. (2006) is the best assay for use as the basis of a standardised method for analysis of pork products. It has been used as the basis for several subsequent methods for HEV detection in pork products, and is widely used in laboratories performing HEV diagnostics (Baylis et al., 2013). The assay has been reported as being more sensitive than alternative RT-PCRs (Mokhtari et al., 2013), and is capable of detecting at least 7 HEV genotypes including gts 1-4 (Giron-Callejas, 2015). An efficient RNA IAC exists for use in this assay (Diez-Valcarce et al., 2011b), which could also be used for calibration.
The complete critical review formed Deliverable 2 of the project. The review was subsequently published (Cook et al., 2022).
Task 2 Objective 2: Compilation of market share and consumption data of pork products in the UK.
The aim of this review was to help identify specific matrices for use in the HEVDETECT project, to reflect the most consumed pork products in the UK.
Three sets of data were acquired. The first set was from the NDNS (National Diet and Nutrition Survey) covering 2008 – 2016 (Bates et al 2014; Bates et al. 2016 and Roberts et al. 2018). From this information, it was concluded that the majority of the meats consumed, both carcass and processed, are cooked before consumption, while other products are not, e.g. chorizo, pepperami, etc. It was not possible to derive from the data how much of each of the listed products are consumed.
The second dataset was derived from “Family Food datasets: countries and regions (CR) (updated with revised 2016/17 data and new 2017/18 data): Household purchases” (DEFRA, 2020), and shows the purchased quantities of household food & drink by Government Office Region and Country. These data show that uncooked pork sausages; cooked bacon and ham and uncooked bacon and ham rashers account for the majority of weekly purchases across all countries in the UK, followed by uncooked ham and bacon joints. The highest incidence of cases of HepE is in the South East and South West, which appears to coincide with the largest consumption of pork sausages. Indeed, it has previously been shown that the increased autochthonous incidence was first recognised in the S. West (Dalton et.al 2007). Further detailed statistical regression analysis is required to identify if any particular product is related in this data set.
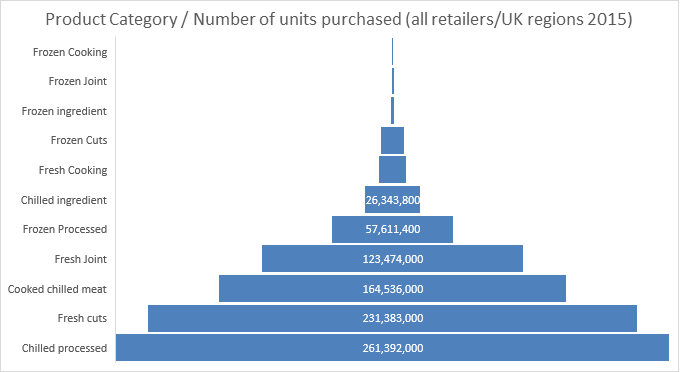
The third dataset was obtained from Kantar UK – a data, insights and consulting company - and details the purchase of pork products by UK retailers during the year 2015 (kindly provided by Food Safety Scotland). This data set was not considered to be very useful, as there was no detailed breakdown of product type, and it related to purchased units of pork products by retailers, reiterating that the main types of products purchase fell into the chilled processed category.
In reviewing the data from the 3 datasets available, no conclusions could be arrived at with regard to specific product types consumed across the UK e.g., premium vs. economy pork sausages, salami, chorizo and hams. The general conclusion showed that pork sausages are one of the highest consumed products across the UK and consequently this matrix was included in the next phase of the project. The complete review of UK consumption data for pork products comprised Deliverable 3 of the project. The full report is in Appendix A.
Task 3 Objective 3: Development of an optimised HEV extraction procedure which delivers at least 1% efficiency of virus recovery, with a high level of consistency.
Following the information contained in the critical review (Deliverable 2), practical trials comparing the four selected viral RNA extraction protocols were carried out. The objective was to identify which method produced the greatest RNA yield recovery.
The matrices which were chosen were identified by the consumption data review (Deliverable 3).
3.1 Food selection and protocols
The first selected food matrices were sausages and pâté. Table 1 contains the information on the key ingredients that may affect the extraction efficiency. No minimum of porcine content was set as it is considerably variable.
Table 1: Key of food source and content of fat, carbohydrate, protein and porcine meat content as percentages.
| Food source | Fat (per 100g) | Carbohydrate (per 100g) | Protein (per 100g) | Porcine Meat % |
|---|---|---|---|---|
| Low Grade Sausage (LGS) | 14.3g | 13.9g | 13.5g | 53% |
| High Grade Sausage (HGS) | 21.9g | 8.9g | 16.6g | 72% |
| Smooth Brussels Pâté (SBP) | 22.5g | 8.6g | 9.6g | 32% |
Both GCU’s and Campden BRI’s own in-house protocols were tested as well as two described in the literature, Martin-Latil et, al, (2014) and Di Bartolo et al. (2015). These protocols are described in brief below:
3.2. Martin-Latil et al; (2014)
The protocol was followed as previously described by Martin-Latil et al, (2014) with the exclusion of the Mengovirus control. In brief, each 30mg sample was homogenised in 0.3ml of PBS using a stomacher apparatus and virus precipitated with 10% PEG 6000 and 0.3M NaCl. The sample was then centrifuged at 8000g for 30min at 4°C. The pellet was then resuspended in 100ul of PBS and vortexed with 1 mL of chloroform:butanol, 1:1 (v/v) to remove inhibitory substances from the virus extract. The suspension was then incubated for 5 min at room temperature, and centrifuged at 8000 g for 15 min at 4 °C. The upper aqueous phase containing the viruses was directly processed using the QiaAmp viral RNA kit according to the manufacturers protocol.
3.3. GCU in-house protocol
30mg (±2mg) was excised from sections of various pork meat products and spiked with 20,000 IU hepatitis E virus. Samples were then placed into tubes containing sterile glass beads and 600µl Buffer RLT from the Qiagen RNeasy kit. Each meat sample was homogenised at 50Hz for 2.5 minutes in the Qiagen TissueLyser LT. To remove debris, centrifugation (10,000 x G, 20 min 4°C). Succeeding tissue homogenisation, a Qiagen RNeasy kit was used to extract the total RNA content from all homogenates according to the manufacturer’s instructions.
3.4. Di Bartolo et al. (2015)
250mg (±2mg) was excised from sections of various pork meat products and spiked with 20,000 IU hepatitis E virus. Samples were then placed into tubes containing sterile glass beads and 600µl Buffer RLT from the Qiagen RNeasy kit. Each meat sample was homogenised at a speed 4ms-1 for 40s in the Qiagen TissueLyser LT and allowed to stand for 10 mins at room temperature. Following tissue homogenisation, a Qiagen RNeasy kit was used to extract the total RNA content from all homogenates according to the manufacturer’s instructions.
3.5. Campden BRI in-house protocol
During this protocol, 2g was excised from sections of various pork meat products and spiked with 20,000 IU hepatitis E virus. Samples were then placed into IKA tubes containing 7ml of Trizol and subsequently homogenised for 6x 50s using an IKA Drive. Samples were then transferred to a 15m falcon tube and centrifuged at 10,000 g for 20 mins. 500ul of supernatant was then taken from the supernatant and taken forward for RNA extraction. RNA extraction was carried out using a Biomerieux Nuclisens Magnetic silica extraction kit according to manufacturers’ instructions.
3.6. Detection of HEV by RT-qPCR
In addition to analysing various homogenisation and extraction techniques, 3 different Q-PCR protocols were tested to assess viral recovery. A primer set and cycling conditions were adopted from Jothikumar et. al (2006) and was used in conjunction with the Promega one step RT-PCR assay (Thermofisher Scientific) and the Qiagen viral Quantitect (Qiagen) for both one and two step formats respectively.
For the one step assay, in brief, 5ul of vRNA was added to the mastermix in a final volume of 25ul. Cycling conditions were; 45min at 45C to allow for conversion into cDNA, then 95C for 15 minutes followed by 45 PCR cycles of: 95C for 10 seconds; 55C for 20 seconds and 72C for 15 seconds.
For two step RT-PCR assay, cDNA synthesis was undertaken with the use of Invitrogen Superscript III (Thermofisher Scientific) and was followed according to the manufacturer’s protocols. In brief, 2ul of vRNA was mixed with 2pmol of gene specific primers, dNTPs and nuclease free water. Samples were heated to 65°C for 5min then incubated on ice for at least 1min. To this, first-strand buffer, 0.1M DTT, RNase inhibitor and Superscript III RT were added as indicated by the instructions. The sample was incubated at 25°C for 5mins, then heated at 50°C for 45min. Reaction was inactivated by heating at 70°C for 15min. Amplification of the cDNA was carried out using the Quantitect PCR kit (Qiagen). Cycling conditions were identical to that of the Promega assay with the omission of the 45min incubation at 45°C.
The third assay additionally used to test all extracted viral RNA was a commercial CEERAMTM tools Hepatitis E Virus detection kit (Thermofisher Scientific). and was followed according to the manufacturer’s protocol (FT-KHEV-AN (thermofisher.com)( PU-KHEV-AN (thermofisher.com). In brief, 5ul of viral RNA was added to the assay and cycling conditions were 10min at 45°C followed by 10min at 95°C then 40 cycles of 95°C for 15sec and 60°C for 45sec.
All RT-qPCR assays were quantified using HEV WHO international standards PEI and a synthetic RNA oligo (Integrated DNA Technologies). A DNA positive and negative control was also utilised in all RT-qPCR assays.
3.7. Results
3.71 Evaluation of three methods of PCR detection across all protocols selected.
Three types of pork foods were spiked with ~20,000 IU/ml of faecally derived hepatitis E virus (kindly provided by F Steinbach; APHA). Low grade sausage (LGS - low % pork meat), High grade sausage (HGS – high % pork meat) and Smooth Brussels Pâté (SBP) were spiked with HEV prior to homogenisation and extraction. The four methods, as described in section 3.2 – 3.5, were carried out and the isolated HEV viral RNA was then quantified using the three different RT-qPCR assays. Additionally, sample process controls were utilised and introduced before homogenisation (PBSV1 &2) and after homogenisation (PBSV3). No virus controls were also utilised to ensure there was no infected tissue prior to spiking.
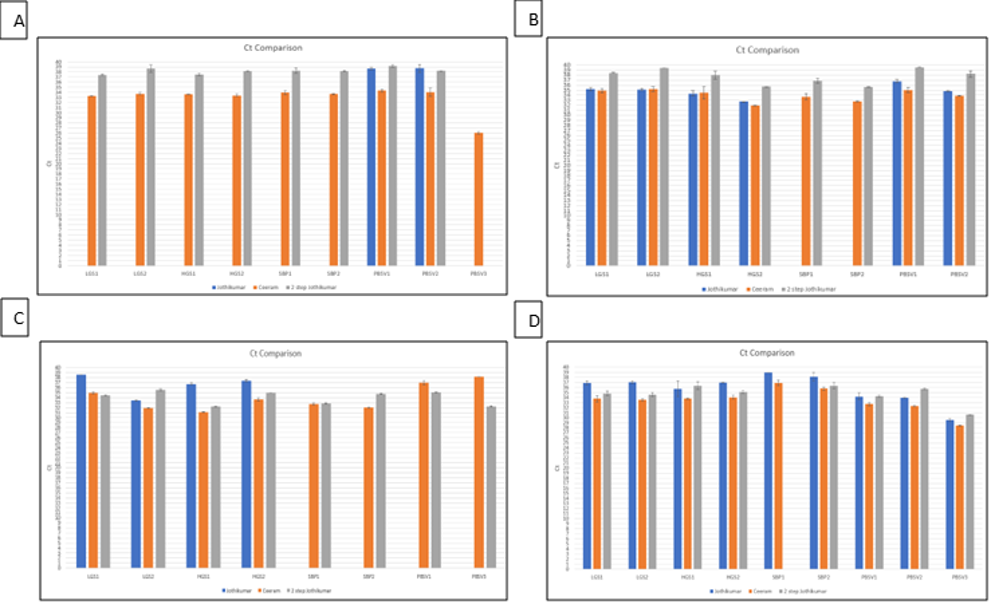
Comparison of assay Ct values found that all four protocols showed consistent recoveries across all types of samples tested but were not always detected by all of the RT-qPCR assays (Figure 1 A-D). The commercial CeeramTM HEV detection kit gave slightly lower Ct values than that of the 1 and 2-step RT-qPCRs, but consistently demonstrated a positive value for each assay as did the 2-step RT-qPCR, with the exception of PBSV3 (Figure 1A). The 1-step assay frequently showed a lack of detection in three of the four protocols. Only CBRI protocol gave consistent detection using all PCR methods (Figure 1D). This suggested that the 1-step assay may not be as consistent as the other two and that the commercial Ceeram assay was most likely to detect viral RNA.
Figure 1: Detection of HEV post extraction by RT-qPCR HEV. Values are represented as cyclic Thresholds (Ct). Ct of HEV RNA isolated (A) using Martin-Latil et al. (2014) protocol, (B) using GCU protocol. (C) using Di Bartolo et al. (2015) protocol and (D) using Campden BRI protocol. RNA extracted from each protocol was tested using 3 different RT-qPCR assays: 1-step (Blue); Ceeram (Orange) and 2-step (Grey).
3.72 Evaluation of percentage recovery of HEV in the protocols selected.
Recovery of viral RNA was presented as a percentage of the input virus to establish that the >1% recovery detection was met by the protocols used, including the detection method. Prior to this, the average percentage recovery for PBSV1 and PBSV2 was evaluated. PBSV1 was the control for the homogenisation and extraction protocol where we wanted to establish the recovery of both HEV and the SPCV post treatment. PBSV2 was the control where the samples were not subjected to any homogenisation or extraction and were a direct recovery of the virus input which essentially should be circa 100%. Figure 2 summarises the data for the PBSV controls for each protocol and each PCR method.
Figure 2: PBSV average percentage recovery for HEV and SPCV for all protocols and detection methods.
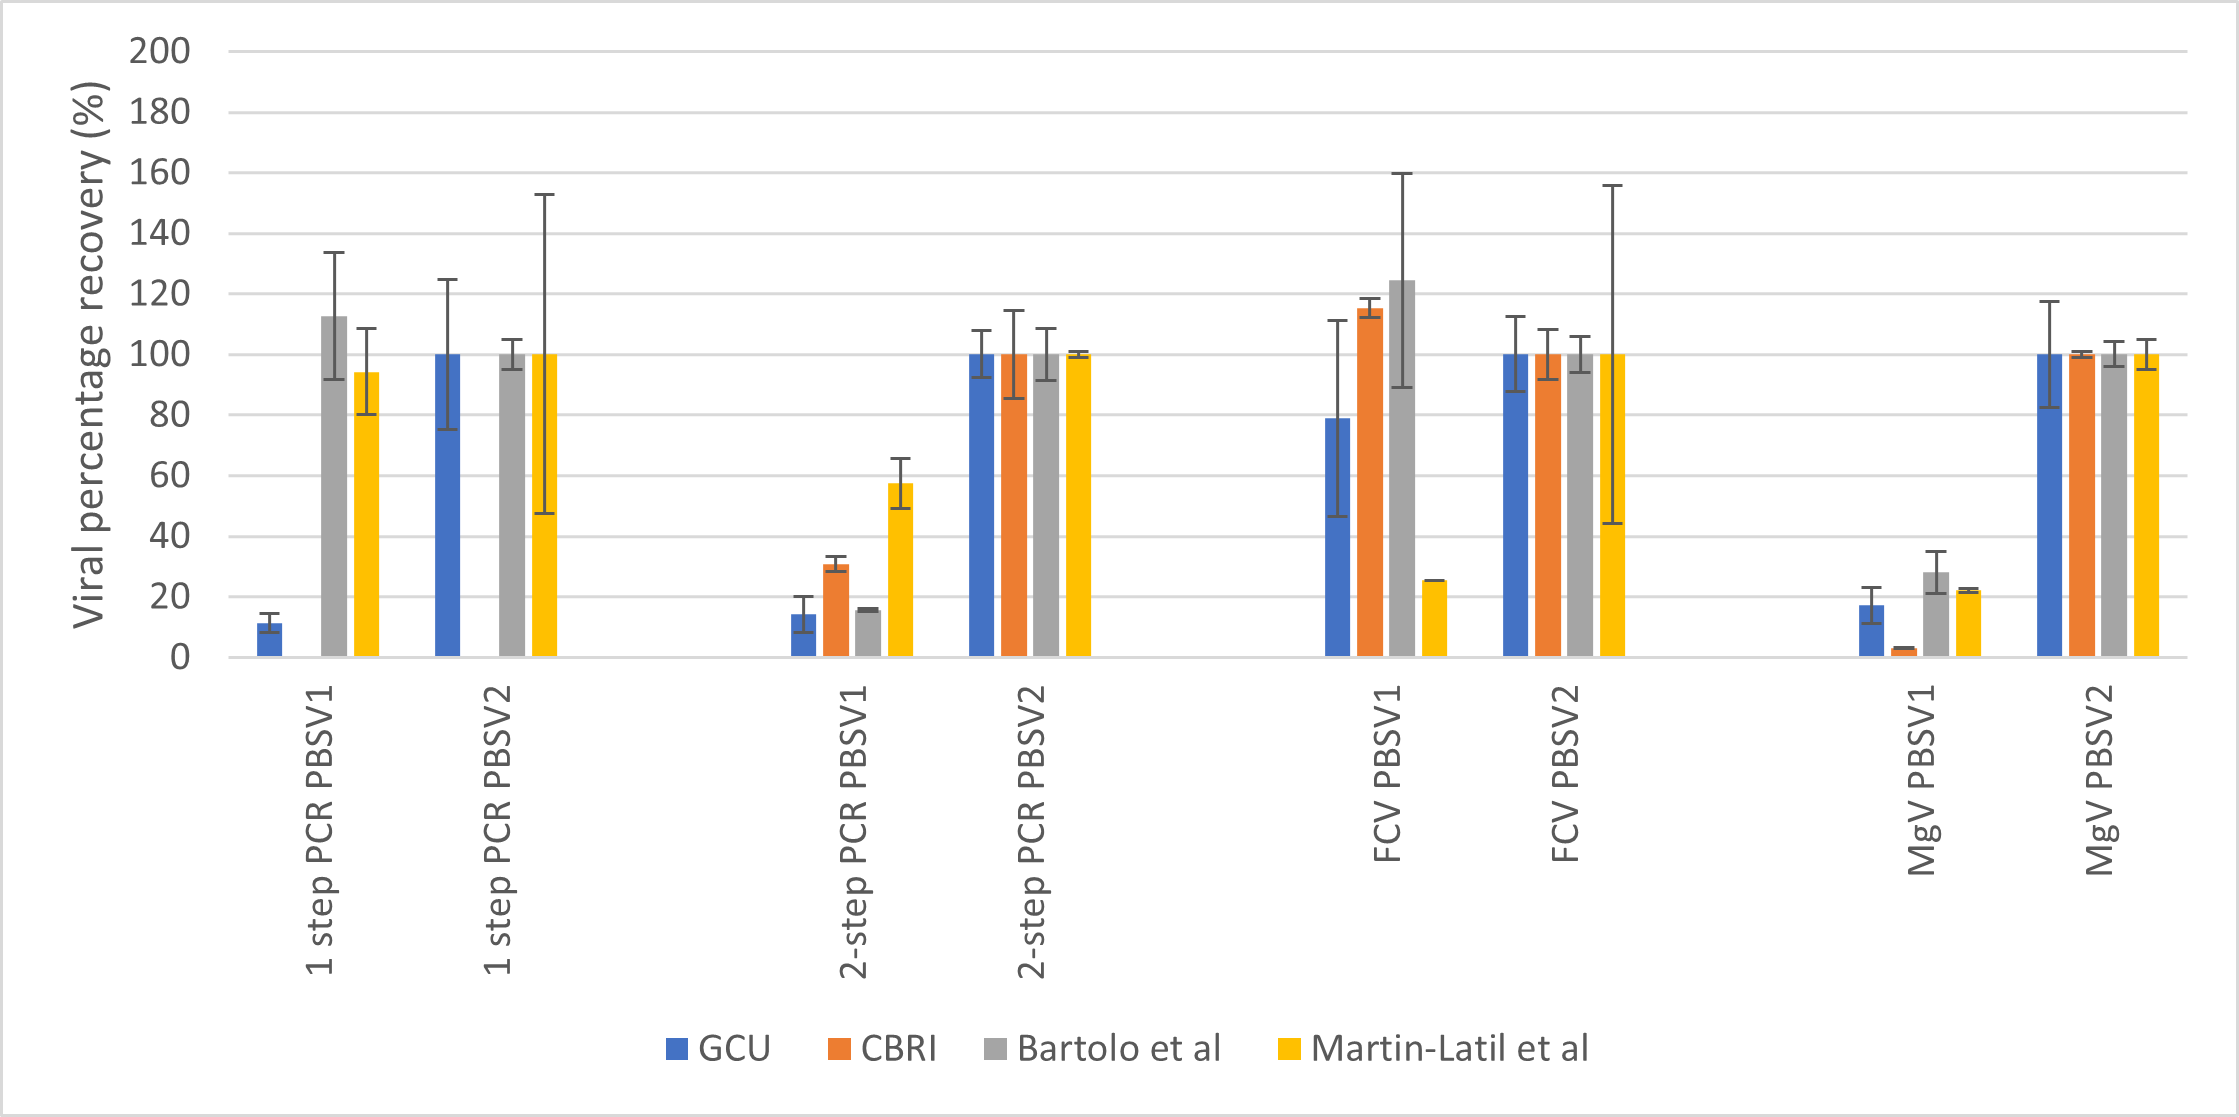
In summary, it was found that again, the 2 step PCR method was the most effective and consistent at detection of HEV. Martin-Latil, et al (2015) gave the best recovery post extraction with the other three methods equivalent. The 2 step PCR method also gave the most accurate return on the 100% PBSV2 values for all protocols and a >1% recovery for all protocols after extraction. For the SPCVs, FCV recovery was poor for the method by Martin Latil, et al (2015) and MgV recovery was the poorest for the in-house CBRI protocol. In terms of utilising FCV or MgV as SPCV controls, the methods by GCU and Di Bartolo et al, (2014) were deemed the best in order to permit a choice for others using the assay.
Table 2 summarises the data and recovery values for each of the four protocols. All protocols exceeded the >1% threshold required. However, there were inconsistencies noted in the combinations of extraction and detection. For example, the GCU protocol worked best with the commercial assay, as did all of the assays with the Martin-Latil et al, (2014) protocol giving the highest percentage recovery of virus compared to input material albeit there were several anomalies in the data sets. The 1-step RT-qPCR frequently gave no value suggesting that it is not very reproducible. The 2-step RT-qPCR also worked well in all protocols with a few exceptions. Overall, the commercial assay was deemed the best detection protocol on this basis, however, costs are prohibitive if this is to be an assay that is accessible to all.
In conclusion, the one step PCR was not suitable for consistent detection based on the data. The CeeramTM assay was the most consistent but the cost for general use is prohibitive and the aim was to identify a simple cost-effective detection method.
All methods performed well with the 2 step PCR protocol. One aim was that the final protocol should not include any hazardous reagents and should have the simplest method to allow it to be utilised by any end user. Based on this, the GCU, Di Bartolo, et al (2015), and Martin-Latil, et al (2014) were considered the safest extraction procedures. However, the latter protocol did not show good recovery for the SPCV. A full assessment of HEV recovery was carried out on all four protocols for comparison (Appendix B), however, the data for the in-house GCU protocol and that by Di Bartolo et al, (2015) are reported here for comparison (Table 2).
Table 2: HEV recovery from pork sausage (high and low grade) and smooth pâté using four extraction and three different detection methods. All assays were repeated twice as two biological replicates then technical replicates in the PCR (n=2).
| Protocol | Source | Extraction buffer | 1 step RT-qPCR Mean CT ad SD | 2-step RT-qPCR Mean CT and SD | Ceeram Mean CT and SD | 1 step RT-qPCR % recovery | 2 step RT-qPCR % recovery | Ceeram % recovery |
|---|---|---|---|---|---|---|---|---|
| GCU | Low grade Pork sausage 1 | RLT lysis | 35.184/0.338 | 38.438/0.118 | 34.871/0.382 | 64.16 | 27.72 | 5.49 |
| GCU | Low grade Pork sausage 2 | RLT lysis | 35.154/0.224 | 39.402/0.000 | 35.243/0.485 | 65.05 | 12.67 | 4.23 |
| GCU | High grade Pork sausage 1 | RLT lysis | 34.333/0.510 | 37.995/0.772 | 34.461/1.264 | 124.5 | 43.54 | 8.85 |
| GCU | High grade Pork sausage 2 | RLT lysis | 32.715/0.049 | 35.691/0.005 | 31.968/0.041 | 407.5 | 256.33 | 44.74 |
| GCU | Smooth Brussels Pâté 1 | RLT lysis | 0/0 | 36.867/0.484 | 33.738/0.651 | 0.000 | 102.63 | 13 |
| GCU | Smooth Brussels Pâté 2 | RLT lysis | 0/0 | 35.622/0.025 | 32.777/0.039 | 0.000 | 271.1 | 24.79 |
| Di Bartolo et al (2015) | Low grade Pork sausage 1 | RLT lysis | 38.547/0 | 34.423/0.096 | 34.948/0.118 | 9.82 | 122.39 | 8.94 |
| Di Bartolo et al (2015) | Low grade Pork sausage 2 | RLT lysis | 33.452/0.067 | 35.521/0.199 | 31.945/0.012 | 355.75 | 59.62 | 64.59 |
| Di Bartolo et al (2015) | High grade Pork sausage 1 | RLT lysis | 36.713/0.220 | 32.260/0.005 | 31.135/0.042 | 35.97 | 508.27 | 110.37 |
| Di Bartolo et al (2015) | High grade Pork sausage 2 | RLT lysis | 37.411/0.199 | 34.933/0.000 | 33.669/0.246 | 21.97 | 87.41 | 20.82 |
| Di Bartolo et al (2015) | Smooth Brussels Pâté 1 | RLT lysis | 0.000/0.000 | 32.849/0.097 | 32.709/0.174 | 0.000 | 345.11 | 39.13 |
| Di Bartolo et al (2015) | Smooth Brussels Pâté 2 | RLT lysis | 0.000/0.000 | 34.709/0.044 | 32.033/0.074 | 0.000 | 101.3 | 60.98 |
3.73 Evaluation of recovery in additional pork products.
Five types of pork meat were spiked with ~20,000 IU/ml of faecally derived HEV, 3.25x10⁶ pfu/ml FCV/MS2 and 2.76x10⁵ pfu/ul of Mengovirus. The following meats were Low grade sausage (LGS), High grade sausage (HGS) and Smooth Brussels pâté (SBP), Porcine Liver (LIV) and Salami (SAL). Succeeding the spiking of the different meat samples, the two different homogenisation/RNA extractions techniques were undertaken (Figures 3 and 4). The isolated HEV viral RNA was then quantified, again, using the two different RT-qPCR assays.
Figure 3: Percentage recovery of HEV in 5 different pork derived products using the in-house GCU protocol. LGS = low grade sausage, HGS = high grade sausage, SBP = smooth brussels pate, LIV – liver, SAL = salami; PBSV1= samples spiked with SPCV and HEV then homogenised and extracted and PBSV2 = no homogenisation or extraction treatment. FCV and MgV (Mengo)represent the two SPCV controls spiked in with the samples. Error bars indicate the SD (n=4).
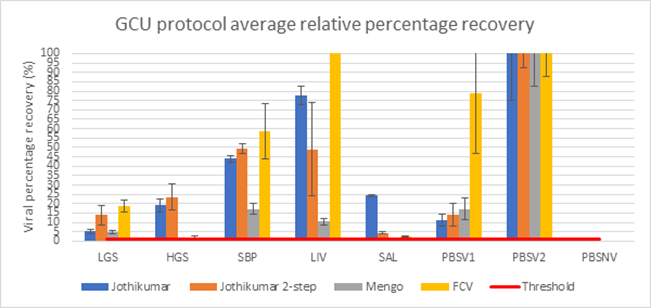
Figure 4: Percentage recovery of HEV in 5 different pork derived products using the protocol by Di Bartolo et al (2015). LGS = low grade sausage, HGS = high grade sausage, SBP = smooth brussels pate, LIV – liver, SAL = salami; PBSV1= samples spiked with SPCV and HEV then homogenised and extracted and PBSV2 = no homogenisation or extraction treatment. FCV and MgV represent the two SPCV controls spiked in with the samples. Error bars indicate the SD (n=4).
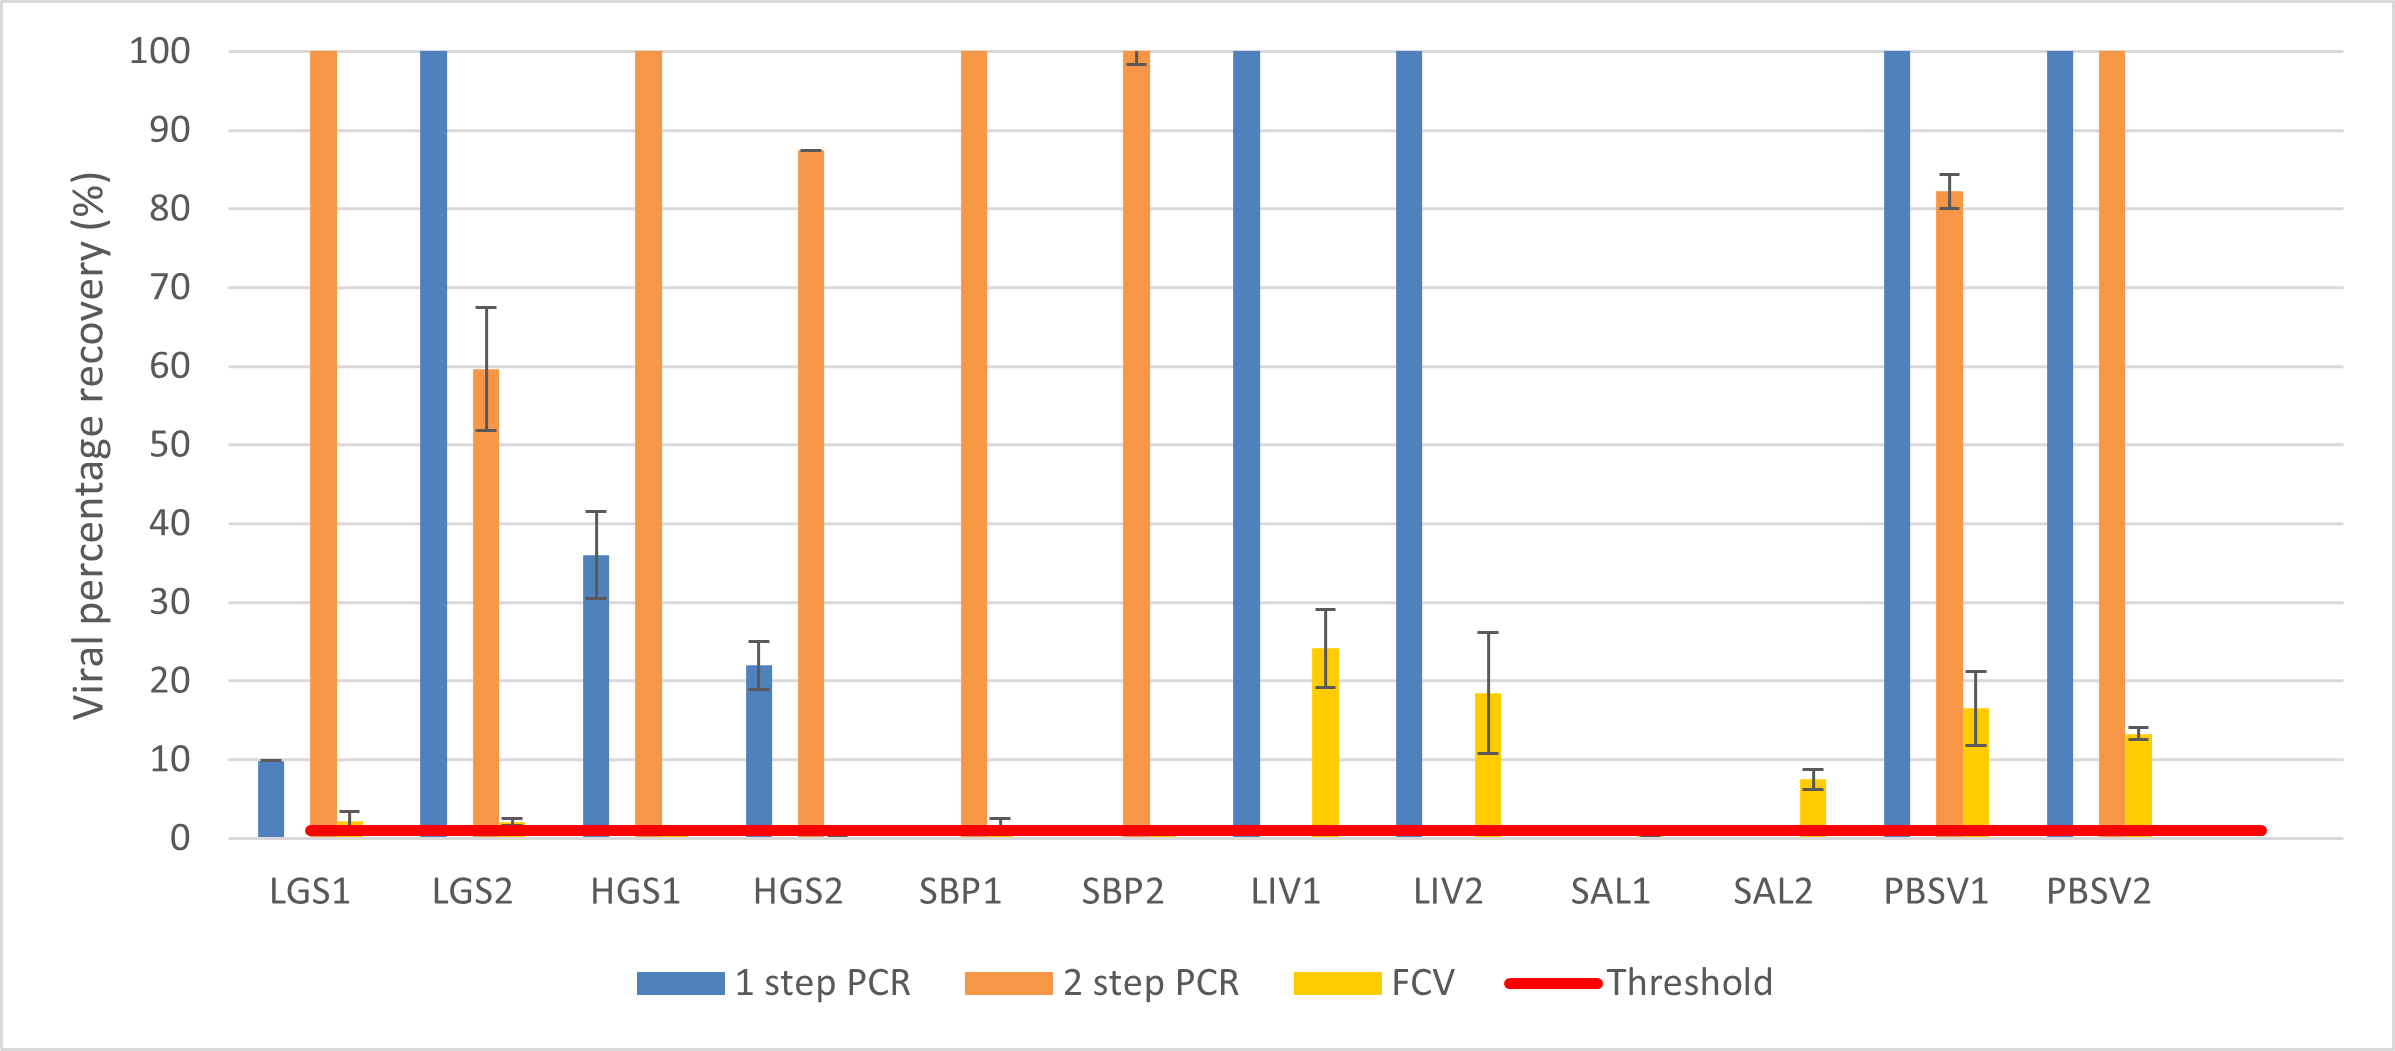
For the further analysis using pork liver and salami, in-house GCU protocol showed recovery for HEV above the threshold of 1% in all foods tested for both PCR methods. In comparison, the method by Di Bartolo et al (2015) gave no recovery in the salami homogenate for either PCR method and in the liver homogenate, only the one step PCR method gave a recovery.
In terms of recovery of virus, we see variable results across the literature with the reporting not always consistent. This made it difficult to determine the best assay without a direct comparison in a number of pork derived food products.
More recent reports show that the use of ultracentrifugation and filtration can aid recovery (Harrison et al, 2021), however, some of these approaches are not accessible to all. In terms of recovery, the in-house GCU protocol gave an average of 15% for LGS, 22% for HGS, 47% for SBP, 48% for liver and around 5% for salami. Due to the variability in reporting in the literature it is not always possible to compare recoveries, however, compared to previously reported recoveries, these are considered high (Table 3).
Table 3. Example published methods for detection of HEV in pork products presented as percentage recovery. PBS = phosphate buffered saline; RLT =RNeasy lysis buffer (supplied by Qiagen).
| Reference | Meat Source | Extraction Buffer | Virus Concentration Step | HEV Recovery % | SPCV Recovery % |
|---|---|---|---|---|---|
| Colson et al, 2010 | Wild boar | PBS | No | 0.6 | ND |
| DiBartolo et al, 2012 | Pork sausage | RLT Lysis | No | 0.04 | ND |
| DiBartolo et al, 2015 | Pork sausage | RLT Lysis | No | ND | 18 |
| Martin-Latil et al, 2015 | Figateli/sausage | Distilled Water | Yes | 13.1/2.9 | 18.4/3.9 |
| Szabo et al, 2015 | Pork sausage | Trizol | Yes | 4.9 | 11.2 |
Consumption of pork products that may contain raw elements and the ability to detect HEV in these food matrices is of high importance. Indeed, due to the complex nature of these matrices it is anticipated that a higher recovery would be seen in more homogeneous matrices. Szabo et al, (2015) demonstrated recovery from raw salami sausage however the method utilised chloroform and Tri reagent in the protocol (Szabo et al, 2015). Our aim here was to ensure the design of a protocol with a full suite of controls without any hazardous reagents.
Overall, this confirmed that the protocol being taken forward to Task 5 would be the GCU protocol as it was the most consistent and demonstrated detection of HEV in all food homogenates tested.
Task 4 Objective 4: Development of an optimized, quantitative RT-PCR assay for detection of HEV, incorporating a full suite of controls
To ensure that all assays and methods developed were fully controlled we have specified those that must be included in any extraction and detection assay. It was clear from Task 3 that the use of a 2 step PCR assay would be the most cost effective and consistent. The addition of SPCV also controlled for loss of material during the extraction process. In addition to the negative controls, an important analytical control in molecular amplification-based methods is an internal amplification control (IAC), which should be included in each reaction mixture. An IAC is a nontarget nucleic acid sequence which is coamplified simultaneously with the target sequence. This is necessary to provide an internal PCR control for inhibition. The IAC was designed based on Diez-Valcarce et al (2011). The IAC was then tested for amplification and a dilution curve created to determine the LOD (Figure 5). For future PCRs, the IAC was used to give a Ct 33-36.
Figure 5:
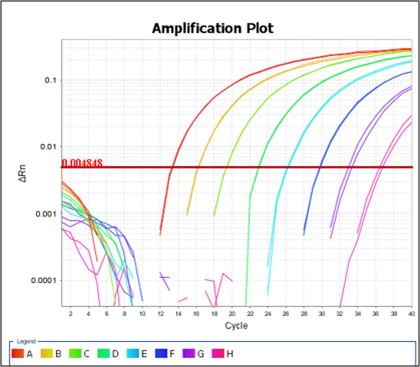
The IAC was also assessed to ensure that it functioned in the presence of food extracts and there was no detrimental effect on virus detection.
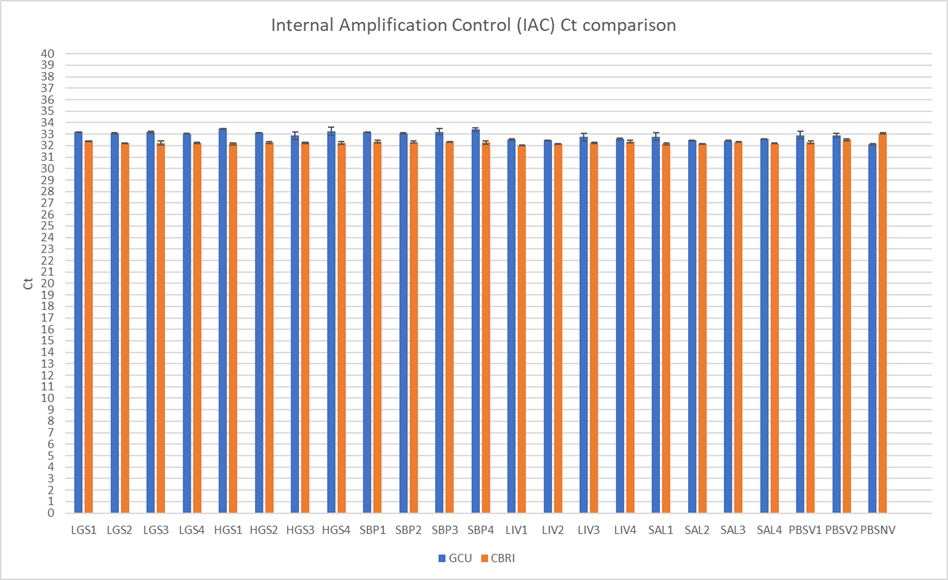
All samples were run with and without an IAC post extraction on the PCR (Table 4A and B). The selected method was tested with the IAC along with another method to confirm that the IAC was indeed suitable for use. (Figure 6). The IAC gave consistent results in both methods assessed and confirmed that it was suitable for use in task 5.
Table 4A: Ct values for HEV detection in liver sample with and without the IAC present. NTC = no template control. Liver 1 and 2 are biological replicates. The mean Ct is calculated from technical replicates for each onen=2).
| Sample ID | Mean Ct HEV 1 | Mean Ct HEV 2 | Mean Ct IAC 1 | Mean CT IAC 2 | Mean Ct MgV 1 | Mean Ct MgV 2 |
|---|---|---|---|---|---|---|
| Liver 1 | 35.92 | 35.54 | 36.11 | 33.96 | 34.23 | 32.57 |
| Liver 2 | UD | 33.58 | 34.47 | 33.88 | 33.31 | 32.31 |
| NTC | UD | UD | 34.04 | UD | UD | UD |
Table 4B: Confirmation of MgV SPCV standard curve values. R2 =0.96. All NTC were UD.
| MgV dilution | Mean Ct |
|---|---|
| 10% | 23.35 |
| 1% | 25.82 |
| 0.1% | 29.07 |
| 0.01% | 32.55 |
Overall, the IAC was found to have no impact on the HEV detection or that of the SPCV. One of the liver samples gave no signal in the PCR (Liver 1 PCR replicate 1). These samples had been previously freeze-thawed so it was suspected that it may be due to loss of virus in this process that gave a negative result in the assay. This IAC showed that the homogenisation and extraction method did not result in the presence of any inhibitors from all 5 food sources and was taken forward for use in Task 5.
Figure 6: Effect of IAC on amplification of the target using two methods; the in-house GCU and CBRI protocols.
Task 5 Objective 5: Inter-laboratory evaluation of the method.
To verify that the final method was repeatable and reproducible, a collaborative trial was performed with partners from the UK and Europe. In the trial, the samples were pig liver spiked with HEV genotype 3. The trial was conducted “blind” by each participant. Seven laboratories participated in the trial. They comprised Fera Science Limited (Fera, UK), Campden BRI (CBRI, UK), Animal and Plant Health Agency (APHA, UK), Glasgow Caledonian University (GCU, UK), Istituto Superiore di Sanita (ISS, Italy), University of Burgos (UoB, Spain) and The French Agency for Food, Environmental and Occupational Health and Safety (ANSES, France). Each participant was provided with a personalised standard operating procedure (SOP) for performance of this trial.
Trial materials comprised pork liver artificially contaminated with HEV at three levels - . 6 x 10⁴ genome copies (gc) HEV (HIGH level), 6 x 10³ gc HEV (MEDIUM level), and 6 x 10² gc. HEV (LOW level). Uncontaminated (BLANK) liver samples were also included. All samples contained 6.71 x 10⁶ gc MgV as SPCV.
Each participant was sent extraction and RTPCR reagents necessary to perform the method. The trial materials were couriered on dry ice to the participants.
Raw data were reported by each participant to the trial coordinators, who translated the codes and analysed the data. The trial coordinators checked each participants data including the log and linear amplification plots for the HEV assay (including the IACs), the log and linear amplification plots for the MgV assay and the instrument data (where possible). The checks were performed to ensure only reaction signals indicative of correct amplification were included in the subsequent evaluation. No Ct cut-off criterion was applied. Interpretation of the results followed the principles outlined by D’Agostino et al. (2011). When a participant reported at least one of the replicates for the HEV assay (Neat and 1:10) was positive, the sample was recorded as HEV-positive. When a participant reported that all replicate HEV assays (Neat and 1:10) were negative, but the IAC and the MgV were detected, the sample was recorded as HEV-negative. If the MgV or the IAC were not detected in a HEV negative sample, the analysis was recorded as having failed. If a positive HEV signal was found in the PCR-ve control, then that participant’s results were excluded from the trial.
The data were statistically analysed according to the recommendations of Scotter et al. (2001) and by the methods of Langton et al. (2002).
Table 5 shows the diagnostic specificity, diagnostic sensitivity, positive and negative predictive values, accordance and concordance values and the concordance odds ratio for the collaborative trial of the analytical method for the detection of HEV in pork liver.
The repeatability and reproducibility of the HEV DETECT method were evaluated by determining the accordance, concordance, and concordance odds ratio (COR) of the trial data. In plain language, accordance is the probability of getting an identical result from two unknown samples analysed in the same laboratory, in other words the repeatability. Concordance is the probability of getting the same result from two identical samples, where one is analysed in one laboratory and the other is analysed in a different laboratory: in other words, reproducibility. The COR merges repeatability and reproducibility: a COR of ≤1.00 indicates that two samples sent to different laboratories will probably produce the same result that would be obtained if the same two samples were analyzed by a single laboratory. A COR significantly >1.00 indicates that variability between laboratories is greater than the variation within a single laboratory. In this collaborative trial, the CORs for the HEV-contaminated and the uncontaminated samples were within the 95% confidence intervals and therefore not significantly >1.00. Thus, the HEV DETECT method was just as reproducible between laboratories as it was repeatable within a laboratory.
The HEV DETECT method contains an IAC. One participant laboratory reported one failed analysis where the IAC signal did not appear. All other IAC signals were present. In the HEV DETECT method, the IAC was not used to determine levels of inhibition, as in the method to detect norovirus and hepatitis A virus described in ISO15216 (Anon. 2019). Rather, the presence of an IAC signal demonstrated that the amplification of the RT-PCR performed correctly.
The HEV DETECT method produced mean recoveries of 4.5% - 130%. One sample produced a recovery of 311%; in a similar study (Trojnar et al., 2020) one sample produced a recovery of 303.1%. Trojnar et al. (2020) observed higher recoveries in their diluted samples than in their neat samples, and this was also observed in the HEV DETECT trial. It is currently difficult to explain the reasons for recoveries above 100%.
Table 5: Statistical evaluation of the data obtained from the collaborative trial
| Cont. level | Sensitivity (%) | Specificity (%) | Positive Predictive Value | Negative Predictive Value | Accordance (%) | Concordance (%) | Concordance odds ratio (COR) |
|---|---|---|---|---|---|---|---|
| All HEV spiked samples* | 83.3 (68.1, 92.1) |
- | 93.8 (79.9, 98.3) |
- | 82.2 (64.4, 100.0) |
69.6 (48.9, 100.0) |
2.02 (1.0, 2.92) |
| BLANK | - | 83.3 (55.2, 95.3) |
- | 62.5 (38.6, 81.5) |
66.7 (33.3, 100.0) |
70.0 (53.3, 100.0) |
0.86 (0.44, 1.0) |
*LOW, MEDIUM and HIGH results combined. Values in parentheses are the lower and upper 95% confidence intervals
It was noted that several of the trial kits which were sent by courier to the participating laboratories failed to be delivered in their original frozen condition. For the kits sent to European laboratories, the current status of the UK as a third country resulted in delays at EU Customs / Border control causing in some cases several weeks delay. However, this did not appear to have a detrimental effect on the trial.
There is currently debate within the scientific community regarding the interpretation of “high” Ct values e.g., above 40. In the Jothikumar et al (2006) assay upon which the method is based, a cut-off value of Ct45 was used. All samples in the HEV DETECT trial produced Ct values <45. In the collaborative trial reported by Trojnar et al (2020) it was reported that some samples including “high” contamination levels produced Ct values >40; values below Ct50 were considered acceptable. In the HEV DETECT trial several samples displayed Ct values above 40. All these values were individually checked and were judged to represent amplification of target sequences.
In conclusion, the collaborative trial was performed successfully and the resulting data demonstrates the utility, repeatability and reproducibility of the HEV DETECT method. The full report of the trial comprised Deliverable 12.
Appendix A: Full report of market share and consumption data of pork products in the UK.
The aim of this review was to help identify specific matrices which we will use for the next phase of the HEVDETECT project, so that we can optimize a detection method suitable for as wide a range of product types as possible, whilst this reflects the most consumed pork products in the UK. A case control study of 25 cases conducted in England identified pork pies (OR 6.33), and ham and sausages purchased from one particular supermarket chain (OR 10.12) as significantly associated with indigenous infection. (Said et al, 2014). A subsequent study in England supported this association of ham and sausages from a particular supermarket chain, with the G3-2 phylotype detected in cases not detected in indigenous pigs suggesting infection from pork originating outside the UK (Said et al, 2017). Recently Health Protection Scotland carried out an enhanced surveillance study for Scottish individuals confirmed positive for HEV. Among the clinical cases, the consumption of pork (i.e., pork chops, roast pork) at least once a week was reported by 17% of cases, 46% consumed sliced prepacked ham at least once a week, 40% consumed bacon at least once a week and 21% consumed pork sausages at least once a week.
Overall, 80% reported the consumption of at least one pork product in the nine weeks prior to onset. Further data will be added to the compilation to determine target products.
Review of available data
Three sets of data have been acquired. The first set is from the NDNS (National Diet and Nutrition Survey) covering a rolling program for 8 years from 2008 – 2016 (Bates et al 2014; Bates et al. 2016 and Roberts et al. 2018). This dataset includes consumption data split into 2 age groups of 19-40 years and 40 years plus and are also split by gender. Table 1 details the chronic consumption of pork carcass meat, whilst Table 2 details the acute consumption of pork carcass meat. Table 3 details the chronic consumption of processed pork and Table 4 details the acute consumption of processed pork. Statistical significance was calculated using a z score calculator for 2 populations to assess the difference in male and female consumption in each age grouping for each consumption category (https://www.socscistatistics.com/). Table 5 shows the number of respondents in the population groups.
Table 1: Chronic Consumption of pork carcase meat
| Gender | Age group | Number of consumers | (g/person/day) Mean | (g/person/day) 97.5th percentile | (g/person/day) Maximum | (g/kg bw/day) Mean | (g/kg bw/day) 97.5th percentile | (g/kg bw/day) Maximum |
|---|---|---|---|---|---|---|---|---|
| Female | 19 to 40 years | 132 | 31 | 80 | 127 | 0.46 | 1.3 | 1.9 |
| 3Female | 40+ years | 379 | 27 | 68 | 121 | 0.39 | 1.0 | 1.8 |
| Male | 19 to 40 years | 105 | 38 | 87 | 106 | 0.46 | 1.1 | 1.6 |
| Male | 40+ years | 317 | 37 | 92 | 150 | 0.43 | 1.1 | 1.8 |
Table 2: Acute Consumption of pork carcase meat
| Gender | Age group | Number of consumers | (g/person/day) Mean | (g/person/day) 97.5th percentile | (g/person/day) Maximum | (g/kg bw/day) Mean | (g/kg bw/day) 97.5th percentile | (g/kg bw/day) Maximum |
|---|---|---|---|---|---|---|---|---|
| Female | 19 to 40 years | 132 | 31 | 80 | 127 | 0.46 | 1.3 | 1.9 |
| 3Female | 40+ years | 379 | 27 | 68 | 121 | 0.39 | 1.0 | 1.8 |
| Male | 19 to 40 years | 105 | 38 | 87 | 106 | 0.46 | 1.1 | 1.6 |
| Male | 40+ years | 317 | 37 | 92 | 150 | 0.43 | 1.1 | 1.8 |
Table 3: Chronic Consumption of processed pork
| Gender | Age group | Number of consumers | (g/person/day) Mean | (g/person/day) 97.5th percentile | (g/person/day) Maximum | (g/kg bw/day) Mean | (g/kg bw/day) 97.5th percentile | (g/kg bw/day) Maximum |
|---|---|---|---|---|---|---|---|---|
| Female | 19 to 40 years | 384 | 22 | 64 | 94 | 0.32 | 0.9 | 1.8 |
| 3Female | 40+ years | 781 | 26 | 73 | 105 | 0.36 | 1.1 | 1.8 |
| Male | 19 to 40 years | 311 | 36 | 100 | 187 | 0.45 | 1.4 | 2.4 |
| Male | 40+ years | 718 | 34 | 97 | 148 | 0.40 | 1.2 | 2.1 |
Table 4: Acute Consumption of processed pork
| Gender | Age group | Number of consumers | (g/person/day) Mean | (g/person/day) 97.5th percentile | (g/person/day) Maximum | (g/kg bw/day) Mean | (g/kg bw/day) 97.5th percentile | (g/kg bw/day) Maximum |
|---|---|---|---|---|---|---|---|---|
| Female | 19 to 40 years | 384 | 71 | 170 | 310 | 1.0 | 2.5 | 3.9 |
| 3Female | 40+ years | 781 | 80 | 188 | 374 | 1.1 | 2.8 | 5.7 |
| Male | 19 to 40 years | 311 | 103 | 260 | 402 | 1.3 | 3.5 | 5.5 |
| Male | 40+ years | 718 | 102 | 254 | 432 | 1.2 | 3.2 | 5.7 |
Table 5. Number of respondents in the population group
| Gender | Age group | Number of respondents in Population group |
|---|---|---|
| Female | 19 - 40 years | 927 |
| Female | 40+ years | 1866 |
| Male | 19 - 40 years | 601 |
| Male | 40+ years | 1394 |
Key:
The number of people in the age group 19-40 years who took part in the NDNS survey = 927 female and 601 male.
The number of people in the age group 40 plus years who took part in the NDNS survey = 1866 female and 1394 male.
The number of consumers relates to the number of people in the population group who ate the food e.g. 397 people consumed pork carcass meat out of 1866.
“Chronic consumption” relates to food consumed over a long period of time continuously or intermittently i.e. daily average
“Acute consumption” relates to food consumed over a short time i.e. maximum day.
g/kg bw/day = g per kg bodyweight per day consumed
97.5th percentile = 97.5 percentage of the sample
The pork carcass meat consists generally of the following:
- Pork belly rashers
- Pork loin chops
- Pork leg joints
- Pork fat
- Pork belly
- Pork blood
- Pork shoulder
- Pork crackling
- Pork spare rib
- Pork hand or spring joint
- Pork loin joint
- Pork chump chops
- Pork leg steaks
- Diced / minced pork
- Pork tongue
- Kidneys
- Livers
The processed pork consists generally of the following:
- Chorizo
- Canned ham / pork
- Pork luncheon meat
- Black pudding
- Frankfurter
- Pork sausages
- Pork and beef sausages
- Saveloy
- Economy sausages
- Skinless sausages
- Premium sausages
- Pepperami
- Smoked pork sausages
- Sausage cakes
- Pork burgers
- Smoked / unsmoked / streaky bacon rashers
- Gammon / bacon joint
- Bacon fat
As a very general conclusion from the data in Tables 1-4 above, the daily average (Chronic consumption) and the maximum per day (Acute consumption) shows that males in both age categories consume more pork carcass meat (chronic consumption p=0.03; acute consumption p<0.0001) and processed pork meat in the 19-40 age group (chronic consumption p=0.0056; acute consumption p<0.0001) than females. For processed meat, in the 40+ age group, chronic consumption appears to be equivalent between males and females (p>0.5; NS) but still significant in the acute consumption of processed meat (p=0.018).
It can be assumed that the majority of the above cuts of meat, both carcass and processed is intended to be cooked before consumption, however there are certain products which may not have had any heat treatment, e.g. Chorizo, pepperami, etc., and are intended to be eaten without any cooking step. It is not possible to derive from the data how much of each of the listed products is consumed.
The second dataset is derived from “Family Food datasets: countries and regions (CR) (updated with revised 2016/17 data and new 2017/18 data): Household purchases”, DEFRA, 2020, and shows the Purchased quantities of household food & drink by Government Office Region and Country. Table 6 shows the averages of pork products purchased per person per week (grams) and per category and is the latest figures for 2017/2018 with the data in Figure 1. in funnel chart format.
Table 6. Averages purchased per person per week (grams)
| Product | England | Wales | Scotland | Northern Ireland |
|---|---|---|---|---|
| Pigs liver | 1 | 0 | 0 | 1 |
| Pork chops | 6 | 9 | 10 | 11 |
| All other pork | 11 | 12 | 6 | 9 |
| Pork fillets and steaks | 14 | 14 | 12 | 9 |
| Pork joints | 17 | 18 | 5 | 7 |
| Bacon and ham joints uncooked | 16 | 29 | 7 | 39 |
| Bacon and ham rashers uncooked | 40 | 48 | 31 | 59 |
| Bacon and ham cooked | 39 | 61 | 46 | 62 |
| Pork sausage uncooked | 56 | 69 | 54 | 72 |
| Totals | 200 | 251 | 171 | 271 |
Table 7 – Regional data for England – average consumption of pork products (g) 2017/2018
| Product | North East | North West | Yorkshire & Humber | East Midlands | West Midlands | East | London | South East | South West | Totals |
|---|---|---|---|---|---|---|---|---|---|---|
| Pork joints | 18 | 19 | 26 | 26 | 7 | 19 | 14 | 12 | 17 | 158 |
| Pork chops | 7 | 6 | 5 | 7 | 9 | 10 | 4 | 7 | 4 | 59 |
| Pork fillets and steaks | 24 | 9 | 17 | 12 | 13 | 17 | 10 | 16 | 13 | 131 |
| All other pork | 5 | 4 | 12 | 9 | 8 | 11 | 18 | 12 | 9 | 88 |
| Pigs liver | 2 | 1 | 1 | 0 | 2 | 1 | 0 | 0 | 0 | 7 |
| Bacon and ham joints uncooked | 17 | 21 | 16 | 10 | 18 | 18 | 12 | 18 | 16 | 146 |
| Bacon and ham rashers uncooked | 50 | 48 | 39 | 45 | 54 | 48 | 19 | 37 | 38 | 378 |
| Bacon and ham cooked | 56 | 34 | 40 | 40 | 39 | 36 | 26 | 35 | 57 | 363 |
| Pork sausages uncooked | 56 | 57 | 44 | 78 | 60 | 63 | 42 | 51 | 65 | 516 |
| Totals | 235 | 199 | 200 | 227 | 210 | 223 | 145 | 188 | 219 | 1846 |
| HEV Regional Data (16--17) | 77 | 197 | 185 | 160 | 255 | 228 | 258 | 300 | 353 | 2013 |
Figure 1. Funnel chart detailing the weight (g) of pork products by category purchased in the UK during 2017/2018.
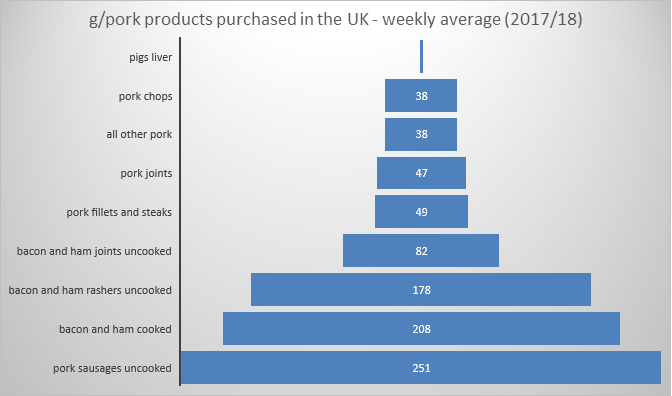
This data shows that uncooked pork sausages; cooked bacon and ham and uncooked bacon and ham rashers account for the majority of weekly purchases across all countries in the UK, followed by uncooked ham and bacon joints. It is not entirely clear from this dataset which of the above relates to “processed” pork as detailed in the first dataset, however the “all other pork” category may well include processed products such as chorizo and pepperami. It is not apparent from the data if uncooked / dried / fermented pork products including salamis are included in the “uncooked” categories in the top 4 listed above. Data for pies or pâtés were unavailable in this dataset. Table 7 illustrates the breakdown of consumption per region in England and also provides the number of cases which have been laboratory confirmed in that region for the period 16-17 (figure 3; Oeser et al 2019). The highest incidence of cases is in the South East and South West, which appears to coincide with the largest consumption of pork sausages. Further detailed statistical regression analysis is required to identify if any particular product is related in this data set. It has previously been shown that the increased autochthonous incidence was first recognised in the S. West (Dalton et.al 2006).
Figure 3: Estimated log relative risk for all hepatitis E virus (HEV) genotype 3 (G3) infections (A), HEV G3 group 1 infections (B), and HEV G3 group 2 infections (C). Tolerance contours are superimposed as solid lines at the 95% confidence level. Solid lines indicate areas of significantly higher risk. Dashed lines indicate areas of significantly lower risk. Data reproduced from J Infect Dis, Volume 220, Issue 5, 1 September 2019, Pages 802–810, https://doi.org/10.1093/infdis/jiz207
Table 8 shows the 3-year average of pork products purchased per person per week (grams) and per category and Figure 2 is in Funnel chart format.
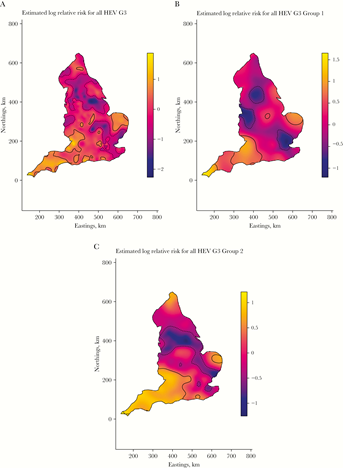
Table 8. 3-year average of pork products purchased per person per week (grams) in the UK
| Product | England | Wales | Scotland | Northern Ireland |
|---|---|---|---|---|
| Pigs liver | 1 | 0 | 0 | 1 |
| Pork chops | 6 | 9 | 10 | 13 |
| All other pork | 11 | 12 | 6 | 9 |
| Pork fillets and steaks | 14 | 14 | 12 | 9 |
| Pork joints | 17 | 18 | 5 | 7 |
| Bacon and ham joints uncooked | 16 | 20 | 7 | 39 |
| Bacon and ham rashers uncooked | 40 | 48 | 31 | 59 |
| Bacon and ham cooked | 39 | 61 | 46 | 62 |
| Pork sausages uncooked | 56 | 69 | 54 | 72 |
| Totals | 200 | 251 | 171 |
271 |
Funnel 2. Funnel chart detailing the 3-year average of weight (g) of pork products by category purchased in the UK
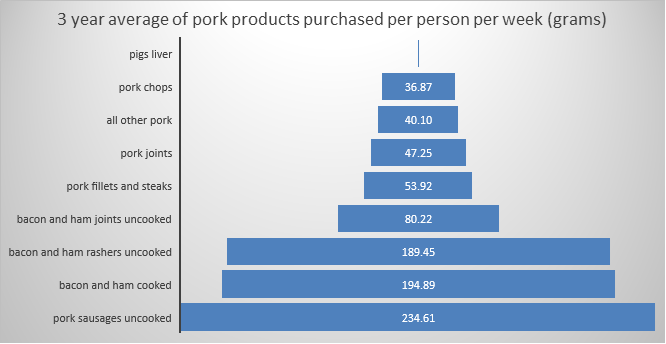
Both the one, and three year averages show the same pattern of consumption, with uncooked pork sausages being the largest by weight of product purchased in the UK, followed by cooked bacon and ham and uncooked bacon and ham rashers being the third.
The third dataset has been obtained from Kantar UK – a data, insights and consulting company and details the purchase of pork products by UK retailers during the year 2015. The graphs below show the retailers purchase of chilled processed pork; cooked chilled pork products and fresh cuts as a yearly total in ‘000s of units sold. Again, this is not strictly consumption data, but for the purposes of this review we are assuming purchases relate to amounts consumed to give a general conclusion as to which product categories are consumed most across the UK.
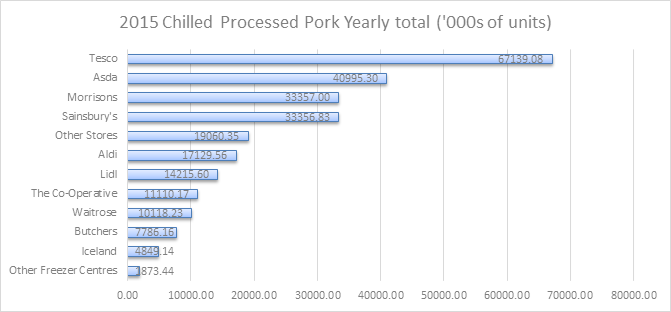
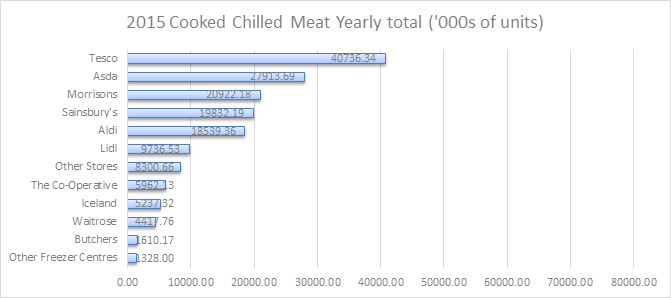
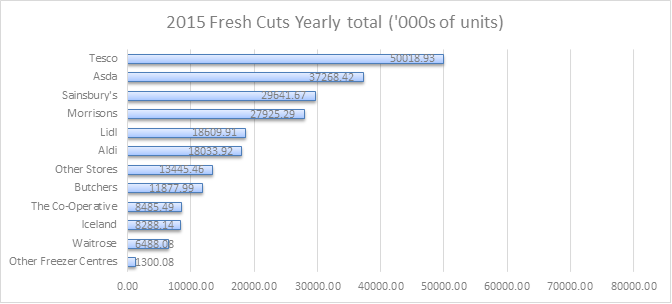
This dataset does not break down the products by type in the same way as the first two datasets, and neither does it break down the data between locally produced and imported products but it does give an overall picture of the sheer volumes of pork products sold over the course of a year by different retailers. A summary of the data for the product categories across all regions of the UK and across all retailers, whether Prepacked or loose, is shown in Table 8, with the funnel chart below.
Table 8. Number of units of each category purchased by UK retailers in 2015
| Product category | Number if units purchased |
|---|---|
| Chilled processed | 261,392,000 |
| Fresh cuts | 231,383,000 |
| Cooked chilled meat | 164,536,000 |
| Fresh joint | 123,474,000 |
| Frozen processed | 57,611,400 |
| Chilled ingredient | 26,343,800 |
| Fresh cooking | 12,984,000 |
| Frozen cuts | 11,459,900 |
| Frozen ingredient | 1,794,030 |
| Frozen joint | 1,443,440 |
| Frozen cooking | 17,441 |
Conclusions
In reviewing the data from the 3 datasets available, there are no solid conclusions we can come to with regard to specific product types consumed across the UK e.g., premium vs. economy pork sausages, salami, chorizo, hams etc. The general conclusion from these data shows that pork sausages are one of the highest consumed products across the UK and this is certainly one matrix which will be included in the next phase of the project. Many of the pork products listed in the datasets are intended to be cooked, including of course pork sausages, however we know already that pork sausages have had HEV RNA detected in them (Berto. et al 2012) and that inadequate cooking of such products may present a risk of HEV infection. Perhaps of more concern are the “uncooked” categories which are intended to be eaten uncooked or RTE. These may include chorizo, salami, fermented sausage products etc. We will continue to analyse the data from Public Health England as it becomes available and may include products which are linked to high case rates in the development of the method.
References
Bates, B.; Lennox, A.; Prentice, A.; Bates, C.; Page, P.; Nicholson, S.; Swan, G. (2014) National Diet and Nutrition Survey Results from Years 1, 2, 3 and 4 (combined) of the Rolling Programme (2008/2009 – 2011/2012) (PDF)
2. Bates, B.; Cox, L.; Nicholson, S.; Page, P.; Prentice, A.; Steer, T.; Swan, G. (2016) National Diet and Nutrition Survey Results from Years 5 and 6 (combined) of the Rolling Programme (2012/2013 – 2013/2014) (PDF)
Berto A, Martelli F, Grierson S, Banks M. Hepatitis E virus in pork food chain, United Kingdom, 2009-2010. Emerg. Infect Dis 2012; 18:1358–60.
Dalton, H. R.; Thurairajah, P. H.; Fellows, H. J.; Hussaini, H. S.; Mitchell, J.; Bendall, R.; Banks, M.; Ijaz, S.; Teo, C.-G.; Levine, D. F (2007). Autochthonous hepatitis E in southwest England. Journal of Viral Hepatitis. Vol. 14 Issue 5, p304-309
Kantar dataset kindly provided by FSS.
Oeser,C; Vaughan, A; Said, B; Ijaz, S; Tedder, R; Haywood, B; Warburton, F; Charlett, A; Elson, R and Morgan, D. (2019). Epidemiology of Hepatitis E in England and Wales: A 10-Year Retrospective Surveillance Study, 2008–2017. The Journal of Infectious Diseases, pp 802-10.
Roberts, C.; Steer, T.; Maplethorpe, N.; Cox, L.; Meadows, S.; Page, P.; Nicholson, S.; Swan, G. (2018) National Diet and Nutrition Survey Results from Years 7 and 8 (combined) of the Rolling Programme (2014/2015 – 2015/2016) (PDF)
Said, B., et al. (2014). Hepatitis E virus in England and Wales: indigenous infection is associated with the consumption of processed pork products. Epidemiol.Infect. 142:1467-1475
Said, B., et al. (2017). Pork products associated with human infection caused by an emerging phylotype of hepatitis E virus in England and Wales Epidemiol.Infect. 145:2417-2423
Appendix B: HEV recovery from pork sausage (high and low grade) and smooth pâté using four extraction and three different detection methods
| Protocol | Source | Elution buffer | 1 step RT-qPCR Mean CT and SD | 2 step RT-qPCR Mean CT and SD | Ceeram Mean CT and SD | 1 step RT-qPCR % recovery | 2 step RT-qPCR % recovery | Ceeram % recovery |
|---|---|---|---|---|---|---|---|---|
| GCU | Low grade Pork sausage 1 | RLT lysis | 35.184/0.338 | 38.438/0.118 | 34.871/0.382 | 64.16 | 27.72 | 5.49 |
| GCU | Low grade Pork sausage 2 | RLT lysis | 35.154/0.224 | 39.402/0.000 | 35.243/0.485 | 65.05 | 12.67 | 4.23 |
| GCU | High grade Pork sausage 1 | RLT lysis | 34.333/0.510 | 37.995/0.772 | 34.461/1.264 | 124.5 | 43.54 | 8.85 |
| GCU | High grade Pork sausage 2 | RLT lysis | 32.715/0.049 | 35.691/0.005 | 31.968/0.041 | 407.5 | 256.33 | 44.74 |
| GCU | Smooth Brussels Pâté 1 | RLT lysis | 0/0 | 36.867/0.484 | 33.738/0.651 | 0.000 | 102.63 | 13 |
| GCU | Smooth Brussels Pâté 2 | RLT lysis | 0/0 | 35.622/0.025 | 32.777/0.039 | 0.000 | 271.1 | 24.79 |
| Di Barolo et al (2015) | Low grade Pork sausage 1 | RLT lysis | 38.547/0 | 34.423/0.096 | 34.948/0.118 | 9.82 | 122.39 | 8.94 |
| Di Barolo et al (2015) | Low grade Pork sausage 2 | RLT lysis | 33.452/0.067 | 35.521/0.199 | 31.945/0.012 | 355.75 | 59.62 | 64.59 |
| Di Barolo et al (2015) | High grade Pork sausage 1 | RLT lysis | 36.713/0.220 | 32.260/0.005 | 31.135/0.042 | 35.97 | 508.27 | 110.37 |
| Di Barolo et al (2015) | High grade Pork sausage 2 | RLT lysis | 37.411/0.199 | 34.933/0.000 | 33.669/0.246 | 21.97 | 87.41 | 20.82 |
| Di Barolo et al (2015) | Smooth Brussels Pâté 1 | RLT lysis | 0.000/0.000 | 32.849/0.097 | 32.709/0.174 | 0.000 | 345.11 | 39.13 |
| Di Barolo et al (2015) | Smooth Brussels Pâté 2 | RLT lysis | 0.000/0.000 | 34.709/0.044 | 32.033/0.074 | 0.000 | 101.3 | 60.98 |
| Martin Latil et al (2015) | Low grade Pork sausage 1 | Distilled water | 0/0 | 37.440/0.181 | 33.293/0.031 | 0 | 28.58 | 144.25 |
| Martin Latil et al (2015) | Low grade Pork sausage 2 | Distilled water | 0/0 | 38.638/0.706 | 33.739/0.277 | 0 | 21.97 | 73.98 |
| Martin Latil et al (2015) | High grade Pork sausage 1 | Distilled water | 0/0 | 37.465/0.222 | 33.622/0.069 | 0 | 23.42 | 142.39 |
| Martin Latil et al (2015) | High grade Pork sausage 2 | Distilled water | 0/0 | 38.137/0.075 | 33.410/0.230 | 0 | 26.76 | 95.34 |
| Martin Latil et al (2015) | Smooth Brussels Pâté 1 | Distilled water | 0/0 | 38.263/0.492 | 33.976/0.354 | 0 | 19.11 | 90.33 |
| Martin Latil et al (2015) | Smooth Brussels Pâté 2 | Distilled water | 0/0 | 38.142/0.117 | 33.680/0.059 | 0 | 22.6 | 95.14 |
| CBRI | Low grade Pork sausage 1 | Trizol | 36.867/0.415 | 34.791/0.501 | 33.764/0.582 | 7.34 | 50.33 | 19.78 |
| CBRI | Low grade Pork sausage 2 | Trizol | 37.072/0.257 | 34.563/0.400 | 33.537/0.246 | 6.17 | 59.32 | 22.27 |
| CBRI | High grade Pork sausage 1 | Trizol | 35.745/1.598 | 36.738/0.751 | 33.769/0.179 | 23.82 | 15.29 | 19.1 |
| CBRI | High grade Pork sausage 2 | Trizol | 36.931/0.043 | 35.107/0.269 | 34.069/0.381 | 6.8 | 38.32 | 15.9 |
| CBRI | Smooth Brussels Pâté 1 | Trizol | 38.939/0.000 | 0.000/0.000 | 36.874/0.590 | 1.45 | 0 | 2.62 |
| CBRI | Smooth Brussels Pâté 2 | Trizol | 38.098/0.875 | 36.345/0.621 | 35.778/0.296 | 3.09 | 15.29 | 5.2 |
Revision log
Published: 26 July 2023
Last updated: 21 September 2023