page
Vegetable oil substitution for sunflower oil: Information for industry and other interested stakeholders
Information from FSA allergen risk assessments, consumer research, and the nutritional content of oils and their sustainability, intended to help inform industry when reformulating products in response to the shortage of sunflower oil.
Introduction
Ukraine is the largest producer of sunflower oil in the world, responsible for almost half of global supply. The conflict in Ukraine has, amongst many other things, disrupted the supply of sunflower oil and products derived from sunflower used in food production to the UK. A significant proportion of processed food products contain sunflower oil.
In early March 2022 food businesses reported that UK supplies of sunflower oil were likely to be exhausted in a few weeks with some businesses already beginning to experience difficulties.
This document pulls together information from our allergen risk assessments and consumer research and provides information on the nutritional content of oils and their sustainability. It is intended to help inform industry choices when reformulating products in response to the shortages.
Allergen risk assessments
The Food Standards Agency (FSA) and Food Standards Scotland (FSS) carried out rapid risk assessments on the risk of allergic reactions in UK consumers if sunflower oil is substituted with refined rapeseed oil or other vegetable oils.
The risk assessments have been published at the following links:
- Rapid risk assessment on the risk of allergic reaction in UK consumers if sunflower oil is substituted with refined rapeseed
- Rapid risk assessment on the risk of allergic reaction in UK consumers if sunflower oil is substituted with certain vegetable oils
The key findings are summarised below.
Rapid allergen risk assessment on refined rapeseed oil
This rapid risk assessment considers the risk in terms of allergy to UK consumers if sunflower oil is substituted in food with food grade refined rapeseed oil without rapeseed being labelled on the packaging. This rapid risk assessment also applies to food grade canola oil.
Based on the lack of reports of adverse reactions to refined rapeseed oil in the UK population, and lack of evidence of severe illness or deaths, we estimate:
- the frequency of allergic reactions to refined rapeseed oil to be very low (for example, very rare but cannot be excluded)
- the severity of illness in relation to allergic reactions to refined rapeseed oil to be negligible (for example, no effects or so mild they do not merit to be considered)
Based on the data available from the Patterns and Prevalence of Adult Food Allergy (PAFA) project and the NHS Data project and information gathered from allergy specialists, we consider the level of uncertainty to be medium (for example, there are some but no complete data available).
The key uncertainties identified in this risk assessment include:
- the degree to which the refining process removes proteins from rapeseed oil (and whether there are variations of refinement leading to variations in protein content)
- the amount of rapeseed protein that would be included in servings of final food products that would be eaten on a single eating occasion if refined rapeseed oil is substituted for sunflower oil
- the amount of allergenic rapeseed protein that needs to be consumed in order to elicit an allergic reaction
- whether the lack of confirmed clinical data on allergic reactions to refined rapeseed oil or rapeseed more generally in the UK could be due to under-reporting
Rapid allergen risk assessment on palm oil, palm olein, palm kernel oil, fully refined soybean oil, cottonseed oil, coconut oil, corn/maize oil and olive oil
This rapid risk assessment considers the risk in terms of allergy to UK consumers if sunflower oil is substituted in food with certain vegetable oils (for example, palm oil, palm olein, palm kernel oil, fully refined soybean oil, cottonseed oil, corn oil, coconut oil and olive oil) without these oils being labelled on the packaging.
Fully refined vegetable oils are described as edible neutralised (alkali refined) bleached and deodorised (N/RBD) oils.
Fully refined soybean oil
Based on the data available from published clinical studies and the EFSA Scientific Opinion on fully refined soybean oil (EFSA Journal, 2007) we consider:
- the frequency of allergic reactions to fully refined soybean oil to be negligible (for example, so rare that it does not merit to be considered)
- the severity of illness in relation to allergic reactions to fully refined soybean oil to be negligible (for example, no effects or so mild they do not merit to be considered)
- the level of uncertainty to be low (for example, there are solid and complete data available).
Fully refined palm oil, palm olein and palm kernel oil, corn oil, cottonseed oil, refined olive oil and cold-pressed olive oil
Based on the lack of clinically confirmed reports of adverse reactions to palm oil, palm olein and palm kernel oil, corn oil, cottonseed oil and olive oil in the UK population, and lack of evidence of severe illness or deaths we consider:
- the frequency of allergic reactions to fully refined palm oil, palm olein and palm kernel oil, corn oil, cottonseed oil, fully refined olive oil and cold-pressed olive oil to be very low (for example, very rare but cannot be excluded)
- the severity of illness in relation to allergic reactions to fully refined palm oil, palm olein and palm kernel oil, corn oil, cottonseed oil, fully refined olive oil and cold-pressed olive oil to be negligible (for example, no effects or so mild they do not merit to be considered).
Based on the data available from the PAFA and NHS Data project and information gathered from allergy specialists, we consider the level of uncertainty to be medium (for example, there are some but no complete data available).
Coconut oil
Based on the lack of clinically confirmed adverse reports of reactions to coconut oil in the UK population, and lack of evidence of severe illness or deaths we consider:
- the frequency of allergic reactions to fully refined coconut oil to be very low (for example, very rare but cannot be excluded).
- the severity of illness in relation to allergic reactions to fully refined coconut oil to be negligible (for example, no effects or so mild they do not merit to be considered).
Based on the data available from the PAFA and NHS Data project and information gathered from allergy specialists, we consider the level of uncertainty to be medium (for example, there are some but no complete data available).
The risk associated with unrefined coconut oil to sensitive individuals is likely to be higher than for fully refined coconut oil because it will contain more protein. However, we are not able to estimate the extent to which it will be of greater risk due to limitations in the available data.
Key sources of uncertainty
The key sources of uncertainty for the rapid allergen risk assessment on fully refined palm oil, palm olein, palm kernel oil, corn oil, cottonseed oil, refined or unrefined coconut oil and cold-pressed olive oil are:
- the degree to which the refining process removes proteins from fully refined vegetable oils (for example, palm oil, palm olein, palm kernel oil, corn oil and cottonseed oil) and the amount of protein that may remain in these oils
- the extent to which industry intends to use these oils in food and the amounts involved
- the amount of protein that would be included in servings of final food products that would be eaten on a single eating occasion if these oils are substituted for sunflower oil
- the amount of allergenic protein that needs to be consumed in order to elicit an allergic reaction
- whether the lack of confirmed clinical data on allergic reactions to these oils could be due to under-reporting.
Vegetable oil nutrient profiles
The table below outlines the key nutritional differences between sunflower oil and a variety of vegetable oils as listed in McCance and Widdowson’s Composition of Foods Integrated Dataset on the nutrient content of the UK food supply.
The fatty acid composition of soybean and corn oils is more similar to that of sunflower oil. Rapeseed oil contains a lower proportion of saturated fatty acids than sunflower oil. Palm oil and coconut oil contain higher proportions of saturated fatty acids.
Government nutrition advice encourages choosing foods lower in saturated fats and swapping saturated fats in the diet for unsaturated fats (mono- and polyunsaturated fats), to reduce the risk of heart disease, SACN (2019) Saturated Fat and Health (gov.uk). We therefore encourage the use of healthier oils, which are lower in saturated fatty acids when substituting for sunflower oil.
This table outlines different types of fatty acids in grams per 100 grams of food:
| Type of oil | Saturated | Monounsaturated | Polyunsaturated |
|---|---|---|---|
| Sunflower oil | 12.00 | 20.50 | 63.30 |
| Rapeseed oil | 6.60 | 59.30 | 29.30 |
| Corn/maize oil | 14.40 | 29.90 | 51.30 |
| Soyabean oil | 15.60 | 21.30 | 58.80 |
| Palm oil | 47.80 | 37.10 | 10.40 |
| Coconut oil | 86.50 | 6.00 | 1.50 |
| Olive oil* | 14.30 | 73.00 | 8.20 |
| Cottonseed oil | 26.10 | 18.30 | 50.20 |
* Values are the mean of 35 samples including virgin and extra virgin olive oil
Source: McCance and Widdowson’s composition of foods integrated dataset
Quadram UK food composition website and Composition of foods integrated dataset (gov.uk)
Comparison of sustainability metrics for different vegetable oils
Defining sustainability is extremely complex. Although some comparisons between oils are presented here, for a number of metrics this is not the full picture, and it is therefore hard to make a simple judgement on which is better than another.
There are large gaps in existing data sets, including some major producing countries releasing limited data (for example, Russia and China).
References were not checked for funding body conflicts of interest, and research methods were not compared. This report does not consider the impact of each oil on for example, workforce or local communities.
Considering individual metrics do not take into account how geography impacts which metric is more important (for example, a water intensive crop grown in a water rich area is less of a concern than the same crop grown in an arid area).
A much longer and thorough review of the literature would be required to give an accurate picture. However, we have synthesised data from the following reports.
Data sources
- Type of crop, yield, countries, biome & species threatened: Meijaard, E. et al. The environmental impacts of palm oil in context. Nat. Plants 6, 1418–1426 (2020). https://doi.org/10.1038/s41477-020-00813-w
- Greenhouse gases : Alcock, T. et al. 2022. More sustainable vegetable oil: Balancing productivity with carbon storage opportunities. Science of The Total Environment, 829, p.154539. https://doi.org/10.1016/j.scitotenv.2022.154539
- Water use: Ludwig, F. 2011. Water Use for Oil Crops: Current Water Use and Future Outlooks. ILSI Europe Report Series. ILSI Europe, pp.1-38. https://ilsi.eu/publication/water-use-for-oil-crops-current-water-use-a…
- GHG – greenhouse gases; mm – millimetre; ha – hectare; kg – kilograms; CO2e – CO2 emissions
| Oil crop | Type of crop | Oil yield (tonnes/ha) | Main oil production countries | Main biome impacted | GHG (kg CO2/kg refined oil) | Water use mm/season | Number of species threatened by crop |
|---|---|---|---|---|---|---|---|
|
Oil palm
|
Perennial (25-year cycle) |
1.9 - 4.8 | Indonesia, Malaysia, Thailand | Tropical rainforest | 3.73 | Unknown due to growing in high rainfall area | 321 |
| Soybean | Annual Rotated with other crops |
0.4 - 0.8 | China, USA, Brazil, Argentina | Subtropical grass savanna, temperate steppe and broadleaf forest |
4.25 | 300 to 600 | 73 |
| Rapeseed | Annual Rotated with other crops |
0.7 - 1.8 | China, Germany, Canada | Temperate steppe and broadleaf forest and taiga | 2.49 | 160 to 230 | 1 |
| Sunflowers | Annual Rotated with other crops |
0.5 - 0.9 | Ukraine, Russia | Temperate steppe and broadleaf forest | 2.94 | 300 to 430 | 1 |
| Coconut |
Perennial (30– |
0.4 - 2.4 | Philippines, Indonesia, India | Tropical and subtropical forest | - | - | 65 |
| Maize | Annual Rotated with other crops |
0.1 - 0.2 | USA, China | Temperate steppe and broadleaf forest | - | - | 131 |
| Olive | Perennial, long-lived. Sometimes inter-cropped |
0.3 - 2.9 | Spain, Italy, Greece | Mediterranean vegetation | - | - | 14 |
Consumer perceptions
In May 2022 the FSA commissioned a survey of consumer views on several alternative oils proposed by industry as substitutes for sunflower oil, due to the shortage of supply as a result of the war in Ukraine. The key research questions were:
- How aware are the public of the substitution of rapeseed oil for sunflower oil in some products?
- How do the substitutions impact trust in the processed food for sale in the UK?
- How do consumers perceive the different oils suggested as substitutes?
- What are consumer perceptions of the relative environmental sustainability of oils?
Ipsos ran an online survey with 2,063 adults aged 16-75 living in England, Wales and Northern Ireland, in May 2022. Details of the methodology are provided at page 18.
How aware are the public of the substitution of rapeseed oil for sunflower oil in some products?
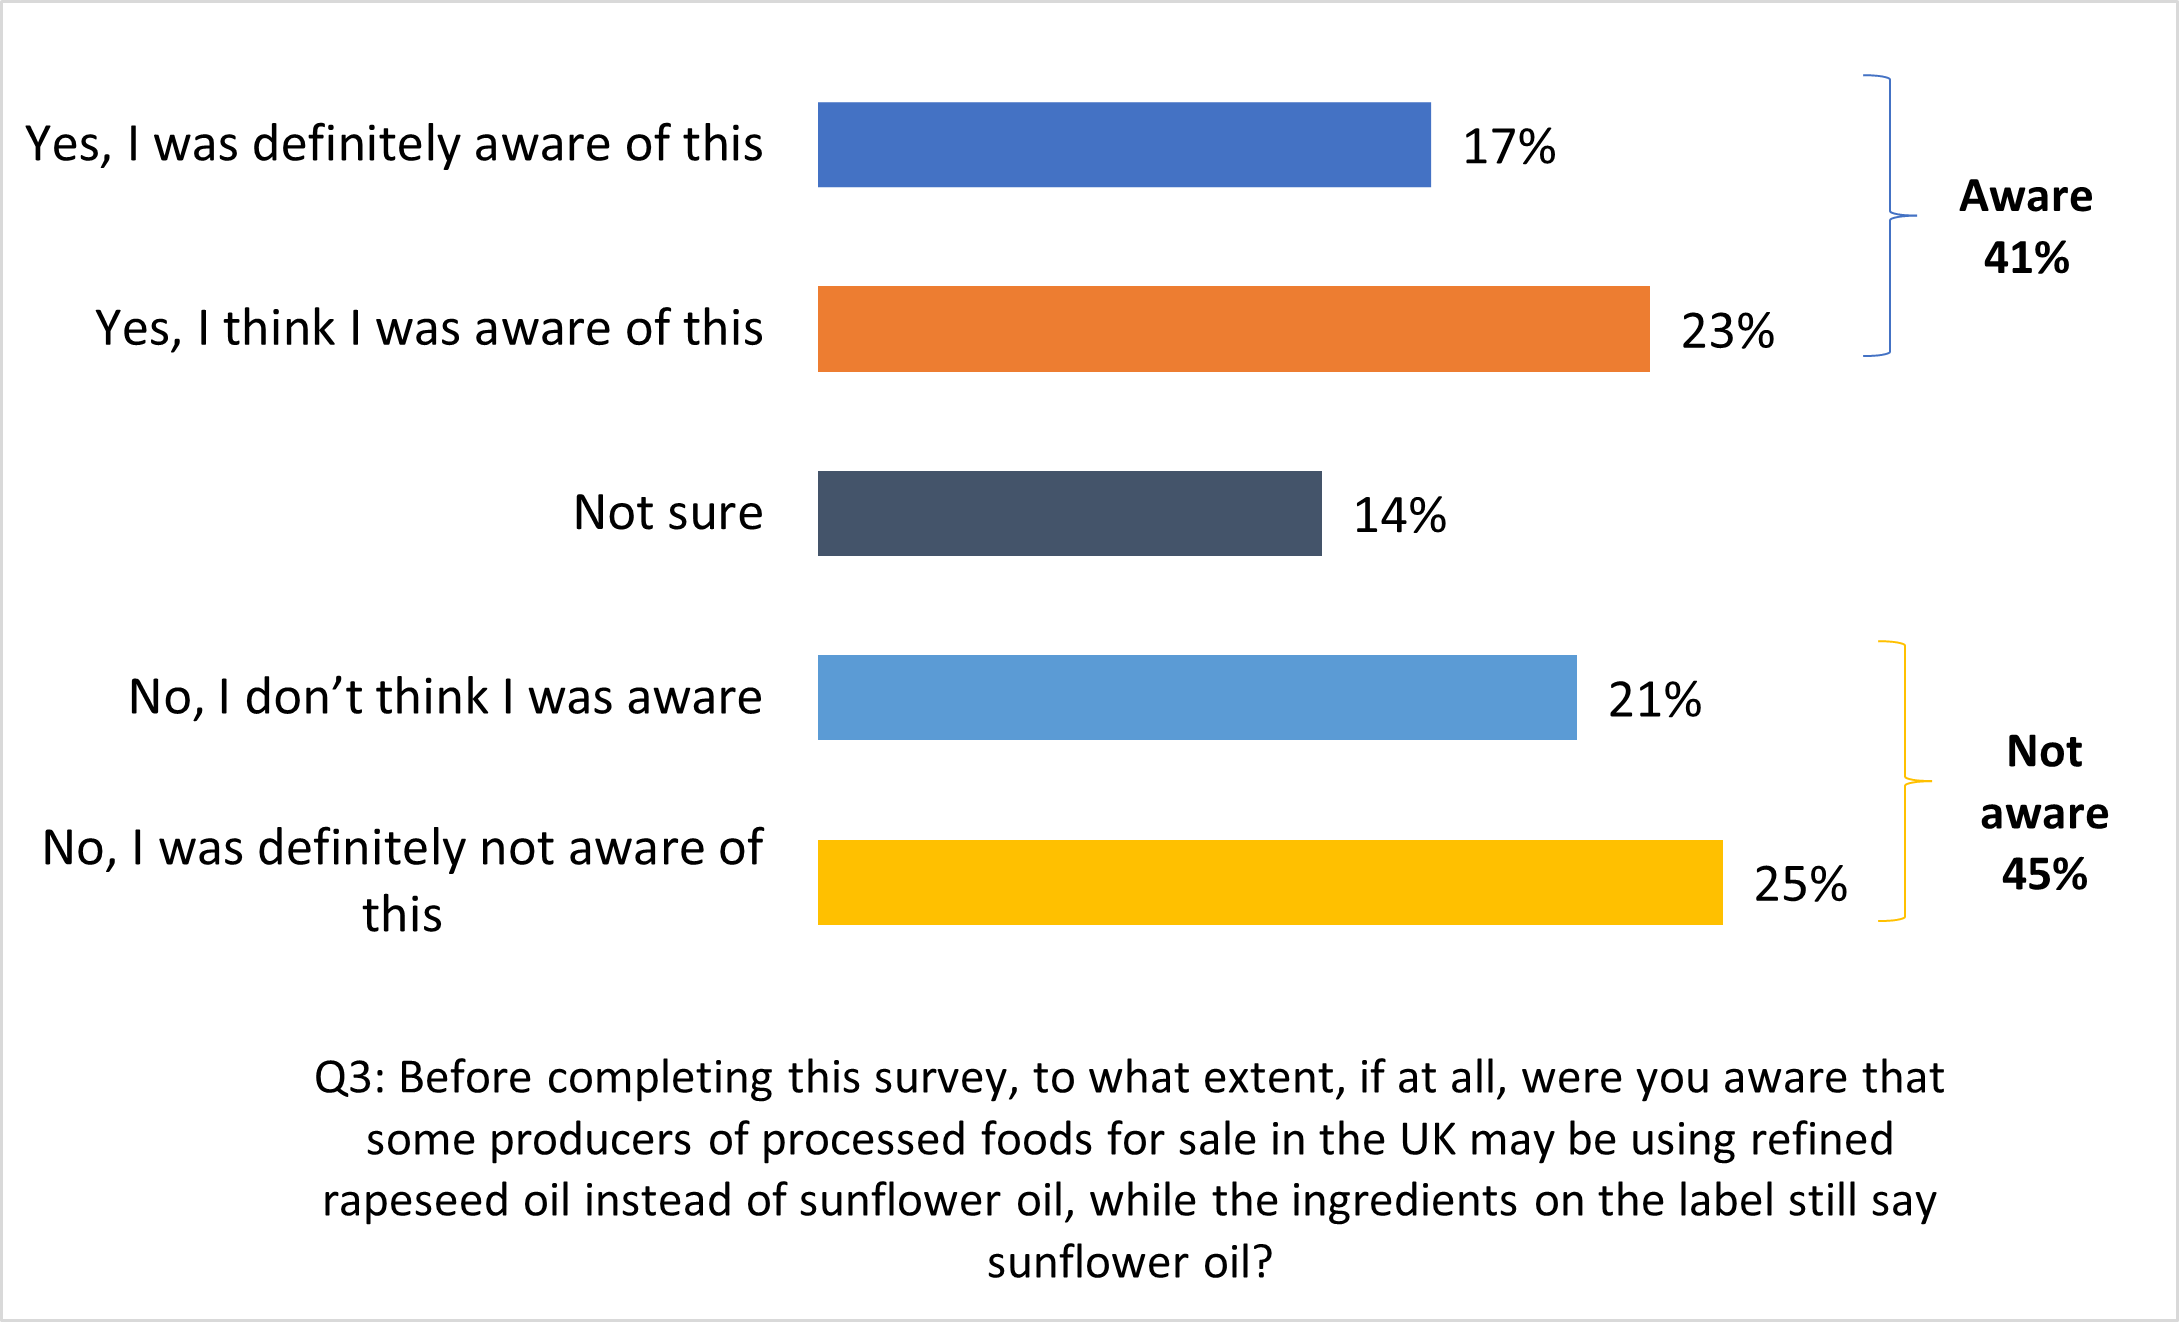
Two in five (41%) say they are aware that rapeseed oil may be used instead of sunflower oil in processed food for sale in the UK.
Figure 1 Awareness that rapeseed oil may be substituted for sunflower oil without appearing on the label
Base: all adults aged 16-75 in England, Wales, and Northern Ireland (2,063). Percentages might not add up to 100% due to rounding.
When asked whether they think that processed foods in the UK are currently using any other oils than sunflower oil without stating it on the label, around half (55%) say they don’t know. One in five say they think fully refined palm oil is being used (22%), and 17% each that fully refined soybean oil and fully refined coconut oil is being used. Around one in ten (9%) thought that none of the listed oils were being used instead of sunflower oil without explicitly stating on the food label.
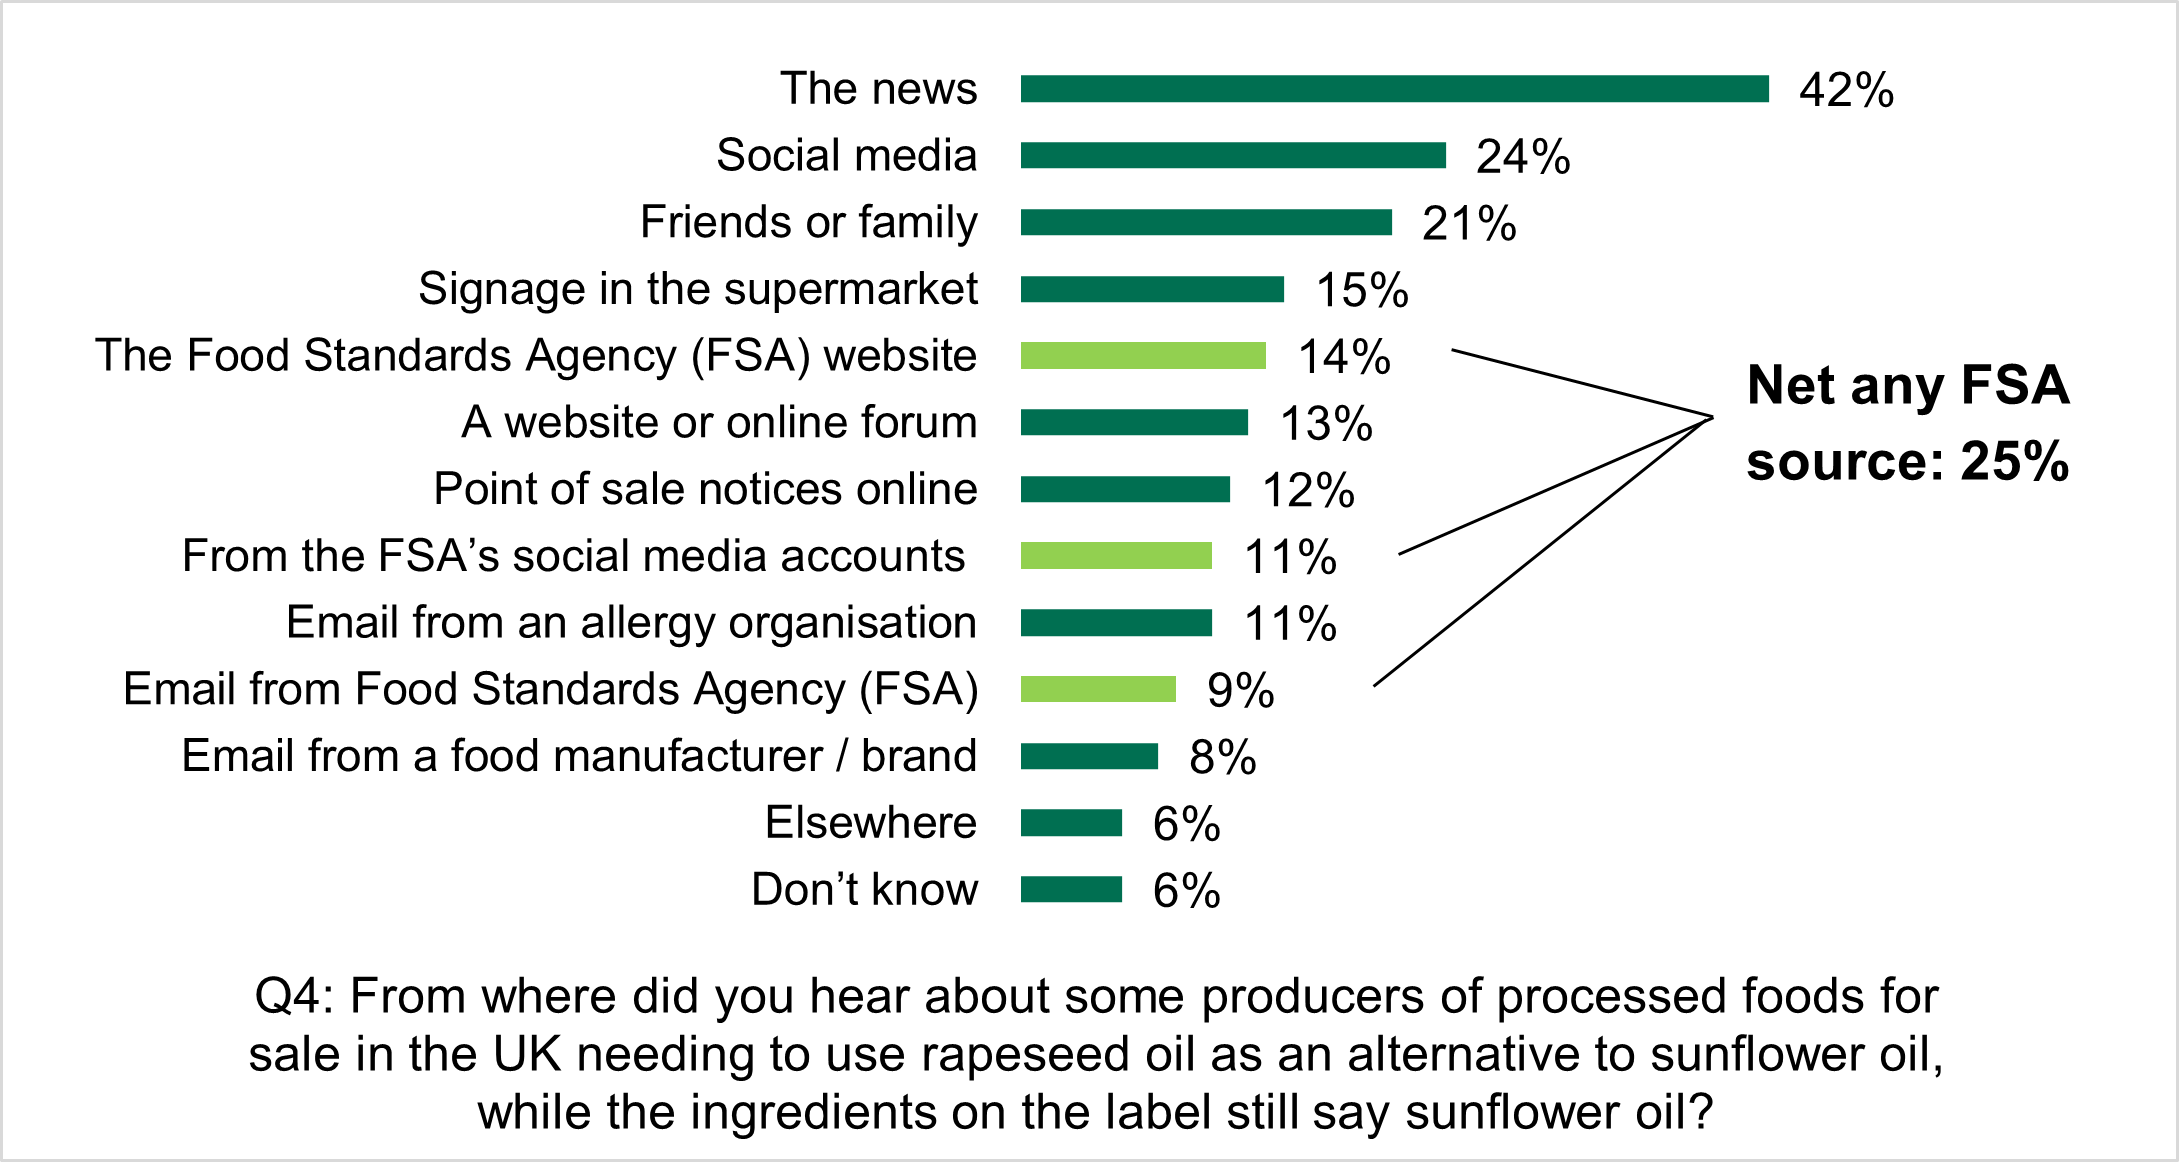
News is the most common source of information among those aware of the rapeseed oil substitution (42%), followed by social media (24%). A quarter (25%) say they’ve heard from FSA sources (14% FSA website, 11% FSA social media, 9% direct email from the FSA).
Figure 2 Source of information about substitution among those aware
Base: All adults aware that rapeseed oil may be substituted for sunflower oil without appearing on the label (863). Values do not add to 100% as multiple responses could be selected.
How do the substitutions impact trust in the processed food for sale in the UK?
Three-fifths (63%) of the public trust that processed food for sale in the UK is safe to eat, 21% say they neither trust nor distrust it and 13% say they distrust it.
Those who are aware of the substitution of sunflower oil with rapeseed oil are more likely than those who are not aware to say they trust that processed food sold in the UK is safe to eat (71% among those aware vs 61% among those unaware).
Almost seven in ten (68%) of the public trust that the information on the label on processed food products for sale in the UK is correct. 20% say they neither trust nor distrust it and 9% say they distrust it. Those who are aware of the rapeseed oil substitutions are also more likely than those not aware to trust that the information on the label is correct (75% vs 67%).
How do consumers perceive the different oils suggested as substitutes?
Sunflower oil compared with rapeseed oil
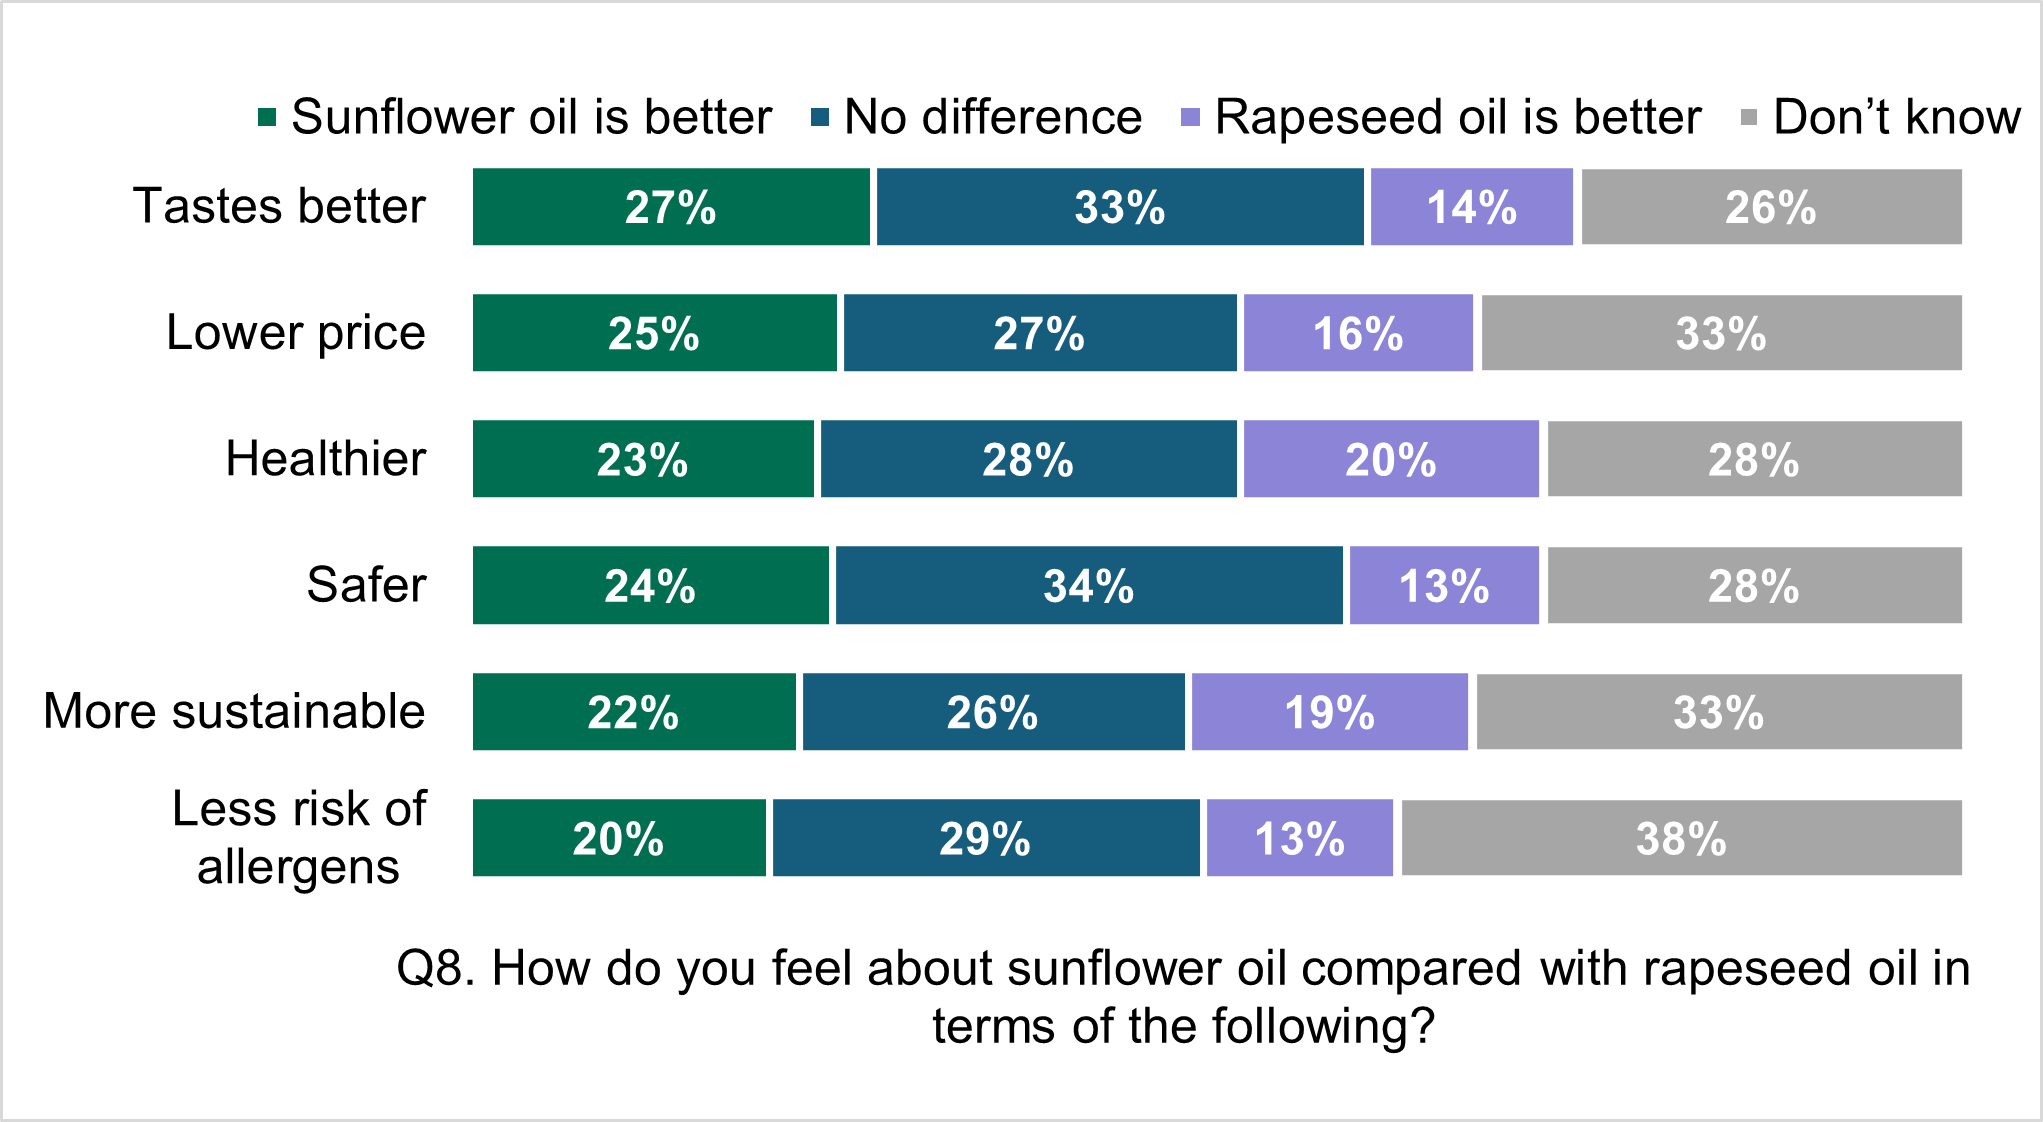
The public tend to report no difference between sunflower oil and rapeseed oil when it comes to: taste (33%), price (27%), healthiness (28%), safety (34%), sustainability (26%) and risk of allergens (29%). Smaller proportions say sunflower oil: tastes better (27%), has a lower price (25%), is healthier (23%), is safer (24%), is more sustainable (22%) and has less risk of allergens (20%).
Fewer still say rapeseed oil is better on any of those attributes, but one in five (20%) say rapeseed oil is healthier and more sustainable (19%).
Sizeable proportions, between 26% and 38% across the different attributes say they do not know how rapeseed and sunflower oil compare across the dimensions presented.
Figure 3 Sunflower oil compared with rapeseed oil
Base: all adults aged 16-75 in England, Wales, and Northern Ireland (2063). Percentages might not add up to 100% due to rounding.
Sunflower oil compared with palm oil
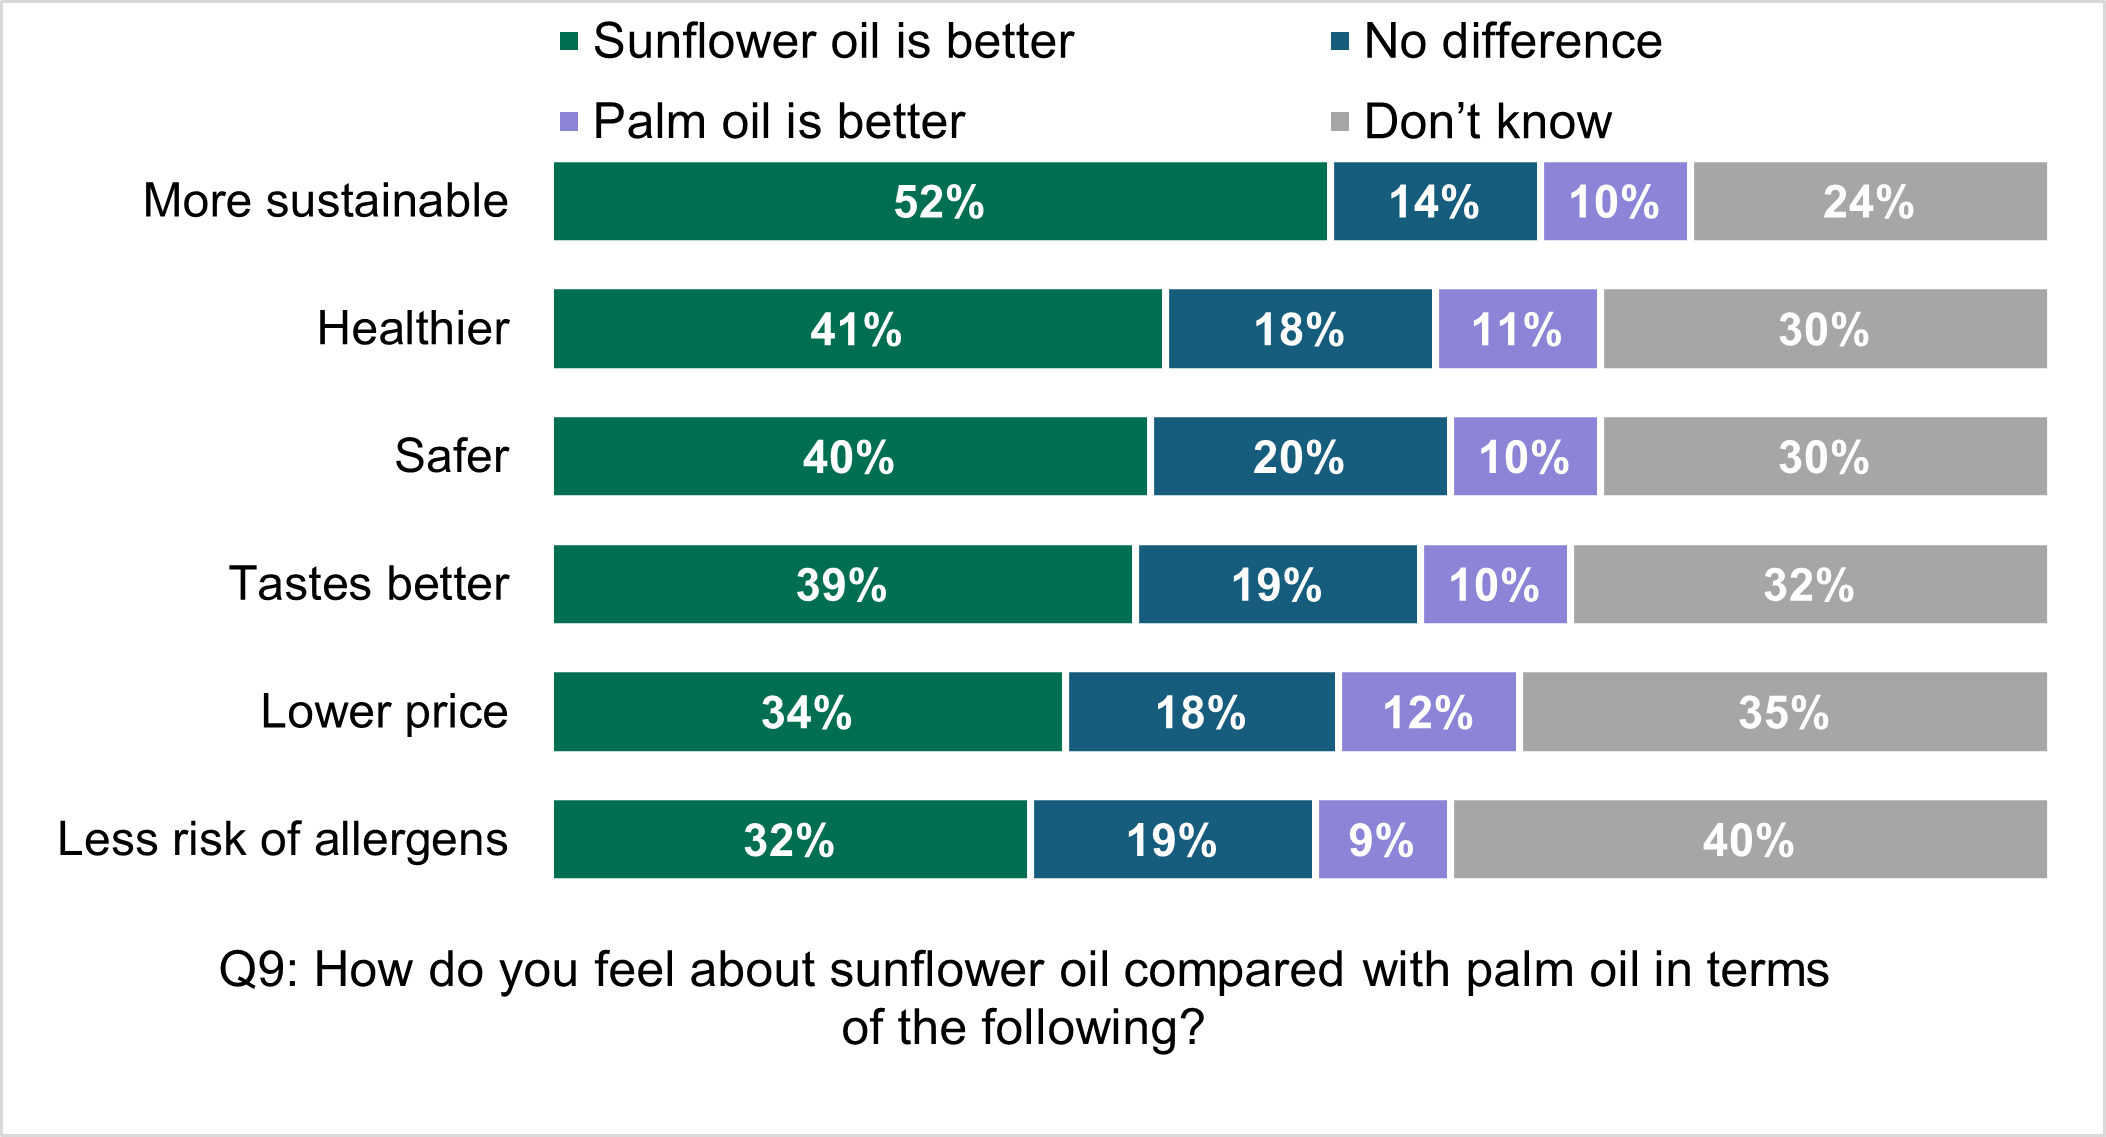
Over half of respondents (52%) say that sunflower oil is more sustainable than palm oil. Sunflower oil is also perceived as being overall better in terms of being healthier (41%), safer (40%), tasting better (39%), lower in price (34%) and having less risk of allergens (32%). But a substantial share do not have a view, especially on risk of allergens (40%) and price (35%).
Figure 4 Sunflower oil compared with palm oil
Base: all adults aged 16-75 in England, Wales, and Northern Ireland (2063). Percentages might not add up to 100% due to rounding.
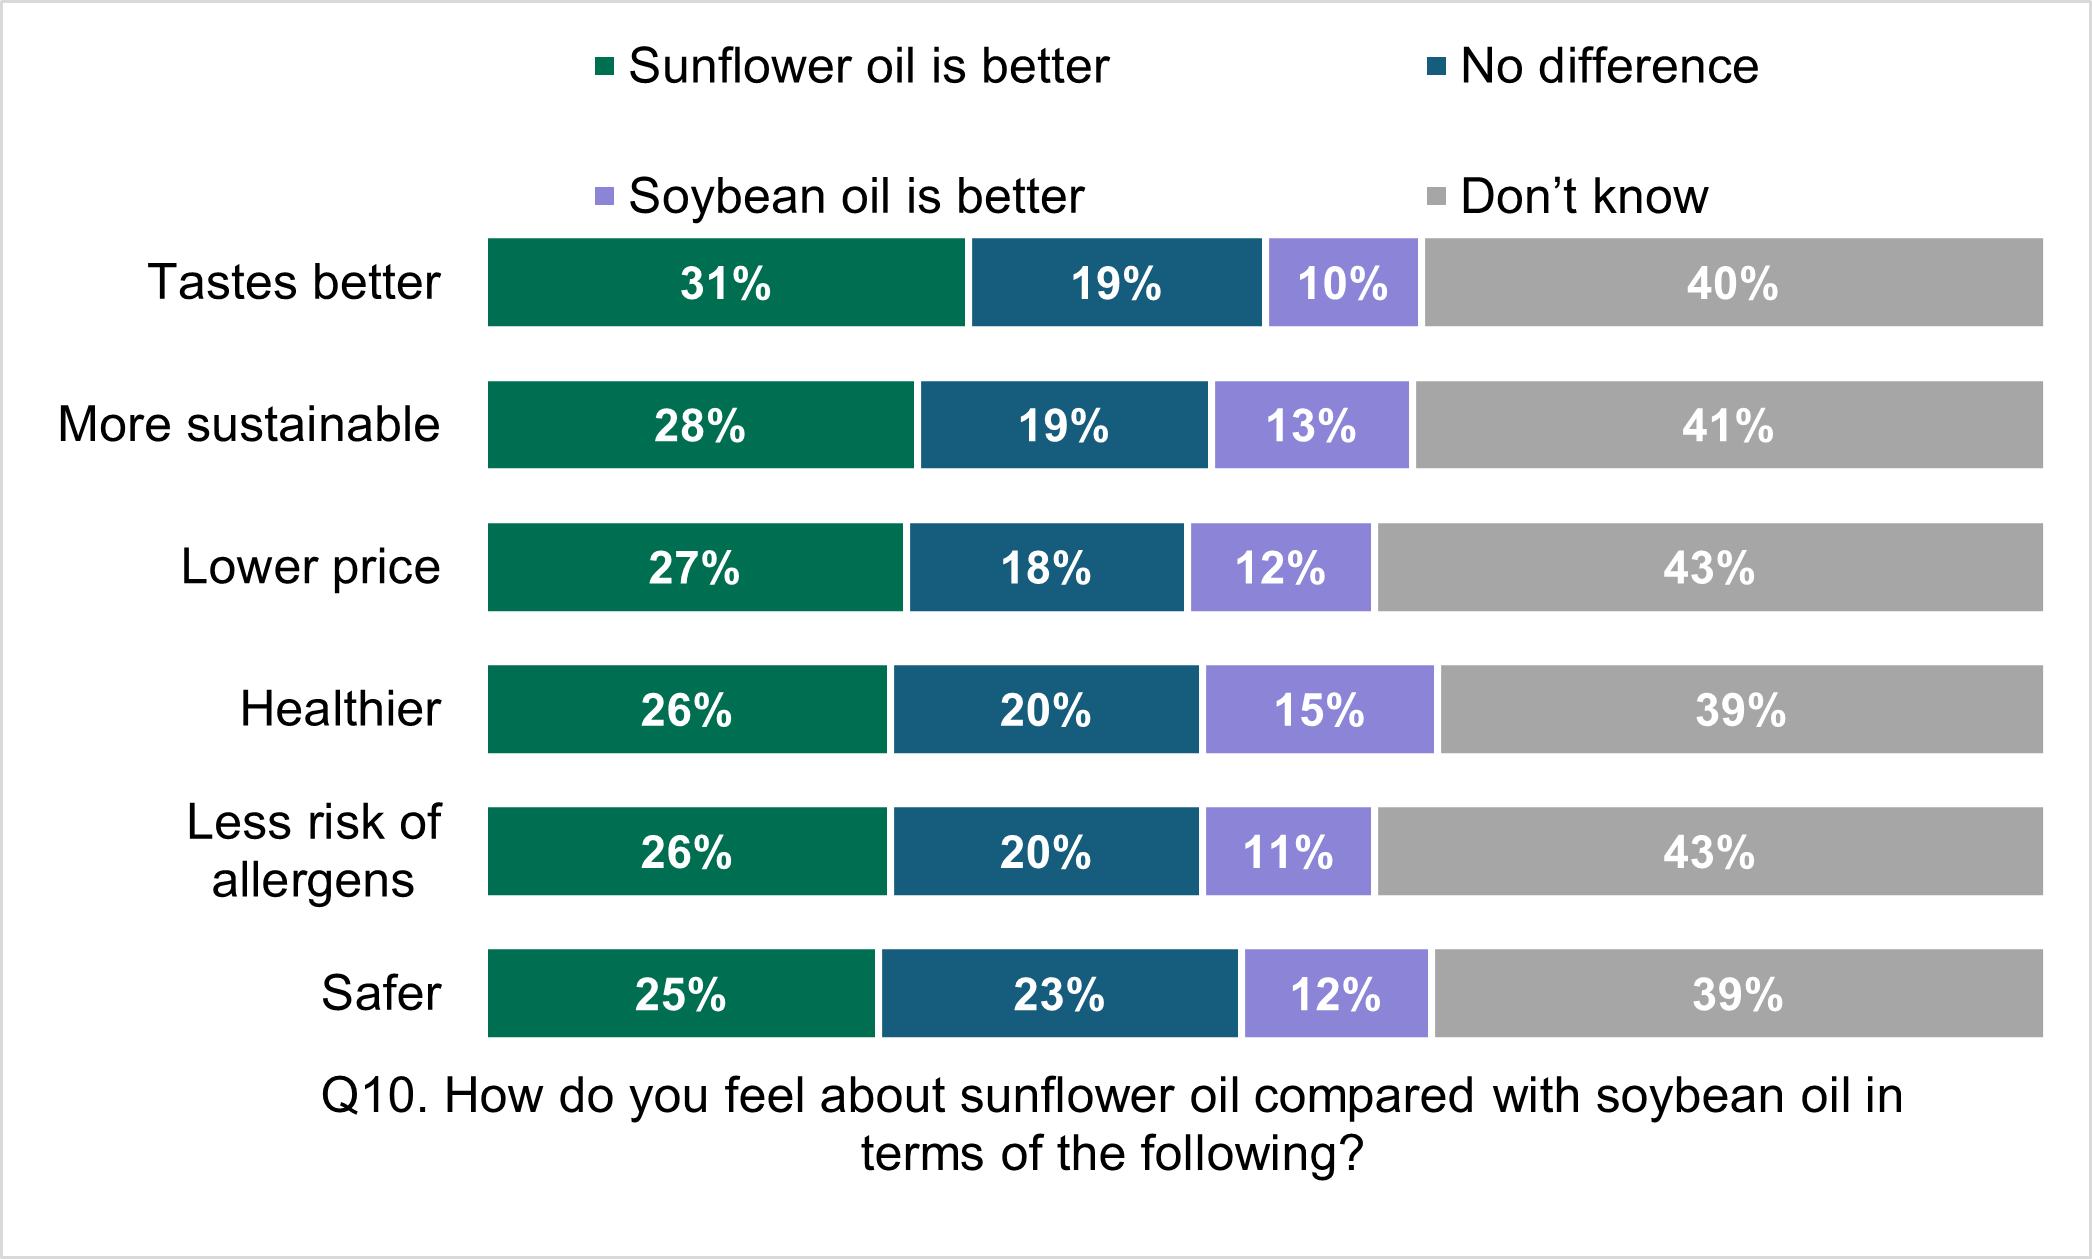
Sunflower oil compared with soybean oil
Around two fifths (39% ~ 43%) of people don’t know whether sunflower oil is better than soybean oil across most attributes. Although sizeable proportions say it does not make a difference, those with an opinion tend to say sunflower oil is better than soybean oil on: taste (31%), sustainability (28%), price (27%), health (26%), allergen risk (26%), and safety (25%).
Figure 5 Sunflower oil compared with soybean oil
Base: all adults aged 16-75 in England, Wales, and Northern Ireland (2063). Percentages might not add up to 100% due to rounding.
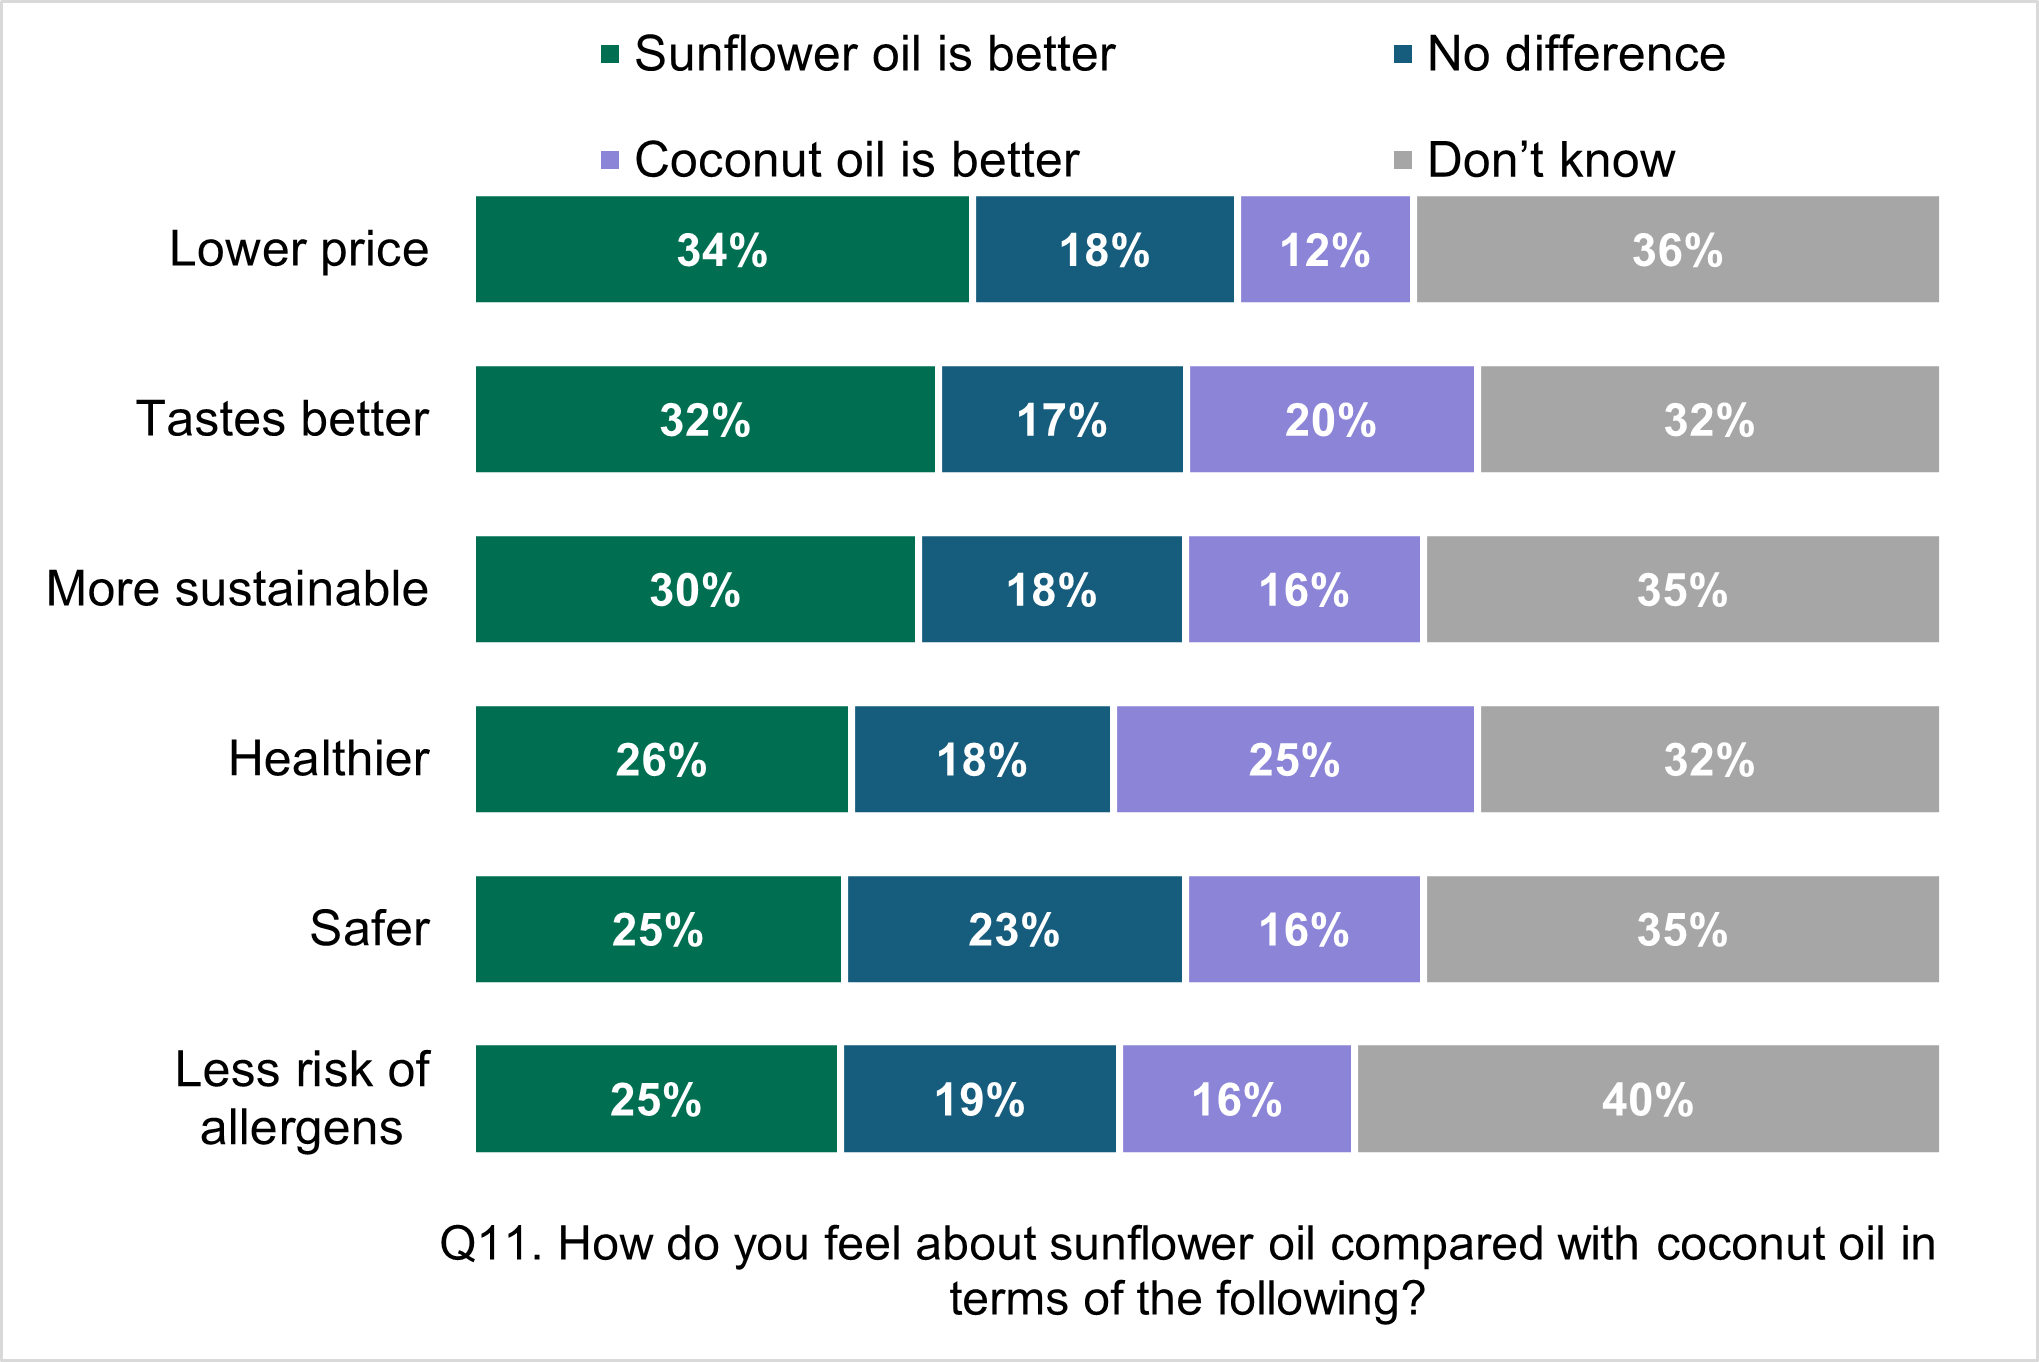
Sunflower oil compared with coconut oil
Around a third (32% ~ 40%) of people don’t know whether sunflower oil is better than coconut oil across most attributes.
Those with an opinion tend to say sunflower oil is better than coconut oil on: price (34%), taste (32%), sustainability (30%), safety (25%), and allergen risk (25%). Respondents are split on which is healthier: 26% say sunflower is healthier while 25% say coconut oil is healthier, with 18% saying there is no difference and 32% don’t know.
Figure 6 Sunflower oil compared with coconut oil
Base: all adults aged 16-75 in England, Wales, and Northern Ireland (2063). Percentages might not add up to 100% due to rounding.
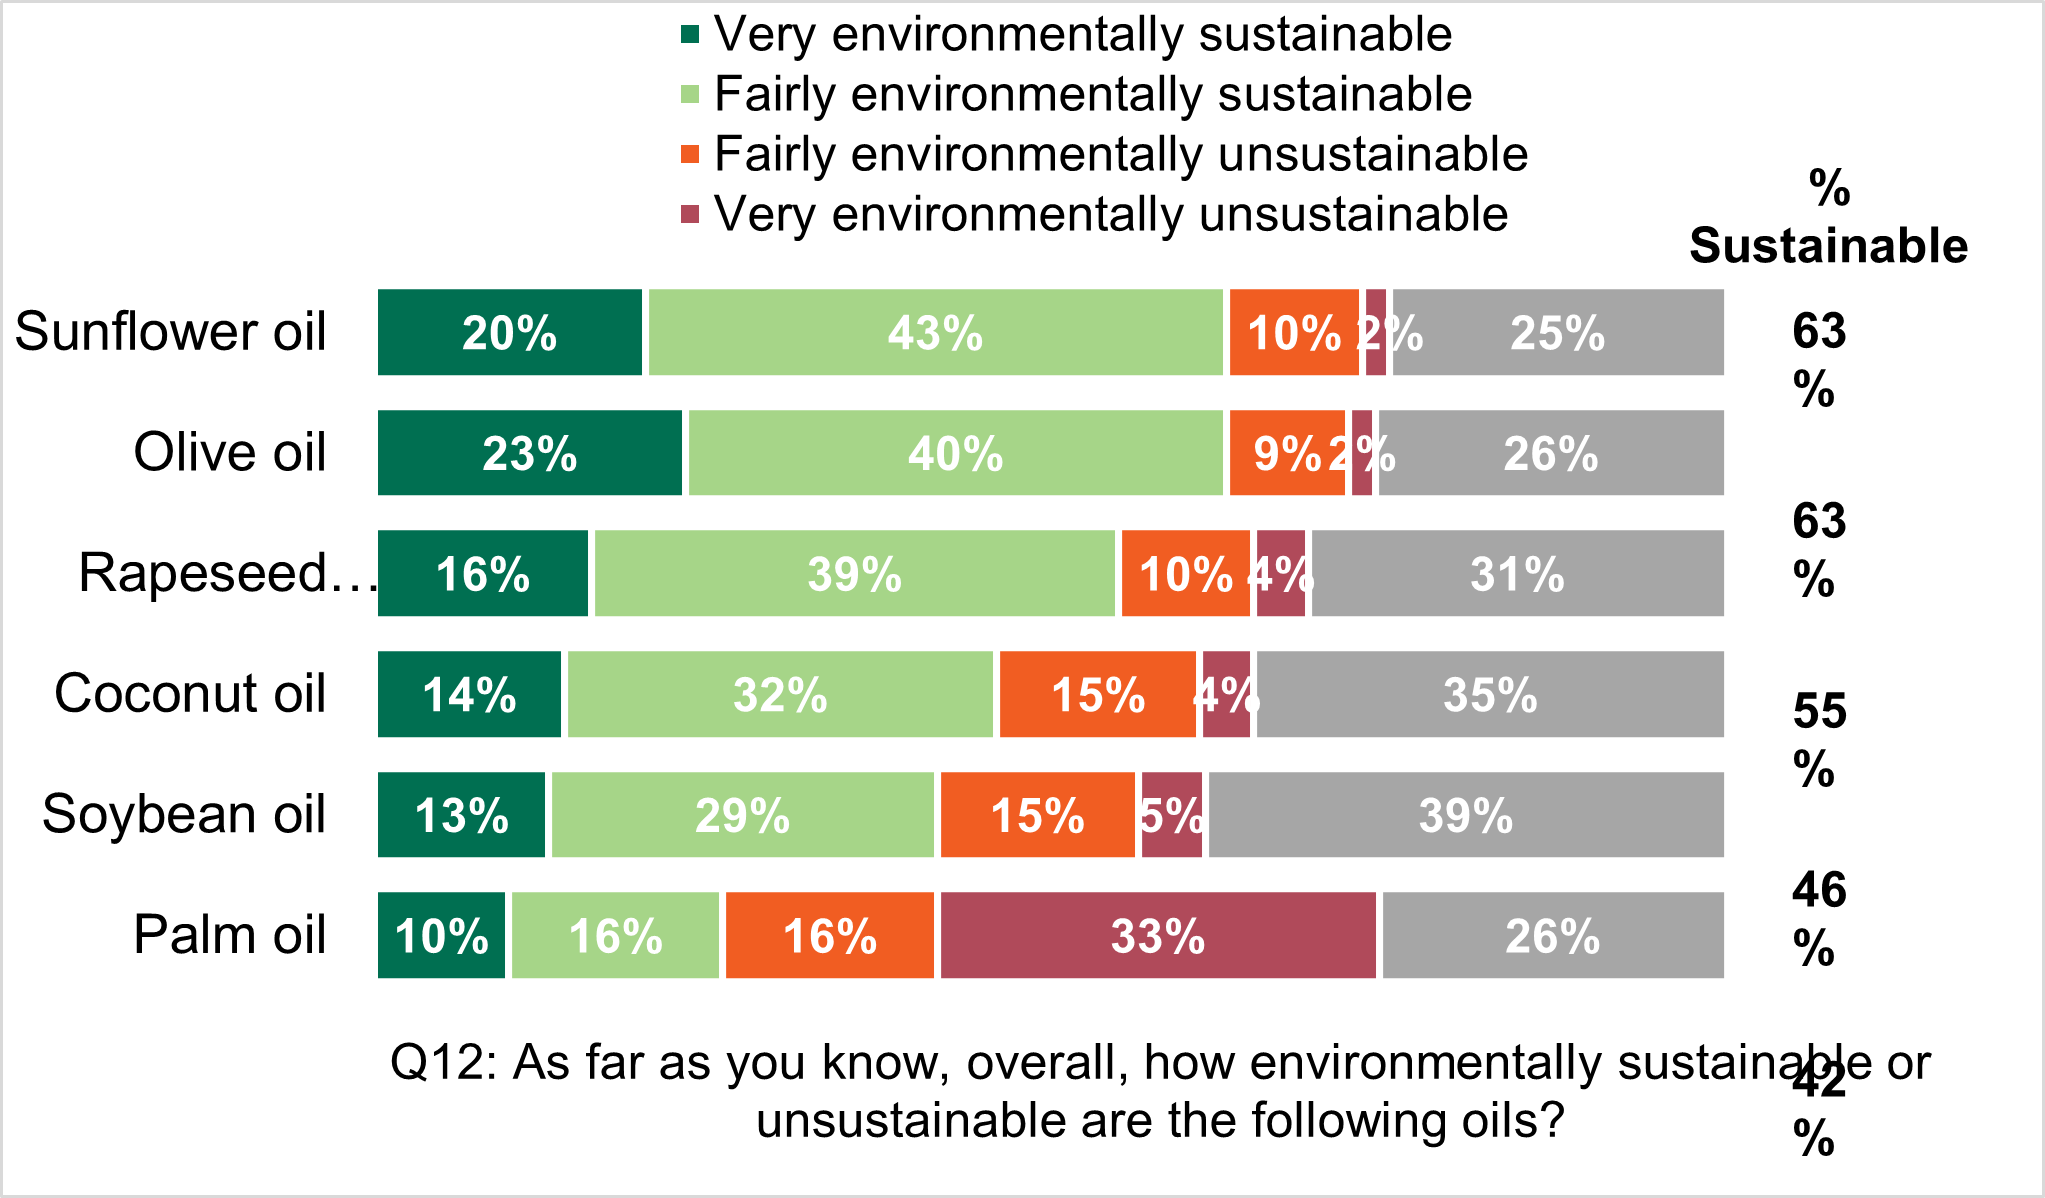
What are consumer perceptions of the environmental sustainability of oils?
When asked about environmental sustainability, most adults say sunflower oil (63%), olive oil (63%) and rapeseed oil (55%) are sustainable. More people than not say coconut oil (46%) and soybean oil (42%) are sustainable. Only a quarter (25%) say palm oil is sustainable, with half (49%) saying it is unsustainable.
Figure 7 Perceptions on how environmentally sustainable or unsustainable oils are
Base: all adults aged 16-75 in England, Wales, and Northern Ireland (2063). Percentages might not add up to 100% due to rounding.
Methodology
Ipsos UK ran an online survey in May 2022 using the Ipsos UK i:Omnibus with 2,063 respondents, nationally representative of adults aged 16 to 75, living in England, Wales, and Northern Ireland. Data was collected between 6th to 9th May 2022.
Quotas for the overall sample were set on age, gender and working status. The overall sample was weighted to be representative of the adult population aged 16 to 75 living in England, Wales and Northern Ireland on key demographics: age, gender, working status and social grade.
All the differences which have been commented on within this report are statistically significant, unless otherwise stated. The significance tests used are two tailed and are based on a 95% confidence interval. This means that should the samples be drawn 100 times, in 95% of those cases we would find a difference between the two numbers being compared. While statistical theory assumes that samples are drawn using purely random methods, it is standard practice to conduct significance testing on non-probability quota samples and we have employed this here. The statistical test used accounts for overlapping samples. No correction has been applied for multiple testing.
The full dataset of questions and responses is published separately to this executive summary on the FSA data catalog.
This executive summary report only comments on key findings from the survey. Further information, including more detailed demographic analysis is published alongside this report in data tabulations – see Annex 1 for more information on reading these data tables.
Note on interpreting the data
Results should be interpreted with care. All surveys are subject to a range of potential sources of error including sample imbalances which are not easily identified and corrected through weighting and errors in respondents’ interpretation of survey questions and response options. The data reported within this report relies on respondents’ self-reported behaviours. Errors could occur due to imperfect recollection, or respondents’ tendency to overreport behaviours which are perceived as being desirable and underreport undesirable behaviours.
Note on reading the data tabulations
Alongside the report, Ipsos also provided data tabulations.
Each table includes the following information:
- unweighted base size for example, the number of respondents who answered each question
- weighted base size for example, the number of respondents who answered each question after demographic weights were applied. The weighted base size is used to calculate the shares of respondents in percentage points giving each answer
- significance testing between different groups giving an answer. Each column, representing a group is assigned a letter. Letters below a percentage point signifies that that percentage point is significantly higher than the corresponding share. For example, the letter A would indicate that a percentage is significantly higher than the corresponding percentage given by the group labelled A
- small base notices. The sign (*) indicates a base size under 100. The sign (**) indicates a base size under 30. Results based on small base sizes should be interpreted with care as they are subject to wider confidence intervals