page
Annex 3 - Analysis of welfare trends for major and critical non-compliances in England and Wales
23-09-06 Annex 3 Analysis of welfare trends for major and critical non-compliances in England and Wales report for April 2022 to March 2023.
Management summary
- Throughout this report ‘FY 2022’ refers to the year from April 2022 to March 2023.
- Total slaughterhouse non-compliances have decreased by 5% in FY 2022.
- SOP related cases have decreased by 41% i.e., 22 to 13 cases in FY 2022, and other animal welfare non-compliances have decreased by 5% from 283 to 270 cases.
- Lairage remains the process point with the highest number of non-compliance cases (113 i.e., 3 less than FY 2021) at 32% of the total number of non-compliances for FY 2022.
- The process points that recorded decreases in FY 2022 are Lairage 113 (change -3), Movement 69 (change -14), Stunning 50 (change -14) and Bleeding 41 (change -13). Management 55 (change +12). Unloading 25 (change +13) and Other 1 (change +1) recorded increased levels over their FY 2021 cases.
- Lairage (32%), movement (19%) and management (16%) were the top 3 locations for non-compliances, accounting for 65% of all cases.
- Poultry related breaches accounted for more than a third (37%, change +4pts) of all cases, cattle (27%, unchanged), sheep (25%, change -3pts) and pigs at 10% (-3pts).
- Poultry was the only animal species which recorded an increase in non-compliances, from 123 to 132 cases in FY 2022 (an increase of 7%). All other species recorded decreases, cattle by 4% (99 to 95), pigs by 28% (47 to 34) and sheep by 13% (103 to 90).
- Comparing FY 2022 to 2021 by quarters for slaughterhouse only, Q1 and Q3 of FY 2022 recorded 19% and 8% decrease in non-compliances respectively compared with the previous year. Q2 and Q4 had 2% and 6% increases respectively over the previous year’s levels.
- Cattle related on-farm breaches halved (reduced by 51% from 321 to 156 cases) in FY 2022 compared with FY 2021, while transportation cases increased by 50% from 375 to 561 cases.
Section 1: Analysis of non-compliance by location
The FSA delivers animal welfare controls and enforcement in slaughterhouses on behalf of Defra (England) and Welsh Government (Wales). Animal welfare non-compliances from farm or transportation are referred to the competent authority responsible for investigation and enforcement; Animal and Plant Health Agency (APHA) or the Local Authority (LA).
Figure 1 illustrates the comparative change in non-compliance levels for the respective animal welfare locations over the last 4 financial years: FY 2019 to FY 2022. This shows that, transport related non-compliances increased by 8% in FY 2022, on-farm non-compliances decreased by 36% and slaughterhouse decreased by 5%.
Figure 1: Changes in non-compliances by financial years and location.
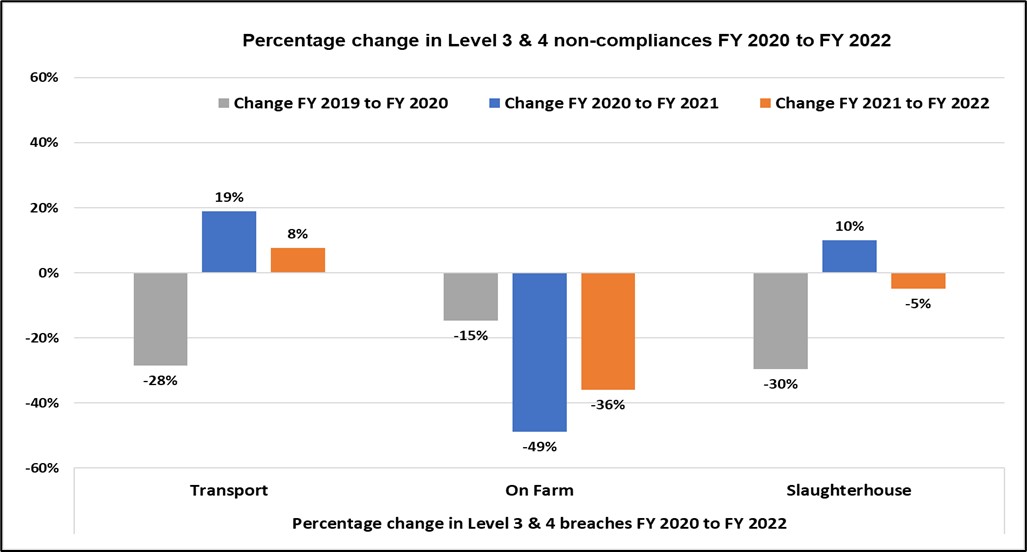
Figure 2 shows the comparative trends in non-compliance levels for the respective locations from FY 2019 to FY 2022.
Figure 2: Trends in non-compliances per location.
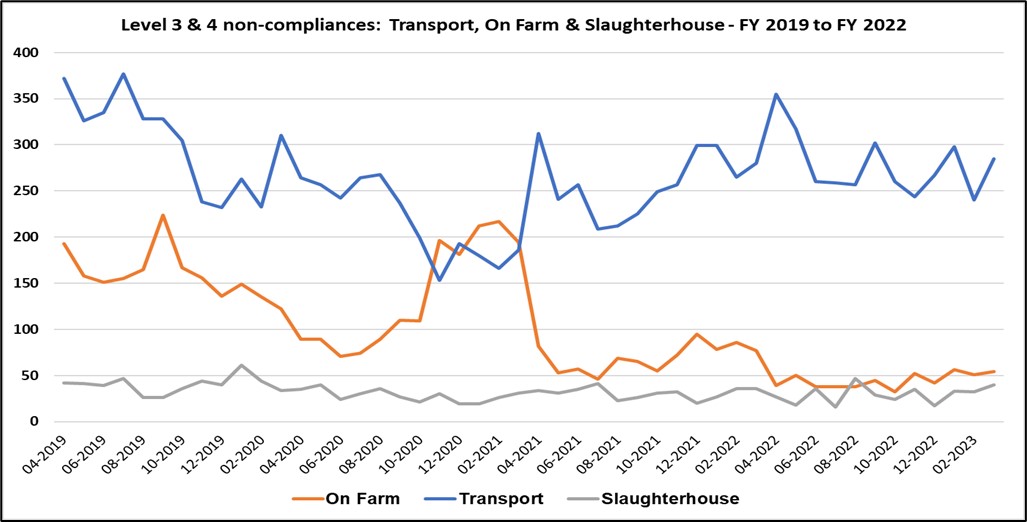
Table 1 below is a summary of non-compliances by severity (level 3 and 4) by location (transport, on farm, and slaughterhouse) for the last 3 financial years (FY 2020 to FY 2022). Compared with other locations, slaughterhouse non-compliances are relatively evenly split between major and critical cases, whereas in the other locations majority of the breaches tend to be critical non-compliances. This is because FSA are present during slaughter activities and will consequently identify technical non-compliances and those with the potential to cause harm, whereas non-compliances from the farm or from transport are often visible at the point of inspection at unloading of the animals at the slaughterhouse and have caused harm to the animal.
Table 1: Number of non-compliances by financial years and location.
Animal welfare breaches: April 2020 to March 2021 (FY 2020)
| Severity | Transport | On Farm | Slaughterhouse |
|---|---|---|---|
| Level 3 | 26 | 17 | 176 |
| Level 4 | 2583 | 1614 | 162 |
| - | 2609 | 1631 | 338 |
Animal welfare breaches: April 2021 to March 2022 (FY 2021)
| Severity | Transport | On Farm | Slaughterhouse |
|---|---|---|---|
| Level 3 | 38 | 10 | 192 |
| Level 4 | 3067 | 825 | 180 |
| - | 3105 | 835 | 372 |
Animal welfare breaches: April 2022 to March 2023 (FY 2022)
| Severity | Transport | On Farm | Slaughterhouse |
|---|---|---|---|
| Level 3 | 21 | 7 | 198 |
| Level 4 | 3323 | 528 | 156 |
| - | 3344 | 535 | 354 |
Section 2: Slaughterhouse only analysis
Figure 3 illustrates the composition of total non-compliances in FY 2020 to FY 2022 by different categories i.e., Annex II, CCTV related, and Regular. Annex II non-compliances appeared in FY 2019 because of regulatory change and are not expected to be recorded beyond FY 2020.
For this chart:
- ‘Regular’ means animal welfare non-compliances identified in person by the FSA Official.
- ‘CCTV (live and retrospective)’ means those identified via CCTV review by the FSA Official.
- 'CCTV regulation’ means breaches of CCTV regulations.
- 'No SOP’ refers to No SOPs in place, or not available, or inadequate.
Although No SOP non-compliances are a subset of Regular non-compliances they are separated out due to their prominence of occurrence historically.
In FY 2022, the proportion of CCTV (live and retrospective) non-compliances remains unchanged from FY 2021 at 15%. The proportion of CCTV regulation non-compliances increased by 2ppts from 3% in FY 2021 to 5% in FY 2022. The proportion of No SOP non-compliances decreased by 2ppts from 6% in FY 2021 to 4% in FY 2022.
Comparing FY 2021 and FY 2022 CCTV (live and retrospective) breaches decreased by 5% (from 56 to 53), but CCTV regulation non-compliances increased by 64% from 11 to 18. Recorded incidents of No SOPs decreased by 41% from 22 cases in FY 2021 to 13 in FY 2022, and the proportion of Regular non-compliances decreased by 5% from 283 to 270 cases.
Overall, recorded incidents of slaughterhouse non-compliances decreased by 5% in FY 2022 (from 372 to 354).
Figure 3: Breakdown of slaughterhouse non-compliances by financial year.
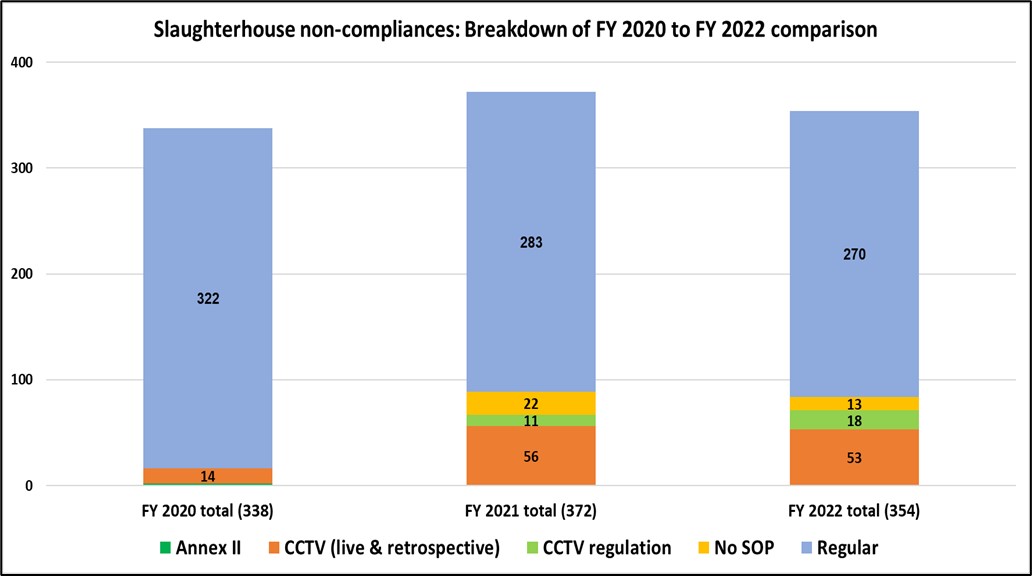
Figure 4 highlights the total non-compliance comparison between FY 2021 and FY 2022 by quarters. The comparison shows increased levels of non-compliances in Q2, and Q4 of FY 2022 compared with the same period in FY 2021. Compared with FY 2021, there were increases of 2% (90 to 92) and 6% (99 to 105) in Q2 and Q4 respectively in FY 2022. These increases were offset by comparative decreases of 19% and 8% respectively in Q1 and Q3 of FY 2022.
Increased levels of non-compliances in Q4 were mainly due to increased management non-compliances and non-compliances identified at unloading in comparison with the same period in FY 2021, their combined totals more than doubled from 13 to 27 cases.
Figure 4: Change in slaughterhouse non-compliances by financial year quarters FY 2021 vs FY 2022.
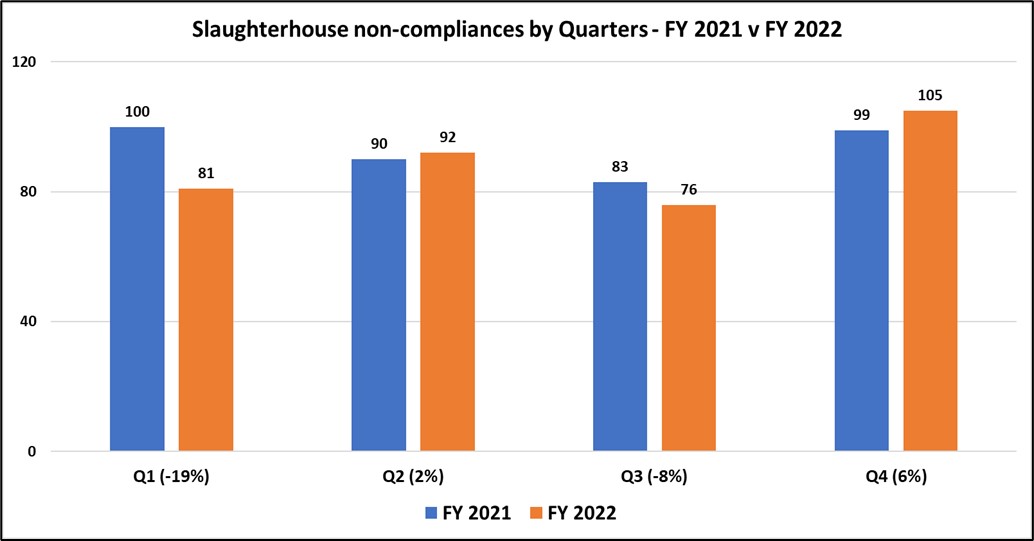
Figures in brackets indicates the proportional change in non-compliance compared with the same quarterly level in FY 2021.
Figure 5 shows non-compliances by process points within the slaughterhouse. Sheep related lairage cases account for 12% of all slaughterhouses non-compliances (a decrease of 2ppts) followed by cattle lairage with 11% of the total breaches in FY 2022, an increase of 5ppts from 6% in FY 2021. In terms of the actual number of non-compliances, cattle related lairage increased by 63% from 24 cases in FY 2021 to 39 cases in FY 2022.
Figure 5: Number of non-compliances by animal species and process point – FY 2022.
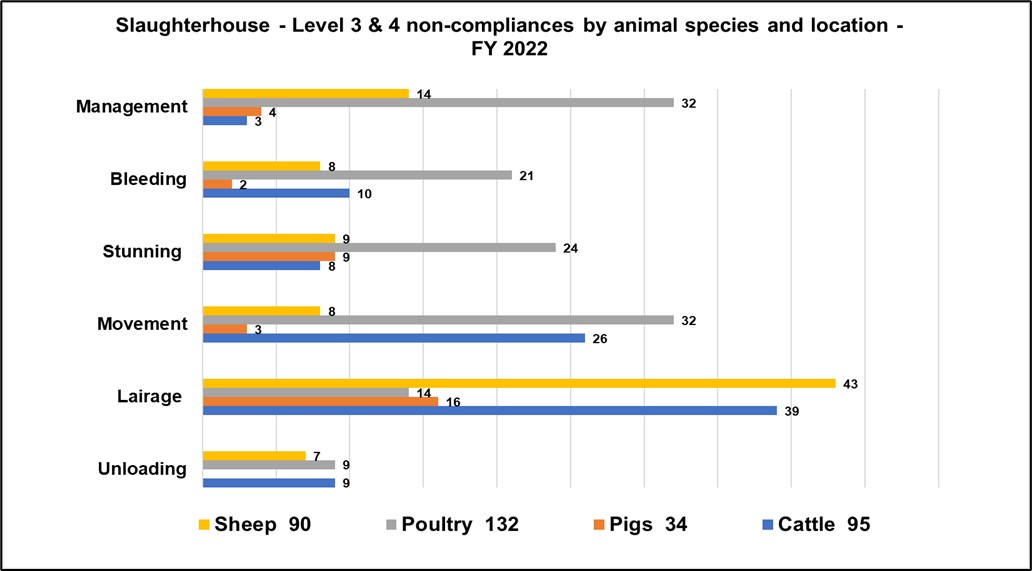
Figure 6 illustrates the comparative change in the non-compliance numbers for FY 2021 and FY 2022 by process types per animal species in slaughterhouses. It captures changes across animal species year on year. For example, it highlights the increased numbers in lairage of cattle discussed in the previous paragraph. This also highlights the significant increase i.e., doubling in the number of management related cases in poultry from 16 cases in FY 2021 to 32 cases in FY 2022.
Figure 6. Comparison of FY 2021 and FY 2022 slaughterhouse non-compliances by animal species.
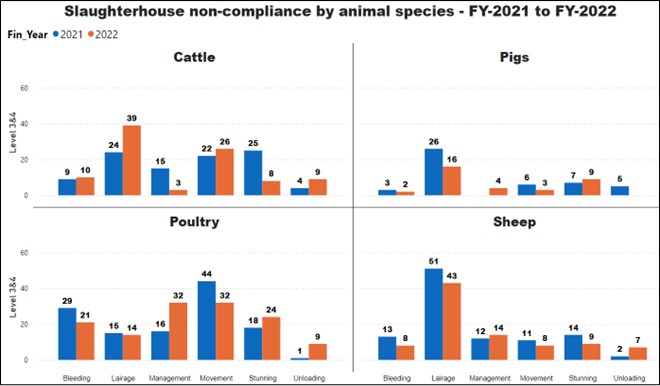
Figure 7 shows slaughterhouse breaches split by severity over the past four years. The number of level 4 non-compliances decreased by 13% in FY 2022 from 180 cases in FY 2021 to 156, while level 3 non-compliances increased by 3% in FY 2022 (from 192 to 198). The chart also shows that the overall increase in non-compliances in Q4 of FY 2022, was driven by a 25% and 57% increase in level 3 and 4 cases respectively.
Figure 7: Trends in slaughterhouse non-compliances – FY 2019 to FY 2022
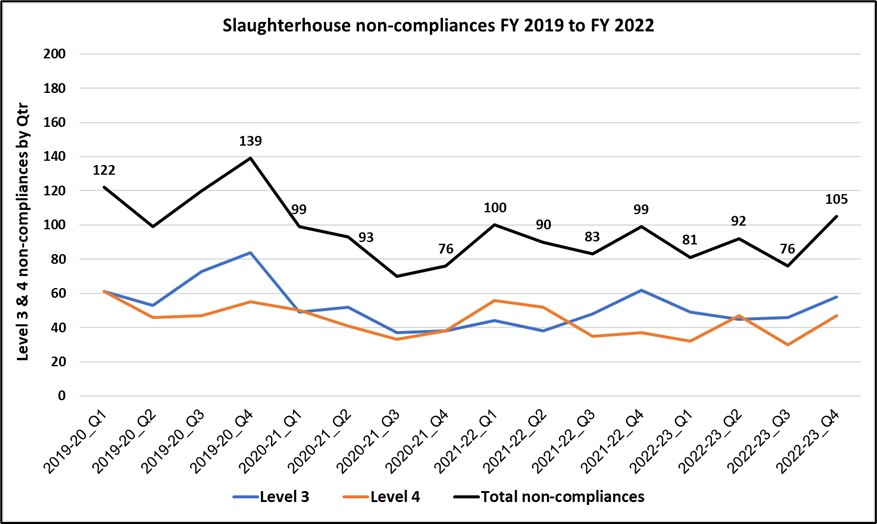
Figure 8 illustrates the change in numbers of non-compliances across all animal species in FY 2022 in comparison with FY 2021. Cases involving cattle have decreased by 4% (99 to 95), pigs by 28% (47 to 34), sheep by 13% (103 to 90) and poultry has increased by 7% from 123 to 132. Cattle account for 27% of total non-compliances unchanged from FY 2021, pigs 10% (-3), poultry 37% (+4) and sheep 25% (-3). Other animal species make up the remaining 1%.
Figure 8. Change in the number of non-compliances per financial year by animal species.
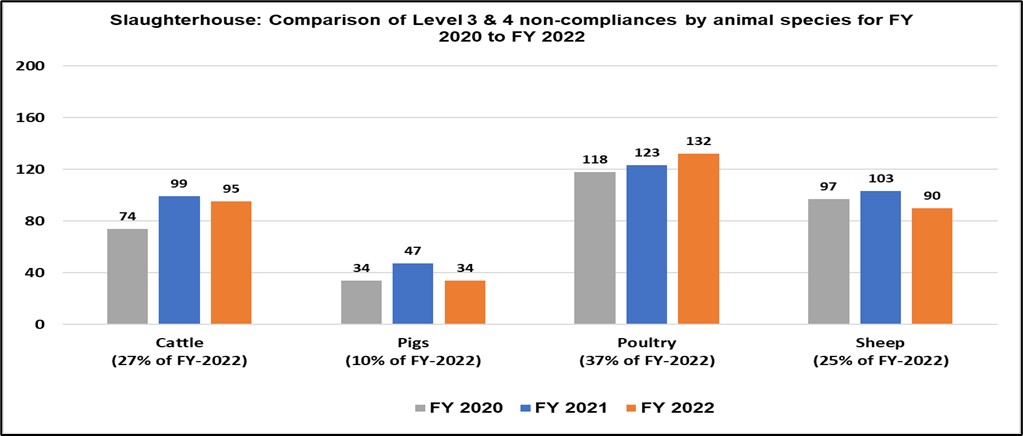
*Figures in brackets represent proportion of FY 2022 total. The proportions shown in brackets do not add up to 100% due to the exclusion of ‘Other’ species from the chart.
Figure 9. shows the split by severity of cases for each of the slaughterhouse process points. Lairage has113 total cases with 67% and 33% level 3 and 4 respectively. Movement (69 total cases) has the highest proportion of level 4 cases (61%), followed by bleeding (41 total cases) with 56% being level 4 cases and unloading (25 total cases) with 52%.
Figure 9: Slaughterhouse non-compliances by process point – FY 2022.
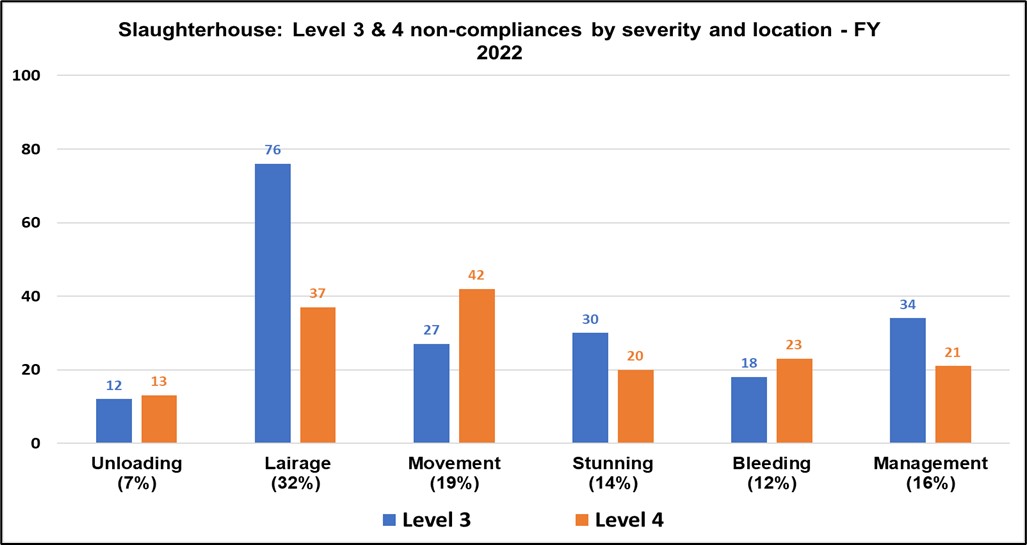
*Figures in brackets represent proportion of FY 2022 total.
Figure 10 illustrates the changes in non-compliances by process point between FY-2021 and FY-2022. The chart shows increased cases in management, unloading and other locations compared with FY 2021 with decreases in the other process points.
Figure 10: Change in number of slaughterhouse non-compliances by process point – FY 2022.
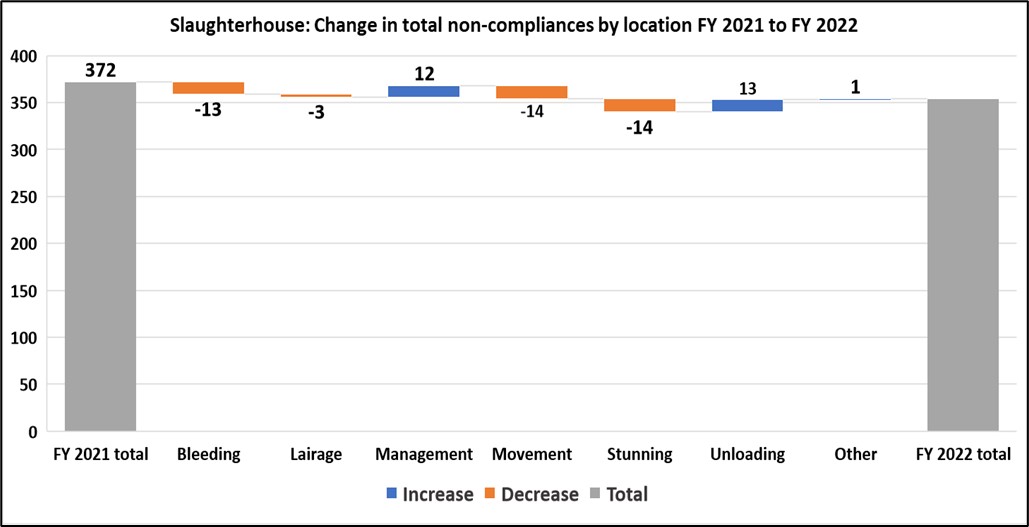
Other includes some non-compliances that are recorded in multi-species plants for deficiencies that affect all other animal species, that the FBO processes for example structural deficiencies or deficiencies in the CCTV system.
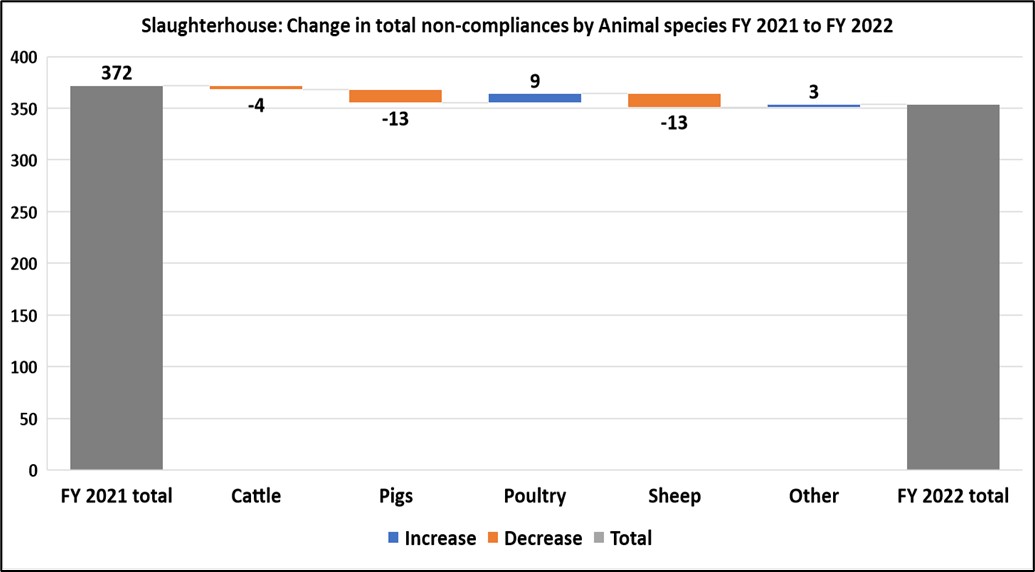
Figure 11 also highlights the increases in non-compliances across all the identifiable categories of animal species in FY 2022. Poultry and other species had increases of 9 and 3 cases respectively. All other animal species recorded decreases, including cattle (-4), pigs (-13) and sheep (-13).
Figure 11. Change in number of slaughterhouse non-compliances by animal species – FY 2022.
Section 3: Analysis of Transport and On Farm non-compliances
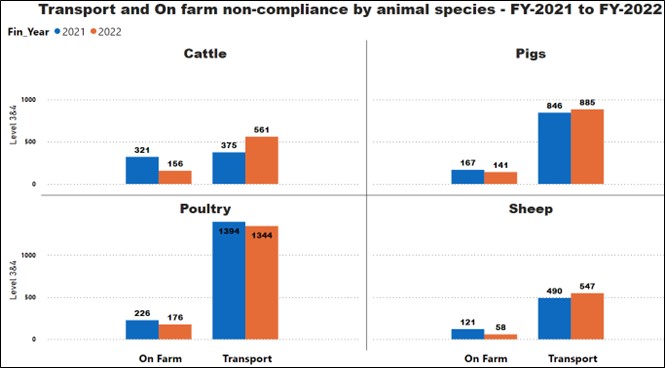
Figure 12 illustrates changes in the number of on-farm and transport related non-compliances for FY 2021 and FY 2022. The significant changes in non-compliances in both locations are in relation to cattle and sheep. Cattle related on-farm breaches halved (reduced by 51% from 321 to 156 cases) in FY 2022 compared with FY 2021, while transportation cases increased roughly by 50% from 375 to 561 cases mainly due to the re-categorisation of some non-compliances from on-farm to transport.
Figure 12: Non-compliances in Transport and On-farm by animal species
Tables 2 and 3 highlight the major sources of On-farm non-compliances in FY 2022 and compares with their previous levels. Dead on arrival (DOA) remains the leading source of transport related non-compliances but decreased by 17% in FY 2022. The category which experienced the highest level of increase is DOA with multiple deaths (this category was only introduced partway through FY 2021), has seen a fourfold increase in FY 2022 compared with the previous year.
Some non-compliances namely, incoordination/unable to walk/unable to stand, open wounds, and lameness were re-classified from on-farm to transportation breaches in FY 2022. As a result of this change, for transport (table 2) it gives the appearance that these categories have suddenly increased in FY 2022, but there were no entries for them in FY 2021.
For on-farm non-compliances, tail bites (240%, from 20 to 68 cases), overgrown/ingrown horn (85%, 13 to 24) and eye infection (6 to 9 cases) non-compliances are the categories which have increased. The other* group in table 3 shows a decrease of 68% (from 428 to 137 total cases), but the figure for FY 2021 includes 303 cases of the non-compliances that have been re-categorised as transport in FY 2022.
Table 2. Causes of Transport non-compliances - FY 2021 v 2022
| Type | FY 2021 | FY 2022 | Change |
|---|---|---|---|
| Dead on Arrival (DOA) | 1470 | 1219 | -17% |
| Trapping | 1002 | 953 | -5% |
| Dead On Arrival (DOA) - Multiple deaths | 78 | 350 | 349% |
| Late stages of pregnancy - identified at PM | 332 | 279 | -16% |
| Incoordination/unable to walk/unable to stand (1) | - | 182 | - |
| Open wounds (2) | - | 59 | - |
| Lameness Score of 3 (3) | - | 51 | - |
| Broken leg | 50 | 43 | -14% |
| Lameness score of 4 (4) | - | 35 | - |
| Other* | 173 | 173 | 0% |
Other* – the sum of all the remaining 31 minor categories in FY 2022.
1,2,3,4 – These non-compliances were re-categorised as transport breaches in FY 2022 (previously on-farm) and explains why there were no cases in FY 2021.
Table 3. Causes of On Farm non-compliances - FY 2021 v 2022
| Type | FY 2021 | FY 2022 | Change |
|---|---|---|---|
| Bruising | 75 | 72 | -4% |
| Broken limbs | 77 | 71 | -8% |
| Tail bites | 20 | 68 | 240% |
| Pododermatitis | 75 | 57 | -24% |
| Open wounds | 68 | 48 | -29% |
| Prolapse | 50 | 34 | -32% |
| Overgrown/Ingrown horn | 13 | 24 | 85% |
| Emaciation | 23 | 14 | -39% |
| Eye infection | 6 | 9 | 50% |
| Other* | 428 | 137 | -68% |