Eating Well Choosing Better Tracker Survey Wave 8 2022
EWCB 2022: Results
Northern Ireland specific
This section of this report includes findings on participants’ understanding of healthy eating, the daily recommended calorie intake and the traffic light label. It also includes findings on attitudes and behaviours towards reformulation including reduced portion sizes and healthier options outside the home.
Views and understanding of healthy eating
This section of the report explores participants’ views of their own personal eating habits and that of their children as well as their understanding of healthy eating and the ease with which they can make healthier choices. Comparisons to 2021 and 20202 survey data have been included throughout.
Views on the meaning of ‘healthy eating’ varied. Many perceived healthy eating to simply mean having a balanced diet, keeping to the correct portion sizes and eating plenty of fresh food such as fruit and vegetables, fish and chicken, while others believed that healthy eating meant avoiding unhealthy foods such as fast food, fried or processed foods.
- “Varied balanced diet and 5 a day and not eating take outs every day.”
- “Small portions, vegetables, no processed foods.”
- “Eating plenty of fruit and vegetables, eat plenty of fish and chicken and no processed foods.”
- “No fried food or take outs.”
There were also frequent mentions of carbohydrates or opting for low carbohydrate options and reducing sugar, salt and fat intake.
- “Reduce sugars, saturated fats, eat 5 portions of fruit a day. Follow food pyramid and food plate guidelines.”
- “Eating stuff with less sugar, oil and less carbohydrates.”
- “Balanced diet, such as fruits, nuts, lean meat, low carbs, and low starch.”
Some participants associated healthy eating with cooking at home, eating vegetarian or following a flexitarian diet.
- “I am a fairly healthy eater, I am flexitarian.”
- “Replacing take outs with home cooked vegetables and lean meat.”
- “Healthy eating is eating a range of fresh fruit and vegetables, cooked at home.”
- “Watching out for hidden sugars and fats in food, for me it’s being vegetarian.”
Perceptions of healthy eating habits
Participants were asked the extent to which they agreed or disagreed that their personal eating habits are healthy.
In 2022, 63% of participants agreed that their personal eating habits were healthy, this is lower than 2021 (69%) but higher than 2020 (57%). More participants disagreed that their personal eating habits were healthy in 2022 (16%) than in 2021 (6%) (Figure 1).
Figure 1: Participants who ‘agree’ or ‘disagree’ that their personal eating habits are healthy
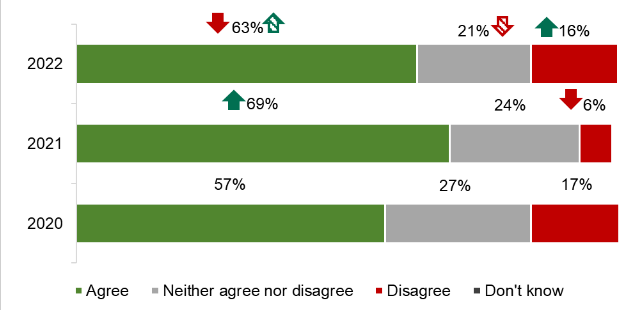
Base: Adults in Northern Ireland: 2022 (611), 2021 (603), 2020 (601)
The green arrow indicates significantly higher than previous year, the green patterned arrow indicates significantly higher than 2020.
The red arrow indicates significantly lower than previous year, the red patterned arrow indicates significantly lower than 2020.
Note: Totals do not add to 100% due to rounding.
Over 7 in 10 (72%) agreed that their children's eating habits were healthy; this has increased since 2020 (62%) (Figure 2).
Figure 2: Participants who ‘agree’ or ‘disagree’ that their children’s eating habits are healthy’
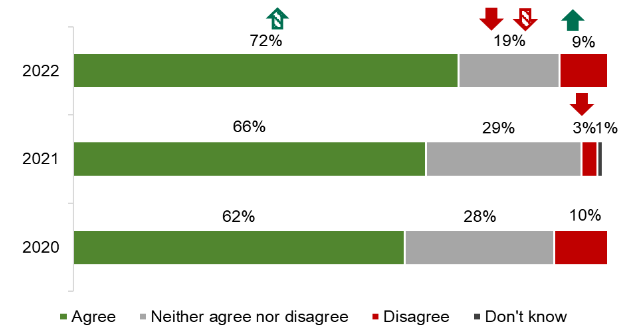
Base: Adults in Northern Ireland: 2022 (200), 2021 (134), 2020 (181)
The green arrow indicates significantly higher than previous year, the green patterned arrow indicates significantly higher than 2020.
The red arrow indicates significantly lower than previous year, the red patterned arrow indicates significantly lower than 2020.
Note: Totals do not add to 100% due to rounding.
Understanding of what is healthier and what is less healthy
Participants were asked the extent to which they agreed or disagreed that they understand what is healthier and what is less healthy.
In 2022, there was no change on whether participants agreed or disagreed that they understood what is healthier and what is less healthy since 2021 (Figure 3).
Figure 3: Participants who ‘agree’ or ‘disagree’ that they understand what is healthier and what is less healthy
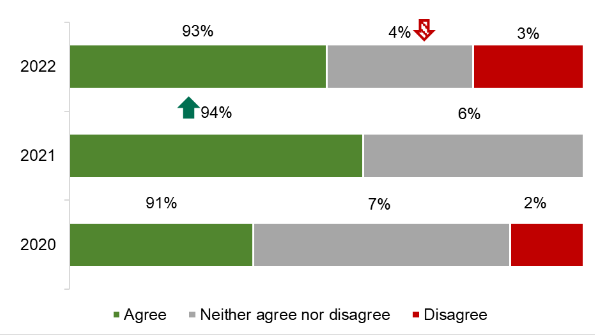
Base: Adults in Northern Ireland: 2022 (611), 2021 (603), 2020 (601)
The green arrow indicates significantly higher than previous year.
The red patterned arrow indicates significantly lower than 2020.
Seeking healthier options
Participants were asked the extent to which they agreed or disagreed that they ‘actively seek out healthier options when shopping’.
Almost 7 in 10 (69%) agreed that they actively seek healthier options; higher than 2020 (61%). The proportion of participants who disagree that they actively seek healthier options when shopping has increased from 8% in 2021 to 14% in 2022 (Figure 4).
Figure 4: Participants who ‘agree’ or ‘disagree’ that they actively seek healthier options when shopping
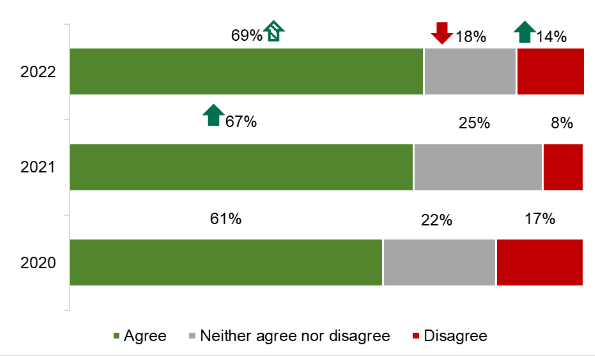
Base: Adults in Northern Ireland: 2022 (611), 2021 (603), 2020 (601)
The green arrow indicates significantly higher than previous year, the green patterned arrow indicates significantly higher than 2020.
The red arrow indicates significantly lower than previous year.
Participants were asked the extent to which they agreed or disagreed that they actively seek out healthier options when eating out.
There was no change since 2021 on whether participants agreed that they actively seek healthier options when eating out; one third (33%) agreed with this statement in 2022. Many disagreed that they actively seek healthier options when eating out (45%), higher than 2021 (32%) and 2020 (39%) (Figure 5).
Figure 5: Participants who ‘agree’ or ‘disagree’ that they actively seek healthier options when eating out
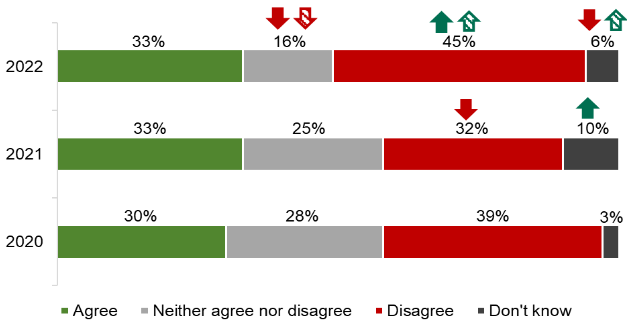
Base: Adults in Northern Ireland: 2022 (611), 2021 (603), 2020 (601)
The green arrow indicates significantly higher than previous year, the green patterned arrow indicates significantly higher than 2020.
The red arrow indicates significantly lower than previous year, the red patterned arrow indicates significantly lower than 2020.
Understanding and awareness of recommended daily calorie intake
This section of the report investigates participants’ knowledge of the UK government’s recommended daily calorie intake for males and females.
There was considerable variation in the understanding of the recommended daily calorie intake for both men and women. A large proportion of participants were not aware of the government recommended daily calorie intake for their gender, although this was notably higher for males. The government recommended daily intake of calories for males is 2,500kcal and for females is 2,000kcal (Public Health England 2016).
Knowledge of recommended daily calorie intake amongst male participants
Similar to previous years, more males either incorrectly identified the recommended daily calorie intake for their gender (36%) or they didn't know the answer (46%), compared to those who correctly identified the correct intake (18%). This is a similar trend to previous years, although the proportion of males giving an incorrect answer increased considerably in 2022 (36%) compared to 2021 (23%) (Figure 6).
Figure 6: Male participants’ knowledge of recommended daily calorie intake for their gender
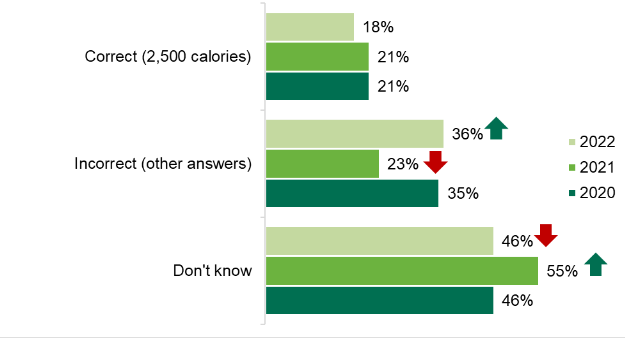
Base: Adult males in Northern Ireland: 2022 (302), 2021 (285), 2020 (288)
The green arrow indicates significantly higher than previous year.
The red arrow indicates significantly lower than previous year.
Note: Totals do not add to 100% due to rounding.
Knowledge of recommended daily calorie intake amongst female participants
A higher proportion of females were correctly able to identify the recommended daily calorie intake for their gender in 2022, compared to males. This is a similar trend to previous years. The proportion of females who were able to correctly identify the recommended daily calorie intake for their gender increased from 20% in 2021 to 28% in 2022 but was lower than the level in 2020 (31%). Fewer females did not know what the recommended daily calorie allowance was when compared to 2021 (26% in 2022 and 37% in 2021) (Figure 7).
Figure 7: Female participants’ knowledge of recommended daily calorie intake for their gender
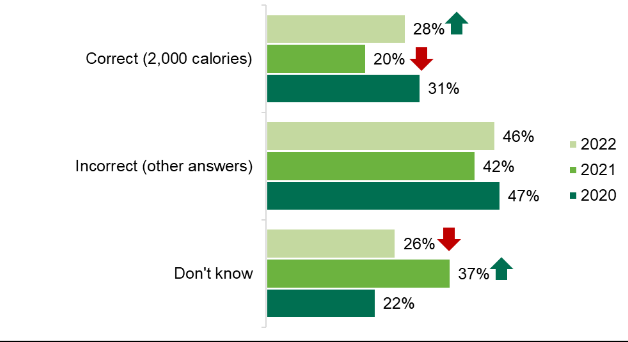
Base: Adult females in Northern Ireland: 2022 (309), 2021 (318), 2020 (312)
The green arrow indicates significantly higher than previous year.
The red arrow indicates significantly lower than previous year.
Note: Totals do not add to 100% due to rounding.
Food purchasing behaviour
This section of the report explores where participants shop for food.
Where participants purchase food
The majority of participants (88%) confirmed that they shop at a supermarket, and although this has decreased from 2021 (92%), supermarkets are still the main source of food shopping for NI consumers.
Over half said they shop at a local shop, newsagents or garage for food in a typical month in 2022 (56%), notably higher than 2020 (48%). While around a third (32%) said they shopped at an independent greengrocers, butchers, bakers or fishmongers; a decrease when compared to 2021 (49%).
In 2022, fewer participants shop for food at a market, farmer’s market or farm shop (6%) than they did in 2021 (10%) or 2020 (11%) (see Figure 8).
Figure 8: Locations where participants shop for food
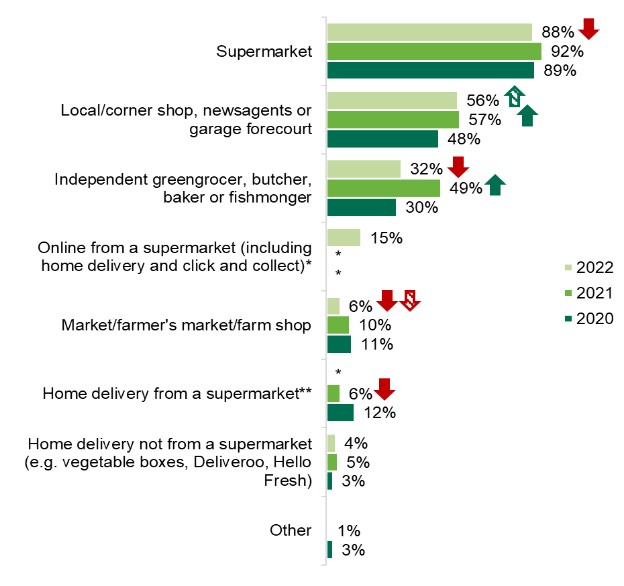
Base: Adults in Northern Ireland: 2022 (611), 2021 (603), 2020 (601)
The green arrow indicates significantly higher than previous year, the green patterned arrow indicates significantly higher than 2020.
The red arrow indicates significantly lower than previous year, the red patterned arrow indicates significantly lower than 2020.
Notes: Totals do not add to 100% as participants could select multiple responses.
Not included in year represented by *.
Home delivery from a supermarket was replaced by online from a supermarket (including home delivery and click and collect) in 2022.
Healthy eating behaviours
This section explores the extent to which participants use nutritional labelling to make informed food purchasing decisions and their awareness and understanding of the traffic light label.
Use of nutritional labelling
Looking at information on the front of the packet (34%) is the most common method used to check for nutritional information in 2022, which is higher when compared to 2020 (24%). Use of the traffic light labelling system is the second most common method used to check for nutritional information (29%), this has not changed when compared to previous years. One quarter (25%) look at the information on the back of the packet, and this is higher than in 2021 (20%) but less than 2020 (36%).
Around a fifth (19%) look at the ingredient list, which is unchanged from 2021. A small proportion use other methods to find out nutritional information when food shopping in-store (2%), this is less than the 5% who used other methods in 2020.
In 2022, 37% of participants who shop for food in-store stated that they do not try to find nutritional information when shopping in-store. This is a smaller proportion than 2021 (49%), but similar to 2020 (35%) (see Figure 9).
Figure 9: How participants find nutritional information when food shopping in-store
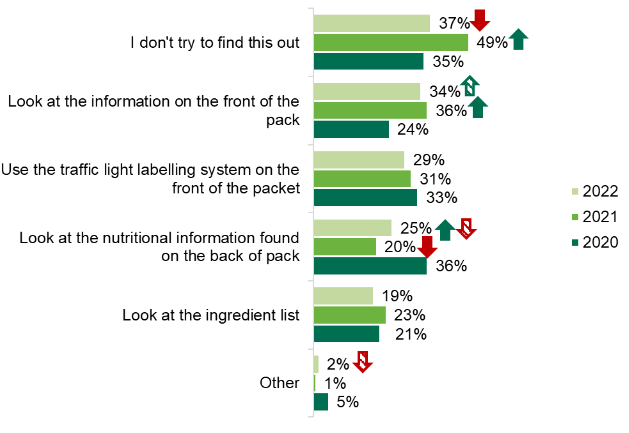
Base: Adults in Northern Ireland who shopped in store: 2022 (599), 2021 (601), 2020 (583) .
The green arrow indicates significantly higher than previous year, the green patterned arrow indicates significantly higher than 2020.
The red arrow indicates significantly lower than previous year, the red patterned arrow indicates significantly lower than 2020.
Note: Totals do not add to 100% as participants could select multiple responses.
Recognition and use of the traffic light label
Participants were shown an image of a traffic light label (Figure 10). Awareness of the traffic light label was high and is increasing when compared with 2021. More than nine in ten (91%) claimed to be aware of it in 2022, an increase from 2021 (87%) (Figure 11).
Figure 10: Traffic light label example
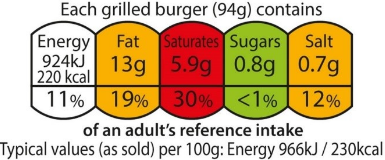
Figure 11: Participants who were, or were not, aware of the traffic light label
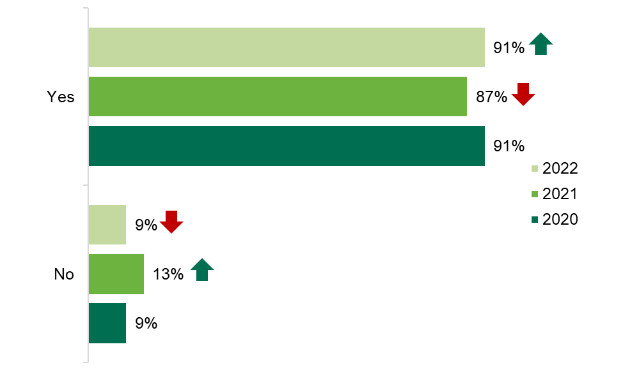
Base: Adults in Northern Ireland: 2022 (611), 2021 (603), 2020 (601)
The green arrow indicates significantly higher than previous year.
The red arrow indicates significantly lower than previous year.
Although awareness of the traffic light system was high, less than half of those who were aware of it make use of the label when food shopping (45%). This is lower when compared to 2020 where more than half claimed they used it (56%) (Figure 12).
Figure 12: Use of the traffic light label when food shopping
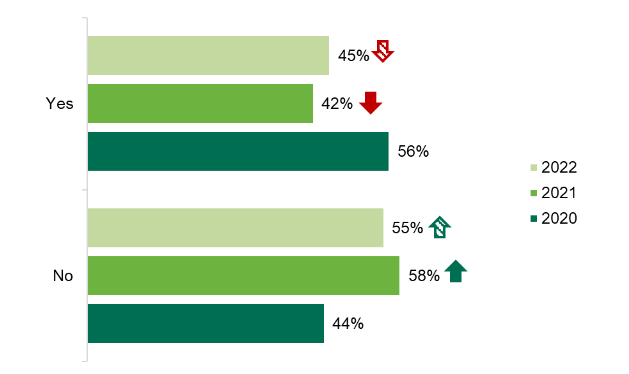
Base: Adults in Northern Ireland who recognised the traffic light image: 2022 (558), 2021 (525), 2020 (544).
The green arrow indicates significantly higher than previous year, the green patterned arrow indicates significantly higher than 2020.
The red arrow indicates significantly lower than previous year, the red patterned arrow indicates significantly lower than 2020.
Understanding of the traffic light label
Participants who recognised the traffic light label were asked about the extent to which they agreed or disagreed with the statement: ‘I understand what traffic light labels on the front of food packaging are for’1.
The majority of participants who recognised the traffic light label agreed that they understand the purpose of the label (85%), an increase from 2021 (79%). While 6% disagreed that they understood what the traffic light labels are for; an increase since 2021 (2%) (Figure 13).
Figure 13: Participant understanding of the traffic light label
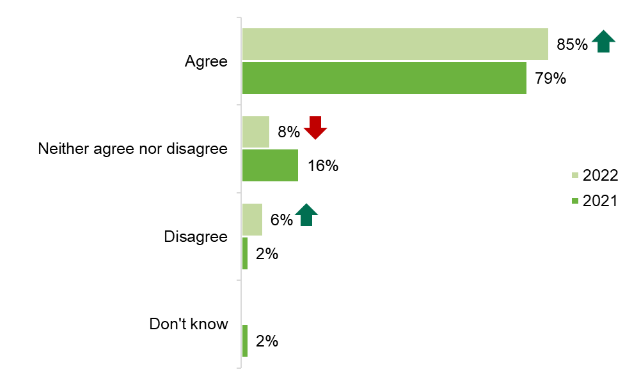
Base: Adults in Northern Ireland who recognise the traffic light image: 2022 (558), 2021 (525).
The green arrow indicates significantly higher than previous year.
The red arrow indicates significantly lower than previous year.
Note: Totals do not add to 100% due to rounding.
When probed further about the purpose of traffic light labels, some participants were able to provide an overview of the purpose of the label, while others were able to offer a more detailed understanding. Most participants correctly highlighted that the label is designed to provide information on calories, fat, sugar, and salt.
- “For people to make a snapshot judgement about how much salt, fat and sugar are in foods which makes it easier for comparing foods.”
- “To guide you to buy healthy options and provide information on salt, sugar, carbs, and calorie intake.”
Participants also identified that the colours were intended as a guide as to how much calories, fat, sugar and salt were in the product.
- “Red means something is particularly high, such as fat. Green means that the product has the right amount of something.”
- “Green is good. Red is high and bad generally.”
- “To give you a broad idea of the food contents, if it is green or orange it is not so bad.”
Some participants also noted how they use the labels personally when food shopping.
- “Encourage people to eat healthier, as they tell you fat and salt content. Not too many people look at them, but I do sometimes.”
- “Keeps me right so I can watch my weight.”
- “I take a quick look sometimes to see that it’s not all red.”
Frequency of using traffic light labelling to make healthier choices
Those who use the traffic light label when shopping for food were asked how often they choose foods with ‘healthier’ traffic light colours or foods with a lower percentage of the recommended daily calorie intake.
One in ten (10%) said that they ‘always’ use the traffic light label to select foods with ‘healthier’ traffic light colours, which has decreased since 2021 (22%). However, over half (52%) said that they use the label ‘most times'; ten percentage points higher than in 2021 (42%) (see figure 14).
Figure 14: Frequency of use of the traffic light label to choose foods with ‘healthier’ traffic light colours
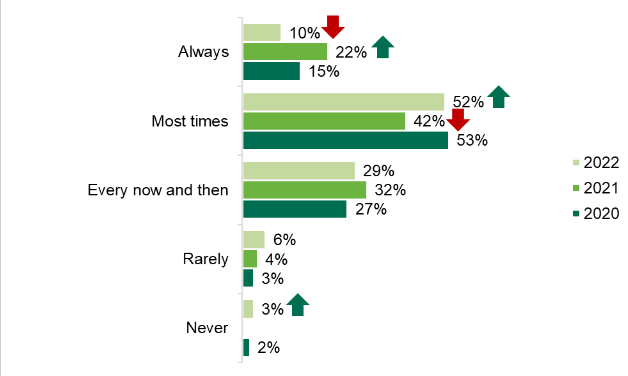
Base: Adults in Northern Ireland who use traffic light labelling: 2022 (254), 2021 (222), 2020 (306).
The green arrow indicates significantly higher than previous year.
The red arrow indicates significantly lower than previous year.
When asked how frequently they used the traffic light label to choose foods with a lower percentage of the recommended daily calorie intake in 2022, one in ten (10%) participants said that they use it ‘always’, which is unchanged from the previous year. More than one fifth (23%) said that they use it ‘most times’, which is less than the 35% who said they used the label most times in 2020. Around one quarter (26%) said they ‘rarely’ used the label to check for a lower percentage of the recommended daily calorie intake, higher than the 14% in both 2020 and 2021. Eleven percent said that they ‘never’ use the traffic light label for this reason, which is similar to previous years (Figure 15).
Figure 15: Frequency of use of the traffic light label to choose foods with a lower percentage of the recommended daily calorie intake
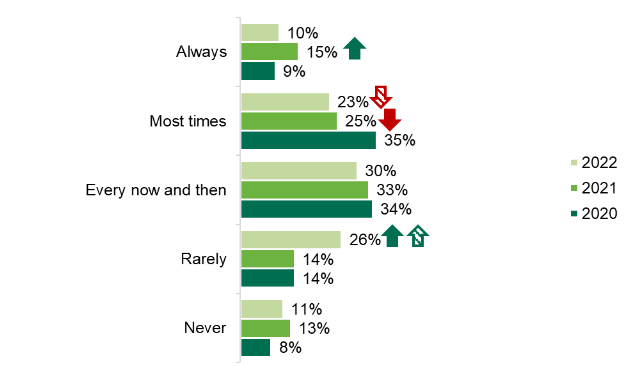
Base: Adults in Northern Ireland who use traffic light labelling: 2022 (254), 2021 (222), 2020 (306).
The green arrow indicates significantly higher than previous year, the green patterned arrow indicates significantly higher than 2020.
The red arrow indicates significantly lower than previous year, the red patterned arrow indicates significantly lower than 2020.
Use of the traffic light label when making food purchasing decisions
Participants were asked whether they look at certain information on the traffic light label when purchasing food for themselves and their children.
The information participants consulted on the traffic light label was dependent on whether they were purchasing food for themselves or their children.
Personal use of the traffic light label across all of the six uses has decreased when compared with 2021 and 2020, with significant decreases in 4 of the 6 (see Figure 16).
- Sugar: The majority who use traffic light labelling use it to understand the amount of sugar in products (70%), a smaller proportion than 2021 and 2020 (82% and 81% respectively).
- Fat: Almost 6 in 10 (57%) use the traffic light label to understand the amount of fat in products, this has decreased when compared to 2021 (79%) and 2020 (73%).
- Saturated fat: The same proportion of participants use the traffic light labelling to understand the amount of saturated fat in products (57%), which is unchanged from previous years.
- Salt: A similar proportion use the traffic light system to understand the amount of salt in products (55%), although this has decreased when compared to 2021 (70%) and 2020 (66%).
- Calories: In 2022, less than half use the label to check for calories (48%), a decrease since 2021 (64%) and 2020 (60%).
- Portion size: While around 3 in 10 (29%) use the traffic light to find out information on portion sizes, this has not changed from the previous year.
Figure 16: Personal use of traffic light labelling
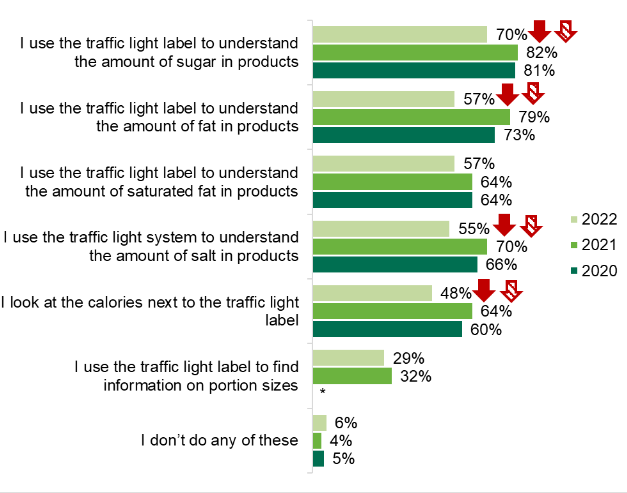
Base: Adults in Northern Ireland who use traffic light labelling: 2022 (254), 2021 (222), 2020 (306)
The red arrow indicates significantly lower than previous year, the red patterned arrow indicates significantly lower than 2020.
Note: Totals do not add to 100% as participants could select multiple responses.
Not included in 2020 represented by *.
In 2022 participants report using the traffic light label more to identify salt (60%) and sugar (78%) levels when purchasing food for their children than they do for themselves. However, participants report using the traffic light label more to identify calories, fat and portion size when purchasing food for themselves (see table 1 for comparison between personal and children).
Table 1: Use of traffic light label when food shopping for self and for children
Use of traffic light label when food shopping |
Personal food shopping |
Food shopping for children |
|---|---|---|
| I look at the calories next to the traffic light label | 48% | 34% |
| I use the traffic light label to understand the amount of fat in products | 57% | 51% |
| I use the traffic light label to understand the amount of saturated fat in products | 57% | 54% |
| I use the traffic light label to understand the amount of sugar in products | 70% | 78% |
| I use the traffic light system to understand the amount of salt in products | 55% | 60% |
| I use the traffic light label to find information on portion sizes | 29% | 21% |
| I don’t do any of these | 6% | 10% |
Base personal food shopping: 254 adults in Northern Ireland who use the traffic light label when food shopping.
Base food shopping for children: 99 adults with children in the household who use the traffic light label when food shopping.
Ease of choosing healthier food and meals
Participants were asked about how easy or difficult they find it to choose healthier food and meals in various settings.
In 2022, every food setting has had a significant change in the proportion of participants who say they found it difficult to choose healthier food, with the exception of ‘preparing meals at home’ (8%). The majority of participants (72%) find it difficult to choose healthier food when buying from a takeaway, decreasing from 78% in 2021 and 83% in 2020. The majority also found it difficult to choose healthier food when buying from a fast-food restaurant (63%), less than both 2021 (71%) and 2020 (73%).
Close to two thirds (63%) found it difficult to choose healthier food when buying from a place of leisure, this is less than 2021 (72%) and 2020 (77%). While the proportion who reported it was difficult to choose healthier when buying from a restaurant has decreased to 49% in 2022 from 64% in 2021.
Two fifths (40%) found it difficult to choose healthier food in cafés and sandwich shops, decreasing from 56% in 2021 and 49% in 2020. Over one third (36%) found it difficult to choose healthier food when buying from a vending machine, decreasing considerably when compared to 2020 (61%).
Choosing healthier food from a local/corner shop was reported to be difficult for 31% in 2022, decreasing from 57% in 2021. Around one tenth (9%) found it difficult to choose healthier food in staff restaurants in comparison to 12% in 2021. Choosing healthier food from a supermarket online was difficult for 5% in 2022 and 2021, compared to 13% in 2020). Less than one tenth (6%) reported finding it difficult to choose healthier food when buying from a supermarket in-store, decreasing from 2021 (22%) and 2020 (19%) (see Figure 17).
Figure 17: The proportion of participants who find it difficult to choose healthier food in food settings outside the home
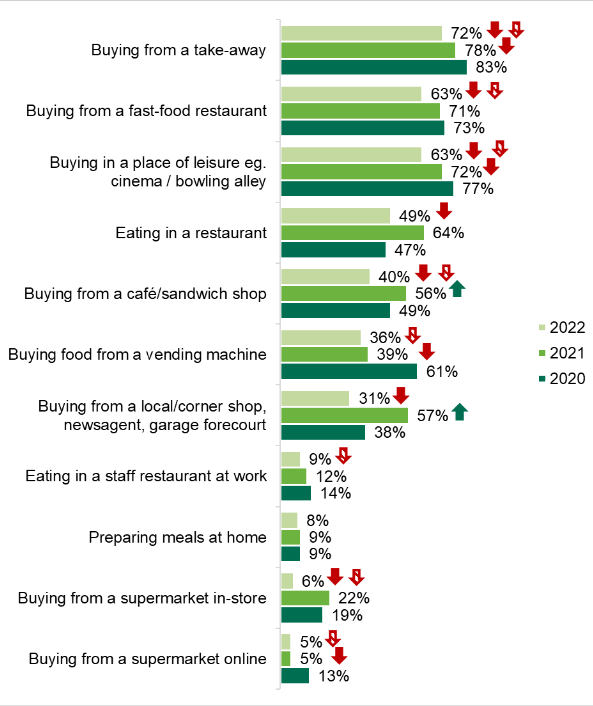
Base: Adults in Northern Ireland: 2022 (611), 2021 (603), 2020 (601).
The green arrow indicates significantly higher than previous year, the green patterned arrow indicates significantly higher than 2020.
The red arrow indicates significantly lower than previous year, the red patterned arrow indicates significantly lower than 2020.
Note: Participants who stated ‘quite difficult’ or ‘very difficult’ have been combined and classed as ‘participants who find it difficult’ in Figure 17.
Preferred settings for increased availability of healthier options
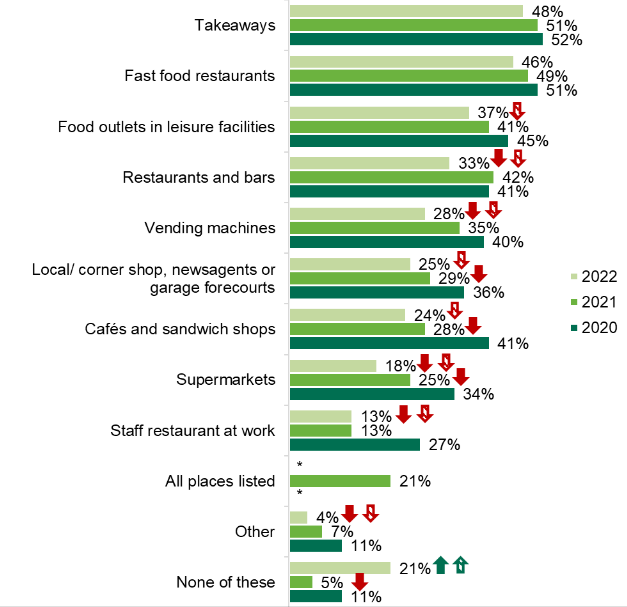
Participants were asked where, if in any setting, they would like to see healthier products. In 2022, close to half would like to see an increased availability of healthier food in takeaways (48%) and fast food restaurants (46%), this is unchanged from previous years.
Over a third would like to see increased availability of healthier food in food outlets in leisure facilities (37%). This has decreased since 2020 (45%). Exactly one third (33%) would like healthier food in restaurants and bars, which has declined since 2021 (42%) and 2020 (41%).
Over a quarter (28%) would like to see better availability of healthier food options in vending machines, which has decreased since 2021 (35%) and 2020 (40%). While similar proportions would like healthier options in local shops, newsagents and garages (25%) and cafés (24%), this has also fallen since 2020 (36% and 41% respectively).
While the want for supermarkets to have better availability of healthier food (18%) has fallen since 2021 (25%) and 2022 (34%), the want for staff restaurants to have better availability of healthier food (13%) has decreased since 2020 (27%).
Over 2 in 10 (21%) did not want healthier options to be made available in any setting and this is the only option to increase from both 2021 (5%) and 2020 (11%) (see Figure 18).
Figure 18: Food settings participants would like to see increased availability of healthier food
The use of calories on menus
This section of the report explores participants awareness of calories on menus, the frequency of seeing calories on menus, and participants’ preferred settings for the display of calories on menus.
A smaller proportion reported not seeing calorie information on menus in any setting overall in 2022 (48%) when compared to 2021 (69%). However, the 2022 figure was higher than in 2020 (42%).
At least one quarter reported seeing calorie information on menus in fast-food restaurants (29%) and restaurants and bars (27%). This has increased since 2021 when only 18% reported seeing calories on menus in fast-food restaurants and 12% in restaurants and bars (see Figure 19).
Figure 19: Participants who noticed calorie information displayed on menus in food settings outside the home
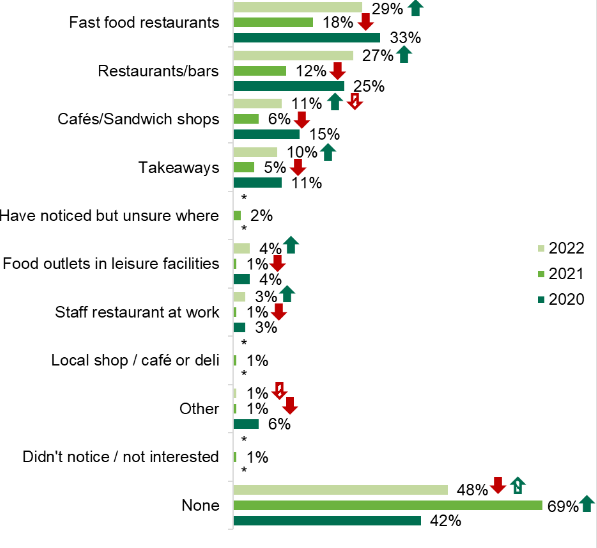
Base: Adults in Northern Ireland: 2022 (611), 2021 (603), 2020 (601).
The green arrow indicates significantly higher than previous year, the green patterned arrow indicates significantly higher than 2020.
The red arrow indicates significantly lower than previous year, the red patterned arrow indicates significantly lower than 2020.
* Options not included.
Note: Totals do not add to 100% as participants could select multiple responses.
Influence of calorie information on food decisions when eating out
For those who noticed calorie information displayed on menus, the information had most impact in guiding decisions in staff restaurants at work. More than half (59%) said the display of calories on menus in staff restaurants influences their food decisions, nearly one quarter (23%) said it ‘always influences/most times’ while more than a third (36%) reported that it influenced their decisions ‘every now and then’. More than half (51%) said that the display of calories on menus influences their decisions when eating in cafés and restaurants, around one fifth (21%) said it ‘always influences/most times’ while nearly one third (30%) said it influences them ‘every now and then’.
Over one quarter (28%) reported that calorie information influences their decisions ‘every now and then’ in restaurants and bars. Fewer participants reported that calorie information was likely to influence their decisions in fast-food restaurants, takeaways and food outlets in leisure centres with three quarters of participants (74%) reporting that it never influenced their decisions in these three settings (Table 2).
Table 2: Influence of calorie information on food decisions when eating outside the home
| Settings | Always influences/ Most times |
Every now and then | It never influences my decision/Not very often |
|---|---|---|---|
|
Restaurants and bars
|
15% | 28% | 28% |
| Staff restaurant at work | 23% | 36% | 41% |
| Cafés/sandwich shops | 21% | 30% | 49% |
| Fast food restaurants | 8% | 17% | 74% |
| Takeaways | 16% | 9% | 74% |
|
Food outlets in leisure facilities e.g., cinemas, bowling alleys, entertainment centres |
7% | 19% | 74% |
Base: All participants in Northern Ireland who noticed calorie information displayed in each setting.
Note: Row totals do not add to 100% due to rounding.
Preferred settings for the display of calories on menus
Although one quarter (25%) would prefer not to see calories on menus, over half of respondents would like to see them (57%). However, this has decreased across all settings when compared with previous years (see Figure 20).
Figure 20: Food settings outside the home that participants would like to see calories shown on a food menu
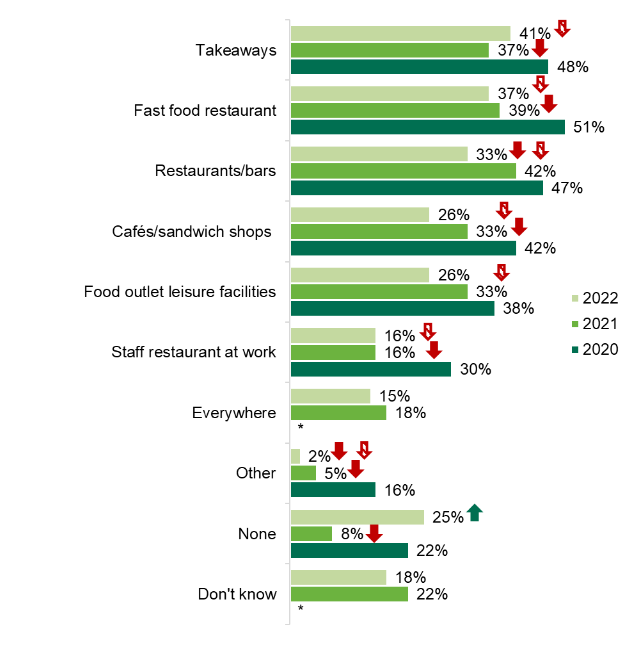
Base: Adults in Northern Ireland: 2022 (611), 2021 (603), 2020 (601)
The green arrow indicates significantly higher than previous year, the green patterned arrow indicates significantly higher than 2020.
The red arrow indicates significantly lower than previous year, the red patterned arrow indicates significantly lower than 2020.
Note: Totals do not add to 100% as participants could select multiple responses.
*Options not included.
Attitudes to reformulating food
This section of the report explores participants’ views on the reformulation of food to reduce sugar, saturated fat, and salt, and the reduction of portion sizes.
Likelihood to purchase reformulated food or reduced portion sizes
The proportion of participants stating that they would be more likely to buy reformulated food or a reduced portion size compared to the regular version has decreased since 2021, with the exception of reduced saturated fat products which has stayed constant at 51%.
Around half of participants reported that they would be more likely to buy products reduced in sugar (47%) and saturated fat (51%), but a smaller proportion would be more likely to buy smaller portion sizes of these products (34%). When compared with 2021, less participants report that they would be more likely to buy reduced sugar products (64% in 2021 and 47% in 2022) (Table 3).
Table 3: Likelihood to purchase reformulated or smaller portion sizes of food
| Reformulated and portion size options |
More likely to buy |
Would not change purchasing behaviour | Less likely to buy |
|---|---|---|---|
| Reduced sugar products | 47% | 38% | 15% |
| Reduced saturated fat products | 51% | 40% | 9% |
| Reduced salt products | 42% | 48% | 10% |
| Smaller portion sizes of sugary snacks/meals | 34% | 46% | 20% |
| Smaller portion sizes of snacks/meals high in saturated fat | 34% | 47% | 19% |
| Smaller portion sizes of snacks/meals high in salt | 26% | 53% | 21% |
Base: 611 adults in Northern Ireland.
Note: Row totals do not add to 100% due to rounding.
Interest in reformulated and reduced portion size options
Participants were asked which reformulated or reduced portion size options they would like to see more of when buying food.
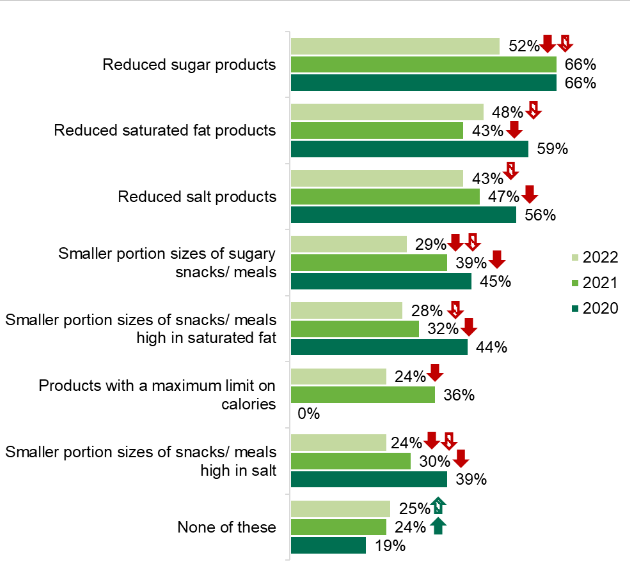
Similar to previous years, consumers would generally like to see increased availability of food reduced in sugar, saturated fat, and salt in comparison to smaller portion sizes of food high in these nutrients.
In general, close to half of participants reported that they would like to see food reduced in sugar (52%), saturated fat (48%) and salt (43%), which has decreased from 2020. Similarly, the percentage of participants who reported wanting to see smaller portion sizes of food high in sugar (29%), saturated fat (28%) and salt (24%) has decreased from 2020 and 2021.
Almost a quarter (24%) of participants report that they would like to see products with a maximum limit on calories which has decreased considerably when compared to 2021 (36%).
One quarter (25%) of participants reported that they would not like to see increased availability of at least one of the reformulated and/or smaller portion size options. This figure is unchanged from 2021 although has increased when compared to 2020 (19%) (see Figure 21).
Figure 21: Proportion of participants who would like to see increased availability of healthier alternatives when shopping for food
Base: Adults in Northern Ireland: 2022 (611), 2021 (603), 2020 (601).
The green arrow indicates significantly higher than previous year, the green patterned arrow indicates significantly higher than 2020.
The red arrow indicates significantly lower than previous year, the red patterned arrow indicates significantly lower than 2020.
* Not included in 2020.
Note: Totals do not add to 100% as participants could select multiple responses.
Revision log
Published: 27 March 2023
Last updated: 4 April 2024