Food and You 2: Wave 9 Key Findings
F&Y2 Wave 9, Chapter 1: Food you can trust
This chapter provides an overview of respondents’ awareness of and trust in the Food Standards Agency (FSA), as well as their confidence in food safety and the accuracy of information provided on food labels.
The FSA’s overarching mission is ‘food you can trust’. The FSA’s vision is a food system
in which:
- food is safe
- food is what it says it is
- food is healthier and more sustainable
Confidence in food safety and authenticity
Most respondents reported confidence (‘very confident’ or ‘fairly confident’) in food safety and authenticity. 89% of respondents reported that they were confident that the food they buy is safe to eat, and 81% of respondents were confident that the information on food labels is accurate (footnote 1).
Confidence in food safety varied between different categories of people in the following ways:
- annual household income: respondents with a higher income were more likely to be confident that the food they buy is safe to eat than those with a lower income, for example 96% of those earning more than £96,000, compared to 85% of those earning less than £19,000
- NS-SEC4 (footnote 2): respondents in managerial, administrative and professional occupations (91%) were more likely to be confident that the food they buy is safe to eat than those who were small employers and own account workers (81%)
- region (England) (footnote 3): respondents in East Midlands (94%) were more likely to be confident that the food they buy is safe to eat compared to those in London (83%) and the North-East (84%)
- food security (footnote 4): respondents who were more food secure were more likely to be confident that the food they buy is safe to eat compared to those who were less food secure (for example, 92% of those with high food security compared to 82% of those with very low food security)
- awareness of the food hygiene rating scheme (FHRS): respondents who had heard of the FHRS (and who knew a lot or a little about it) were more likely to be confident that the food they buy is safe to eat (91%), compared to those who had not heard of the scheme (65%)
Confidence in the accuracy of information on food labels varied between different categories of people in the following ways:
- annual household income: respondents with a higher income were more likely to be confident that the information on food labels is accurate than those with a lower income. For example, 87% of those earning £64,000 to £95,999 and 87% of those earning £32,000 to £63,999, compared to 75% of those earning less than £19,000
- NS-SEC: respondents in occupations (for example, 83% of those in intermediate occupations and 84% of those in managerial/administrative/professional occupations) were more likely to be confident that the information on food labels is accurate than those who were long term unemployed and/or had never worked (69%) or full-time students (72%)
- region (England): respondents in the South West (89%), South East (82%) and North West (83%) of England were more likely to be confident that the information on food labels is accurate than those in the West Midlands** (79%) and London (72%)
- food security: respondents who had high (86%) and marginal (82%) food security were more likely to report confidence in the accuracy of food labels than those with low (72%) or very low food security (67%)
- food hypersensitivities: those with a self-reported food allergy (91%) were more likely to report confidence in the accuracy of food labels than those with no food hypersensitivities (81%)
- responsibility for cooking: respondents who are responsible for cooking (82%) were more likely to report confidence in the accuracy of food labels than those who do not cook (67%)
- trust in the FSA: respondents who reported trust in the FSA (90%) were more likely to report confidence in the accuracy of food labels than those who do not trust the FSA (44%)
- awareness of the food hygiene rating scheme (FHRS): The majority of those who had heard of the FHRS and knew a lot or a little about it (83%) or who had heard of the FHRS but didn’t know much or anything about it (79%) were confident that food labels are accurate, compared to 49% of those who had not heard of the scheme
Confidence in the food supply chain
Around two-thirds of respondents (69%) reported that they had confidence (very
confident or fairly confident) in the food supply chain (footnote 5).
Confidence in the food supply chain varied between different categories of people in
the following ways:
- age group: respondents aged 45 years or over were more likely to report confidence in the food supply chain than those aged 34 years or younger (for example, 76% of those aged 75+, 72% of those aged 65-74, 75% of those aged 55-64 and 71% of those aged 45-54 were confident compared to 58% of those aged 16-24 and 63% of those aged 25-34)
- NS-SEC: respondents in occupations (for example, 78% of semi-routine/routine occupations, 72% of lower supervisory and technical occupations, 69% of managerial/administrative/professional occupations and 70% of intermediate occupations) were more likely to report confidence in the food supply chain than those who were full time students (55%)
- region (England): confidence in the food supply chain varied by region; with respondents in London less likely than all other regions (with the exception of Yorkshire and the Humberside) to feel confident in the food supply chain. For example, 58% of respondents in London were confident in the food supply chain compared to 75% of those in the South West, 73% in the West Midlands and 73% in the East Midlands
- food security: respondents with high food security (73%) were more likely to report confidence in the food supply chain than respondents with marginal (64%), low (63%) or very low (61%) food security
- awareness of the food hygiene rating scheme (FHRS): 70% of those who had heard of the FHRS and knew a lot or a little about it and 61% of those who had heard of the FHRS but didn’t know much or anything about it were confident in the food supply chain, compared to 47% of those who had not heard of the scheme
Awareness, trust and confidence in the FSA
Awareness of the FSA
Most respondents (91%) had heard of the FSA (footnote 6).
Awareness of the FSA varied between different categories of people in the following
ways:
- age group: older respondents were more likely to have heard of the FSA than younger respondents. For example, 97% of those aged 65-74 years had heard of the FSA, compared to 79% of those aged 16-24 years
- annual household income: respondents with an income over £19,000 were more likely to have heard of the FSA than those with an income of £19,000 or less. For example, 93% of those with an income over £96,000 and 94% of those with an income between £64,000 and £95,999 had heard of the FSA compared to 84% of those with an income of less than £19,000
- NS-SEC: respondents in most occupational groups (for example, 93% of those in intermediate occupations) were more likely to have heard of the FSA than full time students (77%) and those who were long-term unemployed or had never worked (76%)
- ethnic group: white respondents (94%) were more likely to have heard of the FSA compared to Asian or Asian British respondents (81%) (footnote 7)
- responsibility for food shopping: respondents who are responsible for food shopping (92%) were more likely to have heard of the FSA than those who never shop for food (79%)
- awareness of the food hygiene rating scheme (FHRS): 94% of those who had heard of the FHRS and knew a lot or a little about it and 87% of those who had heard of the FHRS but didn’t know much or anything about it had heard of the FSA, compared to 65% of those who had not heard of the scheme
Most respondents reported at least some knowledge of the FSA. 51% reported that they knew a little about the FSA and what it does, and 6% reported that they knew a lot about the FSA and what it does. Around a third of respondents (32%) reported that they had heard of the FSA but knew nothing about it, 5% had not heard of the FSA until being contacted to take part in the Food and You 2 survey, and 6% had never heard of the FSA (Figure 1) (footnote 8).
Figure 1. Knowledge about the Food Standards Agency (FSA)
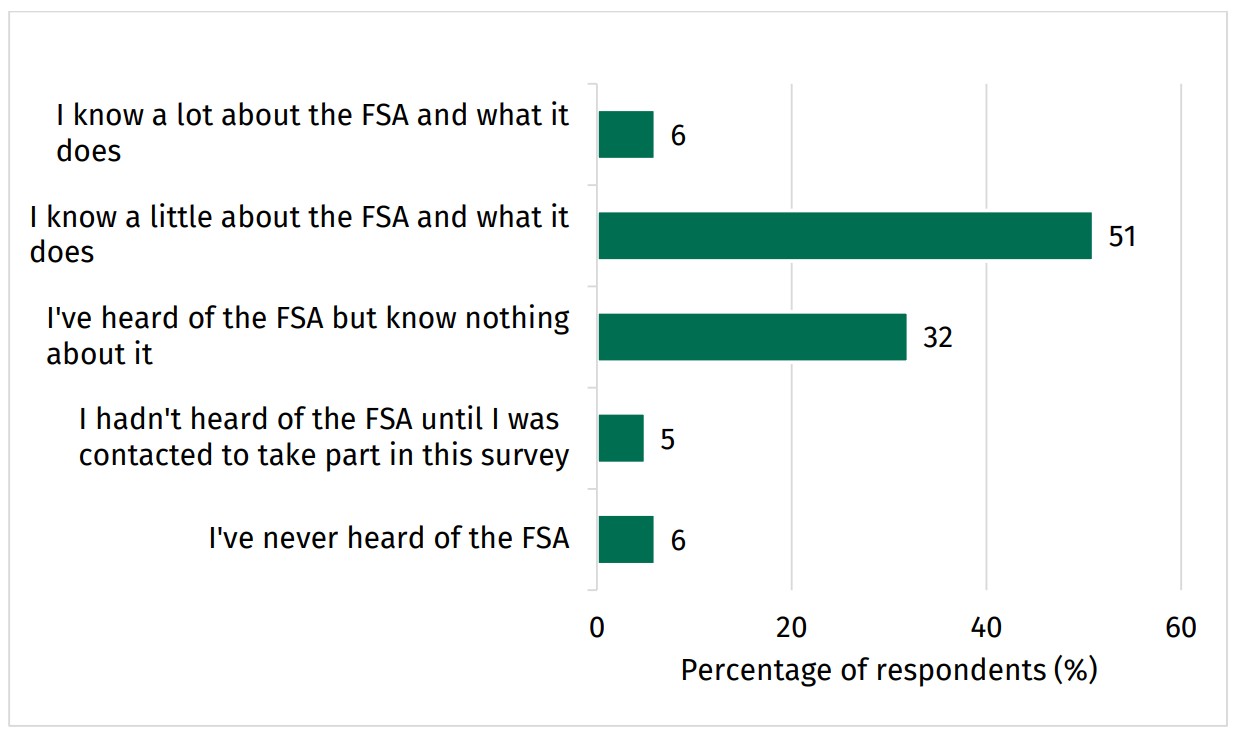
The bar chart shows the answers for questions about knowledge of the FSA. 6% of people responded: I know a lot about the FSA and what it does. 51% of people responded: I know a little about the FSA and what it does. 32% of people responded: I've heard of the FSA but know nothing about it. 5% of people responded: I hadn't heard of the FSA until I was contacted to take part in this survey. 6% of people responded: I have never heard of the FSA.
Knowledge of the FSA varied between different categories of people in the following ways (footnote 9):
- age group: respondents aged between 25 and 64 years (for example, 68% of those aged 55-64 years) were more likely to report knowledge of the FSA compared to younger respondents (e.g. 38% of those aged 16-24 years) or the oldest respondents (46% of those aged 75 years and over)
- annual household income: respondents with an income of over £19,000 were more likely to report knowledge of the FSA compared to those with an income of £19,000 or less (for example, 63% of those with an income between £32,000 and £63,999 compared to 51% of those with an income of less than £19,000)
- NS-SEC: respondents in most occupational groups (for example, 63% of those in managerial/administrative/professional occupations) were more likely to report knowledge of the FSA than full-time students (40%) and those who were long-term unemployed or had never worked (36%)
- country: Respondents in Wales (65%) were more likely to report knowledge of the FSA than respondents living in Northern Ireland (55%) and England (57%)
- region (England): Respondents in London (60%) and the North-West (61%) were more likely to report knowledge of the FSA than those in the East of England (50%)
- ethnic group: white respondents (59%) were more likely to report knowledge of the FSA compared to Asian or Asian British respondents (49%) (footnote 10)
- responsibility for cooking: respondents who are responsible for cooking (59%) were more likely to report knowledge of the FSA than those who do not cook (41%)
responsibility for food shopping: respondents who are responsible for food shopping (59%) were more likely to report knowledge of the FSA than those who never shop for food (37%)
awareness of the food hygiene rating scheme (FHRS): respondents who had heard of the FHRS and knew a lot or a little about it (71%) were more likely to report knowledge of the FSA than those who had heard of the FHRS but didn’t know much or anything about it (35%) and those who had not heard of the scheme (29%)
Trust in the FSA
Respondents who had at least some knowledge of the FSA were asked how much they trusted the FSA to do its job, that is to make sure food is safe and what it says it is. Most respondents (69%) reported that they trusted the FSA to do its job, 26% of respondents neither trust or distrust the FSA to do this, and 2% of respondents reported that they distrust the FSA to do this (footnote 11).
Trust in the FSA varied between different categories of people in the following ways:
- age group: those aged 25-34 (76%) were more likely to report that they trusted the FSA to do its job than those aged 35-44 (64%)
- household size: respondents who lived in larger households, of 5 or more people (81%), were more likely to report that they trusted the FSA to do its job than those who lived in households of 2 (68%) or 4 (67%)
Most respondents (78%) reported that they were confident that the FSA (or the government agency responsible for food safety) can be relied upon to protect the public from food-related risks (such as food poisoning or allergic reactions from food). Around three quarters (76%) of respondents were confident that the FSA takes appropriate action if a food-related risk is identified and 70% were confident that the FSA is committed to communicating openly with the public about food-related risks (footnote 12).
-
Question: How confident are you that… a) the food you buy is safe to eat. b) the information on food labels is accurate (for example, ingredients, nutritional information, country of origin). Responses: very confident, fairly confident, not very confident, not at all confident, it varies, don’t know. Base= 5,526, all respondents.
-
NS-SEC (The National Statistics Socio-economic classification) is a classification system which provides an indication of socio-economic position based on occupation and employment status.
-
Regional differences were only considered in England due to the low sample / base size in Wales and Northern Ireland.
-
Food security means access by all people at all times to enough food for an active, healthy life.
-
Question: How confident are you in the food supply chain? That is all the processes involved in bringing food to your table. Responses: very confident, fairly confident, not very confident, not at all confident, it varies, don’t know. Base= 5526, all respondents.
-
Question: Which of the following, if any, have you heard of? Please select all that apply. Response: Food Standards Agency (FSA), (England) Department for Environment, Food and Rural Affairs (DEFRA), (England) The Office for Health Improvement and Disparities, (England) Environment Agency, (England) UK Health Security Agency (UKHSA), (England and Wales) Health and Safety Executive (HSE), (Wales) Public Health Wales (PHW), (Wales) Natural Resources Wales, (NI) Public Health Agency (PHA), (NI) Department of Agriculture, Environment and Rural Affairs (DAERA), (NI) Health and Safety Executive Northern Ireland (HSENI), (NI) Safefood, None of these. Base= 3530, all online respondents. Please note: All consumers taking part in the survey had received an invitation to take part in the survey which mentioned the FSA. An absence of response indicates the organisation had not been heard of by the respondent or a non-response.
-
Please note: the figures of other ethnic groups are not reported due to low base / sample size.
-
Question: How much, if anything, do you know about the Food Standards Agency, also known as the FSA? Response: I know a lot about the FSA and what it does, I know a little about the FSA and what it does, I've heard of the FSA but know nothing about it, I hadn't heard of the FSA until I was contacted to take part in this survey, I've never heard of the FSA. Base= 5526, all respondents. Please note: All consumers taking part in the survey had received an invitation to take part in the survey which mentioned the FSA.
-
Comparisons are based on those who reported knowing a lot or a little about the FSA combined.
-
Please note: the figures of other ethnic groups are not reported due to low base / sample size.
-
Question: How much do you trust or distrust the Food Standards Agency to do its job? That is to make sure that food is safe and what it says it is. Responses: I trust it a lot, I trust it, I neither trust nor distrust it, I distrust it, I distrust it a lot, don’t know. Base= 3274, all respondents who know a lot or a little about the FSA and what it does. Please note: ‘I trust it a lot’ and ‘I trust it’ referred to as trust.
-
Question: How confident are you that the Food Standards Agency / the government agency responsible for food safety in England, Wales and Northern Ireland...a) Can be relied upon to protect the public from food-related risks (such as food poisoning or allergic reactions from food). b) Is committed to communicating openly with the public about food-related risks. c) Takes appropriate action if a food related risk is identified? Responses: very confident, fairly confident, not very confident, not at all confident, don’t know. Base= 5526, all respondents. Please note: ‘very confident’ and ‘fairly confident’ referred to as confident. Respondents with little or no knowledge of the FSA were asked about ‘the government agency responsible for food safety’, those with at least some knowledge of the FSA were asked about the FSA.