Food and You 2: Wave 9 Key Findings
F&Y2 Wave 9, Chapter 3: Food security
This chapter reports the level of food security in England, Wales, and Northern Ireland, and how food security varied between different categories of people.
Introduction
“Food security exists when all people, at all times, have physical and economic access to sufficient, safe and nutritious food that meets their dietary needs and food preferences for an active and healthy life.” World Food Summit, 1996.
Food and You 2 uses the 10-item U.S. Adult Food Security Survey Module developed by the United States Department of Agriculture (USDA) to measure consumers’ food security status.
Respondents are assigned to one of the following food security status categories:
- high: no reported indications of food-access problems or limitations
- marginal food security: one or two reported indications—typically of anxiety over food sufficiency or shortage of food in the house. Little or no indication of changes in diets or food intake
- low: reports of reduced quality, variety, or desirability of diet. Little or no indication of reduced food intake
- very low: reports of multiple indications of disrupted eating patterns and reduced food intake
Those with high or marginal food security are referred to as food secure. Those with low or very low food security are referred to as food insecure.
More information on how food security is measured and how classifications are assigned and defined can be found in Annex A and on the USDA Food Security website
Food security
Across England, Wales, and Northern Ireland, 79% of respondents were classified as food secure (65% high, 14% marginal) and 21% of respondents were classified as food insecure (10% low, 11% very low) (footnote 1).
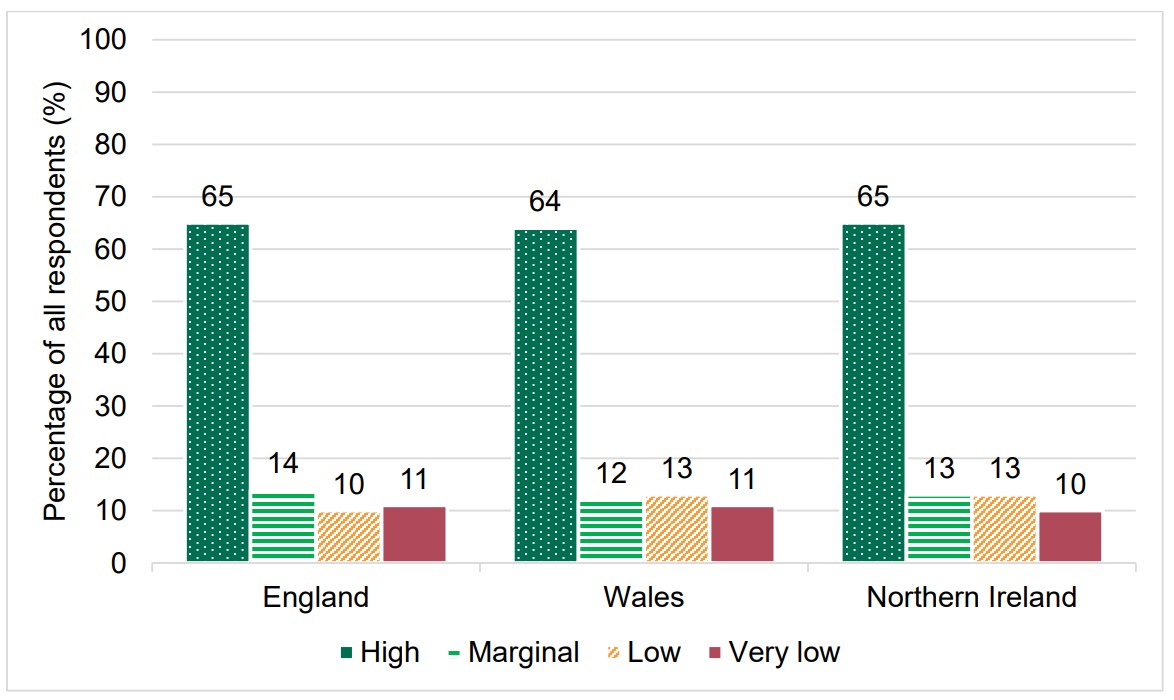
Around three-quarters of respondents were food secure (i.e. had high or marginal food security) in England (79%), Northern Ireland (77%), and Wales (75%). Approximately a quarter of respondents were food insecure (i.e. had low or very low food security) in England (21%), Northern Ireland (23%), and Wales (25%) (Figure 5).
Figure 5. Food security in England, Wales, and Northern Ireland
Source: Food and You 2: Wave 9
Experiences of food insecurity
Respondents were asked up to ten questions from the US Adult Food Security Survey Module (footnote 2), to determine their food security classification.
All respondents were asked the first three questions from the food security survey module. The first three questions asked respondents how often, if ever, they had experienced any of the following in the previous 12 months:
- I/we worried whether our food would run out before we got money to buy more
- the food that we bought just didn't last, and I/we didn't have money to get more
- I/we couldn't afford to eat balanced meals
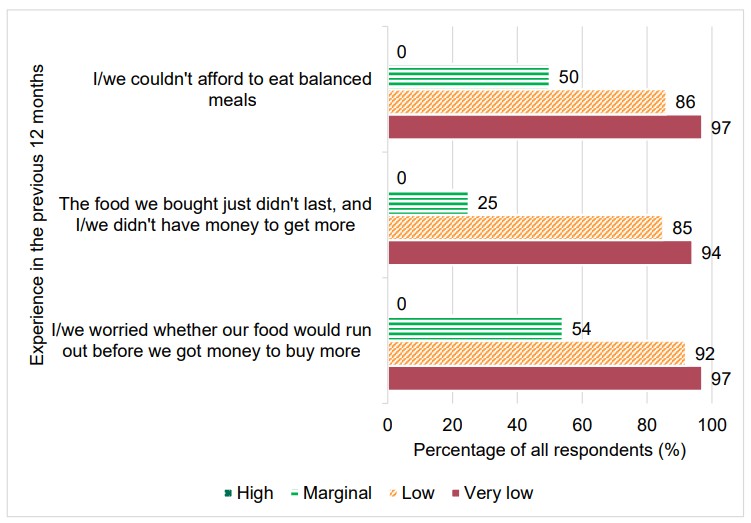
In the previous 12 months, respondents who had very low (97%), or low (92%) food security were more likely (footnote 3) to have worried whether their food would run out before they had money to buy more, compared to those with marginal (54%) food security (footnote 4). Respondents who had very low (94%), or low (85%) food security were more likely to report that the food that they bought just didn't last, and they didn't have money to get more, compared to those with marginal (25%) food security (footnote 5). Respondents who had very low (97%), or low (86%) food security were more likely to report that they couldn’t afford balanced meals, compared to those with marginal (50%) food security (footnote 6). None of the respondents (0%) with high food security reported these experiences, because according to the USDA classification system those with high food security report ‘no indications of food access problems or limitations’ (Figure 6).
Figure 6. Experiences of food security by food security classification
How food security differs between socio-economic and demographic groups
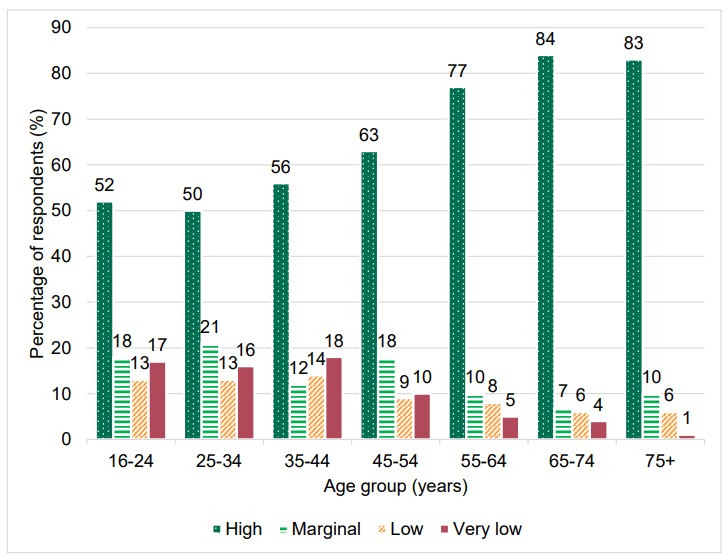
Food security varied by age group with older adults being more likely to report that they were food secure and less likely to report that they were food insecure than younger adults. For example, 30% of respondents aged 16-24 years were food insecure (13% low, 17% very low food security) compared to 7% of those aged 75 years and over (6% low, 1% very low food security) (Figure 7).
Figure 7. Food security by age group
Source: Food and You 2: Wave 9
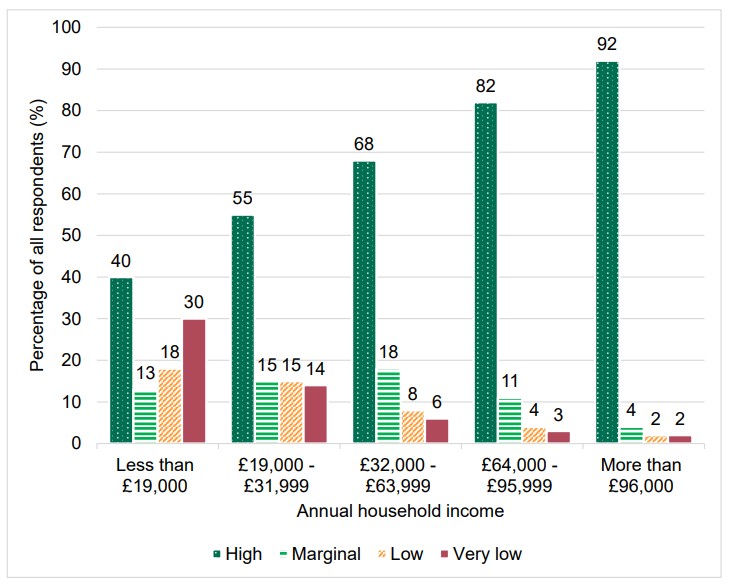
Food security was associated with household income. Respondents with a lower income were more likely to report being food insecure than those with a higher income. For example, 47% of those with an annual household income of less than £19,000 reported food insecurity (low 18%, very low 30%) compared to 7% of those with an income between £64,000 and £95,999 (low 4%, very low 3%) (Figure 8).
Figure 8. Food security by annual household income
Source: Food and You 2: Wave 9
Respondents who were long term unemployed and/or had never worked (59%) were more likely to report that they were food insecure compared to all other occupational groups. Those who were full-time students (25%), lower supervisory and technical occupations (25%) and semi-routine and routine occupations (33%) were more likely to be food insecure than most other occupations groups (for example, 16% managerial, administrative and professional occupations and 18% of small employers and own account workers) (Figure 9) (footnote 7) **.
The reported level of food insecurity also varied between different categories of people in the following ways:
- household size: respondents who lived in larger households, for example, 4- person households (26%) or households of 5 or more (31%) were more likely to report that they were food insecure compared to smaller households, for example, 1-person (19%) or 2-person (15%) households**
- children under 16 in household: 31% of households with children under 16 years reported that they were food insecure compared to 16% of households without children under 16 years
- children under six in household: 35% of households with children under six years reported that they were food insecure compared to 19% of households without children under six years
- urban vs rural: 22% of respondents living in an urban area reported that they were food insecure compared to 15% of respondents living in a rural area**
- region (England) (footnote 8): levels of food insecurity varied by region in England. For example, respondents who live in the East Midlands (26%) and West-Midlands (24%) were more likely to be food insecure compared to those who live in the South West of England (16%)
- ethnic group: 25% of Asian or Asian British respondents reported that they were food insecure compared to 19% of white respondents ** (footnote 9)
- long term health condition: respondents with a long-term health condition (32%) were more likely to report being food insecure compared to those without a long-term health condition (16%)
Figure 9. Food security by socio-economic classification (NS-SEC)
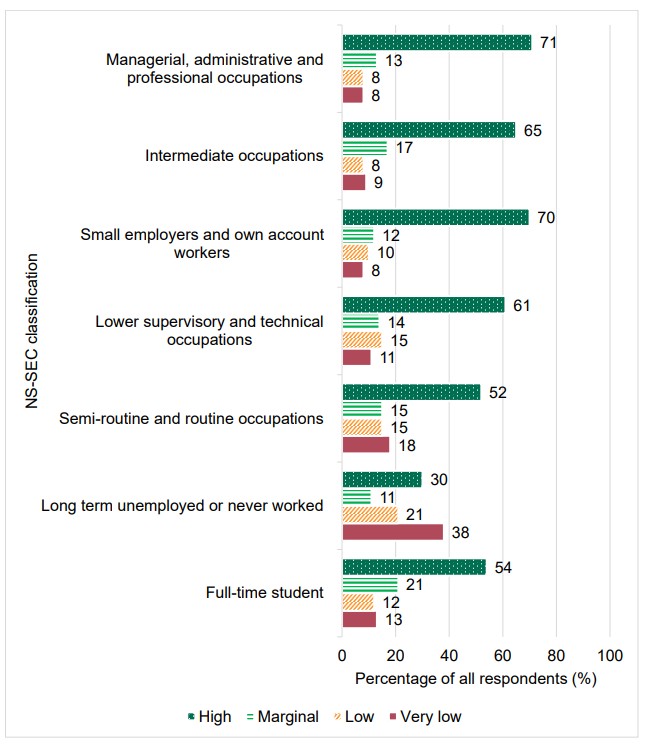
Source: Food and You 2: Wave 9
Changes to food-related behaviours
Respondents were asked what changes, if any, they had made to their eating habits and food-related behaviours in the previous 12 months for financial reasons. Most respondents (75%) reported that they had made a change to their eating habits for financial reasons in the previous 12 months, with a quarter of respondents (25%) indicating that they had made no changes.
Common changes related to what and where respondents ate (43% ate out less, 42% ate at home more, 38% ate fewer takeaways), changes to shopping habits (39% bought items on special offer, 33% changed the food they buy to something cheaper, 33% changed where they buy food to somewhere cheaper, 31% bought reduced/discounted food) and changes to food preparation (26% prepared food that could be kept as leftovers/cooked in batches more, 27% cooked from scratch more, 23% made packed lunches more, 17% bulked out meals with cheaper ingredients). Some respondents reported an increase in risky food safety behaviours due to financial reasons (10% kept leftovers for longer before eating, 11% had eaten food past its use-by date more often, 2% had changed the time and temperature food is cooked at and 2% reported changing the setting on the fridge / freezer) (Figure 10) (footnote 10).
Figure 10. Changes in eating habits and food-related behaviours for financial reasons
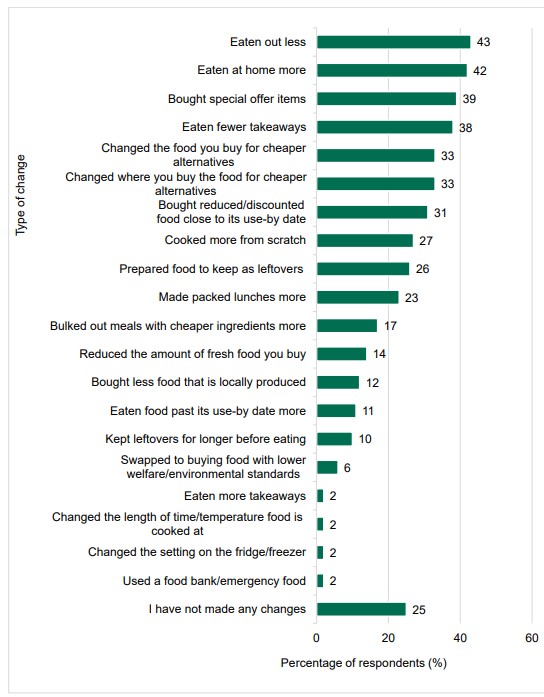
Source: Food and You 2: Wave 9
Food bank use
Respondents were asked if they or anyone else in their household had received a free parcel of food from a food bank or other emergency food provider in the last 12 months. Most respondents (94%) reported that they had not used a food bank or other emergency food provider in the last 12 months, with 4% of respondents reporting that they had done so (footnote 11).
Respondents who had received a food parcel from a food bank or other provider were asked to indicate how often they had received this in the last 12 months. Of these respondents, 24% had received a food parcel on only one occasion in the last 12 months, 49% had received a food parcel on more than one occasion but less often than every month, and 7% had received a food parcel every month or more often (footnote 12).
Social supermarkets
Social supermarkets, food clubs and community pantries/larders allow people to buy food items at a heavily discounted price, or as part of membership. These are generally community organisations and may offer additional services such as referral services and volunteering opportunities. Some or all of the food is surplus from the food supply chain.
Awareness and use of social supermarkets
Respondents were asked if they or anyone else in their household had used a social supermarket in the last 12 months. One in 20 respondents (5%) reported that they had used a social supermarket in the last 12 months and 79% of respondents reported that they had not used a social supermarket in the last 12 months. Around one in ten respondents (14%) reported that they had not heard of social supermarkets (footnote 13).
The use of social supermarkets varied between different categories of people in the following ways:
- annual household income: respondents with an income of less than £19,000 (14%) were more likely to have used a social supermarket than those with a higher income (for example, 2% of those with an income of £32,000-£63,999)
- region (England) (footnote 14): levels of social supermarket use varied by region in England. For example, respondents who live in the North-East of England (11%) and the West Midlands (10%) were more likely to have used a social supermarket than those who live in the East Midlands (3%), the East of England (3%), the North West of England (4%), the South East of England (4%) and the South West of England (4%)**
- food security: respondents experiencing very low food security (19%) were more likely to have used a social supermarket than those with low (9%), marginal (7%) or high (2%) food security
Respondents who had used a social supermarket were asked to indicate how often they had used this in the last 12 months. Of these respondents, 12% had used a social supermarket every day or most days, 16% had used a social supermarket 2-3 times a week or about once a week, 22% had used a social supermarket 2-3 times a month or about once a month, and 26% had used a social supermarket less than once a month. However, 24% of respondents who had used a social supermarket reported that they could not remember how often they had used a social supermarket in the last 12 months (Figure 11) (footnote 15).
Figure 11. Frequency of social supermarket use among social supermarket users
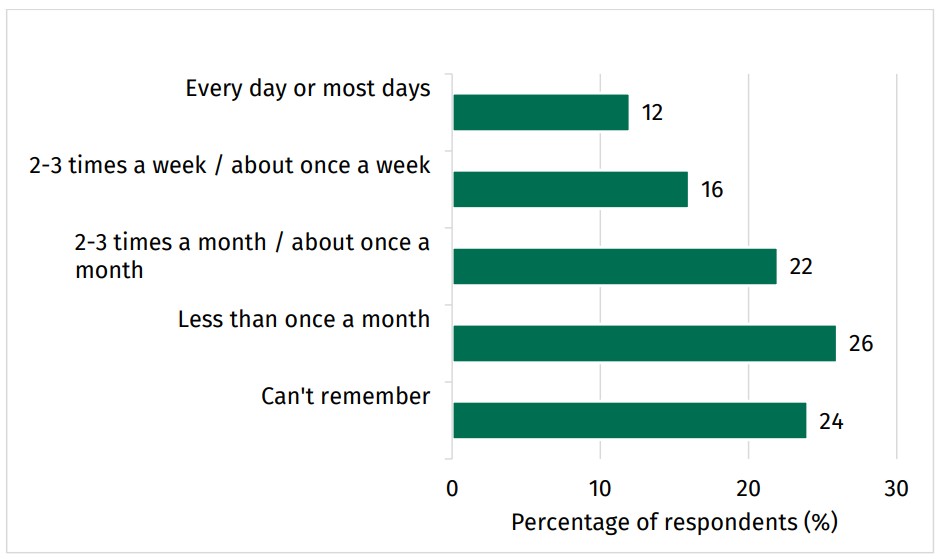
Source: Food and You 2: Wave 9
Supplementary school food clubs
Respondents with children aged 5-15 were also asked about any additional clubs their children may attend at school where they receive a meal. These include breakfast clubs, after-school clubs or lunch/activity clubs that only run during the school holidays (footnote 16). The majority of respondents (72%) reported that their children did not attend any supplementary club. A fifth of respondents (19%) reported that their children attended a breakfast club in the last 12 months, 8% attended an after-school club where they also received a meal, and 5% attended a lunch and activity club during the school holidays.
The reported uptake of these clubs varied between different categories of people in the following ways:
- children under six: households with children under six were more likely to have used an after-school club (22%) compared to households without children under six years where only 4% of households accessed these clubs
- annual household income: respondents with a higher income were less likely to report that the child(ren) attended a breakfast club compared to those with a lower income. For example, 11% of respondents with an income of more than £96,000 compared to 27% of those with an income of £19,000-£31,999
- country: 35% of respondents in Wales reported their child(ren) attend a breakfast club compared to 18% of those in England and 19% in Northern Ireland
- food security: those with low/very low food security (29%) were more likely to access breakfast clubs than those with marginal/high food security (14%)
-
Question/Responses: Derived variable, see USDA Food Security guidance and Technical Report. Base= 5526, all respondents. Please note: See Annex A for information about the classifications and definitions of food security levels.
-
See the USDA Food Security guidance for further information about the survey and classifications.
-
respondents who answered ’true’ or ’sometimes true’.
-
Question: Please say whether the statement below was often true, sometimes true or never true for you/people in your household in the last 12 months. I/we worried whether our food would run out before we got money to buy more. Responses: often true, sometimes true, never true, don’t know or prefer not to say, not stated. Base= 5526, all respondents.
-
Question: Please say whether the statement below was often true, sometimes true or never true for you/people in your household in the last 12 months. The food that we bought just didn't last, and I/we didn't have money to get more. Responses: often true, sometimes true, never true, don’t know or prefer not to say, not stated. Base= 5526, all respondents.
-
Question: Please say whether the statement below was true for you/your household in the last 12 months. I/we couldn't afford to eat balanced meals. Responses: often true, sometimes true, never true, don’t know or prefer not to say, not stated. Base= 5526, all respondents.
-
NS-SEC (The National Statistics Socio-economic classification) is a classification system which provides an indication of socio-economic position based on occupation and employment status.
-
Regional differences reported in England only due to the low sample / base size in Wales and Northern Ireland.
-
Please note: the figures of other ethnic groups are not reported due to low base / sample size.
-
Question: In the last 12 months, have you made any of these changes for financial reasons? Responses: eaten out less, eaten at home more, cooked at home more, eaten fewer takeaways, bought items on special offer more (for example, 3 for 2), prepared food to be kept as leftovers/cooked in batches more, changed where you buy food to somewhere cheaper, changed the food you buy to something cheaper, made packed lunches more, bought reduced/discounted food close to its use-by date more, eaten food past its use-by date more, kept leftovers for longer before eating, started using a food bank/emergency food provider, reduced the amount of fresh food you buy, swapped to buying food with lower welfare or environmental standards, bought less food that is locally produced, changed the length of time or temperature food is cooked at, changed the setting on the fridge or freezer, I have made another food-related change, I have not made any changes. Base= 3530, all online respondents
-
Question: In the last 12 months, have you, or anyone else in your household, received a free parcel of food from a food bank or other emergency food provider? Responses: Yes, No, Prefer not to say. Base= 5526, all respondents.
-
Question: How often in the past 12 months have you, or anyone else in your household, received a free food parcel from a food bank or other emergency food provider? Responses: Only once in the last year, Two or three times in the last year, Four to six times in the last year, More than six times but not every month, Every month or more often, Don't know, Prefer not to say. Base= 130, all online respondents where anyone in household has used a food bank or emergency food or received a free food parcel from a food bank or other emergency food provider in the last 12 months.
-
Question: In the last 12 months, have you, or anyone else in your household, used a social supermarket (also known as a food club/hub or community pantry)? Responses: Yes, No, Prefer not to say, I had not heard of a social supermarket, food club/hub or community pantry before today. Base= 4634, all online respondents and all responding to the version A postal questionnaire.
-
Regional differences were only considered in England due to the low sample / base size in Wales and Northern Ireland.
-
Question: How often in the last 12 months have you, or anyone else in your household, used a social supermarket (also known as a food club/hub or community pantry)? Responses: Every day, most days, 2-3 times a week, about once a week, about once a month, less than once a month, can’t remember. Base= 178, all online respondents and all responding to the version A postal questionnaire who have used a social supermarket in the last 12 month.
-
Question: Did any of the children in your household attend any of the following in the past 12 months? Responses: A breakfast club before school, an after-school club where they also received a meal (tea/dinner), a lunch and activity club that only ran during school holidays, none of these, don’t know. Base= 720, all online respondents who have child(ren) aged 5- 15 living in the household.