Evaluation of the implementation of prepacked for direct sale (PPDS) allergen labelling requirements
Methodology and sample profile - PPDS evaluation
This chapter presents the methodology used with each of the key stakeholder groups throughout the evaluation in more detail. It also covers the profile of consumers, Food Business Operators (FBOs) and Local Authorities (LAs) to understand more about who took part in the evaluation.
Methodology overview
In order to develop a full picture of the awareness, understanding and impact of new PPDS labelling requirements, the research focused on three groups of stakeholders:
- Consumers in England, Northern Ireland and Wales who have at least one existing food hypersensitivity or a child with a food hypersensitivity
- FBOs with up to 249 employees across the UK
- LAs responsible for enforcing food safety regulations across the UK
A mixed-method approach to the research was adopted:
- Firstly, individuals from the three target groups were invited to complete surveys. Each group received a different survey that was specific to their engagement with PPDS labelling requirements.
- Secondly, some of those who took part in the surveys were then invited to take part in an in-depth interview to expand upon the information they gave in the survey. Again, there were three different topic guides used to structure interviews, which were designed to capture the nuances of each group’s experience.
The details of engagement with each group are shown in Table 3.1.
Table 3.1 Summary of methodology and completed interviews
| Method | Overview |
|---|---|
| Online survey with consumers |
|
| Qualitative interviews with consumers |
|
| Telephone survey of Food Business Operators (FBOs) |
|
| Online survey with LAs |
|
| Qualitative interviews with FBOs, Market Traders and LAs |
|
Consumers
Methodology
A total of 1,809 consumers with food hypersensitivities, or with a child with a food hypersensitivity, residing in England, Wales and Northern Ireland completed the online survey between 29 November 2022 and 13 January 2023. Consumers were approached through a range of sources:
- An external panel provider, which recruited 400 consumers who completed the survey.
- Three food hypersensitivity charities (Coeliac UK, Allergy UK and The Natasha Allergy Research Foundation), who shared an open link to the survey on social media and their newsletters.
- The FSA, who shared an open link to the survey on their social media towards the end of fieldwork with a specific aim to boost response rates in Wales and Northern Ireland.
The survey was approximately 15 minutes long and encompassed a number of topic areas: the nature of consumers’ food hypersensitivity; their use and confidence in food labels (both generally and specifically regarding PPDS foods); their awareness of new labelling requirements; their experience of buying PPDS foods since the introduction of the legislation; and the impact it has had for them. In the cases where the consumer had a child with a food hypersensitivity, the same topic areas were covered but framed in regards to their experience of purchasing PPDS foods for their child.
Consumers who completed the survey via an open link from a charity and the FSA indicated at the end of the survey whether they would be happy to be recontacted for a follow-up interview. A total of 659 consumers agreed to be recontacted, representing 53% of those asked.
A total of 31 consumers took part in a follow-up in-depth telephone interview, which explored their experiences in more detail. Broad targets were set to ensure the perspectives of a variety of consumers were captured; by country, severity of allergy, whether or not they had coeliac disease and whether they had a food hypersensitivity or their child did. In addition, a spread of awareness of legislation, PPDS purchasing behaviour and potential impact of the legislation were targeted. These interviews took place between 19 December 2022 and 11 January 2023, and lasted 45-60 minutes.
Sample profile
The FSA were keen to understand the perspective of consumers with their own hypersensitivity, and the experiences of those who have a child with a food hypersensitivity. Almost three quarters (74%) of consumers who completed the survey indicated they had a food hypersensitivity and around one in ten (11%) of all respondents stated that their child had a food hypersensitivity. A further 15% indicated that both they and their child had food hypersensitivities; this latter group responded to the survey regarding their own experience, rather than that of their child.
The severity of food hypersensitivity varied; over half of consumers (56%) stated that their food hypersensitivity was severe. Around a third (34%) indicated theirs was moderate and 8% felt theirs was mild. This rating related to the allergy or intolerance they felt to be the most severe if they had multiple allergies. Two in five (42%) consumers in the survey reported having multiple allergies.
Overall, three-quarters (73%) of consumers had an allergy or intolerance to a regulated allergen only, with a further 19% having an allergy or intolerance to both a regulated and non-regulated allergen. The food which consumers had an allergy or intolerance to varied, with the most common being cereals containing gluten (65%). Almost half (46%) of surveys completed were obtained from Coeliac UK, which is likely to contribute to this prevalence. Of consumers who stated they had a food hypersensitivity to cereals containing gluten, 83% had Coeliac disease. 78% of those who had Coeliac disease said this was medically diagnosed. Taking this as a proportion of all consumers who took part, around half (53%) had Coeliac disease. Only around 1% of the population in the UK have Coeliac disease. (footnote 1) To help understand the impact of this on the findings, we have highlighted differences between those with and without Coeliac disease throughout the report.
Those who had a food hypersensitivity to cereals containing gluten, but were not diagnosed with Coeliac disease, more often referred to this as a food intolerance (72%) rather than an allergy (22%). Other food types with prevalent allergies and intolerances included milk and dairy (24%), peanuts (14%), other nuts (13%) and vegetables (11%). This is further detailed in Figure 3.2, which also shows whether this was classified by consumers as an allergy or intolerance. Food marked with an ‘*’ indicates a regulated allergen.
Figure 3.2 Food hypersensitivity and whether it is categorised as an allergy or intolerance (footnote 2)
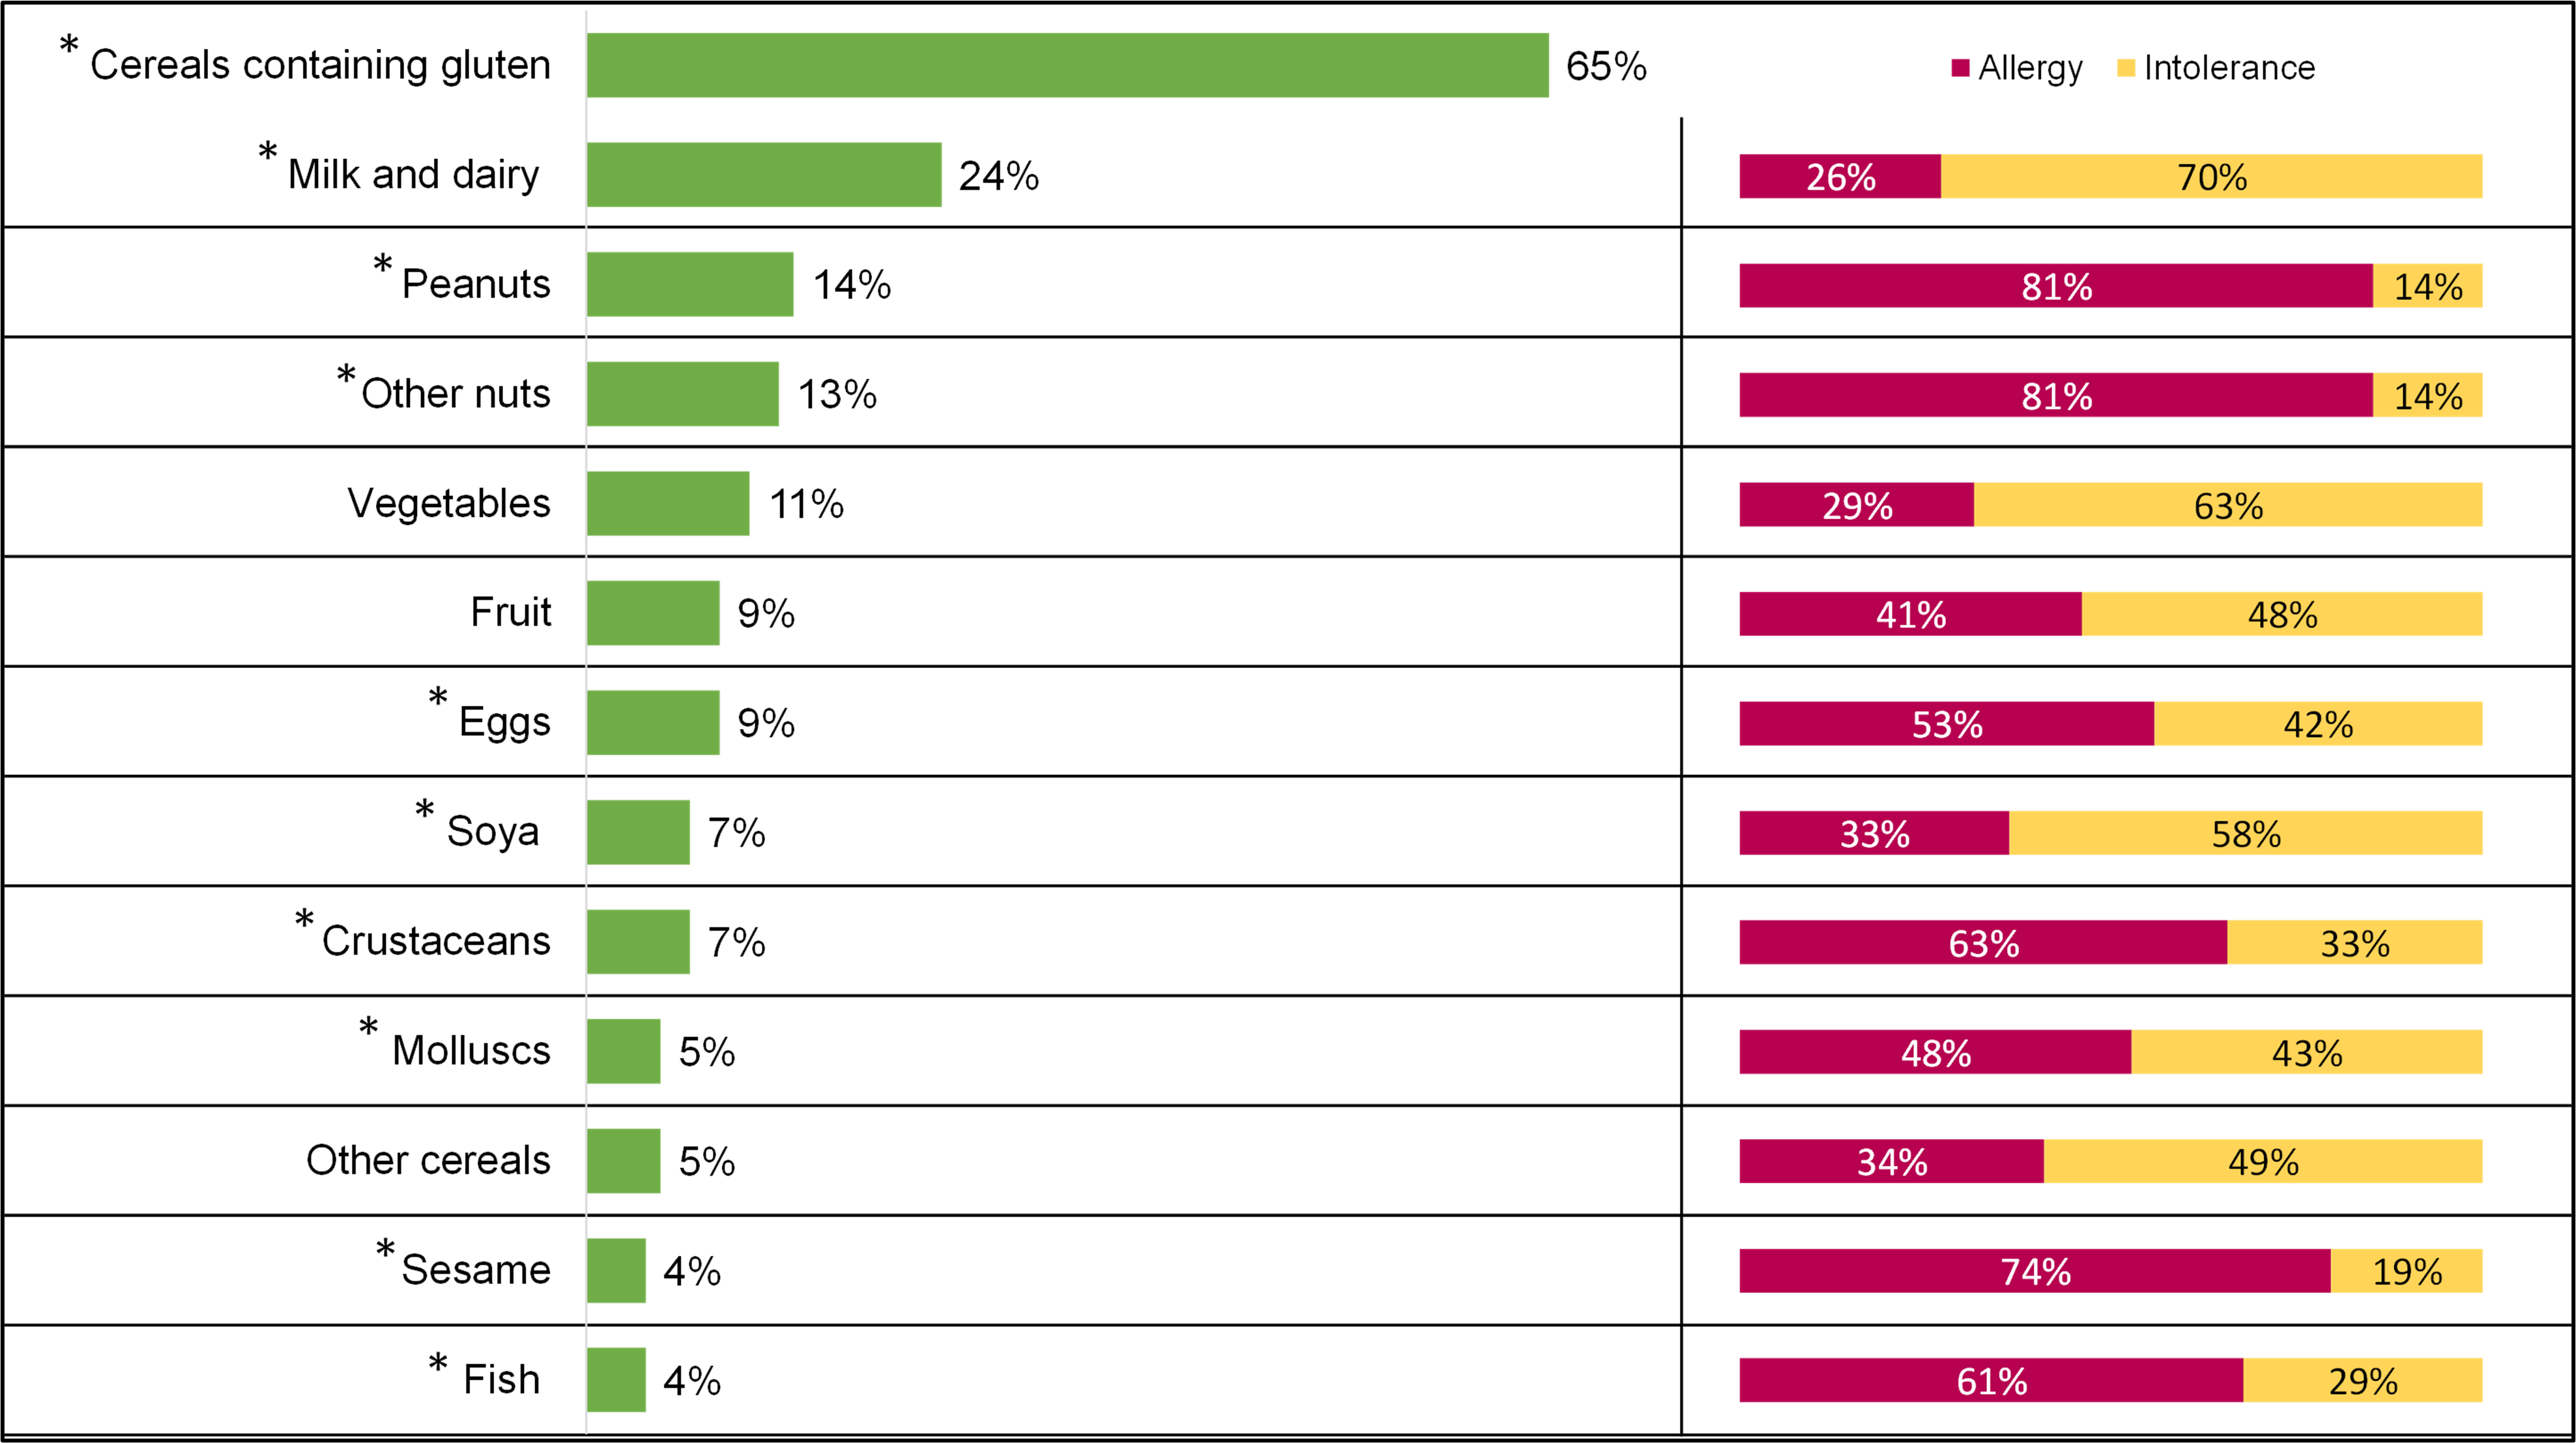
A2. Do you / your child experience a bad or unpleasant reaction to any of the following foods? Base: All consumers (1,809). A4. How would you best describe your problem with this food? Base: All consumers who have a food sensitivity to each of the food types (milk and dairy (424), peanuts (253), other nuts (227), vegetables (104), fruit (144), eggs (163), soya (122), crustaceans (120), molluscs (99), other cereals (94), sesame (74), fish (66)).
Consumers were more likely to be intolerant, rather than allergic, to certain food types - particularly to milk and dairy (70% intolerance vs 26% allergy), vegetables (63% intolerance vs 29% allergy) and soya (58% intolerance vs 33% allergy). Conversely, consumers were more likely to report having an allergy, rather than an intolerance, to peanuts (81% allergy vs 14% intolerance), other nuts (81% allergy vs 14% intolerance) and sesame (74% allergy vs 19% intolerance).
In terms of demographics, the majority of consumers identified as female (79% vs 20% male) and White (95%). (footnote 3) The age of consumers varied; 14% were aged between 18 and 34 years old, 60% between 35 and 64 and 23% were 65 or older. The majority of consumers (85%) were in England, 9% in Wales and 6% Northern Ireland. (footnote 4)
When responding on behalf of their child with a food hypersensitivity, around half (47%) stated that their child was female, and a similar proportion (52%) had a male child with a food hypersensitivity . The age of the child varied, with 29% between 0 and 6 years old, 26% between 7 and 10 years old and 43% between 11 and 17 years old.
Qualitative interviews
A total of 31 in-depth interviews were achieved with a subset of the consumers who completed the survey. Interviews were conducted with a variety of consumers, targeted to ensure a range of people by country, whether they or their child had a food hypersensitivity, the nature and type of food hypersensitivity and experiences since the new legislation. Tables 3.2 to 3.10 show the number of consumers who took part in the qualitative interviews by subgroup.
Table 3.2 Qualitative interviews by country
| Country | Number of achieved qualitative interviews |
|---|---|
| England | 25 |
| Northern Ireland | 3 |
| Wales | 3 |
| Total | 31 |
Table 3.3 Qualitative interviews by respondent or child's food hypersensitivity
| Respondent or child’s food hypersensitivity | Number of achieved qualitative interviews |
|---|---|
| Respondent has food hypersensitivity | 24 |
| Child has food hypersensitivity | 7 |
| Total | 31 |
Table 3.4 Qualitative interviews by severity of food hypersensitivity
| Severity of food hypersensitivity | Number of achieved qualitative interviews |
|---|---|
| Mild | 3 |
| Moderate | 5 |
| Severe | 21 |
| Don't know | 2 |
| Total | 31 |
Table 3.5 Qualitative interviews by coeliac disease status
| Coeliac disease status | Number of achieved qualitative interviews |
|---|---|
| Coeliac disease | 16 |
| Not Coeliac disease | 15 |
| Total | 31 |
Table 3.6 Qualitative interviews by awareness of PPDS labelling requirements
| Awareness of PPDS labelling requirements | Number of achieved qualitative interviews |
|---|---|
| Aware of PPDS labelling requirements before survey | 28 |
| Unaware of PPDS labelling requirements before survey | 3 |
| Total | 31 |
Table 3.7 Qualitative interviews by change in experience of buying PPDS foods since October 2021
| Change in experience of buying PPDS foods since October 2021 | Number of achieved qualitative interviews |
|---|---|
| Experience of buying PPDS has improved since Oct 21 | 12 |
| Experience of buying PPDS has worsened since Oct 21 | 2 |
| Total | 14 |
Table 3.8 Qualitative interviews by change in quality of life since October 2021
| Change in quality of life since October 2021 | Number of achieved qualitative interviews |
|---|---|
| Quality of life has improved since Oct 21 | 11 |
| Quality of life has worsened since Oct 21 | 4 |
| Total | 15 |
Table 3.9 Qualitative interviews by change in amount of PPDS food purchases since October 2021
| Change in amount of PPDS food purchases since October 2021 | Number of achieved qualitative interviews |
|---|---|
| Buys PPDS foods more since Oct 21 | 9 |
| Buys PPDS foods less since Oct 21 | 9 |
| Total | 18 |
Table 3.10 Qualitative interviews by change in confidence in buying PPDS foods since October 2021
| Change in confidence in buying PPDS foods since October 2021 | Number of achieved qualitative interviews |
|---|---|
| Confidence in PPDS labelling increased since Oct 21 | 12 |
| Confidence in PPDS labelling not increased since Oct 21 | 7 |
| Total | 19 |
Food Business Operators
Methodology
A total of 900 food business operators (FBOs) in the UK completed the telephone survey between 25 November 2022 and 12 January 2023. The sample was obtained through an external provider (Market Location) and during fieldwork, interviews were monitored by business size, sector and country to ensure the sample size for each group was sufficient and a representative sample was achieved. (footnote 5)
The survey took an average of 19 minutes to complete and were conducted with the person with responsibility for food safety at the FBO. The survey covered awareness and understanding of PPDS, current PPDS practices, support with and effects of PPDS legislation, as well as key firmographics about the business.
During analysis, the data was weighted to match the profile of the population by sector, size and country. (footnote 6)
At the end of the survey, 449 FBOs agreed that they were happy to take part in a follow-up qualitative interview, representing 50% of the sample. As with the consumer interviews, targets were set in order to achieve a broad range of perspectives, in this case, these were centred around country, size and sector, as well as awareness of, compliance with PPDS legislation and perceived ease of this. A total of 19 FBOs took part in in-depth interviews between 17 December 2022 and 3 February 2023. These were completed over the phone or via Zoom or Microsoft Teams. Interviews took between 45 and 60 minutes.
In order to account for those who sell PPDS foods from a market stall, five businesses that sold PPDS food from a moveable or temporary premises (e.g. a market stall or mobile sales vehicle) also took part in a qualitative interview. Once they had agreed to participate, market traders took part in an interview over the phone or via Zoom or Microsoft Teams. These interviews took place between 16 January and 1 February 2023 and took between 45 and 60 minutes.
Profile of FBOs
FBOs that are restaurants or cafes makes up the largest proportion (49%) of businesses that took part in the survey, followed by general retail (28%) and catering (15%). Half (50%) were the smallest business size with between 1 and 5 employees, and the majority (84%) were situated in England. A full breakdown of interviews achieved by country, size and sector is shown in Tables 3.11 to 3.14.
The proportion of surveyed businesses in each size and sector also represent the relevant proportions within each of the nations.
The majority (91%) of businesses sold PPDS foods at the time they participated in the survey. The remaining 9% had sold PPDS foods in the previous 12 months but had stopped doing so at the time of the survey. (footnote 7)
Table 3.11 Breakdown of businesses by country
| Country | Number of achieved mainstage surveys |
|---|---|
| England | 612 |
| Northern Ireland | 52 |
| Scotland | 161 |
| Wales | 75 |
| Total | 900 |
Table 3.12 Breakdown of businesses by number of employees
| Number of employees | Number of achieved mainstage surveys |
|---|---|
| Between 1 and 5 employees | 347 |
| Between 6 and 10 employees | 266 |
| 11 or more employees | 287 |
| Total | 900 |
Table 3.13 Breakdown of businesses by sector group
| Sector group | Number of achieved mainstage surveys |
|---|---|
| Catering | 355 |
| Retail | 545 |
| Total | 900 |
Table 3.14 Breakdown of businesses by sector (detailed)
| Sector detailed | Number of achieved mainstage surveys |
|---|---|
| Caterers | 107 |
| Restaurants and cafes | 248 |
| Bakers | 136 |
| Butchers | 133 |
| Delicatessens | 79 |
| General retail | 197 |
| Total | 900 |
Qualitative interviews
In terms of the qualitative interviews, 19 FBOs including five businesses that sold PPDS food from a moveable or temporary premises (e.g. a market stall or mobile sales vehicle) who completed a qualitative interview. The profile is shown in Tables 3.15 to 3.18.
Table 3.15 Breakdown of FBO qualitative interviews by country
| Country | Number of achieved mainstage surveys |
|---|---|
| England | 12 |
| Northern Ireland | 2 |
| Scotland | 4 |
| Wales | 1 |
| Total | 19 |
Table 3.16 Breakdown of FBO qualitative interviews by number of employees
| Number of employees | Number of achieved mainstage surveys |
|---|---|
| Between 1 and 5 employees | 8 |
| Between 6 and 10 employees | 5 |
| 11 or more employees | 6 |
| Total | 19 |
Table 3.17 Breakdown of FBO qualitative interviews by sector group
| Sector group | Number of achieved mainstage surveys |
|---|---|
| Catering | 9 |
| Retail | 10 |
| Total | 19 |
Table 3.18 Breakdown of FBO qualitative interviews by sector (detailed)
| Sector detailed | Number of achieved mainstage surveys |
|---|---|
| Caterers | 5 |
| Restaurants and cafes | 4 |
| Bakers | 5 |
| Butchers | 2 |
| Delicatessen | 2 |
| General retail | 1 |
| Total | 19 |
Local Authorities
Methodology
A total of 126 staff members, covering 124, of the 398 Local Authorities (LAs) across the UK, completed the online survey between 1 December 2022 and 13 January 2023. (footnote 8) The FSA and FSS distributed the link to the online survey by email and followed up to encourage LAs to complete the survey if they had not done so already. Upon invitation to take part in the survey, the email asked that the person best placed within the local authority to provide feedback on the experience of the PPDS labelling requirements takes part. This may be their lead food officer or someone they nominate to take part. (footnote 9) The survey covered their understanding of PPDS, how PPDS checks are carried out, experience of these checks and enforcement and impact on LAs and FBOs in their area.
A total of 39 LAs agreed to be recontacted in the survey, of these, 21 took part in an interview over the phone or via Zoom or Microsoft Teams between 14 December 2022 and 26 January 2023. These interviews lasted between 45 and 60 minutes on average.
Profile of LAs
In line with the UK profile of LAs, the majority of who completed the survey were in England. A full breakdown by country is shown in Table 3.19.
Table 3.19 Profile of LAs who took part in survey by country
| Country | Number of achieved mainstage surveys | Total number of LAs in each country |
|---|---|---|
| England | 82 | 333 |
| Northern Ireland | 11 | 11 |
| Scotland | 19 | 32 |
| Wales | 12 | 22 |
| Total | 124 | 398 |
Staff members who completed the survey indicated the area of the LA that they worked in, most worked in food standards or safety (80%), others worked in environmental health (28%) and trading standards (16%). (footnote 10)
Qualitative interviews
The profile of LAs who took part in the qualitative interviews by country, ease of checking compliance and overall description of the level of compliance of FBOs in their area with PPDS labelling requirements is shown in Tables 3.20 to 3.23.
Table 3.20 Profile of LAs who took part in qualitative interviews by country
| Country | Number of achieved qualitative interviews |
|---|---|
| England | 12 |
| Northern Ireland | 1 |
| Scotland | 7 |
| Wales | 1 |
| Total | 21 |
Table 3.21 Profile of LAs who took part in qualitative interviews by experience of compliance checks
| Experience of compliance checks | Number of achieved qualitative interviews |
|---|---|
| Found compliance checks easy | 11 |
| Found compliance checks difficult | 10 |
| Total | 21 |
Table 3.22 Profile of LAs who took part in qualitative interviews by perceived level of compliance in area
| Perceived level of compliance in area | Number of achieved qualitative interviews |
|---|---|
| Overall level of compliance good | 9 |
| Overall level of compliance poor | 10 |
| Total | 21 |
Table 3.23 Profile of LAs who took part in qualitative interviews by perceived experience of Food Business Operators
| Perceived experience of FBOs | Number of achieved qualitative interviews |
|---|---|
| FBO experience of compliance considered easy | 1 |
| FBO experience of compliance considered difficult | 20 |
| Total | 21 |
-
Cereals containing gluten is excluded from classification of allergy and intolerance due to the majority having Coeliac disease specifically.
-
This is broadly in line with the demographic make-up of those who took part in the Food Sensitivity Study: Wave Two (76% were female and 23% male). The majority (86%) were from a White background in this survey as well, and the age range also followed a similar pattern.
-
Consumers in Scotland were out of scope of the research.
-
FBOs with over 250 employees were excluded from the research as the FSA and FSS wished to engage micro and small businesses as they made up the largest part of the market.
-
This was based on figures published on ‘Nomis’, a service provided by the Office of National Statistics (ONS), of the official census and labour market statistics.
-
The latter were included in the survey to understand how or if the new labelling requirements impacted their behaviour regarding PPDS.
-
In two LAs, two staff members took part in the survey. The methodology involved the survey being sent out to LAs as an open link, meaning it could be accessed by multiple staff at the local authority, leading to these multiple completions.
-
In a small minority of cases, the person confirmed they had the knowledge or oversight of PPDS labelling requirements but were not directly involved in compliance checks.
-
Some LA staff members worked across more than one of these areas.