Review of allergen analytical testing methodologies: measurement parameters and sensitivity of methods
Review of allergen analytical testing methodologies: Allergen detection methods: Unbiased literature search
An overview of a literature review which took place in relation to the report
2.1 Introduction
The aim of this literature review was to review current methods to detect food allergens and to understand the new methodologies being developed for which information is available in the public domain. The fourteen groups of food allergens for which UK food suppliers must declare presence are: celery, cereals containing gluten (such as wheat, barley and oats), crustaceans (such as prawns, crabs and lobsters), eggs, fish, lupin, milk, molluscs (such as mussels and oysters), mustard, peanuts, sesame, soybeans, sulphur dioxide and sulphites (if the sulphur dioxide and sulphites are at a concentration of more than ten parts per million) and tree nuts (such as almonds, hazelnuts, walnuts, Brazil nuts, cashews, pecans, pistachios and macadamia nuts).The most common methods identified include immunochemistry methods, PCR methods and mass spectrometry methods. With the exception of sulphur dioxide and sulphites, each food allergen relates to a protein molecule.
Although this review is not specific to certain methodologies only, of the commercial methods, particular focus was placed on the commercial methods selected for implementation by international food testing laboratories, represented by the participants in each of the Fapas® allergen testing rounds over the last five years.
This is represented by data submissions by 1009 UK lab submissions, 3470 from Europe and 2124 from the rest of the world.
Current methods for allergen detection were identified to understand the state of the art and to identify the limitations and gaps in current capabilities. It is important to note that commercial allergen testing kits are regularly developed as manufacturers seek improvements in method performance and applicability. Changes in parameters such as the limit of detection (LOD) and limit of quantitation (LOQ) are not always immediately apparent when comparing kits in the literature, especially since kit manufacturers tend to retain the name of each kit, even when improvements or other alterations are made. It is therefore not easily possible to compare the performance of one kit against another at the present day when based on analysis of literature
captured over a series of years. For this reason, where available, this literature review provides both the name and the LOD/LOQ of the kit at the time of publishing, along with other performance data provided in the manuscript. Various different testing kits, such as for the ELISA (Enzyme-Linked ImmunoSorbent Assay) kits which is based on detection by antibodies of the allergenic protein(s), or PCR (Polymerase Chain Reaction) which is based on detection of a DNA sequence found in a particular food species, have been developed and are commercially available from a range of manufacturers. The composition of the kit, and the target protein or DNA sequence varies. However, when performing laboratory studies to compare the performance of these testing kits, many authors have opted to anonymise kit details when reporting performance data. Relating to ELISA kits, there are also necessarily variations in the performance of the kits from batch to batch, since performance will alter depending on the reactivity of new batches of antibodies. For this reason, the data in Table 1 (Appendix 1) have been prepared as far as possible from the current manufacturer kit manuals at the time of writing and may conflict with information details by authors included in the literature review.
The units in which data is reported vary from author to author. For the sake of transparency, the units are retained from the manuscripts. As a term of reference, the term ppm (parts per million) is equivalent to mg/kg (milligrammes per kilogramme of food). The term ppb refers to parts per billion (microgrammes per kilogramme of food).
2.2 Literature review search terms
This literature review commenced with the following searches which required at least one of the following terms in the title or abstract of articles published between 1993 and September 2022: “hypersensiti*” , “hyper-sensiti*”, “allerg*“ and at least one of the following: “celer*“ , “egg“ , “fish“ , “gluten“ , “gliadin“ , “wheat” , “lupin“ , “milk“ , “casein“ , “lactoglobulin“ , “mustard“ , “peanut“ , “sesame“ , “shellfish“ , “shell-fish” , “crustacea*“ , “mollus*“ , “soy*“ , “*nut“ , “almond“ , “brazil nut“ , “cashew“ , “coconut“ , “hazelnut“ , “macadamia*“ , “pecan“ , “pistachio“ , “pine*“ , “shea*“ , “walnut“ , “sulphur dioxide” , “sulfur dioxide” , “sulphite” , “sulfite” and at least one of the following “detect*“ , “quant*“ , “immunoassay“ , “immunosorbent assay” , “ELISA“ , “PCR“ , “polymerase“ , “mass spectro*“ , “LC-MS*” , “LCMS*”. This search was run through the following search engines (number of hits from a title and abstract search in brackets): Web of Science (4326), Pub Med (5551), BASE (6284), Lanl Library (173), BLDSC (10), Google Scholar (7500). Once these references were collected in EndNote 20 the duplicates were removed, leaving 10,320 references. These papers were then categorised based on their relevance to the topic on a scale of 1 to 5 according to the technology and allergen, with books and reviews excluded at this stage as our search was expected to capture any relevant work which would be cited by these. Student theses were also discounted along with methods which were still under development, under the assumption that the most pertinent research would be published in a peer-reviewed journal and captured during the review. The least relevant papers were classified with a 1, these were papers which were not about food or not about allergies. Papers classified as 2 related to the clinical side of allergy study, the biological background to allergic responses and papers regarding food labelling regulations. Papers with a rating of 3 or greater reflected methods used to detect allergens, including commercial, non-commercial and emerging methods and were considered for this review when some form of method verification or validation was included. Additionally, as mentioned above, publicly available information regarding the performance of the commercial ELISA and PCR kits implemented among users of the Fapas® testing programme was used to form part of this review and some of the content of Table 1 (Appendix 1).
2.3 Tabulated summary of testing methods
Table 1 (Appendix 1) was prepared during the literature review. This table summarises the scope and performance of testing methods with a particular focus on the commercial testing kits used by participants in Fapas® allergen testing proficiency trials during the past five years. Fapas® proficiency testing is undertaken by laboratories across the globe, using the testing methods they apply in their routine allergen testing services. These laboratories, experienced in allergen testing, will have naturally adopted the kits and other methods over time which provide the most reliable results for their requirements and matrices. Information provided in the user manual is summarised in the table along with data identified from reviewing the literature. Since testing kits are updated on a regular basis, often maintaining the same kit name which does not reflect that the kit has been developed, it is difficult to relate the literature to the current iteration of the kit. Few kit manuals reference or publish the data relating directly to the development of that kit, either online or in the contents of the kit. If required, kit users can approach kit manufacturers and request whether further details and validation data are available to receive. The detail of the validation data shared can vary between kit manufacturers. It can therefore be challenging to confidently align the literature with test kit data. Unless the specific commercial test kit to which a publication refers is stipulated in the manuscript, no attempt has been made to align data with test kits due to concerns over misaligning the data. As shown in Table 1, although the target protein is stipulated for some test kits, for other test kits the target is either unknown (often the case for kits for which polyclonal antibodies underpin the method which have been raised against the allergenic food as a whole so the precise protein/epitope is not known) or is withheld for proprietary reasons. This lack of transparency makes the comparison of kits, and the determination of the most suitable kits to use during an incident, very challenging and therefore is a knowledge gap. Conversion factors, when available in the manual, have also been included in Table 1 and another knowledge gap is the easy conversion between the data of different kits and the conversion of data into meaningful terms.
2.4 Literature review of methodologies for determining food allergens
The testing methodologies identified for each of the groups of food allergens are discussed below.
2.4.1 Celery
2.4.1.1 Introduction
The prevalence of celery human allergenic responses are raised in some European countries such as Switzerland, Germany and France. As a result it is mandatory to label food products containing celery in European regulations, however it is not mandatory in the United States and other countries where rates of celery allergenicity are lower. The major celery allergen is Api g 1, however in total six allergens have been characterised in celery (Api g 1-6). Api g 1 is homologous to the pollen allergen Bet v 1 and cross reactivity has been reported between celery and birch pollen sensitivities. (EFSA, 2014)
2.4.1.2 ELISA and immunoassay
As is common for allergen testing in food when foods are processed compared to native/raw, Jankiewicz et al. 1997 reported that the specificity and reactivity of IgE antibodies to celery reduced with thermal processing, using celery root as the target food (Jankiewicz, Baltes et al. 1997). The study compared heating by microwave, cooking, drying, gamma radiation, high voltage impulse treatment and ultra-pressure treatment. In contrast, the reactivity of the antibodies was only mildly reduced during non-thermal processing techniques. However, current methodologies to detect celery tend not to use immunochemistry technology as a consequence of the cross- reactivity between the Api g 1 celery allergen and the homologous birch allergen Bet v 1. Instead, PCR is the favoured approach for its specificity. Many publications, and indeed the only commercial testing method used in celery determination in Fapas® proficiency testing rounds, are based on PCR methods.
2.4.1.3 PCR
The EvaGreen® Real-Time PCR method was used for detection of celery, Apium graveolens. (Škultéty and Jurčáková 2011) A primer designed to target the mannitol dehydrogenase gene region was used for specific celery identification in sample. The results showed the possibility to create a calibration curve using artificially adulterated samples. The increasing variability between parallel calibration of celery samples was observed from 0.1 % to 100% and the detection limit was 0.1% celery (equating to 1000 mg celery/kg food).
Luber et al. 2015 reported the development of a tetraplex real-time PCR method (Luber, Demmel et al. 2015). The approach was validated with DNA extracted from lysate mixtures of boiled sausage. Recovery, repeatability and robustness were successfully evaluated and the LOQ was determined as 3.7 mg/kg. However, quantification was achieved using standard addition of the allergen to the prepared food rather than by the more usual route of analysing incurred samples.
A 2017 ring trial of real-time multiplex PCR methods with a spike level of 40 and 100 mg/kg celery was conducted by Waiblinger et al. (Waiblinger, Boernsen et al. 2017) using the published method of a multiplex real-time PCR method to combine the detection and quantification of brown/black mustard, white mustard, celery and soybean was validated (Luber, Demmel et al. 2015) showing that the method was capable of reliably detecting and quantifying incurred boiled sausages containing 40 mg/kg celery. PCR had been shown to cross-react with coriander and lovage previously at the 0.01% level (Waiblinger et al. 2017). The LOD of this method was determined as <10 copies for celery but did not detail how to equate this to the level of celery allergen protein. Details of any commercial kits used in the ring trial were omitted. Current commercial methods detect down to 0.4 mg/kg celery (LOD 1 mg/kg) and it would be interesting to learn the performance of the method used in the ring trial but involving lower levels of allergen detection.
In a study by Wu et al. 2010, a celery mannitol transporter (Mat3) gene-based detection method for celery was established by means of SYBR Green real-time PCR technique (Wu, Chen et al. 2010). The method was found to be applicable to Chinese celery, Western celery and fragrant celery. No cross-reactivity was found between celery and the other food materials (parsley, shallot, carrot, potato, fennel, soybean, rice, peach, apple, orange, walnut, cauliflower, maize, chili, peanut, sesame, pumpkin, and sunflower seed pork, beef, chicken, and mutton along with eight processed products which declared celery as an ingredient). The LOD was determined through experiments on pure celery DNA, DNA mix, and spiked food samples. The method was able to detect 0.001% raw food sample and 0.01% heated food sample. The utility of the method was confirmed by the investigation of 13 commercial foods. The LOD was determined as 5 picograms (pg) celery DNA, indicating that theoretically 0.001% celery could be detected from 100 ng/mL (nanograms per millilitre) DNA template.
Daems et al. 2017 developed a rapid, one-step quantification method of celery DNA by Fiber Optic Surface Plasmon Resonance PCR which allowed for the cycle-to- cycle quantification of the target sequence by melting analysis (Daems, Peeters et al. 2017). The developed bioassay was benchmarked against qPCR followed by high resolution melting analysis, showing excellent agreement (R2 = 0.96).
A commercial PCR method (SureFood® Celery) exists with an LOD of 0.4 mg/kg (of celery powder spiked into corn flour) and an LOQ of 1.0 mg/kg in the same matrix. The performance of the method on other food matrices is not detailed in the manual so users must determine the suitability of their matrices independently. The precise basis of this method is not detailed in the manual, perhaps for proprietary reasons. Methods detailed in the literature do not match always match this LOD or LOQ, however are detailed below as these methods do detail detection in additional matrices.
2.4.1.4 Mass Spectrometry
Mass spectrometry combining two mass analysers (MS/MS), particularly liquid chromatography mass spectrometry (LC-MS/MS), is a technology which has been emerging for allergen detection over approximately the last 10-20 years. Compared to ELISA and PCR methodologies, this is a much more recent application being implemented for allergen detection.
Using nanoLC-ion-trap MS/MS, initial method development was conducted to detect proteins belonging to celery, potato and carrot (Faeste et al. 2010). Among others, a novel patatin (Sola t 1)-like protein was detected in celery and a flavin adenine dinucleotide binding domain-containing protein (Api g 5)-like glycoprotein was identified in carrot. The data also suggested the presence of a Sola t 4- like protease inhibitor in celery. Several unique precursor ion-to-product ion transitions were determined for each species, suggesting the feasibility of developing an MS-based screening method to specifically detect celery allergens in foods. This group initially developed an ELISA assay targeting celery but the antibody showed cross-reactivity with carrot, parsnip and potato.
2.4.1.5 Conclusions – Celery testing methods
From Fapas® data, we see that the method used by food testing laboratories to determine celery is PCR, with one vendor monopolising the market (Table 1, Appendix 1). This commercial method provides details in the manual of LOD and LOQ based on corn flour, presumably spiked with celery powder. Little data is provided regarding cross-reactivity. Data is available in the public domain to show that certain PCR methodology does benefit from low LOD/LOQ and also does not cross-react with a range of food types (Wu, Chen et al. 2010). However, it is impossible to know whether this is the PCR method upon which the commercial method is based. Increased transparency by commercial kit manufacturers regarding the validation data of their kits, including but not restricted to listing the matrices tested, cross-reactivities identified and the manner in which validation samples were prepared and whether they are cooked or raw, incurred or spiked, would greatly benefit testing laboratories in determining the suitability of kits prior to purchase.
Since only one method dominates the market (a PCR kit) it would benefit consumers if a confirmatory method was also available, based on a different technology.
2.4.2 Cereals containing gluten
2.4.2.1 Introduction
Gluten is a class of proteins present in wheat, rye (as secalins) and barley (hordeins) within the grass genus Triticum, including semolina, triticale, spelt, emmer, einkorn, Kamut™(Khorasan wheat), and club wheat. The use of gluten in foodstuffs is common due to benefits concerning texture, moisture retention and flavour. The term ‘gluten’ is a collective term for a structural protein found in certain cereal grains which can trigger celiac disease. The prevalence of sensitivity for the allergens in wheat, barely, rye and oats is <2%. (EFSA, 2014) Wheat gluten is composed of mainly two types of proteins: the glutenins and the gliadins. In barley, gluten proteins are referred to as hordeins, in rye, secalins, and in oats, avenins.
Since these proteins have sequences which differ slightly in different species are not present in the same ratios in the different species, the ability to accurately quantify the overall amount of gluten in various food matrices is challenging.
Current gluten analysis is mainly conducted using ELISA. The main concern with this allergen is detection in partially hydrolysed or fermented products. There is also concern that gliadin is the only target for wheat so there is little diversity between methods.
Lacorn et al. (Lacorn, Lindeke et al. 2018) warn that, ‘For production, starch is cleaned up by the very thorough cold-water washing-out of gluten, or gluten is additionally fragmented by enzymes into peptides. In the latter case, remaining gluten fragments are potentially too small to be detected by sandwich ELISA systems in a quantitative way due to the fact that only one epitope remains in the peptide. In this case, the use of a competitive ELISA assay format is strongly advisable that is also able to detect very small fragments of proteins. However, competitive assays usually have to use less stringent extraction buffers, which may lead to incomplete extraction in heat-treated materials.’
2.4.2.2 ELISA Methods
Holzhauser et al. 2020 reported that a few major limitations of the methodology have been extensively investigated with numerous studies reporting that results of different kits very often show considerable variation (Geng, Westphal et al. 2008, Bugyi, Torok et al. 2013, Scharf, Kasel et al. 2013, Alvarez and Boye 2014, Scherf 2017, Holzhauser, Johnson et al. 2020). Major causes of variability, reviewed by Holzhauser et al., include differences in antibody affinity (Lexhaller, Tompos et al.
2016, Lexhaller, Tompos et al. 2017, Panda, Boyer et al. 2017, Allred and Ritter 2019), the effects of processing and the matrix (Bugyi, Torok et al. 2013, Gomaa and Boye 2013, Gomaa and Boye 2015, Panda, Zoerb et al. 2015) and the genetic and environmental variability of proteins (Pahlavan, Sharma et al. 2016, Hajas, Scherf et al. 2018). These issues demonstrate an urgent need of harmonisation in this field, and indeed this has been the case for over a decade. These issues demonstrate the need for harmonisation in this field, as discussed further in Section 3.
The detection of wheat products is typically achieved through the detection of gluten, with the Voluntary Incidental Trace Allergen Labelling (VITAL) expert panel advising individuals with IgE-mediated wheat allergies that they would be “largely protected when selecting gluten-free products manufactured in conformity to Codex guidance” (Taylor, Baumert et al. 2014). The target protein of commercially available kits is typically gliadin, based on R5 monoclonal antibodies which are specific for proteins from wheat, rye, and barley. The two ELISAs Wheat Protein ELISA Kit (Gliadin kit) and a FASTKIT Wheat ELISA Kit (Wheat ELISA kit) which are supplied by Cosmo Bio Ltd, Japan, were found to have detection limits of 1 ng/ml for matrices of sausage, sauce, pasta sauce, fish paste and cereal (although only the abstract could be accessed of this paper and the method of determining the LOD (whether in buffer, spiked or incurred into the matrix is not clear) (Akiyama, Nakamura et al. 2004). In a ring trial across ten laboratories the ELISAKits FASTKIT ELISA Ver. II Series and the FASPEK® Allergenic Substances Detection Kit (Morinaga) were evaluated on a variety of matrices and gave recoveries of gluten in sausage of around 100% for sausage, boiled beef, tomato sauce, and orange juice but <30% for jam (which can be a vector for gluten contamination) (Akiyama, Nakamura et al. 2004).
The extraction protocol is a crucial step in ELISA analysis and forms part of the manufacturer instructions. Extraction protocols are kit-specific and, for example, should they include reducing agents, these need to be diluted out prior to analysis to avoid disruption to the activity of the kit components. In their 2009 study, van den Broeck et al. (van den Broeck, America et al. 2009) compared different extraction buffers, assessing the proteins which were extracted by each method by gel separation analysis by sodium dodecyl sulphate–polyacrylamide gel electrophoresis (SDS-PAGE). A two-step extraction method was optimised which extracted a wider range of gluten proteins than single-step methods, including extraction of low molecular weight proteins. Different antibodies were also used compared to the R5 antibody, which, when used to probe an immunoblot of the SDS-PAGE-prepared profile using the two-step method, detected different low molecular weight peptides compared to R5. The authors separated gliadin and glutenin extraction; extraction using reducing agent; extraction in 60% ethanol and; a two-step gluten extraction (van den Broeck, America et al. 2009). Of these, the typical commercial kits use a 60% ethanol solution, including the kit used in this work, and the RIDASCREEN® Gliadin competitive ELISA, this work found no significant difference between the 60% ethanol extraction method and the two-step extraction when the extracts were analysed using the RIDASCREEN® kit.
A comparison study between five ELISA kits for gluten included the following kits (LOQ in brackets): RIDASCREEN® Gliadin by R-Biopharm AG, Darmstadt, Germany (5 ppm), wheat protein ELISA kit by Morinaga Institute of Biological Science, Inc., Yokohama, Japan (0.3 ppm), BioKits gluten assay kitby Neogen Corp., Lansing, MI (3 ppm), ALLER-TEK gluten ELISA assay by ELISA Technologies, Inc., Gainesville, FL (5 ppm), AgraQuant® gluten assay by Romer Labs UK Ltd, North Wales, UK (4 ppm), and Gliadin kit by ELISA Systems, Queensland, Australia (5.0 ppm) (Sharma 2012). All LOQs quoted in this manuscript match those declared in current documentation provided with kits, except the kit from ELISA Systems which currently quotes a LOQ of 2.0 ppm (ELISA, 2020) This work tested cornflour spiked with gluten and wheat flour at a range of concentrations and observed different interactions with allergens. The kits provided by R-Biopharm, Morinaga, and Romer Labs reacted strongly with the gliadin fraction, whereas those from BioKits, ALLER- TEK, and ELISA Systems reacted strongly with the glutenin fraction. All kits gave a positive response to gluten spiked at 5 ppm, as would be expected given their stated LOQs. The recovery responses were varied with the R-Biopharm reporting a wheat flour recovery of 74%. The Morinaga and Biokits products exhibited average recoveries between 100-200%, while the Aller-tek, Romer Labs and ELISA Systems had significantly higher recoveries for wheat flour.
The development of incurred gluten contamination standards, where gluten is added to the sample prior to processing to a final product, better-represent real-life challenges to the food industry. With a view to this, Sharma et al. developed cornbread with either gluten or wheat flour incursion assessing the performance of each kit against both (Sharma, Khuda et al. 2013). The variation of gluten source affected the accuracy between the different ELISA kits tested: RIDASCREEN Gliadin (R7001; R-Biopharm AG, Darmstadt, Germany), wheat protein ELISA kit (181GD; Morinaga Institute of Biological Science, Inc., Yokohama, Japan), BioKits gluten assay kit (802002Y; Neogen Corp., Lansing, MI), and AgraQuant Gluten G12 (COKAL02002; Romer Labs UK, Ltd., Cheshire, U.K.). The kits (which may or may not have changed since the study) used different antibody types: BioKits used a Skerritt (401/21) monoclonal antibody; Morinaga used an anti-gluten polyclonal; R- biopharm used the R5 monoclonal; and Romer Labs used the G12 monoclonal antibody. Positive detection of gluten was possible with each kit tested at each level of spiking gluten (0−500 ppm) and wheat flour (20−1000 ppm), and different baking conditions (204.4 °C for 20, 27, and 34 min). The stability and immunoreactivity of gluten proteins, as measured by western blot using three different antibodies, were not adversely affected by the baking conditions. Dependant on the kit and source of gluten, the gluten recovery variation was high, affecting the accuracy of gluten quantification: BioKits 9−77%; Morinaga 91−137%; R-Biopharm 61−108%; and
Romer Labs 113−190%. Gluten recovery was reduced with increased baking time for most ELISA kits analysed. The Morinaga and R-Biopharm kits gave lower recoveries using the wheat flour compared to gluten incurred cornbread, whereas the Biokit gave the opposite observation. The predicted analytical coefficient of variation associated with all ELISA kits was below 12% for all incurred levels, indicative of good analytical precision. This study reveals a wide range of recoveries, both within- kit and between kits, with accuracy affected by kit type and baking conditions, with most kits reporting lower gluten levels as baking time increased. A reduction to zero following a longer baking time may lead to false negative results, putting gluten- sensitive consumers at risk. The variation in the recoveries will impact on the level of gluten estimated by each kit and highlights a gap in the (consistent) capabilities of kits to measure gluten in food.
In their 2013 development of a RM for gluten, a study by Bugyi et al. compared seven different commercially available ELISA kits (Bugyi, Torok et al. 2013). The data were however anonymised in reporting relevant results. This lack of transparency increases the challenge of understanding gaps in the effectiveness of specific kits, however it provides an opportunity to examine the harmonisation across the market. Between the kits, significant differences in average recovery were observed. The differences between kits result from different antibodies, extraction solutions and calibrations, with authors highlighting the fact that R5 and Skerritt antibodies are both developed against prolamines, however their affinities for glutenins and gliadins differs, and this makes the conversion of gliadin units to gluten units inconsistent. Additionally, each kit may be calibrated using a different standard. As highlighted elsewhere in this report, this would benefit from being standardised to ensure that the protein sources across different manufacturers can be accurately compared and contrasted.
Studying baked cookies in work which interrogated ELISA kits and flow cytometry for casein, egg, gluten and soy sensitivity, the following ELISA kits were studied: R- Biopharm RIDASCREEN (exact gluten kit not specified) (R-Biopharm AG, Darmstadt, Germany) and the Neogen Veratox (exact gluten kit not specified) (Neogen Corp., Lansing, MI) (Gomaa and Boye 2013). This work was published in 2013 and while it uses commercial ELISA kits which are still on the market, these kits can be developed and altered constantly, and results presented in this work may not represent current sensitivity. Both ELISA kits and flow cytometry were able to detect gluten allergens under all processing conditions with recoveries of: 93–31% for the RIDASCREEN kit, 72–27% for the Veratox kit, and 75–21% for flow cytometry. The detection of allergenic proteins with both increasing cookie size and temperature is a positive indicator for the robustness of these kits with the internal temperature of the small cookies reaching 155 °C. At temperatures greater than
100 °C, the Maillard reaction occurs which alters protein-carbohydrate interactions and this can mask allergenic epitopes. Robustness must of course be formally assessed during a full validation exercise.
Work from Lacorn et al. which presents case studies highlighting the gaps in the application of ELISA kits for detecting allergens (Lacorn, Lindeke et al. 2018) also highlights the potential for allergenic wheat proteins which are too small for detection by sandwich ELISA to remain in gluten-free wheat starch, when the ‘gluten-free’ flour is produced from wheat by cold water washing-out of gluten. Conversely when using a competitive ELISA, the extraction buffer may be insufficient to extract heat-treated materials, which may arise when the starch is heated to dryness after the cold-water washing. Therefore, to minimise the risk of either method being insufficient, the authors recommend the use of both competitive and sandwich ELISA kits to indicate how the gluten-free wheat starch was produced.
The validation of an ELISA kit, the Morinaga M2103 for Wheat/Gluten, was published in 2019 (Saito, Doi et al. 2019). For the test materials, a blank sample of gluten-free bread was spiked with either gliadin or gluten and additionally an incurred reference bread was made using a gluten-free bread mix and wheat protein spiking solution.
The Association of Official Analytical Chemists (AOAC) Research Institute Performance Tested MethodSM (PTM) program was used to validate the linearity study, selectivity, both incurred and spike matrix studies, LOD, LOQ, robustness and the lot-to-lot consistency/stability studies. An independent laboratory was additionally included in the testing protocol. The analysis of 38 different substances revealed no cross-reactivity above the LOQ except for oats. The method was shown to be robust in terms of altering the extraction times. This manuscript is a rare example of kit validation data being published and thus accessible for stakeholders.
In the past year a comparison of the following sandwich ELISAs was performed by Amnuaycheewa et al. RIDASCREEN® Gliadin kit (R-Biopharm AG, Darmstadt, Germany; Art. No. R7001; the AOAC-RI license #120601, the AOAC-OMA license #2012.01, and the AACC International Approved Method 38–50.01), the Veratox® for Gliadin R5 kit (Neogen Corporation, Lansing, MI, USA; Product No. 8510; the AOAC-RI license# 061201), the Wheat Protein ELISA kit (Gliadin) (Morinaga Institute of Biological Science, Inc., Yokohama, Japan; Cat. No. 181GD), and the AgraQuant® Gluten G12 assay (Romer Labs UK Ltd., Cheshire, UK; Product No. COKAL02002; the AOAC-OMA license #2014.03 and the AACC International Approved Method 38–52.01) (Amnuaycheewa, Niemann et al. 2022). Much of the study focussed on determining gluten levels in 32 foods containing gluten around the 20 ppm target level for gluten-free status, as determined previously by the RIDASCREEN® Gliadin kit or the RIDASCREEN® FAST Gliadin kit. Each of these kits used gliadin as a calibration standard although the RIDASCREEN and Veratox detect the R5 antibody and the Morinaga and AgraQuant detect the G12 antibody.
Tested against 32 foods and ingredients and also against sixteen spiked powders of wheat, barley, rye, triticale, oat and sorghum, representing a wide range of food types and processing conditions, the results were evaluated. As reported by the authors, as expected, similar results were yielded from the two R5 kits. The G12 kit and the Morinaga kit, though reporting result as wheat protein, not gluten, also yielded similar results to the two R5 kits for most samples but yielded substantially different results for a few samples including samples of yeast extract, hemp protein powder and cookie. Those differences could be caused by any one of the several reasons: (a) differences in the grain source of glutens and related proteins, (b) differences in the efficiency of extraction and detection, (c) subsampling differences with particulates, or (d) some combination.
The Romer AgraQuant Gluten G12 Assay (COKAL02002) and the R-Biopharm RIDASCREEN Gliadin Assay (R7001) assays compared similarly in a study to determine gluten in wheat cultivars. The kits apply different antibodies (monoclonal G12 and monoclonal R5, respectively) and are calibrated differently (vital wheat gluten extract and PWG-gliadin, respectively). Both kits showed similar recoveries, around 100% for some cultivars and both kits reacted significantly differently to certain cultivars (Hajas et al 2018).
2.4.2.3 Mass Spectrometry
Authors considering the quantification of low-level (trace level) gluten peptides by mass spectrometry have focused on a variety of different target peptides. Six targets in enzymatically digested food samples were identified by Sealey-Voyksner et al. and they were characterised to LODs ranging from 1 to 30 pg mg-1and the method was capable of detecting and quantifying select target peptides in food over a range of 10 pg/mg (0.01–100 ppm) with good reproducibility (Sealey-Voyksner, Khosla et al. 2010). Reproducibility of the assay was demonstrated for the calibration data and for data collected from the analysis of QC standards over a period of four days. The average coefficient of determination (R2) for each peptide was greater than 0.995.
The detection of a range of peptides to identify five different proteins was published by Manfredi et al. and for spiked rice flour gave good sensitivity, however with incurred test materials the recovery varied from 3-30% (Manfredi, Mattarozzi et al. 2015). This highlights a common issue in allergen detection whereby processed foods are often far more of a challenging matrix for both mass spectrometry and ELISA methods and allergen in processed food may be underestimated by methods.
It was the 33-mer peptide, from the alpha2-glandin protein, which was the focus of quantification work by Schalk et al. (Schalk, Lang et al. 2017). Using rye flour, which does not contain the target peptide, as a matrix, an LOD of 13.1 μg g-1 LOQ of 47.0 μg g-1 was established, significantly lower than the content of the peptide in wheat cultivars. In subsequent work from the same group an attempt to quantify wheat glutens involved the identification of 16 reference proteins which could be summed into an estimate of gluten concentrations. This was compared to established methods, an R5 ELISA and gel permeation high-performance liquid chromatography (HPLC) with fluorescence detection and a strong correlation was found.
2.4.2.4 Conclusions – Cereals containing gluten
The crucial challenge in ELISA detection is the variability across different kits, the calibration and RMs, the antibodies which are used (typically either G12 or R5), and whether the data is reported as gliadin or wheat proteins (Bugyi, Torok et al. 2013). It is essential that the future direction of allergen detection harmonises these concepts so that food manufacturers can test with certainty. The recent work from Amnuaycheewa et al. which used kits testing for two different antibodies found comparable results between them all, suggesting that modern iterations of each kit may be approaching this goal (Amnuaycheewa, Niemann et al. 2022).
It must also be considered that the recovery of gluten can vary considerably between kits so gluten levels could be seriously under-estimated (or over-estimated) depending on the kit used and therefore kit users must have validation data for their typical sample type, with validation samples comprising incurred products. With validation data for a kit, one option is that a correction factor can be applied to calculate the level of gluten in a product. However, labs need to prepare their own validation data in order to apply this. Since gluten can be deliberately fragmented by enzymes during processing, it will be interesting to determine if peptide detection methods develop further in the future (Schalk, Koehler et al. 2018).
2.4.3 Crustacea
2.4.3.1 Introduction
Crustaceans form a large part of many diets across the world, however the prevalence of self-reported allergies varies, from 0.3% in children in the UK to 5.5% in France, with decapods, such as shrimp, lobster, prawn and crab the main allergy causing foods. (Pereira et al., 2005; Touraine et al., 2002) Tropomyosin has been characterised as the major crustacean allergen found in decapods with at least 80% of shrimp allergic individuals reacting to it, however other compounds such as arginine kinase, sarcoplasmic calcium-binding protein and myosin light chains have also been identified as allergy causing. (EFSA, 2014)
2.4.3.2 ELISA, immunochemistry and PCR
A comparison of seven commercial methods for the detection of shrimp allergens in kimchi (salted, fermented vegetables) tested three PCR kits (SureFood Allergen ID Crustaceans from R-Biopharm, Darmstadt, Germany; PowerChek shrimp & crab real-time PCR kit from KogeneBiotech, Seoul, South Korea; and Cruskit real-time PCR from 4LAB Diagnostics, Vicomoscano, Italy) and four ELISA kits (Ridascreen Fast Crustacean from R-Biopharm; Veratox for crustacea allergen supplied by Neogen, MI, USA; AgraQuant ELISA crustacea from Romer Labs, Newark, DE, USA; and Crustacean Residue from ELISA Systems, Queensland, Australia) (Jeong and Kim 2020). Only the ELISA kits were capable of quantification as the PCR kits do not contain standards of known concentrations and the sensitivity of the three PCR kits differed quite significantly at 0.4, 100, and 25 ppm for SureFood, PowerChek, and Cruskit kit, respectively. Both the SureFood and PowerChek kits were capable of amplifying the shrimp DNA with the Ct values of the SureFood kit closely matching the relative allergen concentrations in the traditional Korean dish of kimchi and its ingredients saeu-jeot (salted shrimp) and saeu-aekjeot (fish sauce).
For all tested samples, no positive result was obtained for the Cruskit kit, but tiny shrimp (A. japonicas) was absent from its target species list. For two allergenic proteins in shrimp, tropomyosin (TM) and sarcoplasmic calcium-binding protein (SCA), the four ELISAs were compared, with three kits being sensitive to tropomyosin with an LOQ of 0.003 to 0.01 μg/mL while the Crustacean residue kit was sensitive to TM and SCA only at higher concentrations (0.1 μg/mL). This is still sufficiently sensitive to detect levels at the threshold known to elicit anaphylaxis, although the method of LOQ determination is not available and so it is unclear if it was established in buffer or matrix. This is a curious outcome as while the Ridascreen and Veratox kits offer a broad range of target proteins, the AgraQuant kit and ELISA Systems Crustacean Residue kit target tropomyosin specifically and would be expected to detect this protein at low levels.
Otto et al. 2016 reported an immunoassay for the simultaneous detection of milk, egg, peanut, mustard and crustaceans in cookie samples at sub-100 ppm levels (Otto, Lamote et al. 2016). The method was based on a combination of flow cytometry with competitive ELISA where microbeads coated in antibodies were used as sorbent surface. The lowest concentration of crustacea inducing a significant difference of signal between non-contaminated controls and test samples was 5 mg/kg. The authors reported that the test was sufficiently sensitive to detect crustaceans at the reference doses established by the VITAL expert panel. Assay sensitivity was influenced by the concentration of primary antibodies added to the sample extract for the competition and by the concentration of allergenic proteins bound to the surface of the microbeads. No cross-reactivity was observed with the anti-crustacea antibodies. The authors stated that flow-cytometry-based immunodetection may, in the near future, improve upon the performances of classic ELISAs by adding a new feature: simultaneous detection/quantification of multiple allergens.
Relating to cross-reactivity of ELISA methods, there is much potential for cross- reactivity between crustacean allergens and insect food allergens, due to the commonality of certain proteins between the animal groups. De Marchi et al. 2021 investigated the allergenic potency of the cricket (Acheta domesticus) and shrimp (Litopenaeus vannamei) (De Marchi, Mainente et al. 2021) assessing the effect of thermal processing and gastrointestinal digestion on allergenic properties. A. domesticus is considered a potential nutrient source due to its attractive nutritional profile and lower feed conversion ratio compared to other animals. Cricket proteins relating to sarcoplasmic calcium-binding protein and tropomyosin were detected by the sera of 20 shrimp-sensitive patients, with tropomyosin being the more relevant in terms of reactivity. The assessment of the stability upon food processing and gastrointestinal digestion of cricket proteins, when used as ingredients to enrich food products, is crucial to infer essential data about the risk associated with their ingestion. Of concern, while shrimp tropomyosin was unstable to simulated gastric digestion, cricket tropomyosin showed different properties and was resistant to digestion and would potentially represent a risk of primary sensitization to crustacean allergy from consumption of crickets and cross-reactivity. Indeed, it is possible that the co-sensitization to other allergens, such as house-dust mites, cockroach, mealworm etc. might contribute to the variability of the IgE-binding profiles (van Broekhoven, Bastiaan-Net et al. 2016). Tested on shrimp powder- or cricket flour- incurred biscuits, thermal treatment (baking) enhanced the stability of the allergenic proteins to gastric digestion. Rather than becoming more susceptible to digestion as a consequence of the thermal treatment, TM was recognized by patients’ sera IgE after the gastric digestion and also up to 1 h of intestinal digestion. The high IgE- cross-reactivity between shrimp and cricket tropomyosin indicates that current testing methods may be incapable of discriminating between crustacea and insect protein in food.
2.4.3.3 Mass Spectrometry and other methods
A biomarker approach was adopted for a mass spectrometric method for the quantification of crustacean proteins in salmon lasagne spiked with lobster or shrimp. Proteotypic peptides were identified in combination with enhanced MS sensitivity using MRM3. (Korte, Monneuse et al. 2016) MRM3 is a modern development in mass spectrometry which offers increased sensitivity compared to traditional MRM triple quadrupole instruments through the inclusion of a second fragmentation step. This study demonstrated LODs of 100-1000 mg kg-1 using MRM and 10-100 mg kg-1 in MRM3. A typical LOD for ELISA methods, which benefit from years of development, is currently approximately 0.1-2.6 mg/kg. Another LC-MS/MS method, built around stable isotope-labelled standards for the quantification of tropomyosin and arginine kinase (AK), was able to detect both proteins with recoveries of 94.11-102.16% (Li, Zhou et al. 2022). The LOD ranged between 0.03-0.52 ng mL-1 across the signature peptides for both proteins. This method was tested on commercially available products and detected both TM and AK in all products for which the allergen was included in the ingredients list and also for those for which the allergen was listed in the precautionary (‘may contain’) allergen labelling. No allergen residues were detected in products that claimed to be allergen-free. The LC-MS methodology would benefit from further development with an aim to bring sensitivity in line with that of ELISA methods.
The authors are also aware of research and development work to prepare Surface Plasmon Resonance biosensor detection of shellfish tropomyosin (Zhou et al. 2020). Aptamer methods are also in development for shrimp tropomyosin (Chinnappan et al. 2020) It will be interesting to determine in the future whether such methods become commercialised or whether LC-MS/MS methods are preferred (Li, Zhou et al. 2022).
2.4.3.4 Conclusions - Crustacea testing methods
The literature review has shown that a limited amount of data is available for the comparison of performance of testing methods for crustacea. PCR methods offer only qualitative analysis while ELISA offers semi-quantitation at highly sensitive levels. MS methodology appears to be in the early stages of development with requirements to increase the sensitivity.
2.4.4 Egg
2.4.4.1 Introduction
The chicken egg is widely eaten and used in the food industry, either as a main ingredient or used in a variety of products for its binding, emulsification, coagulation and adhesion properties. Comprised of both a yolk, containing nutrients, and the white, which contains proteins and water most egg-allergic subjects were allergic to proteins found in egg whites, however both egg white and egg yolks can be allergy causing. Multiple allergens have been characterised both in the yolk (serum albumin and YGP42) and the white (ovomucoid, ovalbumin, ovotransferrin and lysosome C).(EFSA, 2014) The prevalence of egg allergy in a challenge proven study found sensitivity levels of 0.1% of adults in both Denmark and Turkey. (Oseterballe et al., 2005; Gelincik et al., 2008)
2.4.4.2 ELISA and immunochemistry-based methods
Working with the Veratox for Egg Allergen Test from Neogen, Williams et al. studied the detection of egg white proteins (ovalbumin, ovotransferrin, ovomucoid, and lysozyme ) in snack foods and noodles (Williams, Westphal et al. 2004). This study used dried egg powder (SRM 8415) from the National Institute of Standards and Technology (NIST) as a reference. The ELISA kits were able to detect egg in dry noodles at a significantly higher level than in boiled noodles.
Comparative results from sodium dodecyl sulphate polyacrylamide gel electrophoresis (SDS-PAGE), however, suggested that the protein profiles between the cooked and uncooked egg noodles differed with ovalbumin being undetectable, while ovomucoid proteins were not affected by heating. This indicated that ovomucoid would be a better target for analysis where the sample is subject to thermal processing. This work also tested a variety of matrices, cookies, crackers, salad dressing, noodles and ice cream to demonstrate that recovery was not affected by matrix, with recoveries ranging from 23% to 32%. This egg RM reacted differently by a factor of 10 in a 2010 study by Lacorn and Immer compared to a non- irradiated RM (Lacorn and Immer 2010), highlighting the importance of having a range of RMs for each allergen type, each prepared with different levels of processing. The use of irradiated RMs arises from a need to reduce microbial contaminants and destroy pathogens, such as Salmonella. However, it can also affect the proteins, causing degradation through glycosylation, impacting the concentration of intact proteins and their binding to antibodies. Therefore, validation studies need to carefully evaluate the impact of irradiation on the properties of RMs and ensure that any alterations do not compromise the accuracy and reliablilty of allergen detection using these methods.
The impact of heating egg proteins on detection by three different ELISAs: Neogen’s Veratox Egg Allergen Test, Tepnel Biosystems’ Biokits Egg Assay, and Morinaga’s Egg Protein ELISA Kit, was investigated by Fu et al., the first of which was found to greatly underestimate the levels of protein, which agreed with the finding of Williams et al. (Williams, Westphal et al. 2004, Fu, Maks et al. 2010). For the Biokits, which uses antibodies to ovomucoid marker proteins, higher levels of egg proteins in boiled samples were detected. When the samples were dry heated to temperatures > 176 °C both the Veratox and Biokits gave significant under estimations of egg protein of
< 25%, decreasing further with additional heating. The Morinaga kit has an extraction buffer developed to detect proteins in thermally processed foods and for samples boiled and dry heated to 176 and 204 °C the recovery was greater than that of either of the other two tests.
Thermal processing was investigated through the medium of cookies in work by Gomaa et al. which looked at Morinaga’s Egg Protein ELISA Kit, Neogen’s Veratox Egg Allergen Test and flow cytometry coupled with competitive ELISA where microbeads were used as the sorbent surface (Gomaa and Boye 2013). The objectives of this research were to investigate the effects of baking time (unbaked, 10- 15- and 25-minutes cooking), temperature profile and cookie dimensions and weight on the detection of four allergens (casein, egg, gluten and soy) simultaneously incurred in a non-wheat flour cookie using enzyme linked immunosorbent assay (ELISA) and flow cytometry. As shown in Figure 1, there was a wide disparity when comparing the performance of the three methods. In general, allergen recovery decreased as baking time increased and cookie size was decreased. Temperatures at the centre of the cookies also increased with decreasing cookie size and increased baking time. The recoveries of egg allergens in the baked cookies were less than 50% for the ELISA kits (Morinaga and Veratox kits) and flow cytometry. Nevertheless, the Morinaga kit had significantly higher recoveries of egg allergens in the baked cookies than either the Veratox kit or flow cytometry. Whereas the Morinaga kit had the maximum allergen recovery at 48% for the large cookies baked for 10 min, recoveries with the Veratox kit and flow cytometry did not exceed 5%. While the Moringa kit detected egg in all samples, the Veratox and flow cytometry methods did not detect egg, or reported very low levels, for cookies baked for 15 and 25 minutes, although higher levels of egg were detected by the Veratox kit in raw cookies.
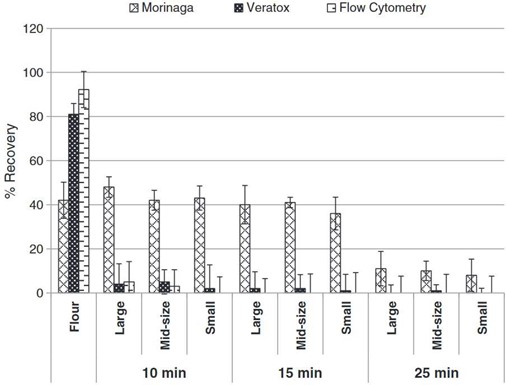
Figure 1. Taken from Gomaa et al. 2013 (Gomaa and Boye 2013). Percentage recoveries of egg in incurred cookie as detected by ELISA and flow cytometry. (Large, mid-size, and small refers to cookie sizes of 10 mm thickness and 38, 58 and 76 mm diameters, respectively; 10, 15, 25 min refers to cookie baked for these different times in an oven at 177 °C).
Two new ELISA kits, the FASTKIT ELISA Ver. II Series (Cosmo Biokit Ltd) and the FASPEK® Allergenic Substances Detection Kit (Morinaga Institute of Biological Sciences) for egg detection were tested in a ten laboratory-wide ring study in work published by Matsuda et al. (Matsuda, Yoshioka et al. 2006). Multiple different ELISA kits using an extraction buffer developed in this work were tested in this study against a variety of matrices, the egg kits were tested in the following with the relative standard deviation (RSD) given as a percentage for each: sausage (4.6%), boiled beef (5.4%), cookie (2.7%), orange juice (2.9%) and strawberry jam (4.7%).
This suggested that the kits were able to detect egg in a range of matrices and with good reproducibility across different labs.
As briefly described above, Otto et al. 2016 reported an immunoassay for the simultaneous detection of milk, egg, peanut, mustard and crustaceans in cookie samples at sub-100 ppm levels (Otto, Lamote et al. 2016). The method was based on a combination of flow cytometry with competitive ELISA where microbeads were used as sorbent surface. Polyclonal antibodies raised to purified casein, the NIST reference standard egg (National Institute of Standards and Technologies, USA), and extracts of crustacean (Panaeus vannamei), peanut (Arachis hypogaea) and mustard (Sinapis alba) were associated with the microbeads. The method was able to detect the presence of the five allergens with median inhibitory concentrations (IC50) ranging from 2.5 to 15 mg/kg according to the allergen to be detected. The lowest concentrations of contaminants inducing a significant difference of signal between non-contaminated controls and test samples were 2 mg/kg of peanut, 5 mg/kg of crustaceans, 5 mg/kg of milk, 5 mg/kg of mustard and 10 mg/kg of egg. The authors reported that the test was sufficiently sensitive to detect peanut and crustaceans at the reference doses established by the VITAL expert panel. Further improvement is needed for mustard, egg, and milk for which the calculated thresholds for a serving of 50 g of cookies are respectively 0.1, 0.6 and 2 ppm. Since the egg used in method development had been irradiated, it may be that the egg epitope had altered due to thermal processing, possibly explaining the reduced sensitivity to egg. Assay sensitivity was influenced by the concentration of primary antibodies added to the sample extract for the competition and by the concentration of allergenic proteins bound to the surface of the microbeads. The anti-casein antibodies cross-reacted with apple (0.7%), the anti-peanut antibodies cross-reacted with turmeric (1%) and the anti-egg antibodies cross-reacted with salmon (0.2%). No cross-reactivity was observed with the anti-crustacea antibodies. The authors stated that flow-cytometry-based immunodetection may, in the near future, improve upon the performances of classic ELISAs by adding a new feature: simultaneous detection/quantification of multiple allergens.
2.4.4.3 Mass Spectrometry
Comparative work was carried out by Heick et al. (including Popping) in 2011 to compare the semi-quantitative capability of 4 ELISA kits with the qualitative capability of an LC-MS/MS method. The ELISA kits again considered the Tepnel Biosystems Biokits Egg Assay and Morinaga Egg Protein ELISA Kit in addition to the R-Biopharm RIDASCREEN FAST Egg Protein, ELISA Systems Egg Residue kit, and a newly developed MS method (Heick, Fischer et al. 2011). The detection capabilities of this novel method were demonstrated by analysing raw and baked bread incurred with seven allergens including egg, with the egg data reported as egg white. Of the four ELISA methods tested, only one could detect egg residues in the processed bread product, although all could detect it in the flour. The levels of egg were significantly underestimated by all kits. The mass spectrometry method, which targeted 4 ovalbumin peptides, did detect egg in the bread, however this was with a signal intensity decreased by 80% when analysing baked bread compared to raw bread. The LC-MS MRM multianalyte method was capable of detecting egg in the processed matrix along with milk, soy, hazelnut, peanut, walnut and almond. The chosen marker peptides were implemented into one method that is capable of the simultaneous detection of milk (casein alpha S1 peptides), egg (ovalbumin peptides), soy (glycinin), hazelnut (11S globulin peptides), peanut (Ara h1 and Ara h3/4 peptides), walnut (Jur r1 peptides) and almond (prunin peptides), incurred in bread material prepared from a standard recipe provided by industry with baking for 60 minutes at 200 °C. The LOD was 42 mg/kg for ‘egg’ incurred’ (no detail was provided as to whether this was whole egg or egg protein) in bread and 0.45mg/L for egg extract spiked into bread, showing the importance of using incurred test materials when determining the suitability of a method to quantitatively determine allergen in real-world samples. The correlation co-efficient for egg detection in incurred bread was 0.9998. Only one ELISA kit (identity of kit anonymised by authors) could detect the allergen in the processed bread. However, all the kits detected egg in the unprocessed matrix, indicating that heat destroys, at least partially, the structures recognized by the kits’ antibodies or that the extractability of the allergens is reduced by processing. This work demonstrates the power of LC-MS compared to the majority of ELISA technologies, although the signal intensity and therefore the LOD is currently lower than for ELISA for LC-MS technologies which is a relative new- comer in the allergen detection field.
As a follow-up to their previous methods, Pilolli et al. (2017) developed an selective reaction monitoring (SRM) LC-MS method using both incurred cookie samples and spiked cookie samples (Pilolli, Chaudhari et al. 2017). The LOD was 9 µg egg allergen (ovalbumin) per gramme of food. By comparing the levels of allergens detected in the incurred samples compared to those for the spike samples, the authors were able to determine the effect of processing on the level of detection of the allergens. Figure 1 clearly shows how the detection is dramatically reduced for each of the 5 allergens under investigation when the samples are processed.
Work by Parker et al. 2015 also developed an LC-MS/MS method for the detection of egg proteins having demonstrated that ELISA Systems’ Egg Residue kit and Neogen’s Biokit are incapable of detecting egg proteins in a baked cereal bar and muffins, the Neogen’s Veratox Egg Allergen Test and R-Biopharm’s RIDASCREEN FAST Egg Protein give recoveries of < 10%. The Morinaga’s Egg Protein ELISA Kit again performed well with the processed foods with recoveries of 76.7% for the cereal bar and 99.6% for the muffin. While not as sensitive as the Morinaga kit (with recoveries of 60.8% and 45.2% respectively) the LC-MS/MS method outperformed the other four commercially available ELISA kits.
Thermally processed egg proteins incurred and spiked in cookies were the subject of an LC-MS/MS method, using a cookie containing whole egg, skimmed milk, soy flour, ground hazelnut and ground peanut to create incurred samples for investigation (Pilolli, De Angelis et al. 2017). The LOD of this newly developed method for egg in incurred cookies was found to be 9 μg g-1 (9 mg/kg) which is higher than for the well-established methods involving ELISA (for which the LOD is typically 0.1-0.3 mg/kg). The authors highlight that the effect of thermal processing was greatest for the egg compared to the other allergens (milk, soy, hazelnut and peanut) with a 97% decrease in sensitivity calculated for incurred samples compared to spiked samples. A matrix- matched calibration curve, prepared using serial dilutions prepared from incurred cookies, yielded a linear correlation coefficient of 0.995. LOD tends to be much lower for ELISA for example between 0.1 and 0.3 mg/kg.
Egg allergens were successfully identified in LC-MS work by Fan et al. on different food types spiked with ovalbumin (Fan, Ma et al. 2023). Ovalbumin was detected by targeting 13 different peptides, with five selected for the purposes of quantitative analysis. Using stable isotope-labelling and LOD for ovalbumin was in the range 17.71–35.43 mg per 100 g with an LOQ of 53.14–70.86 mg per 100 g. The effect of matrices such as a bread and cookies was minor with a range of 82% to 123% while the test was able to detect egg proteins in supermarket products including chocolate pie, vermicelli and Snickers bars. It would be interesting in the future to understand the performance of this method on incurred matrices rather than on matrices spiked with ovalbumin, since heat processing is known to affect the detection of ovalbumin.
Although using the less challenging spiked rather than incurred samples to develop a method to detect egg, Monaci et al. 2014 developed a method using SRM LC-MS for multiallergen measurement for milk, egg and soy, selecting the top 2 performing peptides from a list of 11 (Monaci, Pilolli et al. 2014). LODs were achieved at 0.3 µg ovalbumin per gramme of food.
Gavage et al. 2020 proposed the future development of the application of concatenated peptides for quantitation by multiple reaction monitoring (MRM) mass spectrometry. Concatemers are artificial proteins composed of concatenated, proteotypic peptides originating from different proteins of interest and labelled with stable isotopes. In contrast to the use of labelled synthetic peptides for the same purpose, concatemers need to be proteolytically digested to release their peptides, and thus, this peptide release is also affected by the interference caused by the matrix during the digestion step, in a manner similar to the analyte of interest.
Another advantage of concatemers is their potential for multiplexing. Gavage et al. compared a method applying concatemers to one isotopically labelling proteins on cookies, chocolate, and unbaked lyophilized cookie dough which were screened for egg (ovalbumin, ovotransferrin and vitellogenin-1), milk (αs1-casein and β-LG), peanut (Ara h 1 and Ara h 3), and hazelnut (Cor a 9) allergens. Although the former method gave the superior matrix-matched calibration curves (2.5-50 mg total allergen protein per kg of matrix) with a constant peak area ratio among matrices, the authors highlighted that future development of concatemer methods may be of benefit to food testing capabilities due to the more accurate alignment of the method with the sample extraction protocol.
2.4.4.4 PCR
Eggs are not a suitable material for PCR detection since eggs do not contain significant amounts of DNA for analysis. An entire egg contains only a single copy of DNA in the egg yolk and none in the egg white. Additionally, it is not possible to distinguish the results for chicken’s egg and chicken meat owing to their genetic similarity. Furthermore, it would be completely impossible to identify egg whites using PCR as, although rich in allergenic proteins, they do not contain any genetic material and therefore a false negative result would be obtained if the manufacturer was separating eggs for the recipe, which is a common practice.
2.4.4.5 Conclusions: Egg testing methods
These studies highlight the challenge of creating an ELISA which is sensitive to products containing cooked egg proteins. Firstly, it is essential that the method targets ovomucoid proteins as compared to ovalbumin proteins which can denature with heating (Williams, Westphal et al. 2004). The Morinaga ELISA kit performed well even in comparison to mass spectrometry and Gomaa et al. have speculated that this may be a result of better protein extraction through the use of denaturant and surfactant in the kit buffer (Gomaa and Boye 2013). Perhaps due to issues relating to reliably determining egg levels in processed matrices, LC-MS methodology is relatively advanced for egg allergens compared to for other allergens, with some LC-MS methods challenging the LOD of some of the egg ELISA kits. The availability of two different technologies capable for testing for egg allergen could offer a useful screen (ELISA) and confirmatory test (LC-MS) for this allergen and the differences between the technologies may offer consumers the benefits of allergen detection in a wider range of food types than other allergens for which only one testing technology exists.
2.4.5 Fish
2.4.5.1 Introduction
The major allergens in fish are parvalbumins which are calcium-binding proteins found in fish muscle, of which twelve different allergens have been identified. The prevalence of sensitivity to fish was found to be the lowest among 24 foods tested with just 0.2% of subjects showing signs of IgE mediated sensitivity. (Burney et al. 2010) Methods for the detection of fish allergens are often limited due to the wide variation of fish species. It is important to note that this review will not address allergic reactions to the fish parasite Anisakis simplex or scombroid poisoning (which can result from the improper storage of fish), but instead focus on IgE-mediate food allergies exclusively. (EFSA, 2014)
2.4.5.2
2.4.5.3 ELISA
The cross-reactivity of different parvalbumins was studied by Sharp et al. and immunochemistry methods were developed when antibodies were raised against parvalbumins from four different species of fish (barramundi, basa, pilchard and Atlantic salmon) (Sharp, Stephen et al. 2015). The greatest cross-reactivity was seen for barramundi parvalbumin antibodies with 87.5% of the 40 fish species analysed giving positive responses, however mahi mahi, swordfish and yellow tuna tested negative for each set of parvalbumin antibodies. This illustrates the challenge of creating an ELISA sensitive to all fish parvalbumins. The study additionally highlighted the reduced binding of allergens following thermal processing, a common challenge in allergen ELISA technology.
Three commercial fish ELISA kits were the subject of a study by Ruethers et al.: AgraQuant Fish ELISA kit from Romer Labs (UK, Austria) and Common Bone Fish Antigen EIA ELISA kit, versions 2 and 3 from XEMA (Russia) (Ruethers, Taki et al. 2020). For each ELISA, cod is the reference fish species, although the AgraQuant kit uses antibodies against parvalbumin, while the Common Bone Fish Antigen EIA kits use monoclonal antibodies against a protein of the muscular tropomyosin complex.
The results for each kit were not individually disclosed by the authors, but rather anonymised. Of 57 bony fish the detection rates of raw and heated ranged from 26% to 61%; for canned bony fish products the detection rate was 65% to 86%; and no cartilaginous fish detected. These results demonstrate the challenge still remaining within the food industry with the safety of fish products.
2.4.5.4 PCR
While research methods under development are mentioned in the literature (Kuehn, Hilger et al. 2017, Daga, Cau et al. 2018, Cau, Daga et al. 2022) and PCR methods are available for the species identification of fish in food, commercial manuscripts detailing commercial PCR kits for the purpose of fish allergen detection were not found in this review.
However, research behind the development of fish testing methods was reviewed by Dong and Raghavan, 2022. Processing methods such as application of heat and pressure to fish generally increases allergenicity, although there are examples where allergenicity increases with processing (for example, Sletten et al. 2010, Nugraha et al. 2021). While ELISA methods for fish detection tend to suffer reduced sensitivity with processing due to changes in protein biochemistry and stability (as reviewed by Dong and Raghavan, 2022), PCR methods tend show a more stable performance, especially in thermal treatments, since the DNA target is more robust in uncooked and cooked fish compared to the target proteins. PCR inhibitors can also be removed prior to analysis to improve the performance of PCR assays. For example, a real-time PCR method was used to detect cod and pollock with detection limits of 1-10 mg/kg. However, this work was not linked to commercial test kits, but rather research and development.
2.4.5.5 Mass spectrometry
Numerous fish allergens including parvalbumin, enolase, aldolase and vitellogenin have been reported (Kuehn, Swoboda et al. 2014) and parvalbumins beta (β-PVs) are identified as the major allergens. β-PVs are calcium-binding globular muscle protein consisting of two alpha helixes, having a molecular mass of 10–12 kDa and an acidic isoelectric point (pI) (3–5). Due to this structure, especially the Ca2+ binding site, β-PVs are resistant to tryptic digestion and heat treatment (Swoboda, Bugajska- Schretter et al. 2002).
Sun et al. 2019 developed an LC-MS MRM method to quantify β-PV in flounder (Paralichthys olivaceus), based on the detection of three peptides (Sun, Xu et al. 2019). Quantitative determination was based on one of these three peptides, that which provided the greatest sensitivity. The method was validated within the guidelines of European Medicines Agency (ICH Q2(R2)). Incurred matrices were prepared from the following species, each containing 10% flounder muscle: turbot (Scophthalmus maximus), brown-marbled grouper (Epinephelus fuscoguttatus), small yellow croaker (Pseudosciaena polyactis) and silver carp (Hypophthalmichthys molitrix), pork, shrimp, chicken muscle and beef. To validate the method, incurred matrices were prepared by the addition of 1.0 g of the minced muscle of flounder to
9.0 g non-contaminated minced matrices with homogenization. Validation studies showed having a linear range from 0.10 to 1179.36 nM with r > 0.999. The parvalbumin beta in flounder (Paralichthys olivaceus) has been quantified at a low level down to 0.10 µg/g with satisfactory precision (RSD < 18.35%) and accuracy (<13.3%). The new approach was successfully applied for the determination of parvalbumin beta in the other fish matrices. This method shows great promise to detect fish allergen in flounder and it would be interesting to understand how this method would perform on a much wider variety of fish consumed in the UK.
In a study aimed at determining fish species, work by Mazzeo et al. 2008 involved development of a method using matrix-assisted laser desorption/ionization-time of flight (MALDI-ToF) mass spectrometry, targeting species-specific peptides from 25 fish species (Mazzeo, De Giulio et al. 2008). Many of these peptides originated from parvalbumin, permitting the method to determine not only species, but also fish allergen proteins from cod (Gadus morhua), Merliccius genus, Trisopterus minutus, Sparus auratus and Evynnis japonica. Being an inherently multiplex method, MALDI- ToF lends itself well to identification of an allergen for which there are many different species and therefore different sequences for the allergenic protein. Another benefit of this method is, unlike for methods targeting one allergen sequence such as some ELISA methods, no prior knowledge of the species is required to confirm presence. It would be interesting to learn how this method would perform on cooked samples rather than the raw samples used, and whether more fish allergens can be determined by MALDI-ToF.
Similar to the above study, and using LC-MS with SRM and targeting parvalbumin beta, 12 β-PV biomarker peptides relating to fish species, along with five peptides which are shared with other organisms such as frogs, monotremes, lizards and birds, plus two peptides used for QC purposes (relating to poultry and frog species) were selected which represent 163 β-parvalbumin sequences (Carrera, Canas et al. 2012). The method was also applied to six thermally processed commercial fish products to challenge the heat-resistant properties of the allergen sequences. Using a heat-treated extraction method at 70 °C and ultrafast protein digestion using ultrasound, the entire method was reported to require only two hours which is a great benefit for an LC-MS method to test for allergens belonging to several fish species.
2.4.5.6 Conclusions – Fish testing methods
While it is evident, both from this review and the evidence in Table 1 (Appendix 1), that there is challenge with the more traditional methods of allergen detection in fish including ELISA, much progress is being made in mass spectrometry. Multiplex methods, using thermal-stable proteins, are under development and validation and it will be interesting to understand the scope of these methods in relation to the wide range of fish species commonly consumed in the UK.
2.4.6 Lupin (also known as lupine)
2.4.6.1 Introduction
Lupin (genus Lupinus) belongs to the Leguminosae family, and it can cause allergic reaction in susceptible individuals. Allergy to lupin is often reported in patients with allergy to other legumes, mainly peanut. Lupins contain seed storage proteins, including β-Conglutin which is considered the major lupin allergen, the structure of this is homologous to other major allergens Ara h 1 in peanut and soy β-conglycinin. (EFSA, 2014) The use of lupin, in particular lupin flour, in food products has vastly increased over the last decade and numerous analytical tests have been developed, some of which are commercially available.
2.4.6.2 ELISA
Koeberl et al. (Koeberl, Sharp et al. 2018) studied the ability of three commercial kits to detect three common species of lupin as well as their cross-reactivity to other species. Lupin residue detection kit (ELISA Systems®, Australia); RIDASCREEN® fast lupine (R-Biopharm®, Germany) and AgraQuant® lupine (Romer Labs®, Austria) were used but performance results were anonymised. The calculated lupin concentration for all samples tested varied for the different test kits, and the authors suggest that more comparable analytical methods and CRMs are needed. The study revealed that the levels of cross-reactivity to related legumes also differed across kits and did not necessarily match the clinical cross-reactivity, which the authors highlighted as an area where further research is required.
The ELISA tests NutriLinia Lupine-E (NC-6003/96, Nutricor s.r.o., Slovakia), RIDASCREEN®- FAST Lupine (R- Biopharm, Darmstadt, Germany) and Veratox Lupine (Neogen, Ayr, UK), were used by Röder et al. (Röder, Kleiner et al. 2013) in a study aiming to investigate the detectability of lupin from different cultivars. The authors reported extraordinarily large relative differences in quantitative response between cultivars of 390% - 5050%. The recovery of ‘lupin protein’ (information provided was limited other than this included γ-conglutin) varied extensively depending on the cultivar and across ELISA test kits, one showing particularly low recoveries with 11 out of 14 cultivars tested. This is highlighted in the paper as a limitation that may preclude accurate quantification, in particular when the inter- cultivar response is high and if the detected cultivar is unknown or RM is unavailable. The authors suggest that there is a need to generate data about the quantitative responses of methods to different cultivars, not only of lupin, but also other allergenic foods.
2.4.6.3 Mass Spectrometry
An LC-MS/MS method was reported by Mattarozzi et al. for the reliable identification and quantification of lupin major allergens (conglutinins) in pasta and biscuits (Mattarozzi, Bignardi et al. 2012). They established an LOD of around 2 ppm. The method was validated, obtaining good precision (both inter- and intra-day variability), relative standard deviation lower than 23% and recoveries of 95 ± 10 to 118 ± 12% and 103 ± 1 to 110 ± 12% for biscuits and pasta, respectively. The applicability of the method was tested successfully on market samples with lupine declared in the ingredients or on a precautionary label.
Huschek et al. developed a targeted LC-MS/MS method for the simultaneous analysis of soy, sesame and lupin using isotope-labelled peptides (Huschek, Bonick et al. 2016). The method included three peptides from the β-conglutin protein in white lupin. The performance of the method was evaluated by analysing six replicates of each sample, namely wheat flour, cookies and bread incurred with the allergenic foods. The LOQ achieved for lupin in food was 20 ppm (wheat flour), 10 ppm (cookie) and 50 ppm (bread) and the recovery rates were 113%, 91% and 72%, compared to 0.32 ppm lupin protein for current ELISA methods. The method is described as accredited with regards to DIN EN ISO/IEC 17025.
Another HPLC-MS/MS method was developed by Hoffmann et al. for the simultaneous screening of lupin, pea and soy proteins (Hoffmann, Munch et al. 2017). Four marker peptides were used for determination of lupin, with an LOD of 2 ppm when prepared in meat products. The authors reported that this sensitivity is comparable to that shown by commonly PCR and ELISA techniques and that it is significantly below the reference dose for lupin established by the VITAL Expert panel (50 mg if 100 g portion is consumed) (Taylor, Baumert et al. 2014).
2.4.6.4 Conclusions – lupin testing methods
A crucial challenge in lupin detection is that of cross reactivity with homologous legume proteins and as such the specificity of ELISA testing kits needs to be evaluated to ensure consistent reporting. Additionally the effect of changing cultivars is demonstrated to have a considerable impact quantitative response and this is certainly an area for future research. Mass spectrometry offers a promising alternative with comparable sensitivity to ELISA methods and good reproducibility.
2.4.7 Milk
2.4.7.1 Introduction
Although it is a common component of diets across the world, the protein content of milk can trigger an Ig-E mediated immunological reaction in affected individuals. The prevalence of milk allergies varies across ages, population and studies, but the self- reported prevalence in the UK was 2.7% in a 1994 study. (Young et al., 1994) Cow’s milk allergies can arise from multiple different proteins, caseins, alpha-lactalbumin (ALA), beta-lactoglobulin (β-LG), bovine serum albumin (BSA), immunoglobulin and lactoferrin.
2.4.7.2 ELISA and immunochemistry methods
The first available literature detailing the development of three ELISA kits for detecting casein, beta-lactoglobulin and ‘milk’ (“FASTKIT”) (Cosmo Bio Ltd, Japan) was published in 2004 by Akiyama et al. (Akiyama, Isuzugawa et al. 2004). Although this work is only published in Japanese, the abstract details that the LOD for each kit is 1 ng mL-1-, although and that each kit was used on a variety of matrices including sausage, sauce, cookie, cereal and pasta sauce, with a mean recovery over 40%. Although it must be noted that the method used to establish the LOD is not declared so it cannot be determined if this in matrix or a buffer solution.
A second generation of these kits was presented as the FASTKIT ELISA Ver II and the FASPEK® Allergenic Substances Detection Kit in work by Matsuda in 2006 (Matsuda, Yoshioka et al. 2006). The series of ELISA kits target egg, milk, wheat, buckwheat and peanut and the milk kit was tested by spiking into the following test materials: sausage, boiled beef, cookies, orange juice and strawberry jam. The mean recoveries, from a ring trail of ten laboratories, for all test materials were >50% which is low (ideally this would be 70-120% to meet AOAC guidelines), however the recoveries of milk proteins in cookies for the FASTKIT were only slightly under this level. The authors report cross-reactivity for both milk kits with both goat and sheep milk.
The effect of thermal processing on the detection of milk proteins using ELISA kits was investigated by Downs and Taylor in 2010. (Downs and Taylor 2010) This work was published in 2010 and while it uses three commercial ELISA kits which are still on the market, these kits are developed constantly, and results presented in this work may not represent current sensitivity. The kits used were Neogen Veratox Total Milk (Lansing, MI), ELISA Systems β-LG, and ELISA Systems casein (Windsor, Queensland, Australia). In this work, spiked dough was cooked by boiling (100 °C), baking (190 °C) frying (190 °C) and retorting (121 °C). Using the β-LG kit, poor recoveries of 2-10% were yielded for all processed samples. For the casein and total milk (casein and whey protein) kits, only boiled samples gave recoveries greater than 50%. These decreases in recovery with thermal processing are dramatic and the authors highlight the dangers to the food industry of these under-estimations of milk content.
ELISA kits for casein detection, namely R-Biopharm RIDASCREEN (R-Biopharm AG, Darmstadt, Germany) and the Neogen Veratox (Neogen Corp., Lansing, MI), were studied alongside flow cytometry for casein, egg, gluten, and soy sensitivity in baked cookies (Gomaa and Boye 2013). This work was published in 2013 and while it uses commercial ELISA kits which are still on the market, these kits are developed constantly, and results presented in this work may not represent current sensitivity. For unbaked cookies, recovery for all three methods was ≥90%. Recovery decreased with decreasing cookie size and increased baking time with the recovery range for Ridascreen 89-35%, for Veratox 77-21% and the flow cytometry 75-19%. These results are in line with those observed by Downs and Taylor, indicating that while a positive response was always obtained for the samples, testing methods can struggle to detect casein following thermal processing (Downs and Taylor 2010).
In a major cross-laboratory study of ELISA detection of egg and milk allergens reported in 2014, five casein analysis kits, four kits which targeted beta-lactoglobulin (β-LG) and one kit which determined total milk were compared (Johnson, Rigby et al. 2014). These kits were ELISA Systems casein ESCASPRD-48 (Windsor, Queensland, Australia); Neogen 8460 Veratox casein (Lansing, MI); Morinaga Casein 10152 (Yokohama, Japan); R-Biopharm RIDASCREEN FAST casein kit R4612 (Darmstadt, Germany); Romer AgraQuant casein COKAL1200 (Cheshire, UK), ELISA systems β-LG ESMRDBLG-48 (Windsor, Queensland, Australia); Neogen 8470- Veratox for total milk (Lansing, MI); Morinaga beta-lactoglobulin 10172 (Yokohama, Japan); R-Biopharm RIDASCREEN FAST beta-lactoglobulin kit R4902 (Darmstadt, Germany); Romer AgraQuant Beta-lactoglobulin assay COKAL1048 (Cheshire, UK); Zeu ZE/PR/LS: proteon beta-lactoglobulin (Zaragoza, Spain). The matrix was dessert mix spiked with allergen in the form of skimmed milk powder, spiked at 3, 6, 15 and 30 mg/kg. For the trial, the data for all kits were anonymised. All kits were used to detect the lowest level of milk protein, 3 mg/kg, however all kits under-reported the level of skimmed milk powder (except one which consistently over-estimated milk levels). The aim of this work was to generate a
naturally incurred QC material for food allergen analysis and authors recognise that a more robust material may be required that can challenge detection following processing procedures such as heat, pressure and pH changes which can alter protein binding.
Studying both ELISA and LC-MS/MS methods, Parker et al. produced industry- processed model foods incurred with egg, milk and peanut allergens (Parker, Khuda et al. 2015). The ELISAs used in this work were Morinaga Milk (Yokohama, Japan); Neogen Veratox Milk (Lansing, MI, USA); and R-Biopharm RIDASCREEN FAST Milk (Darmstadt, Germany). These kits were compared in 2015 and their composition may be different to those commercially available currently. When tested against an unprocessed cereal bar sample, both Morinaga and Neogen kits slightly underestimated the milk content, while the R-Biopharm overestimated. Recovery levels for all kits were all higher for a muffin matrix. Baking the samples resulted in reduced recoveries, this was more pronounced for the Neogen kit with a recovery of 17.3% for the muffin final product, compared to 93.8% for the Morinaga product. A crucial difference between the kits is the detection of casein (the Morinaga kit) or casein and β-LG (R-biopharm) compared to total milk protein (Neogen). In milk, the proteins with the greatest heat stability are casein and serum albumin and consequently kits which target these proteins rather than whey proteins demonstrate better detection of thermally processed milk (Nowak-Wegrzyn and Fiocchi 2009). The mass spectrometry method targeted an alphaS1-casein and a β-LG peptide marker for quantitation with secondary peptides used for confirmation. Stable isotope-labelled reference peptides were used for confirmation and concentration calculations and the recoveries of milk from both unprocessed and thermally processed products were >50%. The comparison of methods suggest that the target protein is crucial to method development with casein being less impacted by thermal processing in comparison to the total milk protein content. Additionally, the mass spectrometry method shows less variance between the cereal bar and muffin matrices and consequently may be more tolerant to a range of matrices, although there is not enough evidence in this paper to conclude this.
The use of ELISA kits for the detection of milk in cheese was investigated by Ivens et al. (Ivens, Baumert et al. 2017(1), Ivens, Baumert et al. 2017(2)). At the time of publication (2017) commercial ELISA kits were not validated for the detection of milk residues in hydrolysed or fermented food products. The ELISA kits used in this kit were Neogen Veratox Total Milk and Casein ELISA (Neogen Corp., Lansing, Mich., U.S.A.) ELISA Systems™ Casein kits from ELISA Systems (Windsor, Queensland, Australia). R-Biopharm RIDASCREEN Fast Casein kits (Darmstadt, Germany), the kits tested were commercially available at the time of publication, but their composition and sensitivity may have changed in the interim. During cheese production the whey, which contains the proteins α-lactalbumin and β-lactoglobulin, is separated so the key allergens of milk are the caseins, of which alpha, beta and kappa are considered major allergens. Therefore, to provide meaningful insight into the allergenicity of cheese, the ELISA kit must detect casein. In this work, the R- Biopharm and Neogen Veratox Total Milk kits primarily detected kappa-casein, while the ELISA Systems Casein kit detected only alpha-casein and the Neogen Veratox Casein Kit detected alpha and beta casein. Of the cheeses studied (Mozzarella, Swiss, Blue, Limburger and Brie) the blue cheese was the hardest to detect with all alpha- and beta-casein hydrolysed and milk was only detected in this matrix using the Neogen Casein and Total Milk kits. The authors suggest that while milk residues are detectable in cheese by ELISA kits, it would be important to select the right kit for the level of proteolysis the milk has undergone and they stress that it is possible that there are fragments of proteolysed casein in processed milk which may not be detectable by modern ELISA kits.
Otto et al. 2016 reported an immunoassay using flow cytometry for the detection of milk based on polyclonal antibodies raised to purified casein (Otto, Lamote et al. 2016). The lowest concentrations of contaminants inducing a significant difference of signal between non-contaminated controls and milk test samples was 5 mg/kg of milk and therefore an improvement in the method is required to meet the VITAL threshold of 2 ppm (Taylor, Baumert et al. 2014). The alpha-casein antibodies cross- reacted with apple (0.7). It would be interesting to learn the results of a full validation of this method.
The development of a CRM for milk detection was part of work from the JRC in Geel. It was their aim to improve the harmonisation of reported milk levels, following observations that in a ring trial detecting total cow’s milk protein in baked cookies reported levels were significantly varied. (Cordeiro et al., 2021) A reference method was created to characterise a reference material in work from Martinez-Esteso et al. and given an indicative value from this method. (Martinez-Esteso et al., 2020) In this work the quantity is expressed as “mass of total allergen protein per mass of food” and SI traceability is used to allow comparison between results, this was established by Breidbach et al. (Breidbach et al., 2022) In a ring trail of 23 EU laboratories using principally ELISA methods of detection, a large scatter of results was reported, even where the same ELISA kit was used. (Cordeiro et al., 2021) This suggests that the instructions provided with ELISA kits need to provide more unambiguous instructions. An additional point was raised by the authors that several labs reported using the standard reference material NIST 1549a, a whole milk powder which is supplied with only a “informative (non-certified) protein value”. As it was not intended for allergen detection, it is not suitable for use to calibrate or validate a method for total cow’s milk protein, highlighting the importance of appropriate CRMs.
2.4.7.3 PCR
Currently there are no available commercial kits for the detection of milk allergens. This may be in part due to the fact that there is no difference between the DNA found in milk products and bovine tissues and therefore no test could provide confidence that milk allergens are present.
2.4.7.4 Mass Spectrometry
The aim of Christina et al. in their work on LC-MS/MS detection of milk in baked food products was to create a robust method as a confirmatory technique alongside the use of ELISA kits (Cristina, Elena et al. 2016). The target peptides were selected from the alphaS1 casein protein and the method was validated with baked incurred cookies with powdered milk (SRM-1549). An LOD of 1.3 mg kg-1 and LOQ of 4 mg kg-1 was established, which is not as sensitive as ELISA technology and recoveries varied from 20-26%.
As a follow-up to their previous methods, Pilolli et al. (2017) developed an SRM multiplex LC-MS method using both incurred cookie samples and spiked cookie samples (Pilolli, De Angelis et al. 2017). The LOD was 7 µg milk allergen(alpha-1 casein) per gramme of food. By comparing the levels of allergens detected in the incurred samples compared to those for the spike samples, the authors were able to determine the effect of processing on the level of detection of the allergens. Figure 1 clearly shows how the detection is dramatically reduced for each of the five allergens under investigation when the samples are processed.
In work comparing the effectiveness of ELISA kits against an MS method for milk detection, Heick et al. identified a milk peptide which could be detected in both flour and baked bread products with the recovery of milk 45% of that in bread compared to the unprocessed flour (Heick, Fischer et al. 2011). For the two ELISA kits investigated R-Biopharm RIDASCREEN FAST Casein (Darmstadt, Germany) and Neogen Tepnel Biokits Casein Assay (Lansing, MI) (which were anonymised in the study), the responses were significantly lower with one kit unable to detect any milk in the processed product and the other with a recovery of 17%. It is important to note that while these are commercially available kits their contents may have changed since these tests were performed. In this work, development of a LC-MS MRM multianalyte method was also reported, for which the LOD for milk, based on detection of casein alpha S1 peptides, was 5 µg/g in incurred bread with a correlation coefficient of 0.8985.
In a method targeting milk (alongside egg, soy, hazelnut and peanut), Pilolli et al. determined a LOD of 7 mg kg-1 using spiked cookie dough as a matrix, however this sensitivity dropped by 80% when the cookie dough was baked, again highlighting the challenges of different matrices and incurred allergen detection (Pilolli, De Angelis et al. 2017).
Peptide markers for both alphaS1-casein and β-LG were identified for mass spectrometer analysis by Bianco et al. to monitor both casein and whey fractions of milk (Bianco, Calvano et al. 2022). With good recovery and precision reported, the method was used to detect levels of milk protein, casein, in meat products which were labelled as milk-free at levels 10-fold higher than the action level of these allergens. Although using spiked rather than incurred samples, Monaci et al. 2014 applied an SRM method to determine milk, capable of detecting 0.1 µg alpha-S1 casein (Monaci, Pilolli et al. 2014).
As described above, Gavage et al. highlighted that future development of concatemer MRM mass spectrometry methods may be of benefit to food testing capabilities due to the more accurate alignment of the method with the sample extraction protocol and their initial work involved egg, milk, peanut and hazelnut allergens.
2.4.7.5 Conclusions – Milk testing methods
Modern research is highlighting the challenge in detecting milk proteins in food products with the selection of target allergenic proteins crucial to method development. The effect of thermal processing is greater on proteins such as β-LG, compared to casein, and therefore the method which is most appropriate will vary based on the matrix of the samples. This is particularly appropriate for the detection of cheese as, during the cheesemaking process, the whey is removed and so a kit which targets β-LG would not be appropriate for this application. Improvements regarding recovery levels are required if ELISA kits continue to be applied to determine milk levels in foods, particularly in processed foods. There are clear examples where the use of multiple ELISA kits, or the use of ELISA with LC-MS as a confirmatory test when ELISA data is negative, reaps rewards in the detection of milk allergens. It seems that future development is required to improve the sensitivity of LC-MS methods to detect allergens near the action levels and more data regarding the variance of LC-MS data for a wider range of matrices would be beneficial in determining the suitability of this methodology.
2.4.8 Molluscs
2.4.8.1 Introduction
The animal group ‘shellfish’ comprises two invertebrate phyla; arthropods and molluscs. Although all shellfish are invertebrate animals, these two groups are very distinct in evolutionary terms and subsequently contain different molecular repertoires of allergenic proteins. Co-sensitisation of patients with crustacean and mollusc allergy is often described, however. Sensitising to molluscs and crustaceans can occur due to inhalation of house-dust mite, with paramyosin being the cross- reactive allergen (Yu, Ding et al. 2022). Consequently, mollusc allergy is clinically under-reported and allergens are ill-defined.
2.4.8.2 ELISA and immunochemistry methods
In a 2018 clinical study by Rolland et al., allergens of four frequently ingested Asia- Pacific molluscs were characterized: Sydney rock oyster (Saccostrea glomerata), blue mussel (Mytilus edulis), saucer scallop (Amusium balloti), and southern calamari (Sepioteuthis australis) (Rolland, Varese et al. 2018). Examining cross- reactivity between species and with blue swimmer crab tropomyosin, Por p 1. Unlike for detection of many other allergens, in clinical studies, patient serum IgE antibody studies showed that cooking increased IgE reactivity of mollusc extracts, suggesting that any testing methods developed with these antibodies would apply well to cooked molluscs. Immunoblotting and mass spectrometry analysis identified the allergenic proteins, including one corresponding to heat-stable tropomyosin in all species (37- 40 kDa). IgE-reactive Sydney rock oyster proteins were identified by mass spectrometry, and the novel major oyster tropomyosin allergen was cloned, sequenced, and designated Sac g 1. Oyster extracts showed highest IgE cross- reactivity with other molluscs, while mussel cross-reactivity was weakest. Inhibition immunoblotting demonstrated high cross-reactivity between tropomyosins of mollusc and crustacean species. While this work did not implement testing methods used in food analysis, the method demonstrates the potential to raise antibodies to support development of ELISA tests to screen for heat-stable mollusc allergens.
Kamath et al. 2013 also reported increased recognition of multiple tropomyosin monoclonal antibodies upon heating of shellfish (Kamath, Rahman et al. 2013). These authors also reported cross-reactivity of tropomyosin in all 11 crustacean species, with partial detection in molluscs (cross-reacting with mussels, scallops and snails but not in oyster, octopus and squid). The authors conclude that specific monoclonal antibodies, targeting the N-terminal region of tropomyosin, must be developed to differentiate tropomyosins in crustaceans and molluscs.
2.4.8.3 PCR
Suh et al. 2020 reported a multiplex PCR method for the detection of amplicons of tropomyosin genes for each of oyster (Crassostrea gigas), mussel (Mytilus edulis), abalone (Haliotis discus hannai) and clam (Ruditapes philippinarum ) against a reference set of eight seafood types in total plus eukaryote tropomyosin, with a detection limit of 16 pg of target DNA and was successfully applied to the detection of tropomyosin in 19 processed seafood products in the Republic of Korea including raw, frozen and dried seafood as well as seasoned, porridge and canned seafood products (Suh, Kim et al. 2020). No cross-reactivity was found.
2.4.8.4 Conclusion – Molluscs testing methods
As shown in Table 1 (Appendix 1), methods to detect molluscs by ELISA and PCR techniques are commercially available. No further available methods, or suitable mass spectrometry methods under development, were identified. This reveals a lack of research in this area and a lack of method comparisons to determine method suitability.
2.4.9 Mustard
2.4.9.1 Introduction
Mustard is an edible plant which belongs to the Brassicaceae family, with its seeds commonly used both in cuisine and processed foods, with different seeds combined to make different regional varieties of mustard powder. The most common seeds are white/yellow (Sinapis alba L.), black (Brassica nigra L.) and brown/oriental mustard (Brassica juncea L.). The prevalence of sensitisation can be varied, across reports levels were as low as1% to as high as 28% in children in France. (Moneret-Vautrin D et al., 1983; Rancé F et al., 1999) The characterised allergens are seed storage proteins, in white/yellow mustard (Sinapis alba L.) these are Sin a 1-4 and in brown/oriental mustard (Brassica juncea L.) the allergen Bra j 1 is found. (EFSA, 2014)
2.4.9.2 ELISA, immunochemistry and PCR methods
No peer-reviewed data regarding testing methods used by participants in Fapas® proficiency testing rounds were identified. The performance of two ELISA tests, Mustard ELISA Kit-specific and Mustard ELISA Kit-total (SEDIUM R&D, Pardubice- Nemosice, Czech Republic) was investigated by Palle-Reisch et al. (Palle-Reisch, Hochegger et al. 2015) and compared with real-time PCR methods for the analysis of mustard in two sets of model sausages, both raw and cooked at 75–78 °C for 15 min in a water bath. The sausages in set 1 contained 1 ppm of each white and black mustard and set 2 contained 1 ppm of each white and brown mustard. Applicability to commercial samples was studied by analysing 15 food products.
The Mustard ELISA Kit-total, intended for the quantitative determination of white, black and brown mustard, allowed the detection of mustard in raw and brewed model sausages down to 2 ppm. The LOQ was determined to be 10 ppm mustard in set 1, corresponding to a mustard protein concentration of 2.4 ppm. In raw and brewed model sausages of set 2, the LOQ was found to be 2 ppm mustard, corresponding to 0.5 ppm mustard protein. In raw sausages, the recovery ranged from 93.2% to
113.1% (set 1) and from 104.3% to 129.0% (set 2). In brewed sausages, recovery was in the range from 71.7% to 83.3% (set 1) and 113.0% to 170.8% (set 2).
The Mustard ELISA Kit-specific, targeted for the quantitative determination of white mustard, detected and quantify white mustard down 1 ppm, which corresponds to a white mustard protein concentration of 0.27 ppm (in the presence of 1 ppm black or brown mustard) in both raw and brewed sausages. In general, the Mustard ELISA Kit-specific resulted in recoveries between 46.1% and 70.4% in raw and between 43.1% and 84.3% in brewed sausages.
The analysis of commercial samples carried out by Palle-Reisch et al. showed discrepancy between the levels that the two kits could detect or quantify in a few of the samples, although there was agreement in most cases (Palle-Reisch, Hochegger et al. 2015). However, the sample number was small and the mustard content was very low, with only two products presenting quantifiable levels for only one of the kits (Kit-total). Overall, there was good correlation between ELISA and PCR results, although the ELISA kits demonstrated higher sensitivity than real-time PCR.
Luber at al 2015 reported the development of a tetraplex real-time PCR method for soybean, celery and brown and white mustard. The approach was validated with DNA extracted from lysate mixtures of boiled sausage. The parameters recovery, repeatability and robustness were evaluated and the limits of quantification of brown and white mustard were 2.6 mg/kg and 36.8 mg/kg respectively.
As detailed previously, Otto et al., 2016 reported an immunoassay for the five analytes, including mustard, based on a combination of flow cytometry with competitive ELISA where microbeads were used as sorbent surface (Otto, Lamote et al. 2016). The polyclonal antibodies used to detect mustard were raised against Sinapis alba. The lowest concentrations of mustard detectable was 5 mg/kg which is a great deal higher than the 0.1 ppm VITAL threshold (Taylor, Baumert et al. 2014). The mustard antibodies cross-reacted with rapeseed, Brassica napus (100%) but unexpectedly did not cross-react with turnip oil (Brassica rapa). Cross-reactivities between members of the Brassica genus (B. napus, B. rapa, Brassica oleracea, B.nigra, B. juncea and S. alba) have been reported in the past due to genetic homology. The authors stated that flow-cytometry-based immunodetection may, in the near future, improve upon the performances of classic ELISAs by adding a new feature: simultaneous detection/quantification of multiple allergens.
2.4.9.3 Mass spectrometry
An LC-MS/MS method for analysis of mustard in food was published by Posada- Ayala et al. in 2015 (Posada-Ayala, Alvarez-Llamas et al. 2015). The method targets the storage protein Sin a 1, one of the major allergenic proteins in yellow mustard seed, and it is based on selected reaction monitoring (SRM) of five marker peptides. Three of these peptides and their transitions showed good reproducibility and suitability for allergen quantification. The authors determined an LOD of 0.25 ppm and an LOQ of 0.75 ppm. Method applicability was tested in seven different commercial food products, where Sin a 1 was quantified at 19±3 mg/kg of food.
2.4.9.4 Conclusions – Mustard testing methods
Information relating to methods used in Fapas® proficiency testing rounds was limited (mustard is a relatively recent addition to the proficiency testing programme). The scope and size of studies described by the authors above was also limited.
Further information is required to determine the suitability of tests to determine the various mustard species. It is crucial to ensure that methods do not give false positive results, as was recently the case for the seeming detection of mustard in wheat, which was subsequently determined to be Sinapis arvensis or rapeseed (Remington et al., 2022).
2.4.10 Peanut
2.4.10.1 Introduction
Despite its name, peanut (Arachis hypogea) is a legume rather than a tree nut and is a common cause of allergy in the UK. The legume family, which also includes pea, bean, soybean, lupin, lentil and fenugreek. The prevalence of peanut allergy has been reported at as high as 15% of self reported individuals or as low as 0% among 18-month old children in Iceland (Touraine, 2002; Kristjansson, 1999). Peanut proteins, even in very small quantities, in the range of mg/kg, can cause extremely severe allergic reactions in individuals and therefore the detection of residues has been a major focus of the scientific community. Peanut is typically considered to be one of the most common Ig-E mediated allergies. Peanuts are high in protein content (23-27% by weight) and contain 50 different proteins, of these 13 have been characterised as causing Ig-E mediated responses in allergic individuals called Ara h 1-13. Of these Ara h 1, Ara h 2 and Ara h 3 are considered the major peanut allergens, however regional variations in populations mean that whilst these are the most common sensitisers in the USA, in Spain Ara h 9 and in Sweden Ara h 8 are more common triggers for sensitised patients. (EFSA, 2014) Methodologies described in the literature for the detection of peanut in food are described herein.
2.4.10.2 ELISA
Processing of foods can have a detrimental effect on the detection of peanut and extraction protocols may benefit from optimisation (Khuda, Jackson et al. 2015). The RIDASCREEN Fast Peanut ELISA (R-Biopharm AG, Darmstadt, Germany) was evaluated under the AOAC Research Institute to gain the Performance Tested Method Status in 2003 (Immer, Reck et al. 2004). Across a range of matrices, including chocolate and ice cream, recovery averaged 97%, with an LOD of 1.5 ppm and an LOQ of 2.5 ppm. Additionally, no cross reactivity was found against 34 substances. By using the AOAC evaluation programme different ELISAs can be more easily compared against each other and any gaps in their capabilities can be more easily identified.
Almost twenty years later the RIDASCREEN Peanut ELISA (R-Biopharm AG, Darmstadt, Germany) was evaluated against the AOAC Standard Method Performance Requirement 2017.020, a more comprehensive test build upon the VITAL methodology which applies real-world eliciting dose values to testing. (Lacorn, Dubois et al. 2022a) tested against 91 substances, no cross-reactivity of the ELISA kit was found, the LOD was estimated to be 0.45 mg kg-1 and an LOQ of 0.75 mg kg- 1 of ‘total peanut’ was determined with mean recoveries for incurred cookies and milk chocolate in an independent laboratory between 99 and 104%. Comparing these two reports demonstrates both the increased sensitivity of these kits but also the increased stringency of the accreditation with more substances evaluated for cross contamination, the use of incurred samples as matrices and increased focus on repeatability.
The National Institute of Standards and Technology (NIST) have a large portfolio of Standard Reference Material (SRM) which is used across all scientific measurement services. In terms of SRMs suitable to support allergen testing services, the NIST SRM 2387, peanut butter, was used to evaluate the performance of Veratox for Peanut Allergen Test (Neogen Corp., Lansing, MI), Ridascreen Peanut (R-Biopharm AG, Darmstadt, Germany), and Bio-Kit Peanut Protein Assay Kit (Tepnel, Neogen Corp., Lansing, MI) (this work was published in 2004 so if these kits are still available on the market they may contain different components) (Trucksess, Brewer et al.
2004). The RM was used in a suspension and recoveries varied from 94-107% for the Veratox kit, from 55-60% for the Ridascreen kit and from 86-94% for the BioKit. When the Veratox and Ridascreen kits were used with spiked foods (ice cream, cookies, and breakfast cereals) they gave recoveries of 85-111% and 60-81% respectively. Whilst these were not incurred samples this work demonstrated the capability of commercially available ELISA kits. These three kits, except for the Ridascreen Fast Peanut being used instead of the Ridascreen Peanut variation, were used in a study by Park et al. in 2005 (Park, Coates et al. 2005). Using the AOAC Performance Tested Method, these three kits were evaluated at three laboratories and successfully identified 60 samples spiked with peanut and 60 blank samples. This work recommended that two kits be used in conjunction to give greater confidence in results. Cross- reactivity to 32 substances was also investigated, with the Ridascreen kit being cross-reactive to chickpeas, green peas, and lima beans.
Four ELISA kits were compared in work from Whitaker et al., namely the ProLisa Peanut Pak Kit (ProLab Diagnostics, Ontario Canada), the Veratox Peanut Allergen Test (Neogen Corp., Lansing, MI), the RIDASCREEN Peanut (R-Biopharm AG Darmstadt, Germany), and the Bio-Kit Peanut Protein Assay Kit (ELISA Technologies, distributor, Gainesville, FL) (this work was published in 2005 so if these kits are still available on the market they may contain different components) (Whitaker, Williams et al. 2005). Highlighting the lack of commercially available peanut protein reference standards as a reason for variations in measured protein levels between kits the study reported that across four matrices (breakfast cereal, milk chocolate, ice cream and cookies) and spiking levels (0-10 μg/g) no kit was the most precise or the most accurate, however for incurred samples Neogen and R- Biopharm kits were the most accurate and precise test kits, respectively.
For their study comparing commercial ELISA kits to a newly developed MS method for detecting incurred allergens in bread, Heick et al. used the Ridascreen Fast Peanut (R-Biopharm AG, Darmstadt, Germany), and Bio-Kit Peanut Protein Assay Kit (Tepnel, Neogen Corp., Lansing, MI), although they anonymised the results so as to not provide a direct comparison between kits (this work was published in 2011 so if these kits are still available on the market they may contain different components) (Heick, Fischer et al. 2011). Both ELISA kits detected the peanut in the raw and incurred samples with no loss of sensitivity in thermal processing, however for the MS method the peak signal decreased with baking, suggesting that either the peptide was less extractable or experienced chemical modification during thermal processing. Thermal processing was the focus of work by Fu et al. (Fu and Maks 2013) comparing the Veratox Peanut Allergen Test (Neogen Corp., Lansing, MI) which assesses total peanut proteins and Bio-Kit Peanut Protein Assay Kit (Neogen Corp., Lansing, MI) which employs antibodies specific to the marker protein Ara h 1. A BCA total protein assay was used to determine the effect of heating on protein content which revealed that when heating by boiling or autoclaving the protein extracted decreased by 50%, however dry heating to 100 to 120 °C did not have a significant effect on the extractability, although this decreased at higher temperatures. Both ELISA kits underestimated the level of peanut protein at temperatures above mild conditions, the Bio-Kit gave lower estimations of peanut protein content which can be explained by the fact that it targets Ara h 1 which has been found to be relatively heat labile (Koppelman, Bruijnzeel-Koomen et al. 1999). The authors of this study suggest that ELISA kits should be designed to use target markers which are structurally and immunochemically stable and users of ELISA kits need to be aware of any limitations to minimise the risk of allergens not being detected. This is not always made clear to users in the instruction manual, for example that raw foods are often more suitable for allergen detection by certain kits compared to more processed foods.
Working to identify appropriate peanut proteins for targeting by ELISA kits, Jayasena et al. used the SRM 2387 (peanut butter) to determine the specificity of each kit to Ara h 1 Ara h 2, Ara h 3 and Ara h 6 (Jayasena, Smits et al. 2015). The six ELISA kits used in this study were Veratox for peanut allergen (Neogen, Lansing, MI, USA); BioKits peanut assay kit (Neogen, Lansing, MI, USA); AgraQuant peanut assay (Romer Laboratories UK Ltd.); RIDASCREEN fast peanut (R-Biopharm, Germany); Peanut protein ELISA kit (Morinaga Institute of Biological Science, Inc. Japan); and Peanut residue (ELISA Systems Pty Ltd. Australia). This work was published in 2015 so if these kits are still available on the market they may contain different components. All kits, except the Morinaga, had the greatest sensitivity for Ara h 3 while the Morinaga was most sensitive to Ara h 2 and Ara h 6. The authors note that while the Ara h 3 is the most abundant protein in peanuts and therefore a good indicator of the presence of peanut, the proteins Ara h 2 and Ara h 6 are the most potent allergens and less susceptible to denaturation and aggregation. This would suggest that the allergens Ara h 2 and Ara h 6 would be better target proteins for ELISA kits for processed food products, although this work demonstrated that all kits recovered peanut from the standard RM.
Studying both ELISA and LC-MS/MS methods, Parker et al. produced industry- processed model foods incurred with egg, milk and peanut allergens (Parker, Khuda et al. 2015). The ELISAs used in this work were ELISA Systems Peanut (Queensland, Australia); Morinaga Peanut (Yokohama, Japan); Neogen Veratox Peanut (Lansing, MI, USA); and R-Biopharm RIDASCREEN FAST Peanut (Darmstadt, Germany), (this work was published in 2015 so if these kits are still available on the market they may contain different components). The samples, cereal bars and muffins, were incurred with dark roast peanut flour with all ELISA kits giving recoveries less than 40% for the cereal bar and less than 30% for the muffins. An LC-MS/MS method developed in this work gave far better recoveries at 60 and 70% for the two sample types respectively.
Six different ELISA kits: Veratox® for peanut allergen and BioKits peanut assay kit (Neogen, Lansing, MI, USA); AgraQuant® peanut assay (Romer Laboratories UK Ltd.); RIDASCREEN® FAST peanut (R-Biopharm, Germany); Peanut residue (ELISA Systems Pty Ltd. Australia); and Peanut ELISA kit (Morinaga Institute of Biological Science, Inc. Japan) were assessed against peanut flours with increasing levels of roasting (this work was published in 2019 so if these kits are still available on the market they may contain different components) (Jayasena, Koppelman et al. 2019). This work found that for the minimally processed samples the ELISA kits from Romer, R-Biopharm and Veratox were the most sensitive, with increased thermal processing the Morinaga kit showed highest sensitivity, particularly at low concentrations. A decrease in sensitivity with thermal processing was seen across all ELISA kits and this is likely to result from the reduced solubility and reduced reactivity of the target proteins. This work again demonstrates the advantages of targeting the Ara h 2 protein where a product is likely to contain dark roasted peanut flours and communicating this to the food industry should help ensure that an ELISA kit with sufficient sensitivity for a sample is used.
The effect of changing the extraction buffer in commercial ELISA kits was investigated by Jayasena et al., the kits used in this work were Veratox® for peanut allergen (Neogen, Lansing, MI, USA); and Peanut ELISA kit (Morinaga Institute of Biological Science, Inc. Japan) (this work was published in 2019 so if these kits are still available on the market, they may contain different components) (Jayasena, Wijeratne et al. 2019). For unprocessed samples the Veratox kit gave higher recoveries than the Morinaga kit and these were increased further with the buffers developed in this work Na2CO3, pH 9.6 and PBS containing 1 M Guanidine Hydrochloride, however the Morinaga consistently gave the highest recoveries with the buffer included in the kit. When the samples were more intensively processed the Morinaga kit gave better recoveries than the Veratox kit and across most thermal processing methods its included extraction buffer gave the best recoveries. This suggests that the extraction buffer supplied with the Morinaga kit is well suited to peanut detection and additionally that the crucial factor in good sensitivity to thermally processed peanut allergens is the detection of heat stable allergens, in this case namely Ara 2 h.
As reported by Holzhauser (Holzhauser, Johnson et al. 2020), information provided by ELISA kit manufacturers and peer reviewed assessments of commercially available ELISA kits suggest that most of the commercially available ELISA kits that were reviewed are able to detect peanut protein to the levels required to measure the VITAL 2.0 reference dose at the smallest portion size of 5 g, which equates to a 40 mg kg−1 of peanut protein per food (Koch, Schappi et al. 2003, Park, Coates et al. 2005, Poms, Agazzi et al. 2005, Whitaker, Williams et al. 2005, Jayasena, Smits et al. 2015, Parker, Khuda et al. 2015). In support of this, a number of peer reviewed publications using allergen incurred matrices have demonstrated the detection of peanut at 5 mg kg−1, (Whitaker, Williams et al. 2005, Khuda, Slate et al. 2012) and at 0.625 mg kg−1 (Poms, Agazzi et al. 2005).
In 2005, Park et al. compared the Veratox for Peanut Allergen Assay manufactured by Neogen Corporation (Lansing, MI), the RIDASCREEN FAST Peanut Assay manufactured by R-Biopharm, and the BioKits Peanut Assay Kit manufactured by Tepnel BioSystems in an inter-laboratory trial. All kits were capable of detecting 5 ppm peanut in all samples, which were food matrices spiked with peanut butter. In samples containing high levels of peanut, the RIDASCREEN FAST Peanut kit showed cross-reactivity with green peas, chickpeas, lima bean, however no such cross-reactivity was observed when the extracts were diluted to 100 ppm. It is important to note that this peanut testing kit may have been further developed since 2005. This inter-lab validation would have benefited from the use of incurred samples to determine the effect of thermal processing.
The results of an inter-laboratory study by Poms et al. 2005 with five commercially available peanut ELISA test kits to detect and quantify peanut residues in an incurred biscuit sample and a spiked biscuit and dark chocolate at four different concentrations (0–10 mg peanut per kg matrix corresponding to about 0–2.5 mg peanut protein per kg matrix) are reported (Poms, Agazzi et al. 2005). The test kits were Biokits Peanut Assay Kit from (Tepnel Biosystems,UK), targeting Ara h 1, Peanut Residue ELISA Kit from Elisa Systems (Australia), targeting Ara h 2, Prolisa Peanut PAK ELISA Kit from Pro-Lab Diagnostics (Canada), targeting total soluble peanut protein, Ridascreen Peanut from R-Biopharm (Germany), targeting total soluble peanut protein and Veratox from Neogen (USA), targeting total soluble peanut protein. All kits showed false negatives in biscuit, at a rate varying from 1.9 to 18%. Three of the kits showed false negatives to dark chocolate, at a rate of 5.9- 25.5% but two kits detected zero false negatives. The authors reported that generally all five commercially available ELISA test kits investigated performed well in the concentration range 5–10 mg/kg rather than in the low concentration range (2 or 2.5 mg/kg). The variation in the recoveries of peanut between the different test kits varied between 44–191% across all concentrations. It is important to note that all five kits may have evolved since this study in 2005 and their performance may be very different using the current versions of the kits.
2.4.10.3 PCR
A multiplex PCR method was developed by Engler-Blum et al. which has a practical detection limit of 10 mg kg-1 for both peanuts and hazelnut with no other cross- reactivities found (Engler-Blum, Raiss et al. 2007). Commercially the R-Biopharm SureFood Congen advertises an LOQ of 1 mg kg-1 and reports no cross reactivities.
2.4.10.4 Lateral Flow Tests (LFT)
The Reveal 3-D for Peanut test (Neogen, Lansing, MI) was validated against the AOAC Performance Tested Method 111901, this is an extensive test which assesses robustness, selectivity, cross-reactivity against 29 common food commodities, and matrix tolerance (Le, Vance et al. 2020). The total peanut detection level in CIP rinses ranged from 2-4 ppm and environmental surface swabs at a range of 3-4 µg/100 cm2. These kits are designed for use in detecting allergens in clean-in-place rinses and environmental swabs to provide confidence in allergen risk management in the food manufacturing industry.
2.4.10.5 Mass Spectrometry
A challenge of cross-reactivity in ELISA kits was demonstrated in work by Daly et al. whereby an ELISA kit from an undisclosed company detected both almonds and peanuts in an allergen-free product (Daly, Ansari et al. 2018). The ELISA kit AgraQuant peanut assay (Romer Laboratories UK Ltd.) also found a significantly lower concentration of peanut in the sample, however an LC/MS-MS method found no peanut protein in the sample. The authors concluded that it was possible that both ELISAs showed degrees of cross-reactivity to another similar protein in the sample, although they could not rule out that the LOD of the MS method was too high to detect the peanut levels in this matrix.
As a follow-up to their previous methods, Pilolli et al. (2017) developed an SRM LC- MS method using both incurred cookie samples and spiked cookie samples (Pilolli, De Angelis et al. 2017). The LOD was 13 µg peanut allergen (Conarachin) per gram of food. By comparing the levels of allergens detected in the incurred samples compared to those for the spike samples, the authors were able to determine the effect of processing on the level of detection of the allergens. Figure 1 clearly shows how the detection is dramatically reduced for each of the 5 allergens under investigation when the samples are processed.
A novel approach achieved an LOD of 3 mg kg-1 with LC-MS/MS spectrometry using magnetic beads coated with antibodies to extract Ara h 3 and Ara h 4 from complex matrices (Careri, Elviri et al. 2008a). This work was designed to be used in combination and as a confirmatory tool with ELISA screening procedures.
The impact of matrix effects on MS detection of peanut proteins was mitigated using microfluidic separation in work by Sayers et al. (Sayers, Gethings et al. 2018). With a target detection limit of 3 mg kg-1 and quantification limit of 10 mg kg-1, following VITAL guidance (Allen, Remington et al. 2014) two sample matrices of a chocolate dessert and chocolate bar were incurred with peanut protein. The peptide targets of this work were Ara h 1, Ara h 2, Ara h 3, Ara h 6 and Ara h 7 but only Ara h 2 could be quantified at 10 mg kg-1. As previously discussed, Ara h 2 is considered a good candidate for peanut allergen detection due to its potency and stability with thermal processing. The recoveries of this work were compared to a commercial ELISA kit, the kit AgraQuant peanut assay (Romer Laboratories UK Ltd.) (which while still commercially available may not contain the same components as when this work was published in 2018) and were found to be consistent, reporting around 30-50% of the spiking level.
Planque et al. (Planque, Arnould et al. 2017) described an LC-MS/MS protocol for the detection and quantification of ten allergens in processed foods. They observed an LOQ of 2.5 mg/kg for peanut, cashew, pistachio, and hazelnut proteins. The method can be completed in one day and the authors suggest that it is suitable for routine laboratories. They emphasised the importance of introducing suitably labelled standards in order to correct for matrix effects.
A multi-allergen targeted method was also described by Gu et al. (Gu, Chen et al. 2018) for the determination of allergens in chocolate (milk, soybean, peanut, hazelnut, walnut, almond, cashew and pistachio). Enhanced sensitivity was obtained by introduction of a rapid solid-phase extraction step using MonoSpin PBA spin column. Quantification was based on matrix-matched calibration curves. LOQ values of 2.5–4 μg/g were obtained for peanut.
A multi-allergen LC-MS/MS method was developed by Sealey-Voyksner et al. (Sealey-Voyksner, Zweigenbaum et al. 2016) for the detection of trace levels of peanut and tree nuts in food. Marker peptides were selected only if present in both processed and unprocessed foods and based on abundance for sensitivity, sequence size, and specificity. For peanut-specific peptides along with two peptides specific for each of peanut, almond, pecan, cashew, walnut, hazelnut, pine nut, Brazil, macadamia, pistachio, chestnut and coconut were used as targets for the method. All allergens were detected at 1 ppm spike levels in food samples, and some were also detected at 0.1 ppm, depending on matrix interferences. The method was applied to a wide range of processed commercial samples, being able to confirm declared allergens, identify allergens indicated by PAL and discover undeclared allergens with minimal cross-reactivity due to the specificity of the peptide sequences selected. The method was used to identify undeclared nuts in commercial foods.
Highly specific identification of peanut, almond, cashew, hazelnut, pistachio, and walnut by a technique using MS(3) reconstructed chromatograms on a signature of secondary ions issued from a trapped primary product ion, termed multiple reaction monitoring cubed (MRM3) reported by Korte and Brockmeyer (Korte and Brockmeyer 2016). The analytical performance of the method was assessed for three relevant food matrices with different chemical compositions. Limits of detection were around 1 mg/g or below in fortified matrix samples, not accounting for the effects of food processing. Compared to an MRM-based approach, the MRM3-based method showed an increase in sensitivity of up to 30-fold. Regression analysis demonstrated high linearity of the MRM3 signal in spiked matrix samples together with robust inter- sample reproducibility, confirming that the method is highly applicable for quantitative purposes.
Sagu et al. (Sagu, Huschek et al. 2021) developed a targeted LC-MS/MS method for the detection and quantification of almond, cashew, hazelnut, peanut, pistachio and walnut. The method was validated according to the International Conference on Harmonisation (ICH), determining linearity, selectivity, sensitivity, recovery, repeatability and reproducibility (based on triplicate experiments). In addition, the limits of detection (LOD) and the limits of quantification (LOQ) were calculated for the different nuts. For peanut, an LOD of 9.1 ng flour and an LOQ of 30.6 ng flour (equivalent defatted nut flour injected) were obtained. The study focused on the comparison of various methods for extraction and digestion from the different nuts based on the results obtained with the LC-MS/MS method developed. Of note, this study was conducted using raw unsalted nuts only, further analysis would be needed to investigate the performance of the approach on processed foods as well as the effect of food matrices.
Quantitative methods for peanut have been developed and demonstrated to work in various matrices (chocolate, baked goods, cereals). Four studies identified here describe LODs which are below the 0.4 mg/kg. Peanut has been determined in a food matrix, namely chocolate (Bignardi, Mattarozzi et al. 2013) cookie, (Careri, Elviri et al. 2008b) and biscuit, ice cream or milk chocolate (Korte, Lepski et al. 2016). Interestingly, none of these studies utilized nano-liquid chromatography, thought to be required for the most sensitive methodology.
As described above, Gavage et al. highlighted that future development of concatemer MRM mass spectrometry methods may be of benefit to food testing capabilities due to the more accurate alignment of the method with the sample extraction protocol and their initial multiplex method involved peanut alongside three other allergens.
2.4.10.6 Conclusions – Peanut testing methods
The development of analytical methods for peanut detection over the past twenty years has revealed the importance of target selection. For ELISA kits the use of Ara h 3 as a target protein gives high recoveries in unprocessed substances as it is a highly abundant seed storage protein (Jayasena, Smits et al. 2015, Jayasena, Koppelman et al. 2019). Conversely the less abundant but more potently allergenic protein Ara h 2 has greater thermal processing tolerance. It is important that the differences in the capabilities of methods which detect different proteins or peptides is communicated to responsible individuals within the food industry to ensure that the best techniques to confirm the absence or presence of peanut protein in foods are selected. Additionally, for the peanut allergen, it is encouraging to see the use of VITAL dose levels forming a standard in the literature for methods to target in combination with validating methods against AOAC Standard Methods (Immer, Reck et al. 2004, Le, Vance et al. 2020, Lacorn, Dubois et al. 2022a). This approach should be more widely taken in assessing and advertising commercial methods to increase standardisation across the food industry. A combination of testing technologies, combining detection of different allergen proteins, would provide the most robust workflow to determine the presence of peanut in food matrices.
2.4.11 Sesame
2.4.11.1 Introduction
Sesame (Sesamum indicum L.) is a plant cultivated for its seeds which are used in food products, in particular the bakery goods, fast-foods, processed meats, vegetarian and ethnic dishes. In diets where sesame based foods, such as halva and tahini, are common sesame can be a major cause of food allergy. In the UK the prevalence of sesame sensitivity was found to be 0.1% in six year olds and 0.6% in three year olds. (Venter et al., 2006a; Venter et al., 2006b) The characterised allergens in sesame are known as Ses I 1-7 and they are seed proteins, with the 2S albumin Ses I 1 was the first identified allergen and is a major allergen, alongside its homologue Ses I 2 and the 7S vicilin-like globulin Ses I 3. Studies into the cross reactivity between sesame and other allergens has found increased prevalence of sensitivity to peanuts (84.8%), hazelnut (82.9%), egg (81.5%), walnut (80.6%) and almond (76.3%) amongst children sensitised to seasame. (Stutius et al., 2010)
2.4.11.2 ELISA
The development of a sandwich ELISA for the detection of sesame in foods was detailed by Koppelman et al. and compared to kits from Tepnel Biokits (Deeside, United Kingdom) and ELISA Systems (Windsor, Australia) (Koppelman, Soylemez et al. 2015). The stated LOQs given by the manufacturers for these kits at the time of publication were 6 ppm and 0.5 ppm respectively. A comparison of the recovery of white and black sesame seed in bread incurred with sesame seed flour gave mean recoveries for the developed method and the ELISA Systems kit were 6.5% and 13%, while the Tepnel-Neogen kit was used to give a higher recovery with a mean of 39%. A second sample, peanut butter spiked with tahini was also used as a test for all three kits, in this case the developed method had a mean recovery of 83%, the ELISA Systems kit had a mean recovery of 6% but could not detect the lowest spike at 1 ppm. The Tepnel-Neogen assay resulted in an overestimation of sesame contamination with a mean recovery of 239%. The specificity of the developed kit was investigated against 92 food ingredients with around a quarter of ingredients responsive undiluted. The conclusion from the authors suggests that different assays may be required for measuring residues of sesame seeds in food products. The authors argue that polyclonal antibodies are more appropriate for processed samples, stating, “A monoclonal antibody may become less reactive if its epitope is affected by food processing. For polyclonal antibodies, more epitopes play a role and overall reactivity will only partly be affected when a certain epitope is affected by food processing. Furthermore, because we choose to work with whole extracts rather than purified or isolated proteins, the number of epitopes is even larger, diminishing the chance of losing reactivity in the ELISA when the reactivity of one of the epitopes is affected by food processing”.
The effect of food processing on the allergenicity of sesame seeds was investigated by Achouri et al. using an ELISA kit produced by Tepnel BioSystems Ltd., (Deeside, Flintshire, United Kingdom) (Achouri and Boye 2013). This determined that an increased ELISA response was seen following boiling and dry roasting samples, whereas microwaving decreased the response. With Fourier transform infrared spectroscopy (FTIR) significant changes were observed following thermal processing with significant changes to protein confirmation, for example unfolding and denaturation, impacting the antibody binding to allergenic epitopes. This demonstrates the importance of testing ELISA kits against incurred samples to observe the impact of processed sesame as the binding can be significantly altered while allergenic proteins remain in the sample.
2.4.11.3 Mass Spectrometry
The detection of sesame proteins in a qualitative and quantitative method by LC- MS/MS by Ma et al. was achieved using stable isotope labelled internal standard peptides (Ma, Li et al. 2020). The seven allergenic peptides gave LODs in the range 0.1 to 140.0 fmol μL-1 and LOQs in the range 0.4-400 fmol μL-1. The recovery of 20 ppm incurred protein is reported as 90% for non-processed material and 92% in processed material. The LOQ is 10 times higher than that for commercially available ELISA kits, illustrating the current gap in performance between the two methods for sesame detection, accordingly the VITAL study by Holzhauser in 2020 which reported that no MS methods met the inclusion criteria (Holzhauser, Johnson et al. 2020).
Huschek et al. (Huschek, Bonick et al. 2016) developed a targeted LC-MS/MS method for the simultaneous analysis of soy, sesame and lupine using isotope- labelled peptides. The method included three peptides from the cupin protein Ses i6 in sesame. The performance of the method was evaluated by analysing six replicates of each sample, namely wheat flour, cookies and bread incurred with the allergenic foods. The LOQ achieved for sesame in food was 20 ppm (wheat flour), 10 ppm (cookie) and 50 ppm (bread) and the recovery rates were 113%, 91% and 72%, respectively. The method is described as accredited with regard to ISO 17025.
2.4.11.4 PCR
A commercial PCR test for sesame is available from R-Biopharm and has an LOQ of
≤ 0.4 ppm but publications regarding this kit were not identified. Other PCR methods are quoted in the Koppelman paper: “The sensitivity of the DNA-amplification method was in one report 50 ppm and 5 ppm in another report. At least one of these methods by Schöringhumer et al. may not detect clinically relevant levels of sesame seed residues based upon the VITAL Reference Dose. Furthermore, the DNA- amplification methods detect DNA rather than the allergenic proteinaceous part of sesame seeds. Results obtained with DNA-amplification methods should therefore be interpreted with more care especially for processed food products containing sesame seed-based ingredients where the allergenic protein part is separated from the DNA/R” (Ehlert, Demmel et al. 2009, Schoringhumer, Redl et al. 2009, Taylor, Baumert et al. 2014, Koppelman, Soylemez et al. 2015).
2.4.11.5 Conclusions – Sesame testing methods
The sesame allergen testing market is dominated by ELISA tests, with only one PCR kit available (Table 1, Appendix 1). Currently, alternative techniques such as LC-MS, do not show the limits of detection typical of the ELISA kits.
2.4.12 Soybean
2.4.12.1 Introduction
A legume, the soybean (Glycine max) is a protein rich seed (~38% protein), as vegetarian diets have increased across Europe in recent years, soy consumption has increased as a cheap protein source. In two studies the prevalence of soy sensitivity in the UK was found to be 0.3% and 0.2% in children aged four and eight respectively. (Arshad et al., 2001; Roberts et al. 2005) Although 16 protein fractions capable of causing an IgE mediated reaction, only eight allergens are included in the IUIS database, named Gly m 1-8. The most common storage proteins in soybeans are β-conglycinin (7S, Gly m 1 and 5) and glycinin (11S; Gly m 6). The major allergens are Gly m 1 and Gly m 4 with >90% and 86% of patients reacting to each respectively. (Djurtoft et al., 1991; Baur et al., 1996) Cross reactivities for other legumes including peanuts, green peas, lima beans and string beans have been reported. (EFSA, 2014)
Lacorn et al. illustrated in 2016 that closely-related plants show cross-reactivity to soybean ELISA (R-Biopharm Ridascreen Fast) (Lacorn, Dubois et al. 2016). However, although from a regulatory point of view, these cross-reactivities could be considered undesirable, they may still be relevant due to potential co-sensitivity amongst soy-sensitive consumers. Eighteen phylogenetically closely related species were tested. No cross-reactivities were observed for Lupinus angustifolius, L. albus, and L. luteus. In contrast, cross-reactivities were observed against Pisum sativum (dried and fresh seeds), Vicia pannonica, Lens culinaris, Arachis hypogea (roasted and raw), Cicer arietinum, Trigonella foenum-graecum, Trifolium pratense, Phaseolus vulgaris, P. lunatus, V. faba, P. coccineus, Vigna radiate, and V. angularis.
2.4.12.2 ELISA
Work using R-Biopharm, Veratox-Neogen and Romer ELISA test kits with a matrix of biscuits spiked with soybean concentrate as an allergen found that the R-Biopharm kit was capable of quantifying soybeans from 25 ppm (Binaghi, Greco et al. 2017). Conversely the Veratox kit was not capable of detection of the soybeans at the highest tested concentration (5000 ppm), while the Romer kit did not allow detection at 50 ppm soybean which was the highest soybean concentration tested with this kit. However, it is claimed on the latest version of the Veratox kit that the LOD and LOQ are 2.5 ppm. When the kits were tested against extruded product with soybean, quantitation was achieved using both R-Biopharm and Romer kits when the soybean level was 5 ppm of concentrated soyabean added while no soybean was detected when using the Veratox kit, even at 5000 ppm. This difference is believed by the authors of the study to result from the changes to the soybean protein during cooking. This is illustrated by the fact that in cookie samples the R-Biopharm kit were under-quantified, while extruded cookie samples were over-quantified.
Soybean proteins which had been partially hydrolysed by pepsin (to simulate partial hydrolysis which is used to remove bitterness or improve amino acid or protein functionality) were the subject of a study on the robustness of ELISA techniques by Cucu et al. (Cucu, Platteau et al. 2013). Looking at three different kits (Veratox Soy Allergen, Biokit Soy Allergen and Soy Residue kit), when the sample contained untreated soybean the levels of soybean were overestimated by both the Veratox and Biokit kits (at 260% and 240% respectively), however the Soy Residue kit was more accurate. Increasing hydrolysis caused the detection to decrease, in the case of the Veratox kit, only 20% of the soybean protein could be detected after 180 minutes of hydrolysis. The same kits were used in work on the effect of glycation from the Maillard reaction (Platteau, Cucu et al. 2011). This study found that heating the RM for both the Veratox and Soy Residue kits revealed a complete lack of robustness, likely a result of the denaturation of the 7S conglycinin and trypsin inhibitors these kits use. Conversely the Biokit demonstrated a far less dramatic decrease in detection. In a similar study looking at the effect of oxidation both in the presence and absence of lipids, again for the Veratox and Soy Residue kits the heat treatment almost completely prevented the detection of soybean protein, both with and without the lipids present (Platteau, Cucu et al. 2013). However, for the Biokit ELISA the detection of soybean allergens increased both with and without sunflower oil being present, suggesting that lipid induced oxidation of proteins is compatible with ELISA receptor-based detection. Conversely, hypochlorous acid-induced oxidation severely depressed detection and whilst this is not a food ingredient it is used as a cleaning agent and may impact the detection of trace residues on the production line.
The impact of thermal processing on soybean detection was investigated by Gomaa et al. comparing ELISA kits, Veratox and the ELISA systems kit, with flow cytometry all methods performed reasonably well for non-baked cookie samples with recoveries of 86%, 74% and 89% respectively (Gomaa and Boye 2013). When the cookies were baked, these recoveries fell to 33 to 1% for the Veratox, 1 to 0% for the ELISA systems kit and 21- to 0% for flow cytometry, with larger cookies giving greater recoveries than smaller cookies. An interlaboratory investigation conducted in 2010 by Sakai et al. focused on the FASTKIT Ver. II (supplied by CosmoBio Ltd, Japan) for soybean detection which uses polyclonal antibodies to Gly m Bd 30 K (p34) (Sakai, Adachi et al. 2010). This looked at five different incurred matrices: rice gruel, sausage, sweet adzuki bean soup, sweet potato cake and tomato sauce each containing 10 μg soybean protein per gram of food. Eleven different laboratories were involved in the ring trial which demonstrated high levels of recovery (97-114%) and the reproducibility was also acceptable with an RSDR ranging from 9.3 to 13.4% across the five matrices.
2.4.12.3 PCR
Commercial PCR kits are available (R-Biopharm AG, Darmstadt, Germany; Biotecon Diagnostics GmbH, Potsdam, Germany), however peer-reviewed literature citing the performance of these kits was not identified.
2.4.12.4 Mass Spectrometry
The detection of soybean proteins using mass spectrometry has typically focussed on the proteins from soybean conglycinin (Gly m 5), soy glycinin (Gly m 6), and additionally some studies have used peptides from prolamine and lipid transfer proteins (Holzhauser, Johnson et al. 2020). In their 2017 work Huschek et al. developed a sensitive method for the detection of soybean glycinin employing isotopically labelled proteins for quantitation, an approach also taken by Croote and colleagues (Huschek, Bonick et al. 2016, Croote, Braslavsky et al. 2019). The former work achieved an LOQ of 10 ppm of the target protein converting this to 25 ppm allergenic food per 100 g consumption.
Multi-allergen approaches have also been taken. The development of a mass spectrometry method to detect soybean and other allergens was proposed by Heick et al. in 2011 and compared this to two ELISA kits, the Soy Residue Enhanced Assay and the Tepnel Biokits Soya Assay (Heick, Fischer et al. 2011). Using the related matrices of flour and bread, this study again investigated the impact of baking on limits of detection with only one of the two (anonymised) ELISA kits reported to detect the soybean protein in the processed product with detection at 13% of that found in flour. The MS method, directed at glycinin soybean allergen peptide markers had an 80% decrease in signal response in bread compared to that in flour and the benefits of a multiplex method (this one also capable of analysing for milk and egg in a single analysis) was highlighted by the authors. The LOD was 24 µg/g soybean in incurred bread, with a correlation coefficient of 0.9879.
Gu et al. reported a multi-allergen MRM method on chocolate incurred with a range of allergens. The method, targeting conglycinin and glycinin peptides, was capable of detection down to 0.4 µg/g, quantitative range up to 240 µg/g with recovery in the 61- 86% range (depending on which of the three soy peptides was targeted). The authors highlighted the importance of the special type of monolithic silica gel column bonding of benzene boric acid-based group which can specifically adsorb substances containing o-hydroxy groups and efficiently clean-up complex food extracts for the sensitive detection of trace food allergens. The authors believe that the use of internal standards will lead to a robust quantitative multi-allergen method in the future and they acknowledge that foods involving a wider range of processing formats must be tested in the future.
Monaci et al. 2014 developed a method using SRM LC-MS for multiallergen measurement for milk, egg and soybean, selecting the top 2 performing peptides from a list of 11 (Monaci, Pilolli et al. 2014). LODs were achieved at 0.1 µg/g milk, 0.3 µg/g ovalbumin and 2 µg beta-conglycinin-alpha chain soybean allergen per gram of food, although the samples were spiked rather than incurred, so the level of challenge was considerably lower than for methods developed using incurred food matrices.
As a follow-up to their previous methods, Pilolli et al. (2017) developed an SRM LC- MS method using both incurred cookie samples and spiked cookie samples (Pilolli, De Angelis et al. 2017). The LOD was 6 µg allergen /g food for soybean, 7 µg/g for milk and hazelnut, 9 µg/g for egg and 13 µg/g for peanut. By comparing the levels of allergens detected in the incurred samples compared to those for the spike samples, the authors were able to determine the effect of processing on the level of detection of the allergens. Figure 2 clearly shows how the detection is dramatically reduced for each of the 5 allergens under investigation when the samples are processed. It is interesting that, as in detection by ELISA, detection (of peptides) can also be reduced with increased sample processing.
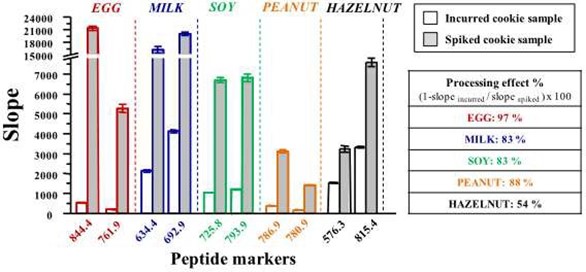
Figure 2. Taken from Pilolli et al. 2017 (Pilolli, De Angelis et al. 2017). Comparison of the calibration curve slopes obtained by interpolation of peak areas in the SRM mode for incurred and spiked samples. The table on the right reports the % processing effect expressed as the percent decrease of the sensitivity calculated in incurred samples compared to spiked samples.
Planque et al. 2017, concentrating on detection by LC-MS of egg, milk, soybean and peanut peptides highlighted the effect of detection of allergens with processing and highlighted the need for labelled allergen peptides to use as internal standards in order to develop quantitative methods (Planque, Arnould et al. 2017). In the meantime, the authors recommend using standard addition methods to estimate allergen levels by LC-MS.
2.4.12.5 Conclusions – Soybean testing methods
These studies highlight the importance of choosing the correct commercial ELISA for the specific food product being analysed. Given the poor performance of many
ELISA kits when samples have undergone processing, there are needs for either improvement of methods or clear and transparent data concerning the levels of processing for which each kit is suitable and lists of the expected recovery for each form of processing. Much LC-MS work has focussed on soybean (not soya protein) detection, compared to the level of LC-MS methods targeting other allergens and methods are capable of detecting down to similar detection limits as ELISA methods (for example LOD 0.24 mg/kg for ELISA and 0.4 mg/kg for mass spectrometry) and therefore mass spectrometry methods for soybean seem more advanced than for other allergens, now requiring full validation and the development of internal standards to more accurately evaluate the quantitative capability of these methods.
2.4.13 Sulphur Dioxide
2.4.13.1 Introduction
Sulphur dioxide (SO2) is a preservative commonly used in a variety of foods and beverages including wine, dried fruits, pickled vegetables, sausages, fruit and vegetable juices, cider and vinegar. It slows oxidation and inhibits growth of fungal and bacterial cultures and thus is applied to extend the shelf life of food products. Sulphur dioxide residues in food are considered to be food allergens. Where SO2 and/or sulphite-based preservatives (even as carryover in an ingredient) have been used and the levels in the finished product are above 10 mg/kg or 10 mg/litre, it must be declared on the label as an allergen. The prevalence of sulphite allergies is higher among asthmatics than the general population, with the FDA estimating that 5% of asthmatic people are sensitive to sulfites, compared to 1% of the general population. (FDA, 1996)
2.4.13.2 Wine and related products
In wine, SO2 occurs naturally (generated by yeast) and is a very common additive due to the importance of its antioxidant and antimicrobial functions. Sulphites and SO2 levels are commonly measured by distillation and titration. Since sulphites can convert to SO2, sulphites are measured and expressed as SO2.
SO2 levels in wine are carefully controlled to ensure effective performance without negative sensory impacts. Industry reference methods are available. The most common method used for the determination of total SO2 is the aeration/oxidation method (AO), intially developed by Monier-Williams and subsequently enhanced by Rankine & Pocock , and is the basis of one of the approved International Code of Oenological Practices methods (OIV-MA-AS323-04A). (Burns, Walker 2018; Rankine, Pockock 1970) As this method liberates the SO2 from the sample matrix, it is relatively robust in terms of interference from other wine components. The equipment and reagents required are, however, relatively specialised and need to be carefully used and maintained, operated by a trained technician so are perhaps less suitable for on-site testing by small producers.
There are a number of alternative methods that allow SO2 analysis to be automated to speed up analysis time and carry out larger batches of samples. Iodic titration (more commonly known as the Ripper method, described in the OIV method OIV- MA-AS323-04B) allows a rapid determination of SO2 with limited equipment and can be automated for use on autotitrators; however, it suffers from significant interferences from other wine components and often gives artificially high results.
Red wines in particular are known to give erroneously high results due to the reaction of some of the colour compounds. The presence of any ascorbic or erythorbic acid also quantitatively reacts with iodine and this method cannot be used in wine that may contain these preservatives, unless they have first been quantified. It is generally acknowledged that iodic titration methods give a less accurate determination of total SO2 than AO methods for these reasons (Wilkes 2018).
Wilkes of the Australian Wine Research Institute states that: “Independent of the method used, the volatile nature of SO2 and its sensitivity to oxidation mean that careful sample handling and rigorous quality assurance procedures are required to achieve accurate and precise results” (Wilkes 2018). When using the available methods, Wilkes states, “the importance of appropriate validation of all laboratory methods (rather than simply following a published method) cannot be overstated. Control samples must be analysed at every first and tenth sample and a known standard should be prepared at a known level and analysed every week with recovery ±5%. Equipment should also be checked weekly to verify that acetic acid is being correctly removed from the samples during analysis since acetic acid is one of the few interferents of aeration/oxidation methods”.
Commercial methods also exist, based on spectrophotometry or sequential analysers. Porter et al. 2017 reported a new high-throughput photometric method capable of measuring SO2 levels in addition to levels of glucose, fructose, malic acid and acetic acid (Porter 2017). This work reported analysis of free and total SO2 in wines and juices using a commercial photometry method (Discrete Analyser by Thermo Scientific) in an adaptation of method OIV-OENO 391–2010. The data published correlated well to those from the industry reference AO method, with high throughput.
An enzymatic method performed by automated spectroscopy to measure SO2 in vinegar was reported by Dini et al., demonstrating validation data, as a rapid alternative to the Ripper method (Dini, Di Lorenzo et al. 2020). The data compared to the industry standard tests with excellent correlation, (LOD 0.946 ppm) and LOQ 2.00 ppm) with good precision and uncertainty. There were a few outlying data points but it will be interesting to see whether this method is adopted by the industry in the future.
2.4.13.3 Finished foods
The level of sulphite in finished food can also be determined by the modified Monier- Williams (MW) method (as published in the AOAC Official Method 962.16). The modified MW method is not applicable to dried onions, leeks, cabbage and certain other vegetables due to the presence of interfering volatile sulphur-containing compounds. The method was further optimised, developing the Optimized Monier- Williams (OMW) method. This method is the most widely used for the quantitative determination of sulphites in food and beverages (see, e.g., AOAC Official Method 990.28) and is sensitive at 10 mg/kg. A gap in this method is that false positive results are obtained from garlic powder, soy protein, onions, leeks, kale, brussels sprouts, horseradish, cabbage, and ginger.
A more recent method developed by AOAC (Method 990.31, 1995) focuses on the use of ion-exclusion chromatography coupled to electrochemical (amperometric) detection. The method is not applicable to dark coloured foods or ingredients where SO2 is strongly bound e.g. caramel colour. The method does not detect naturally occurring sulphite.
2.4.13.4 Conclusions – Sulphur dioxide and sulphites testing methods
AOAC and OIV official methods dominate the testing procedures for sulphites and sulphur dioxide in food and beverages. This conclusion is supported by method information submitted by participants in relevant Fapas® proficiency tests. No further routine method development was identified by this literature review.
2.4.14 Tree nuts
Details of methods which have been discussed in the literature for tree nuts are discussed below. This section discusses a variety of tree nuts which are fruits or seeds of various seeds contained within a hard shell. Tree nuts are common in many diets, either eaten as a whole nut, roasted or raw, or as a component of a dish or baked good. The prevalence of self-reported tree nut allergies across all ages in the UK population in 1994 was 1.7%. (EFSA, 2014; Young et al., 1994)
2.4.14.1 Multi-allergen detection by LC-MS
An LC-MS MRM multianalyte method was reported by Heick et al. 2011 to detect seven allergens: milk, egg, soy, hazelnut, peanut, walnut and almond (Heick, Fischer et al. 2011). The chosen marker peptides were implemented into one method that is capable of the simultaneous detection of milk, egg, soy, hazelnut, peanut, walnut and almond, incurred in bread material prepared from a standard recipe provided by industry with baking for 60 minutes at 200 °C. The four peptides identified for hazelnut detection all originated from 11S globulin. The LOD was 5 mg/kg for hazelnut incurred in bread and 0.42 mg/L for hazelnut in bread spiked with hazelnut, showing the importance of using incurred test materials when determining the suitability of a method to quantitatively determine allergen in real-world samples. The correlation co-efficient was 0.9998 for hazelnut incurred in bread, 0.9977 for peanut, 0.9986 for walnut and 0.9996 for almond. The LOD for milk, hazelnut, peanut and almond was 5,5,11 and 3 mg/kg respectively, 42 and 24 mg/kg respectively for egg and soy and 70 mg/kg for walnut.
Bignardi et al. reported multiplex determination of five nut allergens in biscuit and in dark chocolate complex matrices was obtained by LC-MS SRM analysis with a short LC-MS gradient (12 min) (Bignardi, Mattarozzi et al. 2013). Limits of detection in the 0.1-1.3 mg nut/kg and 5-15 mg nut/kg ranges for biscuit and dark chocolate samples as well as high recoveries (84(±6)-106(±4)% for biscuits and 98(±5)-108(±6)% for dark chocolate) proved the excellent capabilities of the exploited sample treatment method combined with the LC-MS2 analysis. Good precision in terms of intra- and inter-day repeatability was calculated, being always lower than 19 % (n = 75).
Linearity was demonstrated up to four and three orders of magnitude for biscuit and dark chocolate, respectively.
A multi-allergen LC-MS/MS method was developed by Sealey-Voyksner et al. (Sealey-Voyksner, Zweigenbaum et al. 2016) for the detection of trace levels of roasted and raw peanut and tree nuts (almond, pecan, cashew, walnut, hazelnut, pine nut, Brazil nut, macadamia nut, chestnut and coconut) in food. Marker peptides were selected only if present in both processed and unprocessed foods and based on abundance for sensitivity, sequence size, and specificity. At least two species- specific peptides were selected for each tree nut and four for peanut. All allergens were detected at 1 ppm spike levels in food samples, and some of them were also detected at 0.1 ppm. The method was applied to a wide range of processed commercial samples, being able to confirm declared allergens, identify allergens indicated by PAL and discover undeclared allergens. The authors argue that these levels of sensitivity align well with those typical of ELISA kits. The concentration of peptide detected can be equated to the concentration of allergenic protein, in line with FAO/WHO recommendations, which is a benefit of this methodology. Another benefit is the multiplex capability which would allow time savings compared to conducting a separate ELISA test for each individual nut type. The authors also argue that this method should benefit from less cross-reactivity than ELISA methods due to the specificity of the peptide sequences selected, thus reducing the number of false positive responses for the target compound.
Highly specific identification of peanut, almond, cashew, hazelnut, pistachio, and walnut by a MRM3-based LC-MS/MS method was reported by Korte and Brockmeyer (Korte and Brockmeyer 2016). The analytical performance of the method was assessed for three relevant food matrices with different chemical compositions. Limits of detection were around 1 mg/kg or below in fortified matrix samples, not accounting for the effects of food processing. Compared to an MRM- based approach, the MRM3-based method showed an increase in sensitivity of up to 30-fold. Regression analysis demonstrated high linearity of the MRM3 signal in spiked matrix samples together with robust inter-sample reproducibility, confirming that the method is highly applicable for quantitative purposes.
Planque et al. (Planque, Arnould et al. 2017) described an LC-MS/MS protocol for the detection and quantification of ten allergens in processed foods. They observed an LOQ of 2.5 mg/kg for peanut, cashew, pistachio, and hazelnut proteins. They observed an LOQ of 5 mg/kg for soybean, almond, walnut, and pecan nut proteins. The method can be completed in one day and the authors suggest that it is suitable for routine laboratories. They emphasised the importance of introducing suitable labelled standards in order to correct for matrix effects. A multi-allergen targeted method was also described by Gu et al. for the determination of allergens in chocolate (milk, soybean, peanut, hazelnut, walnut, almond, cashew and pistachio).(Gu, Chen et al. 2018) Enhanced sensitivity was obtained by introduction of a rapid solid-phase extraction step using MonoSpin PBA spin column. Quantification was based on matrix-matched calibration curves. LOQ values of 1–3 mg/kg were obtained for tree nuts. Sagu et al. (Sagu, Huschek et al. 2021) developed a targeted LC-MS/MS method for the detection and quantification of almond, cashew, hazelnut, peanut, pistachio and walnut. The method was validated according to the International Conference on Harmonisation (ICH), determining linearity, selectivity, sensitivity, recovery, repeatability and reproducibility (based on triplicate experiments). In addition, the limits of detection (LOD) and the limits of quantification (LOQ) were calculated for the different nuts. For pistachio, the authors quote that an LOD of 20.4 ng flour and an LOQ of 80.1 ng flour (equivalent defatted nut flour injected) were obtained. For walnut, an LOD of 34.4 ng flour and an LOQ of 114.8 ng flour (equivalent defatted nut flour injected) were obtained. For almond, an LOD of 35.6 ng flour and an LOQ of 118.6 ng flour (equivalent defatted nut flour injected) were obtained. The study focused on the comparison of various methods for extraction and digestion from the different nuts based on the results obtained with the LC-MSMS method developed. It concluded that for almond, an SDS extraction buffer and microwave-assisted trypsin digestion provided the best performance. Of note, this study was conducted using raw unsalted nuts only, further analysis would be needed to investigate the performance of the approach on processed foods as well as the effect of food matrices.
The choice of marker peptides is key for the development of reliable MS methods for allergen detection since the sensitivity, robustness and specificity of the method will depend on them. With this in mind, and as part of the development of a multi-analyte reference method, Pilolli et al. undertook a high-resolution MS discovery approach to select the most reliable peptide markers for six allergenic ingredients in two incurred food matrices (Pilolli, Van Poucke et al. 2021). The allergens studied included milk, egg, peanut, soybean, hazelnut, and almond, and they were added to chocolate at 40 ppm and to broth powder at 200 ppm to represent complex matrices incurred with low levels of allergens. Different conditions for protein extraction and purification were assessed, and the results indicated that a two-step extraction (including shaking and sonication at room temperature), followed by sample purification based on size exclusion chromatography at protein level and solid phase extraction of the trypsin digests was the most promising option for both incurred matrices. The authors concluded that this sample preparation workflow and the candidate peptide markers identified show potential to enable the development of a targeted multi- allergen SRM method using a triple quadrupole MS platform which could act as a prototype MS reference method for allergen analysis.
2.4.14.2 Almond
Almond (Prunus dulcis) major protein (AMP or amandin) is the primary storage protein in almond and the major allergen recognised by almond-allergic patients. The protein accounts for approximately 65% of aqueous extractable almond protein and it is substantially heat stable. Almond belongs to the Prunus genus which contains over 400 species including apricot, cherry, sour cherry, peach, plum and mahaleb (a spice produced from the seeds of mahaleb cherry).
2.4.14.3 ELISA and PCR
In the case of almonds, ELISA methods show cross-reactivities against phylogenetically closely related species, such as apricot stones or mahaleb cherry
(Prunus mahaleb) which is used as a spice. Apricot stones are used in the marzipan alternative persipan.
The BioFront MonoTrace almond ELISA kit (BioFront Technologies, Tallahassee, Fla., USA) was studied by Liu et al. (Liu, Chhabra et al. 2017) in parallel with a laboratory-developed monoclonal antibody-based sandwich ELISA (4C10) for the detection and quantification of almond. They reported that both kits were comparable and demonstrated their sensitivity, robustness and specificity for almond detection and quantification. LODs and LOQs of both ELISAs were below 5 ppm full fat almond, and the intra- and inter-assay variabilities were within 15%. Cross-reactivity was not observed with 156 food ingredients at a concentration of 100000 ppm whole sample. The target antigens were stable and detectable in whole almond seeds subjected to autoclaving, blanching, frying, microwaving, and dry roasting. The almond recovery ranges for spiked food matrices were between 81.2% and 127.4% for MonoTrace ELISA whilst for commercial and laboratory prepared foods with declared/known almond amounts recovery rates were between 38.1% to 207.6%. No false-positive or negative results were obtained. The only food ingredient found to interfere with antigen detection was dark chocolate, which resulted in a decreased antigen recovery. However, addition of 5% (w/v) non-fat dried milk in the extraction buffer and extraction at 60 °C, as recommended by the MonoTrace kit, reduced the interference from dark chocolate and increased recovery.
The development and validation of the Neogen Veratox for Almond Allergen ELISA test was published in 2018 (Slotwinski, Almy et al. 2018). The test enables the quantitative analysis and screening of almond protein in food products such as cereals, beverages, crackers, cookies, chocolate bars as well as clean-in-place rinses. The quantification range is 2.5 to 25 ppm and no significant cross-reactivity was detected across 39 commercial food products. Cross-reactivity was detected with other Prunus genus seeds (apricot, nectarine, cherry, plum, peach) but not with the flesh of these fruits.
Röder et al. compared the performance of two commercially available ELISA tests - Neogen Veratox® for almond allergen (Ayr, Scotland, UK) and RIDASCREEN®FAST
Almond (R-Biopharm, Darmstadt, Germany) – with that of a Taqman® real-time PCR method for almond developed in their laboratory (Röder, Vieths et al. 2011). The authors reported high levels of cross-reactivity of both assays to other kernels from Prunoideae fruits: plum, peach, nectarine and cherry, in addition to cross-reactivity to apricot kernel that is denoted in the manuals of both ELISA kits. However, the real- time PCR test exhibited only negligible cross-reactivity with a small number of Prunoideae foods and the authors therefore suggest that the PCR-based method is a superior strategy with regard to specificity compared with ELISA tests. The study also revealed differences in response of almond quantification of approximately 1:2 between Neogen and R-Biopharm ELISAs.
The performance of the RIDASCREEN®FAST Almond test with almonds roasted at various temperatures was investigated by Perner et al. (Perner, Heupel et al. 2019). They reported recovery levels close to 100% in cookies containing almonds roasted at 110 °C and 120 °C, however, almond was not detected when the roasting temperature was greater than 120 °C. SDS-PAGE analysis of nuts roasted at different temperatures showed that the total protein extracted decreased dramatically at roasting temperatures >120 °C, suggesting that the lack of ELISA response from these samples is linked to a reduced extractability/solubility of the proteins in question.
Following an incident in the UK 2015 which revealed the cross-reactivity of ELISA kits targeting almond with the Prunus species, real-time PCR methods were developed. Burns et al. 2016 designed a real-time PCR method shown by the authors to be specific for Prunus mahaleb. Other work has also been completed using real-time PCR to distinguish almond and Prunus mahaleb to provide greater species specification compared to ELISA (Walker et al. 2018). Cumin alleged to have been contaminated with almond was later found to be contaminated with the Prunus species Prunus mahaleb. Paprika was found to be contaminated with P. dulcis (almond). R-Biopharm’s Ridascreen Fast Almond ELISA, Romer’s AgraQuant ELISA and ELISA System’s Mandel/Almond residue kit all showed cross-reactivity to Prunus mahaleb, although the response of the ELISA Systems kit was much diminished compared to the other two kits. PCR methods were developed to distinguish the two species. A confirmatory method was also developed by SRM LC- MS, to develop a staged process to be implemented in any future incidents. Almond ELISAs are also known to cross-react with apricot (Table 1, Appendix 1).
2.4.14.4 Mass Spectrometry
Heick et al. compared the performance of an LC-MS/MS method developed in-house for detection of seven allergens with that of commercial test kits (Heick, Fischer et al. 2011). Almond was one of the allergens covered, and the ELISA kit used was RIDASCREEN® Fast Almond (R-Biopharm AG, Darmstadt, Germany). The study was conducted on wheat flour that had been spiked with the seven allergens as well as on baked bread in order to compare the effectiveness of the methods on raw and processed flour. Samples were tested in triplicate. The LC-MS/MS method targeted four peptides from the protein prunin, with an LOD of 3 µg/g and correlation coefficient of 0.996 in incurred bread. The authors described that the LC-MS/MS method was able to detect higher signals in the processed samples than in the raw flour, suggesting that this may be due to signal suppression in the flour matrix. However, the ELISA test detected less almond in the bread than in the unprocessed flour, which may be due to partial destruction of the epitopes recognised by the antibodies caused by heating. Similar results were observed by Perner et al., (Perner, Heupel et al. 2019) who investigated the effect of roasting on almond and hazelnut allergen detection by various methods, including non-targeted and targeted LC-MS/MS as well as the RIDASCREEN® Fast Almond ELISA test.
2.4.14.5 Conclusions – almond testing methods
Commercial ELISA kits are available for the detection of almond and it is apparent that much development of LC-MS methods has been completed to detect almond at low levels in incurred matrices. The presence of two different technologies to detect almond allergen protein is beneficial when determining workflows to determine almond in foods. However care must be taken to avoid cross-reactivity with Prunus mahaleb and using ELISA and PCR in combination can be an effective method of guarding against this.
2.4.14.6 Hazelnut
Hazelnut (Corylus avellana) has both pollen and non-pollen related allergens. Hazelnut allergens include Cor a 1,2,8,9,11,12,13,14, with the first identified allergen Cor a 1 binding IgE in 63 of 65 patients, both the Cor a 1 and 2 allergens are homonlogous to the major birch pollen allergen Bet v 1.(Ortolani et al., 2000) Pollen unrelated allergy presents as sensitivity to the allergen Cor a 8, which is related to peach allergy. (EFSA, 2014)
2.4.14.7 ELISA and PCR
A 2002 study from Holzhauser et al. involved the SureFood Hazelnut-PCR ELISA, favouring the PCR-ELISA approach over a regular polyclonal protein sandwich-type ELISA (antibody raised to corylin hazelnut protein) owing to the high stability of hazelnut DNA (Holzhauser, Stephan et al. 2002). Both methods were highly sensitive and allowed the detection of <10 ppm of hazelnut in complex food matrixes. The protein-ELISA was highly specific for hazelnut. However, some foods could lead to false-positive results at the 10 ppm level. This method showed no cross- reactivities with non-hazelnut food and when tested against 27 products containing hazelnut only gave one false negative result which contained <1 ppm for the PCR- ELISA and two for the protein-ELISA. This PCR-ELISA was compared to a protein sandwich ELISA with both methods showing an LOD of less than 10 ppm.
During food processing, oxidation processes can take place which can lead to modification of amino acids, formation of protein bound carbonyls and aggregation These modifications can influence the protein-antibody interaction upon which ELISA assays are based. To investigate this, model systems were prepared in which hazelnut proteins were oxidised under different conditions. Platteau et al. then compared the performance of four commercial ELISA kits to determine the effects of oxidation by either lipids from sunflower oil (composite foods containing hazelnut often have a high lipid content) or hypochlorous acid (used to clean factory production lines) (Platteau, Cucu et al. 2013). The ELISA kits compared for hazelnut protein detection were: Veratox for hazelnut from Neogen, Michigan Lansing, USA; Ridascreen FAST Hazelnut from R-Biopharm, Darmstadt, Germany; BioKits Hazelnut Assay from Tepnel, Deeside, Flintshire, UK; and Hazelnut Residue from ELISA Systems, Windsor, Queensland, Australia. The detectability of protein extracted from nine different commercial brands of hazelnuts, being eight virgin and one roasted product, was compared for the four kits. A number of variables were measured in this study, including the type of protein extraction but, overall, the authors found that while the presence of sunflower oil had a minimal impact on detectability, when hypochlorous acid induced oxidation, there was a significant decrease in detection. Also, all four kits underestimated the amount of hazelnut in the native reference samples (with or without oxidation) with the detection reduced to 10-70% of the actual level.
A PCR method for the detection of hazelnut DNA, was developed by Enger-Blum et al., with a practical detection limit of 10 mg/kg (Engler-Blum, Raiss et al. 2007), although there is no evidence regarding whether a commercial method was developed from this. Detecting the hazelnut specific sequence Cor a 1, 60 samples were tested and all those which were declared as containing hazelnuts were found to contain them. Some samples which claimed to contain “hazelnut aroma” did not test positive for hazelnut DNA and the authors reason that it is likely that an artificial flavour has been used in these cases. No samples which did not declare nut content were found to contain any nuts. This manuscript describes development of a method rather than a commercially available method.
Both a real-time PCR and an ELISA method were used to determine whether spiking (roasted) hazelnut paste into peanut paste would create a model of contamination of confectionery, involving peanut pastes containing different levels of hazelnuts, each analysed in three independent experiments and six real-time PCR replicates which showed good reproducibility when a calibration line was prepared for each assay (Piknova, Janska et al. 2018). The PCR used in this work was developed previously by the authors oriented to the hsp1 gene encoding for a low-molecular-weight heat- shock protein, while ELISA used in this work was the commercially available Ridascreen FAST Hazelnut (R-Biopharm, Darmstadt, Germany) (this work was carried out in 2018 and this ELISA may include different components compared to when it was tested in this work) (Piknová, Pangallo et al. 2008). The LOQ for PCR was 2 mg/kg and that for the ELISA was 1 mg/kg, the latter in accordance with previous work cited by Poms et al. (Poms, Klein et al. 2004). The authors argue that the lower cost of PCR, along with a linear calibration curve and larger quantification range are benefits of this method compared to ELISA, however, in our view, the improved sensitivity of the ELISA over the PCR (LOQ 1 ppm for ELISA) will better support the screening of foods to protect consumers who are sensitive to hazelnut.
2.4.14.8 Mass spectrometry
Corylin and oleosin have been reported as potential protein targets for determining hazelnut by LC-MS (Weber et al. 2009). Costa et al. 2014 compared in-house sandwich ELISA, real-time PCR and LC-MS/MS methods to determine hazelnut in chocolate matrices. The real-time PCR primers and probe targeted the hsp1 gene, which encodes a low molecular weight heat-shock protein with the same name, were selected from the available literature. The ELISA comprised monoclonal and polyclonal antibodies raised against hazelnut protein. The LC-MS/MS method was developed based on eight peptides from hazelnut allergens (Cor a 801, Cor a 901, Cor a 902, Cor a 903, Cor a 904, Cor a 1101, Cor a 1102 and Cor a 1103). While this is relatively early LC-MS/MS work for allergen detection, the method showed great promise with an LOD of 1 mg/kg, correlation coefficients R2 above 0.98 and recoveries for most peptides within the acceptance criteria of 70-120%.
As described above, Gavage et al. highlighted that future development of concatemer MRM mass spectrometry methods may be of benefit to food testing capabilities due to the more accurate alignment of the method with the sample extraction protocol and their initial work involved hazelnut (targeting Cor a 9) alongside egg, milk and peanut.
2.4.14.9 Conclusions – hazelnut testing methods
The reduction in ELISA kit sensitivity for hazelnut down to 1 ppm for processed material represent great improvement in this technology and suggest that despite greater cost it may be a more appropriate method for allergen detection than PCR which has a sensitivity of 2 ppm. Using LC-MS in multi-allergen detection including hazelnut detection offers a promising screening method for processed products, although limits of detection remain higher than DNA and immunological methods.
2.4.14.10 Walnut
The Walnut allergens arise either from black or English walnuts, with allergens from the former named Jug n 1,2 and the latter named Jug r 1-4. For the English walnut the major allergen is Jug r 1, the 2S albumin which is a protein similar to those found in Brazil nuts, castor beans, cottonseed and mustard seed. (EFSA, 2014) Both allergens for black walnut Jug n 1,2 are both seed storage proteins and are highly homologous to Jug r 1 and 2 respectively. (EFSA, 2014).
2.4.14.11 ELISA and PCR
The Tepnel Biokits Walnut Assay (Neogen, Lansing, MI, USA) was studied by Heick et al. (Heick, Fischer et al. 2011) in parallel with an LC-MS/MS method in a study conducted on wheat flour spiked with the seven allergens as well as on baked bread in order to compare the effectiveness of the methods on raw and processed flour.
Walnut spiked at 1000 μg/g could be detected with ELISA in flour and bread samples, although the recovery in raw flour was 530% and in baked bread it was 40%, indicating an overestimation of the allergen in raw flour as well as the impact of heating on the antigen recognised by the antibody.
Linacero et al. (Linacero, Ballesteros et al. 2016) used the AgraQuant walnut assay (Romer Labs, UK) as an ELISA test against which to validate the performance of real-time PCR tests. The paper only presents qualitative results obtained with the ELISA test on 12 commercial products, but it does demonstrate good sensitivity, with walnut detected in all the products declaring walnut as an ingredient, some other products labelled as “may contain” and all three foods with walnut not declared. These results overall agreed with those of their best real-time PCR, although the latter detected walnut in one additional product. The authors suggest that the real- time PCR method may be more reliable, but a wider range of processed foods would be required to confirm this suggestion.
Vencia et al. (Vencia, Minale et al. 2019) studied the effect of thermal treatment on the ability of two ELISA test kits to detect walnut. The selected kits were Euroclone (Pero, Italy) and Neogen (Lansing, MI, USA). The response to walnut was different between the kits, with Neogen showing higher recoveries. The work highlighted that boiling for 10 minutes and intense and prolonged roasting (180 °C, 30 minutes) showed a high influence on sensitivity of both kits, concluding that these tests may not be suitable for accurate quantification of walnut in highly processed foods.
A walnut ELISA kit from Morinaga (Walnut Protein [2S-Albumin] Kit; Morinaga Institute of Biological Science, Inc.; “walnut kit”) was the subject of an inter-laboratory study published in 2010 (Sakai, Adachi et al. 2010). The LOD and LOQ values were 0.39 ppm (equivalent to 0.16 mg/g of food sample) and 0.78 ppm (equivalent to 0.31 mg/g of food sample), respectively. The results showed good reproducibility in all processed model foods tested, good repeatability and high recoveries, concluding that the walnut kit could be used as a reliable tool for determination of walnut in foods. However, no walnut ELISA kit is currently available on the Morinaga website.
2.4.14.12 Mass Spectrometry
A study by Downs et al. (Downs, Baumert et al. 2016) used a label-free non-targeted LC-MS/MS approach evaluate changes in the solubility and detectability of allergens from roasted walnuts. The results indicated that the detection and quantification of allergens from roasted walnuts was affected differentially depending on the individual allergenic protein in question, the degree of heat treatment, and the sample preparation method. A conclusion of this work was that a much more comprehensive knowledge of food genomes is required for mass spectrometry methods to work to their full potential in the analysis of food allergens, especially those from plant foods. In addition, the properties of the individual proteins should be considered when developing MS methods for the analysis of food allergens.
A study by Xiong et al. (Xiong, McFarland et al. 2019) explored the importance of high-quality protein databases for the development of fit for purpose LC-MS/MS methods for allergen analysis in food. The utility of supplementing incomplete protein sequence databases with translated genomic sequencing data was evaluated for English walnut in a proteomics approach to identify marker peptides. As anticipated, this provided enhanced selection of candidate peptide markers and differentiation between closely related species. The authors concluded that “Future improvements of protein databases and release of genomics-derived sequences are expected to facilitate the development of robust and harmonised LC–tandem MS-based methods for food allergen detection”.
2.4.14.13 Conclusions – walnut testing methods
Commercially available immunological methods for the detection of walnuts demonstrate tolerance to processing, which is crucial to reliably detecting walnuts in food products. LC-MS methods are not currently as sensitive as these other methods, however, as multiple authors have noted, once the genome of walnut is better characterised the sensitivity of this technique may improve.
2.4.14.14 Pecan
Pecan allergy is triggered by two different proteins, Car I 1, which is an albumin seed storage protein, and Car I 4, which is a hexameric legumin seed storage protein.
2.4.14.15 ELISA
The BioFront Technologies monoclonal antibody-based direct sandwich enzyme- linked immunosorbent assay (ELISA) for pecan detection was evaluated by Liu et al. (Liu, Zaffran et al. 2019). Flours prepared from autoclaved, blanched, fried, microwaved and dry roasted whole pecan nuts were incurred into Cornflakes, sponge cakes, and sugar cookies at the 0.5-5% (w/w) level. The LOD was 0.5 ppm (± 0.2 ppm) and the LOQ was 1.5 ± 0.6 ppm. This was poorer, by a small amount, than the manufacturer reported detection limit of other ELISA kits. The intra- and inter-assay variabilities were less than 14%. The detection antibody did not exhibit cross-reactivity with 155 foods/ingredients tested at 100,000 ppm, although it registered 0.6% and 0.8% cross-reactivity with 10,000 ppm of English walnut and black walnut, respectively. The target antigen was stable against autoclaving, blanching, frying, microwaving, and roasting. The antigen was detected in a variety of food matrices with 80.5–111.6% and 22.2–154.5% recoveries for pecan-spiked and incurred samples, respectively. The assay did not yield any false negative results among tested commercial and in-house prepared samples.
2.4.14.16 Conclusions – Pecan testing methods
Low levels of cross reactivities with non-walnut foods and high sensitivity following processing suggest that ELISA techniques for pecans are robust. In LC-MS both LOD and LOQs are higher for pecan, however these are in multi-allergen testing regimes.
2.4.14.17 Pistachio
Pistachio nut is responsible for triggering IgE-mediated reactions in allergic individuals, caused by several proteins.
2.4.14.18 ELISA
The AgraQuant pistachio ELISA assay kit (Romer Labs, UK) was used by Sanchiz et al. (Sanchiz, Ballesteros et al. 2017) to validate the performance of two real-time PCR methods (based on SYBR®Green and locked nucleic acid (LNA) probe) for the analysis of commercial products. The study only reported qualitative results from the ELISA assay (presence/absence of pistachio), and it showed concordance with in- house real time PCR (Pis v 1 primers designed by the authors) methods in 12 out of 14 food products analysed. The ELISA kit (LOQ 1–40 mg/kg) detected two false positives: pesto sauce, which contains 5% of cashew nut, and chocolate with hazelnut, suggesting cross-reactivity with these two nuts. The LNA probe-real time PCR method was the more sensitive, reliable and specific of the PCR methods with an LOD of 10 mg/kg pistachio and resisted gentle thermal processing.
2.4.14.19 Conclusions – Pistachio testing methods
It is apparent that much work has been underway to develop mass spectrometry methods to detect pistachio. The commercial ELISA method represented in the literature showed cross-reactivity to other matrices, as do other commercially available ELISA kits targeting pistachio (Table 1, Appendix 1). While the MS methods have low sensitivity, this level does not match the sensitivity of ELISA kits (commercial ELISA methods purport an LOD of approximately 0.1 mg/kg), so the suitability of these methods must be assessed against eliciting levels. As determined by the EFSA ThRAll project, it may be that optimisation of the extraction buffer may improve the sensitivity of the method towards tree nut species.
2.5 Conclusions to the literature review
This literature review has considered published studies relating to methods to determine allergens and highlights the strengths and limitations of such methods. Commercial ELISA kits have historically been the preferred methods for food allergen detection and quantification, especially by the food industry and enforcement agencies for the detection of contamination levels of many food allergens, although for certain allergens (for example celery), only PCR methods are available. However, ELISA methods are susceptible to erroneous results, partly due to the modification of the allergens (proteins) during food processing which can lead to reduced recoveries. Limitations include variable sensitivities and the performance specified by the manufacturer cross-reactivity, and a potential for low levels of protein recovery. PCR methods detect DNA and not protein (of which all fourteen allergen foods are comprised with the exception of sulphites and sulphur dioxide) and are not applicable to the testing of all fourteen allergens. PCR methods also suffer from limitations due to thermal processing of foods. As highlighted by Walker et al. 2018, Mass Spectrometry for the detection of allergen proteins is a developing area, promising a number of advantages over ELISA and PCR. Mass spectrometry can be more specific (less cross-reactivity) for detection of the target protein to be quantified due to careful selection of the species-specific sequence to be detected, provides protein identity information, permits a wider linear dynamic range, is less prone to be affected by food processing and, if appropriately applied, can be used as a reference method or for the production of CRMs. However, LC-MS/MS methods currently tend not to show the levels of sensitivity of ELISA methods and can also show low recovery, depending on the extraction method used. All methods (ELISA, PCR and MS) suffer from issues in accurate quantification of allergens due to a lack of harmonised incurred reference methods.
In the absence of perfect methods which are not blighted by cross-reactivities, low sensitivities and false results, incident management would benefit from a combined method approach, as is detailed in the workflow section of this report (Section 9).
Table 1 (Appendix 1) is presented to accompany this literature review to detail the scope and the various performance data of the commercial methods which have been used by testing laboratories over the past five years in their submission of proficiency testing data to Fapas®. Much of the data in this table requires the kit manufacturers to disclose the performance data for the kit and to fully declare how performance was monitored, how test samples were prepared for method validation, which foods were included, the number of replicates of each sample tested. There is a great variation in the amount of data disclosed in the kit manual, depending on the supplier and the target allergen of the kit. Some kit manufacturers/suppliers disclose very little data, choosing to simply declare the LOD, LOQ and the units of measurement. Other manufacturers/suppliers provide additional data, for example listing recovery, precision and cross-reactivity data and providing information regarding the sample types tested during method development and whether they were incurred or raw. Some suppliers choose to disclose a comprehensive list of all of the matrices tested (for example, more than 30), others include a much shorter list (4-6 matrices), and it is therefore unknown whether a comprehensive range of matrices has been tested during the development phase and how the kit performs. Some suppliers provide no information regarding the applicable matrices for the kit.
The method of LOD determination for commercial test kits are stated in a negligible number of kits. The most simple method of determining LOD would be to analyse a buffer spiked with a low level of allergen, the simplicity of this matrix would be expected to give the lowest LOD. Alternatively a finished food may be spiked with the allergen following processing, this would provide a more reflective matrix to a real sample compared to a buffer. Finally using an incurred product requires the allergen being added before all processing in line with industry recipes to produce a final product.
This last form of test material comprises the most challenging matrix. While this form of sample would likely show the lowest recovery of the allergen (and higher LOD and LOQ compared to ‘in buffer’ experiments) due to the effects of processing on the integrity of the proteins under investigation, it represents a ‘real’ food scenario and provides testing laboratories with the most comprehensive information when selecting an appropriate test kit for a test material. If data were more transparent, test kit users could compare the ‘real world’ capability of the test kits available to better inform regarding kit suitability.
While certain suppliers state in their manuals that validation data is available on request, others do not. In the interests of fairness, it was agreed that Table 1 (Appendix 1) would therefore be prepared from information provided in the user manuals. As highlighted in this table, there is often not a great deal of transparency regarding many of the validation parameters. This is a gap identified by this project. It would be beneficial to testing laboratories if full validation data were declared by kit manufacturers so that testing labs have a basis upon which to select methods which they can then perform some basic in-house performance measurements to determine suitability to their food types of interest before investing heavily in testing.
Further limitations to food allergen testing capabilities are discussed throughout the various sections of this project and in the conclusions of this project.