Our Food 2022: An annual review of food standards across the UK
An annual review of food standards across the UK.
In last year’s Our Food report, we concluded that UK food standards in 2021 had held firm despite the disruptive effects of the COVID-19 pandemic.
There can be little doubt that 2022 was a year of major upheaval in the UK food system For consumers, grocery prices rose faster than the rate of inflation, driving the biggest increases in our shopping bills for a generation For businesses, a combination of war in Ukraine, harvest failures, labour shortages and increased production costs added pressure to a system still managing the fall-out of the COVID-19 pandemic and adjusting to a new post-EU exit landscape.
In last year’s Our Food report, we concluded that UK food standards in 2021 had held firm despite the disruptive effects of the COVID-19 pandemic and the uncertainties presented by the end of the EU exit transition period. Yet we also acknowledged the challenges that lay ahead: a likely surge in food prices, the absence of import controls on food from the EU, and the decline in local authority resourcing. These challenges were not exclusive to 2021 – they continued to cause concern in 2022. We pick up on these themes again in our latest report as we delve into the challenges that remain beyond the height of the COVID-19 pandemic.
Every point of failure in the food chain, particularly when it relates to the authenticity and safety of what we eat, has the potential to cause harm or distress. The data in this annual report reminds us that while our food system has many strengths, it is not infallible. Maintaining the public’s trust and confidence in our food system begins with transparency and openness: that is, by being honest about how standards are changing, where they may be vulnerable, and how we need to act together to improve things for the future.
By laying out the facts and sharing all the available data and evidence we hold across our respective organisations, we hope this year’s report once again shines a light on the areas of strength and weakness in our food system. How we respond is the challenge for us as regulators as well as government, industry, enforcement authorities and consumers themselves.
Professor Susan Jebb, Chair, The Food Standards Agency

Heather Kelman, Chair, Food Standards Scotland

This report looks at whether UK food standards improved, declined or stayed the same in 2022.
Introduction and scope
At a glance
This report looks at whether UK food standards improved, declined or stayed the same in 2022. It is the second year Food Standards Agency (FSA) and Food Standards Scotland (FSS) have come together to produce this annual review.
When we launched Our Food, we outlined the types of standards the report may consider, which are:
1. Food and feed safety (including allergen management) – that is, ensuring the product is safe to consume, or, in the case of feed, safe for introduction into the food chain. A number of factors are taken into account when proposing safety standards, including advice from FSA and FSS risk assessors and wider experts as well as other aspects such as the principles that may determine consumer acceptability of risk.
2. Other standards that support consumers and provide assurance – this includes provenance and authenticity, production standards (for example, animal welfare and sustainability), composition and nutritional content, labelling and advertising of food, and other information that enables consumers to make informed choices based on the values that are important to them.
To answer these questions, the report draws on a range of evidence, including local authority data, government statistics, border checks notifications, and FSA and FSS’s own sampling and surveillance activity. We explore this data from a UK-wide perspective, as well as breaking it down across the four home nations where it is meaningful to do so.
In this year’s report, we look at these issues in four ways by:
1. Examining the impact of the economic environment on consumer choice and behaviours: this includes charting the potential effect that the cost of living crisis is having on people’s ability to access a healthy and safe diet (see chapter 1).
2. Looking at how the UK food system is influenced by international factors and at the safety of imported foods: this includes the shifts in international trade patterns and the changing ways in which we manage the safety of the food we import (see chapter 2).
3. Reviewing the current landscape of business compliance: this looks at how hygiene standards have been maintained, according to the latest data, and whether enforcement authorities have the resource and capacity they need to cope with rising demands (see chapter 3).
4. Assessing available evidence on the safety and authenticity of our food itself: this draws on the intelligence gathered from FSA and FSS’s food incidents notifications data, the national food safety and authenticity surveys carried out over this period, and the work of our two national food crime units (see chapter 4).
Key findings for 2022
2022 was a deeply challenging year for consumers. Food prices rose at a faster rate than inflation for much of the year and were accompanied by sharp increases in other household expenses, adding to the strain on people’s finances. Overall spending on in-home food reduced by 6.9% in 2022 compared to 2021. Oils and spreads, dairy and alternatives, and fish, eggs, meat and other proteins experienced faster price rises than other Eatwell Guide food groups - all of them essential elements in many people’s diets. FSA and FSS focus group research showed people across a wide range of income brackets were making compromises such as swapping out premium brands for budget ranges or eating out less in a bid to cut costs.
A record number of households – one in five across England, Wales and Northern Ireland – were classified as food insecure in 2022, meaning that their diet and/or food intake had been limited in some way due to their financial or personal circumstances. Similar evidence of increased food insecurity can be seen in Scottish data. A minority of people across the UK also reported cutting corners on food preparation and hygiene, including reducing their use of fridges and freezers or reducing the length of time they cooked their food, to reduce energy bills.
The global food system had to adapt to abrupt shifts in trading patterns as traditional supply lines were disrupted for some commodities. Though the available data from border checks does not indicate any shift in the safety of goods arriving from outside the EU, the UK has increased the number of high-risk foods now subject to enhanced checks at the border, partly in response to concerns about pesticide residues and other toxins in products from certain countries. As EU imports are not currently checked, we cannot comment authoritatively on the safety of goods arriving from the EU.
As we develop new trading partnerships, FSA and FSS will continue to advise government on whether new free trade agreements (FTAs) uphold statutory food safety protections. To support the public’s interest in understanding the wider production values of imported food, FSA and FSS are also exploring how to address the lack of robust, international data on issues such as animal welfare and environmental and ethical production standards.
Although food businesses have also experienced sharp rises in their costs, the latest inspection data suggests this has not translated into any detectable reduction in compliance with food hygiene standards. Based on the latest inspection data as at the end of 2022, the vast majority of food businesses had met food hygiene standards at the point when they were last inspected.
Meanwhile the number of local authority inspections carried out returned to pre-COVID-19 pandemic levels in 2022. This is an important milestone, but it should be noted there were still approximately 39,500 unrated businesses at the end of 2022 across England, Wales and Northern Ireland. Adequate resourcing is vital for ensuring food hygiene rules are upheld, but the FSA’s analysis of local authority staffing shows there are approximately 14% fewer food safety posts being funded across England, Wales and Northern Ireland compared to a decade ago – and even where these posts do exist, over 13% are vacant.
The situation in Scotland is more pronounced, where there are 25% fewer food safety posts than in 2016. There have also been reductions in food standards and food law officer posts across the UK, further challenging the ability of local authorities to carry out essential checks on food authenticity, composition and information standards. In 2022, both FSA and FSS had to take additional measures to address the ongoing resourcing challenges being faced by the veterinary profession – particularly in the recruitment of Official Veterinarians (OVs).
Analysis of reported food incidents and foodborne disease outbreaks, the results of national sampling programmes delivered by FSA, FSS and Defra, and the available intelligence on food crime do not suggest there has been any significant change in food safety and authenticity standards during 2022. However, we are concerned about ongoing breaches in food composition labelling in relation to allergens. To address this, further collaboration with local authorities and food businesses will be required.
Detailed chapter-by-chapter outline
This year’s report is made up of four chapters, each focusing on a different factor affecting our food system in 2022 We have listed the key points from each of these below.
The nation's plate
Our first chapter explores whether food price inflation and other cost of living pressures may have affected consumer choice and behaviour. While it is not yet possible to provide detailed analysis of actual changes in our dietary intake during this period, we look at what the economic data reveals about the impact of inflation on different food types and what FSA and FSS consumer research tell us about the public’s attitudes and perceptions of how financial pressure is affecting their relationship with food.
1. Food price inflation made a substantial contribution to the cost of living pressures affecting UK households. Data from the Office for National Statistics (ONS) shows food price rises averaged out at 11% over the course of 2022, with a year-on-year rise of 17% by the end of December 2022. This represents the biggest rise in the cost of our food since 1977. While every part of our shopping basket has been affected, our analysis of products in the Eatwell Guide categories shows that certain food types – including oils and spreads, dairy and alternatives, and fish, eggs, meat and other proteins – felt the sharpest rises. Foods high in fat, sugar and salt, as well as fruit and vegetables, experienced a lower rate of inflation than others.
2. Meanwhile the overall amount that consumers spent on food fell for the first time in a decade. The £8 billion (or 6.9%) reduction in our inhome food spend reported in 2022 compared to 2021 may partly reflect the increased spending during the pandemic, but it is also likely to be due to the strain on household food budgets caused by wider cost of living pressures. This is supported by evidence from FSA and FSS focus groups which reported that many people across a range of income brackets said they had been swapping out premium brands for cheaper alternatives or using budget retailers. Others also reported cutting down on perceived ‘luxury’ items like fresh meat and other fresh produce.
3. Food prices became the number one food issue of concern for UK consumers in 2022, according to FSA and FSS research. During the course of the year, around 41% of adults questioned in Scotland said they were worried about affording food compared to 25% in 2021 - while in England, Wales and Northern Ireland, the rate of public concern about food prices increased from 22% in 2021 to 34% in 2022.
4. One in five households (20%) in England, Wales and Northern Ireland were classified as food insecure in 2022 according to FSA research – the highest rate recorded since it began tracking in 2016. 10% of households were classified as having low food security, which means they reported eating reduced quality, variety or desirability of diet, but with little or no indication of reducing their food intake. A further 10% were classified as having very low food security, reporting multiple indications of disrupted eating patterns and reduced food intake. There was also an increase in the number of adults skipping meals and reducing portion sizes to save money across the UK. There is also evidence that some consumers have altered the way they store and cook their food in an effort to reduce costs.
Going global
This chapter describes where we are sourcing our food from by examining how the pattern of food imports changed during 2022. It looks at the latest available evidence from border checks and other safety notifications to examine whether the safety of imported food is being maintained. We also look ahead at the impact of new FTAs on our food system, and how we collectively build a more authoritative way of tracking and measuring imported food standards for the future.
1. Analysis of trade data shows there was a 5.6% increase in the volume of food imports into the UK compared to 2021 as global markets returned to normal after the COVID-19 pandemic. The amount of food the UK buys from other countries is now in line with the average seen over the past decade. There has been little change in the top 10 countries we source most food from, but greater volatility further down the list. There has been a notable drop in imports from Ukraine, Russia and certain Baltic countries and a sharp rise in imports from some South Eastern European countries, particularly Romania and Bulgaria.
2. Available data on compliance checks carried out at the border is restricted to imports from non-EU countries due to the continued absence of EU import controls. Data shows that there have been no significant changes in compliance failure rates in recent years. However, the UK now has responsibility for defining its own list of high-risk foods which are subject to more stringent controls, and has decided to increase checks on certain products in response to risks associated with pesticide use, contamination with mycotoxins and the rise in the presence of Salmonella in some parts of the world.
3. The UK has signed FTAs with Australia and New Zealand during 2022. FSA and FSS provided advice to the Government as part of Section 42 of the Agriculture Act 2020. In our response, we concluded that these agreements with Australia and New Zealand upheld statutory food safety protections for the consumer. For the New Zealand agreement, we also assessed whether it maintained statutory protections for nutrition and concluded that it did.
4. The FSA commissioned an expert report from the consultancy ADAS, looking at how it might identify and gather better information on imported food production standards. Although this underlined the lack of available data, we will continue to explore how it can meet the public’s interest in this information, working in partnership with government and industry.
Keeping it clean
This chapter reviews the latest available data on food hygiene standards across a range of food and feed businesses. It looks at whether there have been any changes in food hygiene ratings for restaurants, cafés and other places that serve food, as well as the level of compliance in dairy, meat and animal feed establishments. In the wake of the COVID-19 pandemic, it also explores how effectively enforcement authorities have managed to restart their system of official controls and whether they have sufficient skilled resource and capacity to meet demand.
1. Data from the two national food hygiene rating schemes – the Food Hygiene Information Scheme (FHIS) and the Food Hygiene Rating Scheme (FHRS) – shows that the vast majority of food businesses had satisfactory or better hygiene standards based on inspection data as of 31 December 2022. Just over three-quarters (75.7%) of food businesses in England, Wales and Northern Ireland achieved a top rating of 5 for hygiene, while 2.9% of food establishments achieved a rating of 2 or below meaning they require improvement, major improvement, or urgent improvement. Across the whole of the UK, these figures show little or no change compared to the previous year.
2. Similarly, the available data on hygiene compliance in dairy establishments shows the vast majority in England, Wales and Northern Ireland continued to operate safely: 98.1% of farms and establishments in England and Wales, and 99.1% in Northern Ireland achieved satisfactory or good compliance levels. In Scotland, there is some evidence of the re-establishment of hygiene controls after the COVID-19 pandemic, with an increase in the number of inspections, guidance letters and instances of written advice being issued in 2021/22. No Hygiene Improvement Notices (HINs) were issued between April 2018 and March 2022.
3. Analysis of workforce data over the last decade shows that the number of food safety allocated posts[1] supported by local authorities in England, Wales and Northern Ireland has fallen by nearly 14% since 2011/12. Resourcing issues have been compounded by challenges in filling these roles, with approximately one in seven (13.7%) vacant. In Scotland, the shortage is more severe as the number of occupied food law posts fell by just over 25% compared to 2016/2017.
4. These reductions in local authority staffing also extend beyond food hygiene. There has been a 45.1% drop in the number of food standards officer allocated posts from 2011/12 to 2021/22 in England, Wales and Northern Ireland. A survey published in 2020[2] found that trading standards officer staffing levels fell between 30% and 50% across the UK between 2008/9 and 2018/19. It also found that just over half of the local authorities in the UK did not believe they had sufficient expertise to cover the full range of trading standards responsibilities, and that the ageing trading standards workforce was a threat to future professional capacity.
5. As the whole veterinary profession continues to face challenges in capacity, both FSA and FSS have felt the ongoing effects in the recruitment of OVs who oversee inspections in meat establishments – with a reported 27.4% fewer people joining the profession between 2019 and 2022 (RCVS, 2022), a notable increase in vets leaving the UK-practising category (RCVS, 2021) and a reluctance from veterinarians graduating from UK universities to take on public health roles. Recruitment from overseas remains an essential route, and this is supported through the option of Royal College of Veterinary Surgeons (RCVS) Temporary Registration. Both agencies are working to reduce reliance on temporary registration schemes as quickly as possible.
Safe and sound
The final chapter brings together data and intelligence collected by FSA and FSS to assess the safety and authenticity of the food we buy. It includes analysis of the food incidents data and foodborne disease outbreaks, the national food sampling surveys conducted across the UK, and the patterns of criminal investigations and ‘disruptions’ led by our two national food crime units to tackle fraud, adulteration and other types of criminal behaviour within the food chain
1. The total number of reported food incidents across the UK decreased slightly in 2022 compared to 2021 but remained broadly consistent with long-term trends. Meat and meat products continued to be the food category most often associated with food incidents. The leading cause of food incidents was pathogenic microorganisms, accounting for 29% of all UK cases. The number of incidents relating to undeclared or incorrectly declared allergens has returned to preCOVID-19 pandemic levels, following a decline in cases during 2020 and 2021.
2. The rate of most foodborne diseases reverted to pre-pandemic levels during 2022. However, reported cases of Shiga toxin-producing Escherichia coli O157:H7 (also known as STEC O157) reached their highest level since 2015, largely as a result of a major outbreak that was detected in the summer of 2022. The routine use of whole genome sequencing (WGS) is now helping public health authorities to identify more clusters of foodborne disease and has allowed the UK’s food safety and public health authorities to play a leading role in detecting domestic and global outbreaks.
3. There was no overall change in the combined number of Allergy Alerts issued by the UK’s food agencies in 2022 compared to the previous year. The reported increase (of 25%) in the number of Product Recall Information Notices (PRINs) is largely due to changes in how these figures have been collated this year, rather than any increase in overall number of notices being issued. Neither FSA nor FSS were required to issue a Food Alert for Action (FAFA) notice – the most serious category of food incident alert – in 2022.
4. FSA and FSS’s national sampling programmes play an important role in tracking areas of risk and vulnerability in our food system. The FSA’s targeted survey 2022 showed no statistical difference in the level of non-compliant results from previous years. Around a third of the failures in testing related to labelling breaches. The findings also revealed further potential public safety issues relating to allergen declarations, reinforcing the continued need for regular checks by local authorities and businesses.
5. Sampling of oat and oat-based products within FSS’s sampling programme did not detect unsafe toxins or heavy metals. However, there were instances of undeclared allergens in the free-from products tested, and a significant proportion (18%) of minced beef samples either had a higher fat content or a lower meat content than was declared on the packet. It should be emphasised that FSA and FSS surveys are targeted at areas of known risk and therefore carry a greater likelihood of identifying unsatisfactory results. They should not be seen as representative of overall UK food standards.
6. The two national food crime units carried out a range of investigations throughout 2022 in line with their respective strategies. In England, Wales and Northern Ireland, the National Food Crime Unit (NFCU) has been heavily focused on tackling threats in the red meat sector, the diversion of animal by products into the food chain, and pursuing suppliers of dangerous non-foods sold for consumption. In Scotland, the Scottish Food Crime and Incident Unit’s (SFCIU) investigations under common law included a focus on suspected fraud in relation to counterfeit alcohol as well as traceability and adulteration in the meat supply chain and illegal slaughter.
7. Both the NFCU and SFCIU work closely with industry, local authorities and other enforcement agencies on other activities designed to disrupt or deter criminal behaviours. In England, Wales and Northern Ireland, a sizeable amount of the NFCU’s disruptions included action against dangerous non-foods through the removal of the illegal dieting drug 2,4-Dinitrophenol (DNP) from online sale, as well as ongoing action against criminality in the red meat sector and the diversion of animal by-products into the food chain. In Scotland, a significant number of SFCIU-led disruptions similarly centred on criminality affecting meat and meat products. It also tackled fraud involving Scottish grown tea, confectionary and honey and made a series of unannounced visits with partners to pubs and other licensed venues to check for counterfeit products and deter any future criminal behaviour.
8. Both food crime units are closely monitoring the impact of price inflation, the legacy of the COVID-19 pandemic, environmental changes and the ongoing Ukraine conflict on criminal behaviour. No evidence was detected in food surveillance or sampling activity, or in the data made available via the Food Industry Intelligence Network (FIIN), to suggest there has been any increase in authenticity issues attributable to criminals responding to these big picture issues. However, it is recognised that the current economic conditions may present further opportunities for criminality within the food chain.
Setting this year's report in context
Just as it began to recover from the upheavals of the COVID-19 pandemic, our food system was hit with a further set of challenges in 2022. Rising prices, extreme weather, labour shortages, post-EU exit changes to UK trading relationships and border controls, and the war in Ukraine all created volatility and change, playing an important role in the story of our food in 2022.
Households in the UK faced increased prices across a wide range of goods and services, while incomes failed to keep up with the pace of increasing inflation. Between 2021 and 2022, electricity, gas and other fuel prices increased by 4%, house contents insurance by 23%, and operation of personal transport by 15%, summarised in figure 1.
Data from the ONS shows that food price rises averaged out at 11% over the course of 2022, with a year-on-year rise of 17% being reported by the end of December 2022. This represents the biggest rise in the cost of our food since 1977. As figure 2 shows, for the first half of the year, consumers experienced food inflation pressures similar to the overall rate of inflation, but the second half of the year saw food inflation rising much faster.
Figure 1: Percentage change over 12 months of inflation by commodity type

Source: Consumer price inflation tables - Office for National Statistics
Some of the drivers of food price inflation are summarised in figure 1 – yet the extent to which individual foods have been affected by these issues varies considerably, which helps to explain why some products experienced much sharper rises than others, as we will see in chapter 1.
For example, according to the Agriculture and Horticulture Development Board (footnote 1) (AHDB), milk prices have been sharply impacted by increases in farmer input costs and threats of milk shortages. The steep rises in margarine prices are likely to have been caused by a shortage of sunflower oil (due to the conflict in Ukraine), increased market demands (driven by increases in butter prices as a result of milk shortages), export restrictions on vegetable oils, bad weather conditions and increased demand by industry for biofuels as crude oil prices increased.
Egg producers, meanwhile, have suffered as a result of rising energy prices and costs of chicken feed, as well as an outbreak of avian influenza, which led to an egg shortage as some UK farmers were forced to cut production. Furthermore, 70% of the eggs we buy in the UK are free-range, but with only 13% of eggs in the EU produced in this way, the option to fill the gaps on UK supermarket shelves with imports was limited (footnote 2), driving the price up.
Figure 2: Percentage change over 12 months (2022) - Food inflation rates vs overall Consumer Prices Index including owner occupiers’ housing costs (CPIH)

Source: Consumer price inflation tables - Office for National Statistics
An important theme running through this report is the Russian invasion of Ukraine, which contributed to big rises in energy costs in early 2022 and affected global access to vital commodities such as grain, cereals and cooking oils as military action prevented crops from being harvested while Black Sea blockades in the spring and summer of 2022 impeded international shipping routes. This has intensified the rises in production costs felt by UK businesses and contributed to some shifts in where we source our food from, as we discuss later in chapter 2 of this report.
Last year also saw several important milestones in the development of the UK’s post-EU trading relationships, including the signing of FTAs with Australia and New Zealand, and the introduction of new pre-notification requirements for high-risk EU food and feed. However, there have been further delays in the introduction of import controls for EU food and feed, with the new Border Target Operating Model now due to take effect in 2024. The UK’s departure from the EU has also had a material impact on the recruitment of key professionals involved in supporting food safety controls, including the supply of OVs (see p76).
Finally, although the last COVID-19 pandemic restrictions were lifted in February 2022, the disruptive effects of the pandemic continued to affect the food system throughout the year, not least in the resourcing and management of food hygiene controls. The efforts of local authorities and other food enforcement authorities in recovering the ground lost during the pandemic are documented in chapter 3 and reinforce the need to ensure adequate resourcing is in place to maintain effective consumer protections.
An overview of key factors influencing food prices in 2022
A range of factors have contributed to the changes in the cost and availability of our food, many of them associated with the war in Ukraine, the UK’s departure from the EU, and the knock-on effects of the COVID-19 pandemic. These include:
Adverse weather
The UK experienced one of the hottest and driest summers on record in 2022, severely impacting domestic crop yields. The intense heat also affected harvests in parts of Europe, pushing up the cost of olive oil, vegetables such as cucumbers and parsnips, and some soft fruits.
Energy and transportation costs
Like UK households, food producers also experienced surges in their energy and fuel bills, making it more expensive to produce and transport food. As with the increases in other commodity prices, these costs were passed onto the consumer through higher prices.
Commodity prices
The price of key commodities for the food industry also rose steadily, adding to producers’ costs. This included sharp increases in the cost of fertiliser, rapeseed and sunflower oil, and cereals such as wheat and maize – many of which were directly affected by Russian blockades of Ukrainian ports.
Labour shortages
The food industry has also been hit by labour shortages. UK farmers, for instance, faced a chronic shortage of seasonal workers during the summer of 2022, as nearly two thirds of all seasonal visas had previously been issued to Ukrainian workers.
This chapter explores what we know so far about the impact of cost of living pressures on our ability to access a healthy and safe diet.
Consumers and food standards
At a glance
In this chapter, we look at:
- how inflation has affected the cost and affordability of different foods
- how food choices, priorities and behaviours have changed
- what impact this is having on our ability to access a healthy diet
Introduction
2022 was a tough year for consumers UK food and drink prices rose at the fastest rate since 1977, wages fell in real terms, and there were steep rises in fuel and energy prices, and the cost of borrowing, all of which compounded the financial pressure on households.
But what difference did this make to people’s behaviours and thoughts about food? Can we detect any changes in what we eat, how we cook and how we shop? This chapter explores what we know so far about the impact of cost of living pressures on our ability to access a healthy and safe diet.
The impact on the consumer
Food inflation affects different people in different ways. Although the media and other commentators often use headline inflation figures to describe the rate at which food prices are rising, these are calculated by looking at the average changes in price across a selection of typical items from our shopping baskets.
However, the extent to which someone is personally affected by inflation – and how that may in turn influence what they eat – depends on the foods they buy and how much those items’ prices have changed. So, before we look at our dietary choices, it is useful to look at how price rises vary across different food categories to give us a more nuanced picture of the impact on consumers.
For this report, we have chosen to build our analysis around a selection of commonly bought items, which we have broken down by Eatwell Guide categories (figure 3). This shows that three food categories experienced the sharpest rises in price when averaged out over the course of the year:
- oils and spreads
- dairy products such as milk, yoghurt and cheese, as well as non-dairy alternatives
- fish, eggs, meat and other proteins (footnote 1)
The breakdown also shows that foods high in fat, salt and sugars experienced the lowest rate of inflation (8%), closely followed by fruit and vegetables (9%).
Figure 3: Average percentage 12-month year on year increase in costs during 2022 for Eatwell guide categories

Source: ONS Consumer Prices Index including owner occupiers' housing costs (CPIH) January 2022 to December 2022.
Of course, analysing these differences only gives us part of the story. Our ability to adapt to any increases in price will also depend on how cheap or expensive something is to begin with, and how much and how often we eat it. Price rises in staples such as pasta, eggs, milk and bread, are likely to be felt more keenly by households than luxury or occasional items.
From a healthy eating perspective, it is also important to consider the amount of products within each category a person needs to consume as part of a balanced diet: hence, although we can see that fruit and vegetables experienced lower inflation than other categories, consumers would need to buy a lot more of them if they want to meet government healthy eating guidelines.
All of this needs to be understood in the context of an individual’s wider financial position: in cases where people’s household budgets are already precariously balanced, as we will see, the personal impact of these differing inflationary effects can be especially harsh.
How much are we spending on our food?
A sign of how difficult things became for households can be seen when we look at how much people spent on food overall in 2022. With food prices going up sharply, it would be natural to assume that we would see people spending more on food. In fact, we saw the opposite. Increased financial pressure in areas where people have less control over what they spend (such as housing or energy costs) means that spending on in-home food fell in 2022, even though total household expenditure itself increased (footnote 2).
In 2021, out of a total household spend of £1,276 billion, the UK spent 9.5% (£120 billion) on in-home food and non-alcoholic drinks and 1.9% (£24 billion) on alcoholic drinks. In 2022 we spent over £8 billion less (a total of £112 billion) on in-home food and non-alcoholic drinks and £2 billion less on alcoholic drinks (a total of £22 billion) compared to the previous year, a respective drop of nearly 6.9% and 9.6% (footnote 3).
The percentage of disposable income spent on food outside the home (restaurants and café meals, takeaways, contract catering, and canteens) in 2022 was higher than in 2021 but 37% below pre-pandemic levels (2019) across all income groups. While 2021 showed an unusually large dip in spending on food outside the home, which has slightly recovered for 2022, the overall trend is in line with consumers changing their spending habits due to the increased cost-of living[6].
This is the first time in a decade we have seen a year-on-year reduction in in-home spend on food and drink. Although in-home expenditure on food rose particularly sharply in 2021, likely due to the unique conditions we experienced during the COVID-19 pandemic, we are now seeing a levelling off to pre-pandemic levels.
There are some stark dividing lines between different income groups. When we look at how much of people’s disposable income was spent on in-home food (figure 4), we find that lower-income households now spent more than 16% of their weekly budget on in-home food. By comparison, the highest-income households spent just 5% of their weekly budget on in-home food.
An indication of how this may be affecting some people’s ability to access healthy food is found in the Food Foundation’s 2023 Broken Plate Report. According to its analysis, which covers 2021 to 2022, the poorest fifth of UK households would need to spend 50% of their disposable income on food to meet the cost of the Government’s recommended healthy diet, whereas the richest fifth would only need to spend 11%.
Figure 4: Percentage of disposable household income spent on in-home food by income deciles in financial years 2020 to 2022

*Each decile represents one tenth (10%) of UK households. The information for the lowest (or first) decile is collected differently from the rest and represents the 20% of UK households with the lowest income. The highest decile represents the 10% of UK households with the highest income.
This compares to 43% for the poorest fifth and 10% for the richest fifth reported a year earlier in the 2022 report, suggesting that it has become harder for the most deprived households to afford a healthy diet. The latest report also suggests that healthier foods are over twice as expensive per calorie than less healthy foods, which makes it even more challenging to purchase and consume a healthy diet.
If we factor in the additional price inflation seen last year, it is reasonable to conclude that pursuing a healthy diet is now likely to require an even higher proportion of disposable budget for low-income households. With other non-discretionary costs also rising, this is likely to be contributing to a widening of dietary inequalities, which may impact on the already significant pressures on the NHS.
How did price rises affect our priorities and behaviours?
Understandably, the financial environment strongly influenced people’s mindset and attitudes to food in 2022.
When asked about a range of food-related issues, food prices rose to become the number one food issue of concern for consumers across England, Wales and Northern Ireland (footnote 4) (figure 5). For these parts of the UK, this is the first time food prices have been the most commonly-reported concern since tracking began in 2020, surpassing other issues such as food waste, animal welfare and the amount of fat, sugar or salt in food. In Scotland, food prices also became the number one concern for consumers in December 2021 and remained at the top throughout 2022 (footnote 5) (figure 6).
Figure 5: The top reported food concerns for consumers in England, Wales and Northern Ireland

Source: FSA Food and You 2 survey - Wave 3 (conducted April to June 2021) and Wave 5 (conducted April to July 2022).
Figure 6: The top reported food concerns for consumers in Scotland

Source: Food in Scotland Consumer Tracker - Wave 13 (conducted December 2021) and Wave 15 (conducted December 2022).
As general concerns about food prices increased, so too did people’s anxieties about affordability of food. In England, Wales and Northern Ireland, worries about being able to afford food rose to a peak of 40% in September 2022, before dropping slightly during the autumn and winter. Although differences in how the data is collected make it difficult to make a direct comparison, the data for Scotland shows a similar picture: again, around 40% of adults reported that they were worried about being able to afford enough food in December 2022.
These financial concerns appear to have affected how people shopped and ate. Many consumers reported swapping out preferred brands for cheaper alternatives, changing the type of foods they ate, eating out less, and ordering fewer takeaway meals. In the FSA’s Food and You 2 survey, those who reported making changes to their eating habits in the last 12 months were asked the reason or reasons for making these changes. The most common answer was financial (69%) followed by health concerns (47%). In Scotland, two-thirds (67%) of those who said they had worried about affording food over the previous 12 months said they had eaten out less often while 5% said they had fewer takeaways.
Food swapping behaviours
England, Wales and Northern Ireland - Around a third of respondents reported changing the food they bought (34%) or where they bought food from (33%) to cheaper alternatives in the last 12 months (April-July 2022).
Scotland - Almost half of respondents (46%) reported swapping brands for cheaper alternatives more often and 37% had bought reduced to clear food items more often in the last six months (December 2022).
Cutting down on takeaways and eating out
England, Wales and Northern Ireland - 47% of respondents reported eating out less, and 41% reported eating fewer takeaways in the last 12 months when surveyed between April and July 2022 (Food and You 2, Wave 5).
Scotland - Over half of respondents (56%) in Scotland reported eating out less and 50% reported eating fewer takeaways in the six months leading to December 2022 (Food in Scotland, Wave 15).
Similarly, in-depth focus group research conducted by FSA and FSS in late 2021 and early 2022 explored the lived experiences of UK consumers, showing the changes that many were forced to make as their budgets became more stretched.
The research reveals that the impact of cost of living pressures was not confined to the lowest income groups: it found that across different income brackets, people were swapping out premium brands for cheaper alternatives or using budget retailers instead of their regular supermarket.
People also perceived higher-quality food as more expensive and felt that buying cheaper foods meant they had to make compromises on food quality, health and nutrition.
Yet other research suggests that the prices of cheaper own brand and budget ranges went up faster than the branded ranges. Analysis by the consumer watchdog Which? shows that throughout 2022 own-label budget and own-label branded foods went up by over 18% compared to 13% for branded goods. While the baseline price of many of these ranges is cheaper than the premium brand, the increase is likely to have hit the most financially vulnerable groups hardest.
As I’ve gotten older, I really have noticed how horrible cheaper food is I wish that they would sell food that is accessible to everybody so that poor people could eat things like salmon for example there’s no doubt about it in the long run, you eat cheap stuff, you get ill.
I try to purchase products which are on offer or multi-buy deals This allows me to buy higher-quality food for a lower price… This is how I wish things would change - deals and offers were on more healthy foods than junk foods.
FSA and FSS’s own qualitative research supports this: it shows that for some households every penny used to buy food is carefully budgeted, and a relatively small increase within a food budget that is already under huge pressure represents a major issue.
If it’s something that’s a wee bit more expensive, I would indulge, to have the quality of it Then I’m willing to pay the price for the quality, but I think I’m getting to the stage in the current climate where the quality’s not coming with the price You know, the lower items are coming with high-quality price tags, but high-quality’s not being delivered.
Food insecurity
What does this all mean in practice? One of the most important measures showing how all of this has affected people’s diet and food choices is the proportion of households now defined as being food insecure.
The FSA’s Food and You 2 research uses the United States Department of Agriculture (USDA) measure of adult food security:
- high food security means there are no reported indications of food-access problems or limitations.
- marginal food security means there are one or two reported indications – typically of anxiety over food sufficiency or shortage of food in the house, and little or no indication of changes in diets or food intake.
- low food security means there are reports of reduced quality, variety, or desirability of diet, but little or no indication of reduced food intake.
- very low food security means there are reports of multiple indications of disrupted eating patterns and reduced food intake. Those with high or marginal food security are referred to as “food secure”.
Those with low or very low food security are referred to as “food insecure”.
In the FSA’s survey conducted between April and July 2022, it was found that:
- one in five (20%) households across England, Wales and Northern Ireland were defined as food insecure, with around half of these (or one in ten households overall) classified as having very low food security.
- 13% of households were shown to have marginal food security.
This is the highest level of reported household food insecurity since tracking began in 2016 (footnote 7).
Food security exists when all people, at all times, have physical and economic access to sufficient, safe and nutritious food that meets their dietary needs and food preferences for an active and healthy life
The evidence also shows that some groups are more at risk of food insecurity than others (figure 7). For example, in England, Wales and Northern Ireland those with a long-term health condition are nearly twice as likely to be food insecure than those without a long-term health condition.
Other groups that are more likely to report food insecurity include younger adults, households with children under 16, and unemployed or low income households. People with food allergies are also more likely to report food insecurity, and recent FSA research indicates that adults with a food allergy spend more on food on average compared to those without a food allergy.
And there is significant regional variation too: 25% of those in the north-west of England and 25% of those in Yorkshire and the Humber are food insecure compared to 13% of those in the south-east and 15% of those in the south-west of England.
Figure 7: Who is most vulnerable to food insecurity?
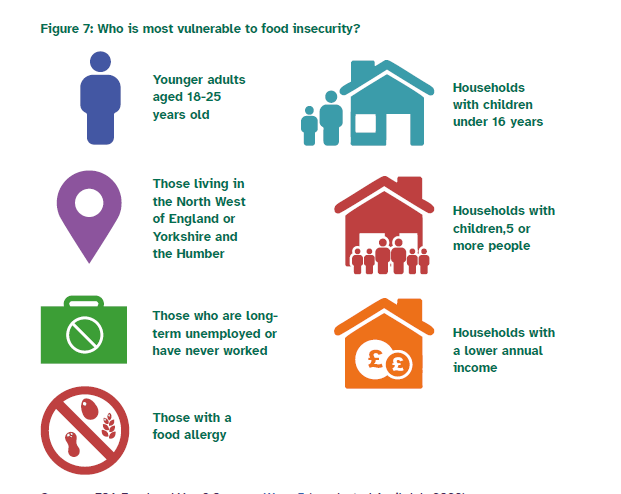
Source: FSA Food and You 2 survey - Wave 5 (conducted April to July 2022)
To give us a sense of the impact this has on people’s lives, the FSA’s monthly tracking data shows that the proportion of adults skipping meals or cutting the size of meals because they did not have enough money to buy food rose during much of 2022 (figure 8). On average, 26% of people did so in 2022, compared to 20% in 2021 (footnote 8). In Scotland, 22% of adults skipped a meal due to lack of money in 2022, compared to 20% in 2021.
Figure 8: Proportion of respondents reporting they have cut down on portion size/ skipped meals due to money [FSA figures for England, Wales & Northern Ireland]

*An ‘*’ is used to indicate months with a statistically significant difference to the previous month.
Source: FSA Consumer Insights Tracker (March 2022 to March 2023)
The impact on the population's health and diet
As last year’s report made clear, for decades our diets have contained too much salt and saturated fat, too many free sugars (footnote 9) and not enough oily fish, fruit and vegetables, and fibre. These findings are also reflected in the most recent Scottish Health Survey for 2021 (figure 9).
Figure 9: Key findings from the Scottish Health Survey 2021

Source: Scottish Health Survey 2021
It is too soon to say what the impact of cost of living pressures will be on people’s dietary choices, not least because we do not have the latest data from the National Diet and Nutrition Survey, the most comprehensive data source on the types and quantities of food consumed in the UK as a whole.
What we do know from research conducted in early 2022 is that most people (70%) feel confident that they know what a healthy nutritious diet is. This was typically associated with fresh, minimally-processed food that offers a good variety of nutrients. These included fruit and vegetables, traditional staples such as milk and bread, and good quality meat. In contrast, unhealthy foods were often perceived to be more processed, higher in additives, and higher in saturated fat, sugar and salt. People may be feeling that it is increasingly hard to achieve a healthy diet in the current economic environment.
When asked about their concerns for the future of food over the next three years approximately two-thirds (68%) of participants said they were concerned about the cost of healthy food (footnote 10), 53% felt priced out of healthy foods (footnote 11) and 31% said that they find it difficult to find fresh food that fits within their budget (for example, fruit, vegetables, meat) (footnote 12).
Concerns about the ability to access healthy food were most commonly expressed by people in lower socio-economic groups, those with lower incomes, people living with food insecurity, ethnic minority groups, larger households, younger families and younger adults (aged 18-44) without children who are living alone or with a partner.
Healthy to me is eating fruit and vegetables along with fresh cooked wholesome dinners on a daily basis.
I worry about the affordability of buying food - with inflation and no pay rises for workers Not being able to feed my family properly Having to rely on rubbish unhealthy food which could compromise our health
To what extent are these concerns influencing what goes in people’s shopping baskets? ONS purchasing data for 2022 shows that although we spent less on in-home food than in previous years, the reduction in spending was spread relatively evenly across meat, fruit and vegetables and sugary goods, suggesting that there has not been any notable difference in the way we divide our spending between different food categories.
What about the perceived “quality” of the food we are purchasing? We have already shown evidence that consumers are switching to cheaper alternatives such as own brand or value range products, reducing portion size/quantity or reducing spend on premium produce in favour of household staples. However, while this might feel like a drop in the perceived quality – or desirability – of people’s food, what we do not know yet is whether all of the above has had any impact on the actual nutritional value of what people eat.
Food safety and cost of living pressures
One final consequence of the financial pressures experienced during 2022 relates to how people store and cook their food. The FSA started monitoring consumers’ food storage and cooking behaviours on a monthly basis from September 2022 (see figure 10). FSS asked consumers a similar question in December 2022, asking respondents to consider the previous six months (figure 11).
Some of these behaviours involved using different cooking methods – for instance, in September 2022 around six in ten people (59%) in England, Wales and Northern Ireland reported using cheaper cooking methods (such as air fryers, microwaves, or slow cookers) instead of ovens to heat food as a way of saving money. In Scotland, 45% reported switching cooking methods over the six months up to December 2022.
However, a smaller proportion of people reported behaviours that could put them at greater risk of food poisoning, including reducing the length of time food was cooked for, lowering the cooking temperature for food, changing the setting of their fridge or freezer, or even switching these appliances off altogether to reduce electricity costs.
We also found some evidence that consumers were eating food past its use by date: this peaked when a third of consumers in England, Wales and Northern Ireland reported doing this in October 2022 (figure 12).
In England, Wales and Northern Ireland, all of these behaviours declined in November 2022, coinciding with the introduction of the Energy Bills Support Scheme, and the November Cost of Living payment (to eligible households). Although we cannot prove causation, it is possible that these schemes contributed to this observed decrease.
Figure 10: Change to consumers’ food storage and cooking practices in England, Wales and Northern Ireland

*An ‘*’ is used to indicate months with a statistically significant difference to the previous month.
Source: FSA Consumer Insights Tracker (September 2022 to March 2023)
Figure 11: Things people have done in Scotland to save money in the last 6 months

Source: Food in Scotland Consumer Tracker, Wave 15, December 2022
Figure 12: Further changes made by consumers in England, Wales and Northern Ireland to save money

*An ‘*’ is used to indicate months with a statistically significant difference to the previous month.
Source: FSA Consumer Insights Tracker (September 2022 to March 2023)
In summary
The cost of food increased on average 11% during 2022, with oil and spreads, dairy products and non-dairy alternatives, fish, eggs, meat and other proteins experiencing some of the sharpest increases and foods that are high in fat, salt and sugar experiencing smaller price rises than many other staple foods.
However, our analysis of people’s purchasing data suggests there has not been any significant shift in how we divide our spending between different food categories. Overall spending on in-home food also fell slightly last year – the first year-on-year fall for more than a decade.
Food prices became the top food concern for UK consumers in 2022, surpassing all other food-related concerns for the first time since FSA/FSS polling began. A smaller, but sizable number of people were worried about being able to afford food. People also reported making changes to what and where they ate throughout 2022 including changing what they bought or where they shopped, swapping premium or luxury items for cheaper alternatives, eating out less, and ordering fewer takeaways in an effort to reduce costs.
The number of households reporting food insecurity across England, Wales and Northern Ireland rose to 20%, the highest level since tracking began in 2016, with a further 13% of households reporting marginal food security. This suggests that up to a third of all households have material concerns about having enough food to eat. One in ten households are experiencing very low food security with regularly disrupted eating patterns and reduced food intake. A similar trend has been seen in Scotland, 40% of adults were worried about affording food in December 2022, compared to 17% in July 2020.
Approximately two-thirds of people are concerned about the cost of healthy food over the next three years and more than half feel ‘priced out’ of eating healthily. Consumers tell us in our research that they are having to make compromises on the perceived quality of their food. The publication of the forthcoming National Diet and Nutritional Survey for 2022 will help us to understand whether this is translating into any meaningful changes in people’s diets. However, it will take longer for any changes in health outcomes to become apparent.
-
This excludes beans and pulses due to unavailability of data.
-
All figures in this paragraph from ONS Consumer trends: chained volume measure,
seasonally adjusted. -
All figures in this paragraph from ONS Consumer trends: chained volume measure,
seasonally adjusted. -
Respondents were asked: Do you have concerns about any of the following?
The amount of sugar in food, food waste, animal welfare, hormones, steroids or antibiotics
in food, the amount of salt in food, the amount of fat in food, food poisoning, food hygiene when eating out, food hygiene when ordering takeaways, the use of pesticides, food fraud or crime, the use of additives (for example, preservatives and colouring), food prices, genetically modified (GM) foods, chemical contamination from the environment, food miles, the number of calories in food, food allergen information, cooking safely at home, none of these, don’t know. Respondents could select multiple responses. The percentages indicate the proportion of respondents who selected each option. -
Differences in percentages between Scotland and the rest of the UK may be due to
methodological differences in how data are collected. -
Social Grade has six possible classifications (A, B, C1, C2, D and E). Census data uses
a combined, four-way classification. C1: Supervisory, clerical, and junior managerial,
administrative and professional occupations. DE: Semi-skilled and unskilled manual
occupations; unemployed and lowest grade occupations. -
The FSA has been measuring food insecurity since 2016. In 2016 and 2018, food insecurity was measured in Food and You. Since 2020 it has been measured in Food and You 2.
-
Because of differences in the way that the data is collected, we cannot make direct
comparisons between the official USDA measure as set out in Food and You 2 and the
more informal measures of certain food insecurity behaviours tracked monthly. -
Free sugars refers to all added sugars in any form; all sugars naturally present in fruit and
vegetable juices, purées and pastes and similar products in which the structure has been
broken down; all sugars in drinks (except for dairy-based drinks); and lactose and galactose added as ingredients. -
Respondents were asked: To what extent do these areas concern you about the future of
food in the UK over the next 3 years? Cost of healthy food. Response options: Not at all
concerned, A bit concerned, Quite concerned, Extremely concerned. Reported percentage
for concerned combines ‘Extremely concerned’ and ‘Quite concerned’ responses. -
Respondents were asked: To what extent do you agree or disagree with this statement?
I feel priced out of healthy foods. Response options: Disagree strongly, Disagree slightly,
Neither agree nor disagree, Agree slightly, Agree strongly. Reported percentage combines
‘Agree slightly’ and ‘Agree strongly’ responses. -
Respondents were asked: To what extent do you agree or disagree with this statement?
It’s difficult to find fresh food (for example, fruit, vegetables, meat) that fits my budget.
Response options: Disagree strongly, Disagree slightly, Neither agree nor disagree, Agree
slightly, Agree strongly. Reported percentage combines ‘Agree slightly’ and ‘Agree strongly’
responses.
This chapter looks at where we sourced our food and feed in 2022, and what impact the disruption to the food system may have had on food standards.
The standards of imported food and feed
At a glance
In this chapter, we look at:
- our pattern of food imports and how this changed during 2022
- the safety of our imports based on data collected at the border
- free trade agreements as the UK developers new formal trading partnerships
Introduction
Food is a global business Sophisticated trading networks support the wide range and availability of fresh produce in our shops and provide food companies with affordable access to the raw commodities – including grain, cooking oil, sugar and salt – necessary to produce manufactured goods.
Yet with more than two-fifths (42%) (footnote 1) of our food coming from overseas, any disruption to imports can have serious consequences for both consumers and the businesses that depend upon stable access to global food supplies. Equally, the UK’s trading partners must have confidence in the food we export, including in the ingredients we may have imported for producing food within the UK. Upholding the safety and standards of imported foods is therefore hugely important.
This chapter looks at where we sourced our food and feed in 2022, and what impact the disruption to the food system may have had on food standards. It sets out the checks that regulators have carried out on imported food, what they have found, and what new protections are put in place as a result of leaving the EU. We also examine what our border control data can tell us about whether the overall safety and authenticity of our imported food is being maintained.
The changing landscape of food and feed imports
Imports remained important to the UK food sector in 2022, as volumes returned to pre-pandemic levels. A total of 2.18 million more tonnes of imported food and feed came into the country during 2022 compared to the previous year (a 5.6% increase), bringing our imports back in line with the average volumes seen over the previous seven years (figures 13 and 14) (footnote 2).
Figure 13: Total UK import volumes of all food and feed over time, 2014-22

Figure 14: Yearly percentage change in total UK import volumes

We also continue to source most of our food and feed from many of the same countries as before the pandemic. There has been little change in the top 10 countries the UK imports from (figure 15), the only exception being some fluctuation in trade with South American partners.
Further down the list, however, there is greater volatility. Figure 16 shows that the conflict in Ukraine has almost entirely reversed the increases in Russian and Ukrainian imports seen since 2014. Coupled with decreased imports from Latvia and Lithuania, in all, the UK imported around a million tonnes less food and feed products from these four countries in 2022 than it did in 2021.
Figure 15: Top 10 countries by import volumes for 2022
| Country Name | Volume of imports 2022 (million kg) | Year-on-year change | 2022 ranking* | Difference in ranking |
|---|---|---|---|---|
| Netherlands |
5,521 |
33% | 1 (1) | No change |
| France | 3,769 | 26% | 2 (3) | +1 |
| Ireland | 3,349 | -3% | 3 (2) | -1 |
| Belgium | 2,875 | 24% | 4 (5) | +1 |
| Spain | 2,467 | -3% | 5 (4) | -1 |
| Germany | 2,077 | -1% | 6 (6) | No change |
| Italy | 2,038 | -1% | 7 (8) | +1 |
| Brazil | 1,784 | 65% | 8 (13) | +5 |
| Poland | 1,617 | 2% | 9 (9) | No change |
| Argentina | 1,523 | -26% | 10 (7) | -3 |
* 2021’s ranking is in brackets.
** Imports from the Netherlands reflect the effect of Rotterdam as a global hub for transporting goods.
Figure 16: Changes in import values across selected countries
| Country name (ranking) | Volume of imports 2021 (million kg) | Volume of imports 2022 (million kg) | Volume percentage change from 2021 to 2022 | Pre-war growth in imports (2014 to 2021) |
|---|---|---|---|---|
| Bulgaria (46) | 70 | 119 | 70% | 120% |
| Estonia (62) | 133 | 44 | -67% | 84% |
| Latvia (35) | 296 | 169 | -43% | 41% |
| Lithuania (30) | 347 | 248 | -29% | 96% |
| Romania (19) | 102 | 451 | 340% | 8% |
| Russia (55) | 173 | 70 | -60% | 16% |
| Turkey (16) | 555 | 562 | 1% | 49% |
| Ukraine | 1,175 | 474 | -60% | 87% |
By contrast, there have been some sharp rises in imports from other South Eastern European countries, albeit from a lower base, including a 340% increase in import volumes from Romania and a 70% increase in those from Bulgaria compared to the previous year. This has elevated Romania from being our 48th largest import country in 2021 to one of the UK’s top 20 biggest food suppliers in 2022 (currently 19th) (figure 16). It is usual to see a certain degree of volatility in the flow of goods into the UK as importers react to changing market conditions.
Commodity changes
Our food import data is broken down into three main commodity types: Products of Animal Origin (POAO), which includes meat, eggs, fish and dairy; Food Not of Animal Origin (FNAO), which includes beverages, cereals, vegetables and fruit; and Animal Feed. In general, we assign a higher level of food safety risk to POAO, although there are still risks from FNAO, such as aflatoxins in nuts.
Figure 17 shows the total volume of imports in 2022 split by these categories. It shows that FNAO makes up the bulk of our food imports by weight, while POAO and feed imports are similar to each other by weight. We import a higher proportion of POAO from the EU than FNAO or Feed, although the EU provides more than half of each group.
Figure 17: Total volume of imports split by main categories of POAO, FNAO and animal feed
| Import Category | Total in 2022 (tonnes) | Volume change 2019-2022 | Volume change 2021-2022 | EU proportion 2022 |
|---|---|---|---|---|
| Products of Animal Origin (POAO) | 7,000,000 | -5% | 10% | 80% |
| Food Not of Animal Origin (FNAO) | 29,000,000 | -1% | 7% | 64% |
| Feed | 6,000,000 | -13% | -7% | 51% |
| Grand Total | 42,000,000 | -4% | 6% | 65% |
Note: two reference points have been included in the table above to provide a relative snapshot of comparable change against what could be considered a more stable period (2019), followed by year-on-year change (2021) which would have seen the impacts of the UK’s departure from the EU and the pandemic.
How safe is imported food and feed?
The food we import must be safe. This is one of the reasons why having effective border controls for all imported foods, including those sourced from EU member states, is critical. As we have seen, the EU still accounts for two-thirds of all food and feed imports, and 80% of all meat and other products of animal origin (figure 17).
All food and feed imported from outside the EU is subject to a series of checks to make sure it is safe. The type of checks carried out depends on the type of product and the level of risk it may pose to public, animal and plant health.
Currently, all food and feed of animal origin coming from outside the EU is subject to documentary checks (which confirm that appropriate documentation is supplied) and identity checks (which confirm that the product matches the documentation). Additional physical checks are carried out randomly on a pre-defined percentage.
FNAO are generally considered to be low risk. When specific risks are identified – for example, if sampling identifies a typical risk from a specific country or on a specific commodity that requires additional controls to be imposed – they will be classified as high-risk and will be subject to appropriate controls.
Under current operating arrangements for Northern Ireland, food and feed products imported into Northern Ireland will continue to follow EU rules. From Autumn 2023, the Windsor Framework will allow GB standards for public health, marketing (including labelling) and organics to apply for prepacked retail goods moved via a new Northern Ireland retail movement scheme and placed on the Northern Ireland market. Therefore, goods moving via this route containing products subject to import controls in GB will be able to be placed on the Northern Ireland market.
Figure 18 shows the vast majority of non-EU goods were compliant across these three checks (documentary, identity and physical), with no obvious changes against these measures. This suggests that the risk to consumers from non-compliant consignments from non-EU countries had not increased.
The situation is less clear for products coming in from EU member states. Until the new import rules defined by the Border Target Operating Model are phased in, border controls are not being applied to EU-origin products entering the UK - although a new requirement for importers to pre-notify border authorities of consignments of high-risk goods (from all EU countries except Ireland) was introduced on 1 January 2022.
For the period covered by this report, therefore, there continued to be no import controls routinely applied at the border for EU food and feed products and, although the probability of any significant increase in risk is low, this means that FSA and FSS are not able to say how the food safety risk from EU products has changed in recent years.
Figure 18: Percentage of rest of world consignments failing import checks in Great Britain, 2021-22
Documentary checks
| Consignment type | 2021 | 2022 |
|---|---|---|
| Meat and other animal products (POAO) | 0.91% | 0.91% |
| Other high risk foods (HRFANO) | 0.54% | 0.31% |
| All consignments | 0.84% | 0.78% |
Identity checks
| Consignment type | 2021 | 2022 |
|---|---|---|
| Meat and other animal products (POAO) | 0.84% | 0.63% |
| Other high risk foods (HRFANO) | 1.94% | 1.16% |
| All consignments | 0.87% | 0.65% |
Physical checks
| Consignment type | 2021 | 2022 |
|---|---|---|
| Meat and other animal products (POAO) | Not available* | Not available* |
| Other high risk foods (HRFANO) | 4.31% | 2.60% |
| All consignments | (NA) | (NA) |
Sampling (as part of a physical check)
| Consignment type | 2021 | 2022 |
|---|---|---|
| Meat and other animal products (POAO) | 0.99% | 0.93%** |
| Other high risk foods (HRFANO) | 4.78% | 4.13% |
| All consignments | 2.76% | 2.44% |
* Since leaving the EU and moving to the import of products, animals, food and feed system (IPAFFS), the functionality of the system records only the outcome of sampling checks undertaken which accounts for the figures as seen above
** 21 Results pending out of over 1,000.
Changes to designation of high-risk food and feed not of animal origin
As already mentioned, the UK takes a risk-based approach when it comes to border checks of imported food. All animal products are subject to checks as well as some food of non-animal origin. Certain non-animal origin products may pose a public health risk due to potential contamination with pesticides, naturally occurring toxins (aflatoxins), heavy metals or harmful microbes such as Salmonella. These risks can change quickly due to weather conditions, farming practices and production techniques, and vary between different countries of origin.
The UK’s departure from the EU means that FSA and FSS now have responsibilities to target specific risks to consumers by assessing and amending the list of High-Risk Food Not of Animal Origin (HRFNAO) in GB. We have conducted new analysis to help make the list more relevant to the food we eat and our own assessment of the risks they carry.
As a result, during 2022, FSA and FSS advised ministers to add five new product types to the existing list of HRFNAOs and to increase check levels on 13 more. Several of the additions to the list were due to concerns about the presence of pesticide residues, which may partly be due to the excessively dry conditions experienced in some countries leaving more residue on crops.
Extending the range of HRFNAO commodities that we control at the border increases our knowledge of the exporting countries’ compliance with our food safety requirements and can be used in any future risk assessments we might undertake. It also sends a powerful message to exporting countries that our controls are robust and that we will target non-compliant imports at the border.
FSA and FSS also advised ministers that three products should be removed from the list entirely following a risk assessment which showed they are compliant and no longer pose a risk to public health. In addition, we have reduced inspection checks on five other products as the risks associated with them were now less likely to cause harm. These are described in figure 19.
Figure 19: Changes to designation of high-risk foods
Imported HRFNAO commodities that have been risk assessed and removed from control at the border as they are compliant with imported food safety requirements and no longer a risk to public health
| Commodity | Country | Hazard |
|---|---|---|
| Goji berries | China | Pesticide residues |
| Dried grapes | Turkey | Ochratoxin A |
| Pistachios | USA | Aflatoxins |
Imported HRFNAO commodities that remain under control, but we have noted a declining risk/ improvements in compliance with imported food safety requirements
| Commodity | Country | Hazard |
|---|---|---|
| Groundnuts | Brazil | Aflatoxins |
| Groundnuts | China | Aflatoxins |
| Hazelnuts | Turkey | Aflatoxins |
| Betel leaves (Piper betle) | Bangladesh | Salmonella |
| Hazelnuts | Georgia | Aflatoxins |
Imported FNAO commodities that have been identified through our surveillance intelligence systems as presenting a risk to public health and have been brought under control at the border for the first time
| Commodity | Country | Hazard |
|---|---|---|
| Groundnuts | Brazil | Pesticide residues |
| Lemons | Turkey | Pesticide residues |
| Betel leaves (Piper betle) | Thailand | Salmonella |
|
Peppers of the Capsicum species (other than sweet) |
Turkey | Pesticide residues |
| Sesamum seeds | Uganda | Salmonella |
Imported HRFNAO commodities that have had controls increased at the border due to increased non-compliance / risk to public health Commodities that are moved into Annex 2 have additional import requirements attached to them, the commodity must be accompanied by an Export Health Certificate and subject to laboratory testing to indicate compliance with GB food safety requirements
| Commodity | Country | Hazard |
|---|---|---|
| Black pepper (Piper nigrum) | Brazil | Salmonella |
| Peppers of the Capsicum species (other than sweet) | Thailand | Pesticide residues |
| Okra | India | Pesticide residues |
|
Oranges |
Turkey | Pesticide residues |
| Mandarins, clementine, Wilkings (mandarin variety) and similar citrus hybrids | Turkey | Pesticide residues |
| Jackfruit | Malaysia | Pesticide residues |
| Peppers of the Capsicum species (other than sweet) | Uganda | Pesticide residues |
| Sweet Peppers (Capsicum annuum) | Turkey | Pesticide residues |
| Sesamum seeds | Sudan | Salmonella |
| Vine leaves | Turkey | Pesticide residues |
| Sesamum seeds | Ethiopia | Salmonella |
| Peppers of the Capsicum species (other than sweet) | Sri Lanka | Aflatoxins |
| Groundnuts | India | Alflatoxins |
Border notifications and Intensified Official Controls
The UK’s departure from the EU has also changed what happens when there is a breach in import food standards. When a consignment of a product has failed its checks, the UK issues an alert to enforcement authorities to target similar imports. A total of 326 border notifications were issued in 2022, the first year since this new system was put into practice, summarised below.
Top four reasons for Border Notification Failures
- 126 related to either documentary/identity failure
- 33 related to physical failures (such as spoilage, a different commodity identified to that described on import certificate or on IPAFFS, or extraneous matter)
- 58 related to mycotoxin (aflatoxin and ochratoxin failures)
- 29 related to pesticide failures
For imported animal products, if border officials find there are repeated or serious breaches in GB’s import requirements, future consignments from the food business involved may be subject to intensified official controls (IOC). Under these rules, imports of all consignments from an establishment subject to an IOC would be subject to physical check until the IOC is lifted. FSA notifies the authorities in the country of concern, so that they may take action to resolve the problem.
Overall, non-EU imports have remained largely compliant with import checks compared with last year This suggests there has not been any significant fall in the safety of our imports, though the picture remains limited without similar controls on EU imports Our border notification system and ability to apply intensified controls enhances our ability to target specific risks and areas of non-compliance to protect UK consumers from harm
In 2022, the IOC process was used on 11 occasions due to repeated or serious threats to public health. Of the 11 IOCs created:
- Five were specific to poultry establishments in Brazil due to products being contaminated with Salmonella
- Three were related to veterinary medicine residue failures in establishments from Bangladesh, India and Vietnam
- A failure for Gyrodactylus salaris (parasitic worms) from an establishment in Morocco
- Sulphur dioxide failure (in edible gelatine) from an establishment in Pakistan
- A species verification failure (physical check contradicts the health certification) from an establishment in China.
2022 was the first full year of the IOC process and so comparable data is not yet available.
Free Trade Agreements and health protection
As the UK develops new formal trading partnerships with countries outside the EU, it is important that statutory protections are in place to uphold the safety standards of food imported under these Free Trade Agreements (FTAs).
The UK has already signed new FTAs with Australia (in December 2021) and New Zealand (February 2022) which came into force in early 2023. Section 42 of the Agriculture Act 2020 requires the UK Government to explain if the protections for agricultural products set out in UK law are maintained.
As part of this, FSA and FSS were asked to examine if both FTAs maintained UK food safety protections. Broader issues relating to the FTAs which are outside of the remit of FSA and FSS (such as tariffs and the potential impact on trade flows over time) were not within the requested scope of our advice: the mandated focus of our report was human health statutory protections.
We looked at whether changes to the UK food regulatory system were needed to comply with the FTA, and if there would be an impact on the UK government and devolved administrations to regulate in areas of food safety and nutrition (defined as: nutrition and health claims; vitamins, minerals and certain other substances; food supplements; and foods for specific groups).
Both FSA and FSS concluded that the FTAs with Australia and New Zealand did uphold food safety protections for the consumer. Additionally, for the New Zealand agreement, we assessed whether it maintained UK nutrition requirements and concluded that it did. We will continue to scrutinise any future agreements and these assessments will continue to include consideration of nutrition statutory protections.
Understanding food production standards
FSA and FSS also recognise that consumers are interested in understanding the production standards of imported foods, including their environmental and animal welfare standards.
To support this, the FSA recently commissioned the food consultancy ADAS to identify measurable metrics and data sources for imported food production standards that might be used to give the public a fuller picture.
However, the ADAS report highlighted:
- a general lack of publicly available data and issues with the quality of the limited data available
- a lack of measurable metrics or clear approaches to measure or monitor them
- the absence of frameworks to evaluate production standards.
Although the current system of border checks gives us assurance on food safety, there is no similar system for food production standards. Being able to assess the production standards, like animal welfare or environmental standards, of imported food on a comparable basis to UK food, is essential if we as watchdogs are to be able to assess whether the food standards of the food the UK consumes has been maintained.
The report’s findings suggest these areas require further attention and will be something we continue to explore - while also continuing to cooperate with partners across government to make sure consumer interests are recognised.
In summary
The volume of food imported into the UK broadly returned to average volumes in 2022 following a reduction in 2021. However, a combination of factors has disrupted patterns of food supply, reducing the amount imported from Ukraine, Russia, Latvia, and Lithuania in particular. Other countries such as Romania and Bulgaria have experienced significant rises in trading volumes.
For non-EU goods that are subject to GB border checks, the vast majority of goods were compliant with import controls, suggesting that there has not been any significant overall fall in food safety standards. However, Britain has expanded the number of designated high-risk goods during 2022 and issued IOCs in certain cases to reflect the increased risks associated with selected products from certain countries. It is essential that the UK implements robust controls set out in the Border Target Operating Model quickly to ensure we have similar assurance for food imported from the EU.
Two new FTAs have been signed and will begin to take effect from 2023. FSA and FSS have contributed to official government assessments of whether these agreements maintain statutory protections for human, animal or plant health, animal welfare and the environment, and have concluded that the new FTAs do so. We will continue to scrutinise any future agreements.
The FSA commissioned a report looking at how it might identify and gather better information on imported food production standards. This underlined the lack of available data, which makes an assessment of the production standards of imported food impossible to undertake. FSA and FSS will continue to explore how to overcome this challenge. However, until then, we cannot offer any data-led assessment of the animal welfare, environmental or other production standards of imported foods.
In this chapter, we will consider whether enforcement activity is returning to normal levels after the pandemic, and also look at the fundamental question of resourcing and capacity.
Hygiene standards in food and feed establishments
At a glance
In this chapter, we look at:
- the levels of compliance with hygiene standards across food and feed establishments
- the progress made in restoring food hygiene controls following the COVID-19 pandemic
- the staffing capacity available to uphold food hygiene standards
Introduction
As consumers, we all want to feel confident that the food we eat has been produced in a safe and hygienic way But achieving this involves a huge effort across the food chain to ensure standards are maintained.
All food and feed businesses are responsible for meeting strict hygiene requirements, which include proper handling, storage and transportation of food and feed, as well as the use of safe ingredients, effective hygiene practices and making sure staff receive adequate training or supervision.
The responsibility for ensuring all businesses follow these rules spans multiple organisations and varies across the UK (figure 20). As we described in last year’s report, the pandemic severely affected their ability to operate in the normal way. The data in this chapter partly reflects the ongoing efforts to resume the full delivery of hygiene controls and secure a more reliable picture of compliance. However, the ability of enforcement authorities to deliver robust controls also depends upon the funding and supply of sufficiently trained professionals to uphold our food laws.
In this chapter, we will consider whether enforcement activity is returning to normal levels after the pandemic, and also look at the fundamental question of resourcing and capacity. We examine how the size and shape of this workforce has changed over time and whether it is sufficient to keep consumers safe for the future.
Figure 20: Responsibilities for maintaining food hygiene controls across the UK
| Type of food establishment | Which authority is responsible for hygiene controls? | Which professionals are involved in the inspection process? |
|---|---|---|
| Food businesses: these include restaurants, cafés, pubs, supermarkets and other places where food is supplied, sold or consumed, such as hospitals, schools and care homes. | UK-wide local authorities | Food safety officers/ Food Law officers (in Scotland), including Environmental Health Officers |
| Meat establishments: these include abattoirs, cutting plants, game handling establishments and meat markets. |
England and Wales: FSA and local authorities Scotland: FSS Northern Ireland: Department of Agriculture, Environment and Rural Affairs (DAERA) |
Official Veterinarians (OVs) and Meat Hygiene Inspectors (MHIs) |
| Dairy establishments: these include farms and production plants manufacturing dairy products. |
England and Wales: FSA Scotland: local authorities Northern Ireland: DAERA |
Dairy Inspectors, Environmental Health Officers (in Scotland) |
| Animal feed establishments: these include wholesale suppliers and manufacturers of animal feed products. |
England and Wales: local authorities Scotland: FSS Northern Ireland: DAERA |
Feed Officers |
Hygiene in food establishments
There are two national food hygiene ratings schemes operating across the UK: the FHRS which operates in England, Wales and Northern Ireland; and the FHIS which covers food businesses in Scotland. Both draw on the most recent inspections carried out by local authorities and are given to businesses involved in serving and preparing food, including restaurants, pubs, cafés, takeaway outlets, and canteens, as well as other places where food is supplied, sold, or consumed like hospitals, schools, and care homes (footnote 1).
Food hygiene inspection data gathered on 31 December 2022, showing the most recent inspection results, indicates that more than nine out of ten food businesses achieved satisfactory or better ratings (footnote 2), with minimal changes reported compared to last year’s ratings. Just over three-quarters (75.7%) of food businesses in England, Wales and Northern Ireland achieved a top rating of 5 for hygiene, while 2.9% of food establishments scored 2 or below, which means they require improvement, major improvement or urgent improvement (figure 21).
Figure 21: Percentage distribution of FHRS ratings based on data gathered on 31 December 2022 reporting the most recent inspection
| FHRS Rating | 0 | 1 | 2 | 3 | 4 | 5 |
|---|---|---|---|---|---|---|
| England | 0.2% | 1.3% | 1.4% | 6.4% | 15.0% | 75.7% |
| Wales | 0.2% | 1.5% | 1.3% | 7.4% | 18.1% | 71.6% |
| Northern Ireland | 0.0% | 0.3% |
0.6% |
3.2% | 12.5% | 83.4% |
By contrast, the FHIS scheme in Scotland is based on a pass or fail rating: 93.8% of inspected businesses met the required standard in 2022 (figure 22).
Figure 22: Percentage of UK food businesses achieving satisfactory or better ratings for food hygiene, as of 31 December 2022

Furthermore, under the Scottish inspection regime, Food Law Rating System (FLRS), businesses now receive an overall food law assessment of legal compliance, which brings together outcomes of hygiene and standards checks carried out by local authorities. For those businesses that have gone through this newer process, the percentage assessed to be legally compliant in 2022 increased slightly from the previous year (figure 23).
Figure 23: Percentage of food business operators in Scotland compliant with food laws for 2021/22 financial year

Local Authority inspection volumes
The number of inspections and when they are carried out by local authorities directly affects the accuracy and relevance of FHRS and FHIS data. Since hygiene ratings can only ever reflect data taken from the last time each establishment was inspected, having an accurate picture depends upon enough inspections being carried out to reveal any significant movement. Without this, we remain heavily reliant on historic data from past inspections to assess whether hygiene standards have been maintained.
After the pandemic disrupted inspection activity, all local authorities developed recovery plans to help re-establish food hygiene controls. Figures 24 and 25 chart the progress made by tracking the number of inspections carried out over the last four years for England, Wales and Northern Ireland and Scotland respectively. In 2020, we can see there was a sharp and immediate fall in the number of ratings issued as parts of the hospitality sector were closed, social distancing laws took effect and local authority resource was diverted. Volumes partially recovered during 2021, and the number of businesses issued with a food hygiene rating largely returned to pre-pandemic levels throughout 2022.
Although this is an important milestone in terms of re-establishing effective oversight after the COVID-19 pandemic, it should be stressed that there were still approximately 39,500 unrated businesses at the end of 2022 across England, Wales and Northern Ireland that had not yet been assessed. However, the number of unrated businesses has decreased by 48.7% from a post-pandemic peak of 77,000 in April 2021 as local authorities continue to recover.
This means that we do need to be cautious about drawing firm conclusions on the current state of food hygiene standards until these challenges have been addressed. It also underlines the importance of ensuring local authority teams are adequately staffed so that they can maintain good oversight of standards into the future, as we will explore later.
Figure 24: The number of food businesses issued a food hygiene rating by quarter for England, Wales and Northern Ireland from 2019/20 to 2022/23

Figure 25: The number of food businesses issued a food hygiene rating by quarter in Scotland from 2019/20 to 2022/23

Hygiene in approved in meat establishments
All FSA and FSS-approved meat establishments (footnote 3) – which include slaughterhouses, game handling establishments, cutting plants and wholesale meat markets - are subject to risk-based audits to check they meet hygiene standards.
The way these audits are carried out varies across the UK, this means it is difficult to make direct comparisons between the four home countries. However, figures 26 and 27 show that across the UK, the percentage of meat establishments with satisfactory or good hygiene standards was high – over 98% in Scotland and over 99% for the rest of the UK according to their most recent data gathered on 31 December 2022.
There has been a notable 12.9 percentage point rise since 2021 in Scottish business compliance since 2021, which may be due to changes in the audit approach to allow quicker interventions in cases of poor compliance. However, the actual scale by which compliance ratings are assigned remains unchanged, which means that the same definition of a ‘good’ rating is applied consistently throughout the UK. This gives confidence that overall compliance itself remained high.
Figure 26: Percentage of meat establishments rated as good or satisfactory for hygiene in 2022
| Country | Percentage of meat establishments rated as good for satisfactory for hygiene in 2022 | Percentage point change against 2021 |
|---|---|---|
| England and Wales | 99.3% | +0.7% |
| Northern Ireland | 100% | No change |
| Wales | 98.4% | +12.9% |
Figure 27: Breakdown of hygiene compliance ratings (footnote 4) for meat establishments (based on most recent data collected 31 December 2022)
| Country | Good | Generally Satisfactory | Improvement necessary | Urgent improvement necessary |
|---|---|---|---|---|
| England and Wales | 64.2% (+7.4%) | 35.1% (-6.7%) | 0.5% (-0.6%) | 0.2% (n/c) |
| Northern Ireland | 87.0% (-7.0%) | 13.0% (+7.2%) | 0.0% (n/c) | 0.0% (n/c) |
| Scotland | 91.9% (+26.7%) | 6.5% (-12.8%) | 1.6% (-12.9%) | 0.0% (n/c) |
Notes: Percentage point change against 2021 data is shown in brackets.
Hygiene compliance in milk production
As with meat establishments, the responsibility for the inspection of dairy businesses varies across the UK nations but again the available data indicates that the majority are rated as compliant.
In England and Wales 98.1% of dairy establishments were assessed as either good or generally satisfactory in 2022 (figure 28). This is an increase compared to the previous year’s results and is due to a change in the way dairy hygiene compliance is calculated. This year’s data takes into account compliance both at the initial inspection as well as at the time of subsequent follow-up action where interventions were delivered. It reflects the most up-to-date information we have on compliance and better aligns with the reporting methodology used by Northern Ireland.
Figure 28: Percentage of dairy establishments in England, Wales and Northern Ireland which achieved the highest outcomes of either Good or Generally Satisfactory as of 31 December 2022
| Country | Percentage of establishments which achieved good or generally satisfactory outcomes | Change from previous year |
|---|---|---|
| England and Wales | 98.1% | (+17.6%) |
| Northern Ireland | 99.2% | (+0.3%) |
Figure 29: Breakdown of hygiene compliance ratings for dairy establishments from inspections data collected 31 December 2022

Notes: Percentage point change against 2021 data is shown in brackets.
Source: K2 dairy data system (England and Wales), DAERA Agri-food Inspection Branch dairy system (NI) 2002.
Northern Ireland’s overall compliance also remained stable (figure 28), although there was a 9% drop in the proportion of ‘good’ establishments and an equivalent rise of those assessed to be ‘generally satisfactory’ (figure 29).
In Scotland, it is more difficult to form an accurate picture of whether dairy hygiene standards have changed in the absence of comparable compliance data. FSS has no direct enforcement role for dairy hygiene, which is instead the responsibility of 32 Scottish local authorities who hold this data.
Enforcement activity has been severely hampered by the COVID-19 pandemic, with available resources concentrated on monitoring high-risk food businesses, for example those providing unpasteurised milk for cheese production. As Scotland does not allow the sale or distribution of raw drinking milk, it has a higher proportion of dairy farms that are generally considered lower risk in the inspection regime compared to those in the rest of the UK.
What we can conclude is that there has been an increase in the number of guidance letters and instances of written advice issued in 2021/22 (figure 30) as enforcement activity begins to restart. No hygiene improvement notices (HINs) had been issued between April 2018 and March 2022. HINs are a more serious enforcement measure and are issued where a hygiene non-compliance breaches regulations and must be rectified within a set time period. While the data set is extremely limited, this suggests that the majority of recently inspected Scottish dairy establishments are operating safely.
Figure 30: Dairy establishments enforcement activity in Scotland

Hygiene compliance across animal feed establishments
Animal feed is an important part of the food chain, and any hygiene and safety failures can pose significant risks to human health. Animal feed businesses must therefore meet a range of legal requirements relating to hygiene, traceability, labelling, composition, and undesirable substances.
The responsibility for inspecting these businesses has undergone several changes in recent years and was also disrupted by the pandemic, leaving an inconsistent and often incomplete set of data (footnote 5). However, from the available data (figure 31), compliance levels in England and Northern Ireland in 2021/22 appear to have remained broadly the same as the previous year, with England’s overall compliance (footnote 6) at 96.9%, falling by 0.2% compared to 2021 and Northern Ireland remaining static at 99.3% compliance.
In Wales, the data shows a rise in compliance levels during 2021-22, though it should be noted the number of premises inspected was dramatically reduced due to the ongoing impact of the COVID-19 pandemic, which makes it harder to draw any meaningful year-on-year comparisons. Due to limited resources, the feed delivery programme in Wales prioritised official controls at premises that are new, poorly compliant, or higher risk due to the nature of their activities, meaning that the percentage is not indicative of compliance levels across the sector as a whole.
On 1 April 2021, responsibility for animal feed checks transferred from local authorities to FSS. Consequent changes in data gathering make it impossible to provide annual trend data, but during the first year following transfer, 97.8% of Scottish feed businesses were compliant.
Figure 31: Percentage of feed organisations assessed as compliant with hygiene standards, according to latest available data

The capacity and capability challenge
As we said at the start of this chapter, maintaining hygiene standards depends upon having enough trained and experienced staff to carry out inspections and work with food and feed businesses to ensure they operate within the law.
Across England, Wales and Northern Ireland, our analysis (figure 32) shows that there has been a substantial decline in the number of allocated (footnote 7) food safety officers over the last decade or so, with just under 14% fewer posts in 2022/23 compared with 2010/11. In Scotland, meanwhile, the number of occupied food law posts fell by 25.5% in 2021/22 compared to 2016/2017. This has led to difficulties in recruitment due to staff shortages.
During the pandemic in 2020/21, the percentage of unfilled posts across England, Wales and Northern Ireland increased to 57.7% due to the reallocation of food safety officers to deal with the COVID-19 pandemic. There has been a long-term decline in the number of funded posts that has been aggravated by staff shortages. In 2022, the rate of unfilled or vacant food safety posts (figure 33) remained higher than before the COVID-19 pandemic, with approximately one in seven (13.7%) allocated posts across England, Wales and Northern Ireland vacant in 2022.
Furthermore, these reductions in capacity are not limited to food hygiene. There has also been a 45.1% drop in the number of food standards officer allocated posts from 2011/12 to 2021/22 in England, Wales and Northern Ireland. Trading standards officers, who most commonly check the composition and nutritional content of food and the accuracy of labelling and advertising, have been in particularly sharp decline. These checks are important in tackling fraudulent, inauthentic, or mislabelled food, described in more detail in the next chapter.
Indeed, a workforce survey report published by the Chartered Trading Standards Institute (CTSI) in 2020 found that trading standards officer staffing levels have fallen between 30% and 50% across the UK between 2008/9 and 2018/19. The survey also found that just over half of the local authorities in the UK did not believe they had sufficient expertise to cover the full range of trading standards responsibilities, and that the ageing trading standards workforce was a threat to future professional capacity.
Within Scotland, environmental health officers and food law officers carry out both food hygiene and the food standards functions that trading standards officers would traditionally carry out within the rest of the UK, therefore the 25.5% reduction within Scotland in occupied food law posts has been particularly difficult.
Maintaining sufficient supply of experienced professionals to carry out inspections is essential for upholding food hygiene standards The long term reductions in local authority staffing numbers, coupled with growing recruitment challenges and an ageing workforce, are putting unsustainable pressure on existing teams and increase the potential for food safety issues going unchecked and undiscovered in the future.
Figure 32: Number of allocated food hygiene posts held by local authorities across England, Wales and Northern Ireland from 2010/11 (footnote 8)

* While the available resource allocated to managing food hygiene controls improved in 2021/22, this may have been partly due to the additional, one-off funding given to local authorities to help them address the backlog of inspections following the pandemic.
Figure 33: Percentage of unfilled food hygiene posts (FTE) in local authorities in England, Wales and Northern Ireland
| Year | England | Wales | Northern Ireland | England, Wales and Northern Ireland combined |
|---|---|---|---|---|
| 2018/19 | 8.7% | 9.7% | 9.7% | 8.8% |
| 2019/20 | 10.1% | 6.9% | 4.9% | 9.6% |
| 2020/21 | 58.4% | 65.5% | 25.4% | 57.7% |
| 2021/22 | 12.0% | 27.7% | 15.3% | 13.7% |
The situation in Scotland is similar (figure 34). In November 2021, there were 202.8 Full Time Equivalent (FTE) officers in place out of an establishment of 261.7 FTE with an estimated need for 380.3 to fulfil all Code of Practice requirements, a deficit of 46.7%.
Figure 34: Number of allocated food hygiene posts held by local authorities across Scotland as of November 2021
| N/A | Number | Percentage |
|---|---|---|
| Established posts | 261.7 | N/A |
| Posts filled | 202.8 | 77.5% |
| Vacancies | 58.8 | 22.5% |
| Estimated Need | 380.3 | N/A |
| Estimated shortfall to meet need | 177.4 | 46.7% |
Source: The Society of Chief Officers of Environmental Health in Scotland (SoCOEHS)
In addition, The Society of Chief Officers of Environmental Health in Scotland (SoCOEHS) advise that nearly two-thirds of food law officers (64.1%) and more than half (50.7%) of all environmental health officers working within food law in Scotland are over 50 years old.
Figure 35: Number of filled local authority food law posts (FTE) in Scotland
| Year | Number of Filled posts |
|---|---|
| 2016/17 | 271 |
| 2017/18 | No data available |
| 2018/19 | 223 |
| 2019/20 | 214 |
| 2020/21 | No data available |
| 2021/22 | 202 |
Source: The Society of Chief Officers of Environmental Health in Scotland.
Supporting Local Authorities
FSA and FSS are already supporting local authorities to make the best use of available resources:
The FSA’s Achieving Business Compliance (ABC) programme is developing new ways of modernising how local authorities maintain regulatory standards. A new approach for food standards inspections is now being rolled out, which includes a more risk-based approach to inspecting food businesses, greater flexibility for local authorities to check compliance in different ways and increased use of intelligence. These changes should allow local authorities to make the best use of their available resource, spending more of their time with the highest risk and least compliant businesses. The new approach should also support greater use of intelligence to disrupt the supply of fraudulent or inauthentic food further up the food chain before it hits the shelves. The FSA is now consulting on changes to the approach to food hygiene inspections.
FSS have created a proposed programme Scottish Authorities Food Enforcement Rebuild Programme (SAFER), which replaces FSS’ Regulatory Strategy Programme, which will explore ways of increasing resource, reducing demand, improving efficiencies, and developing digital solutions to support local authorities.
The FSA has also commissioned research on the nature and extent of issues surrounding local authorities’ ability to recruit and retain suitably and appropriately qualified and experienced officers to deliver official food and feed controls.
This is a complex issue and not something that rests solely on the FSA and FSS to resolve. But it cannot be ignored if we want to adequately protect consumers now and in the future. Both agencies will work with other government departments, professional bodies, local authorities, and other external partners to develop solutions.
Official Veterinarian resources
OVs play a key role in ensuring meat produced in slaughterhouses or processing plants is handled safely and in line with relevant laws. However, the entire veterinary profession is facing resourcing challenges, which are contributing to particular difficulties in recruiting sufficient OVs.
The RCVS reported a 27.4% fall in the number of people joining the veterinary profession between 2019 and 2022 and there has been a particular reluctance among domestically qualified vets to take on public health roles.
Although the staffing models used by the FSA and FSS differ (the FSA works with an external agency responsible for providing OVs, while FSS employ them directly, using temporary and agency staff as necessary), both have been affected by this squeeze in supply.
As a result, overseas recruitment currently remains an important way of securing sufficient staffing, supported through RCVS Temporary Registration.
What is Temporary Registration?
RCVS Temporary Registration: Temporary Registration (TR) has allowed appropriately qualified veterinarians from EAEVE (European Association of Establishments from Veterinary Education) accredited universities, who held a Level 5 IELTS English qualification, to temporarily register with the RCVS.
This allowed them to work as Temporarily Registered Novice Official Veterinarians (TRNOVs), while they completed their training in English language, to carry out meat official controls in abattoirs under supervision. In Scotland, FSS did not access the TR route in 2022.
Temporary Registration has allowed OV numbers to increase steadily in England and Wales. There were 103 TRNOVs out of a total of 272 OVs, which equated to 38% of all OVs, deployed as at 31 December 2022.
This allowed for maintenance of service delivery in abattoirs and has avoided service delivery failures, meaning that no abattoir was prevented from operating due to the lack of an OV being in attendance.
As we look ahead, the FSA is working with its delivery partners and has agreed to financial support in the form of a contract variation for the remainder of the current OV contract. This is specifically to be used to deliver enhanced OV salaries in line with other veterinary roles. This will help to improve retention and reduce reliance on Temporary Registration.
The FSA has worked closely with universities to raise the profile of OVs (and increased investment in this work) and has supported work to identify competitive OV salary packages. FSS has established additional pay and recognition schemes, improved training and developed an Official Controls Veterinarian Qualification in close partnership with the Scottish Qualifications Authority. However, despite these initiatives, the future supply of experienced professionals to fill OV roles remains a significant risk across the UK and both the FSA and FSS will continue to monitor this closely and proactively address these challenges.
In summary
Nine in ten businesses inspected by local authorities across the UK achieved a satisfactory or better rating for food hygiene based on data collected on 31 December 2022. However, hygiene ratings can only ever reflect data taken from the last inspection carried out on each establishment. We remain heavily reliant on historic data from past inspections to assess whether hygiene standards have been maintained. Local authorities are continuing to restore hygiene controls and make up the backlog in inspections in line with their recovery plans. Overall inspection volumes for 2022 returned to pre-pandemic levels.
While the available data on hygiene standards in meat, dairy and animal feed establishments is incomplete in places, the general picture based on the last available inspection suggests that the vast majority of businesses inspected are operating safely, with more than 89% compliance across these sectors.
The immediate workforce capacity challenges created by the redeployment of staff since the pandemic have largely recovered. However, the proportion of unfilled food hygiene posts held by local authorities is increasing and the overall resource allocated to managing food hygiene is 13.8% less than in 2010/11 in England, Wales, and Northern Ireland. FSA and FSS believe this is putting unsustainable pressure on existing local authority teams and may increase the risk of important food safety issues being missed.
The number of food standards allocated posts in England, Wales and Northern Ireland, which are largely staffed by trading standards officers, have declined by 45.1% from 2011/12 to 2021/22, while a high proportion of the workforce is also approaching retirement age. Our concern is that this reduced capacity to assess authenticity, labelling and allergens compliance may compromise food standards in the future.
In Scotland, the number of occupied food law officers has fallen by just over a quarter compared to 2016/17. The SoCOEHS has reported that, since 2016, there has been a reduction of 14% in posts within Environmental Health, a reduction of filled posts of 21% and a 315% increase in vacancies.
Securing enough veterinary resource to manage inspections in meat establishments is being hampered by a shortage of veterinarians entering the profession, an increase leaving the profession and challenges in recruiting additional veterinary professionals from European countries. While short term contingency measures – most notably the use of Temporary Registration for veterinarians from overseas to work under supervision – have allowed meat hygiene inspections to be maintained during 2022, it is important that we retain our experienced OVs and develop new ways of managing demand.
-
In Wales, the scheme also covers business-to-business operations such as manufacturers
that fall under the remit of local authorities. -
Both the FHRS and FHIS provide information about the standard of food hygiene of
establishments based on their most recent inspection. FHRS provides a rating between
0 and 5, with 5 being the highest score, indicating ‘very good’ hygiene standards. FHIS
provides a rating of ‘pass’ or ‘improvement required’. For this analysis, we have taken
an FHRS rating of 3 or above to indicate satisfactory or better rating for English, Welsh
and Northern Irish businesses assessed under the FHRS, and a ‘pass rating’ for Scottish
businesses assessed under the FHIS. Given differences between FHIS & FHRS, the data
between Scotland and the rest of the UK is not comparable. -
Approved meat establishments handle, prepare or produce products of animal origin for
which requirements are laid down in retained EU Regulation (EC) No. 853/2004. -
For an explanation of what the ratings categories mean, visit the FSA business guidance on auditing meat establishments
-
This was primarily due to the transition in Scotland, with FSS becoming the competent
authority for feed and moving to a new electronic system. Any feed inspection outcomes
pre 2021 are taken from local authority information. -
Animal feed establishments are rated as either ‘Poor Compliance’, ‘Varying Compliance’,
‘Satisfactory Compliance’, ‘Broad Compliance or better’ and ‘Minimum of Satisfactory
Compliance and a member of a FSA approved assurance scheme’. Any establishment rated above ‘Satisfactory’ is considered to be compliant. More information can be found in the Feed Law Code of Practice. -
Allocated posts are professional posts allocated to deliver a local authority’s
food hygiene controls service based on available budget. -
Local authorities calculate the proportion of occupied posts using a variety of methods.
These are often estimates of resource, which have not been fully validated by the FSA.
Food incidents, food crime and surveillance sampling.
Food incidents, food crime and surveillance sampling
At a glance
In this chapter, we look at:
- the volume and nature of food and feed incidents reported in 2022
- the latest findings from national food sampling and surveillance programmes
- the activity and focus of the national food crime units
Introduction
How do we know if the food on sale across the UK is safe or what it claims to be? How do authorities check that food is not likely to cause us harm, and what do they do when it is? How do we understand and respond to incidents of fraud, food tampering or counterfeit goods entering the market? And what conclusions can we draw, from all of this, about whether food standards are being maintained?
FSA and FSS use a range of evidence from national and international agencies, local enforcement authorities, the food manufacturing industry, food retailers and the general public, to help us understand and respond rapidly to problems in our food supply.
There are well-established incident notification systems that help the FSA and FSS to alert consumers when food becomes contaminated, unsafe, or likely to cause ill-health, now supported by the increasing use of advanced DNA-based technology to track foodborne illness outbreaks and target action at source.
Dedicated food crime units at both FSA and FSS work with local authorities, food businesses and other agencies to investigate and disrupt criminal activity in the food supply chain, either bringing to justice or disrupting the activities of individuals or organisations involved in fraud or malpractice.
Underpinning this, the FSA, FSS and Defra coordinate targeted sampling activities that test the authenticity and safety of selected products on sale in the UK, complementing the routine checks that local authorities and food businesses do to ensure the food we buy is safe and what it claims to be.
Deep dive 1: Food and feed incidents
Introduction
A food or feed incident is defined as any event where there are concerns about the safety, quality or integrity of products that could require action to protect consumers Notifications come from local authorities, port health authorities, government bodies, industry, other countries, and consumers themselves.
The FSA, FSS and our partners look closely at any significant changes in the data to help us detect emerging issues in our food chain. However, the rate of incidents reported to us can be affected by other factors including new regulations coming into force or improvements in detection and reporting, as well as material changes in food safety and quality.
In all, there were 2,221 reported food or feed incidents during 2022, which represents a slight decrease compared to the previous year. Although we cannot determine how much of this change is due to year-on-year differences in reporting practices rather than actual changes in food safety, the fact that the overall figures remain consistent with long-term trends suggests that there have not been any major shifts in the overall number of incidents reported (figure 36).
Figure 36: Number of reported incidents in the UK
| N/A | 2019 | 2020 | 2021 | 2022 |
|---|---|---|---|---|
| UK-wide | 2,598 | 2,261 | 2,363 | 2,221 |
Food categories most associated with incidents
As in previous years, meat and meat products (other than poultry) contributed the highest number of food incidents in 2022, accounting for 13% of all incidents. They have consistently ranked as the product most associated with food incidents since 2019 and are one of the most frequently and rigorously tested food groups. Most incidents involved cases of residues being detected in veterinary medicine, microbiological contamination, and labelling or packaging errors.
Another significant category in 2022 was dietetic foods, food supplements and fortified foods, which made up 9% of incidents, largely driven by cases of unauthorised ingredients in these products. Cereals and bakery products contributed a similar proportion of cases (9%), with many of these incidents relating to the presence of unauthorised ingredients, as well as issues with production, labelling and packaging.
Poultry meat and poultry meat products have featured in the top six since 2020 because of ongoing issues with the level of non-compliance of Polish chicken and chicken products with Salmonella serovar Enteritidis (also known as Salmonella Enteritidis) which has resulted in more surveillance and sampling of these products.
Many of these categories feature prominently in FSA and FSS sampling activity, reflecting their vulnerabilities and the need for ongoing surveillance and monitoring.
Since 2019 (figure 37), only eight of 35 different product categories (Appendix 5) have featured in the top six food categories for food incidents, suggesting a generally consistent pattern in the nature of incidents.
Figure 37: Top six food categories involved in reported incidents from 2019 to 2022
Contamination by harmful microorganisms
The most common type of hazard involved in food incidents reported during 2022 were pathogenic microorganisms, accounting for 29% of all cases. Salmonella continues to account for the majority of these microbiological incidents. While headline figures for contamination by microorganisms show a substantial year-on-year rise, this is largely explained by a significant increase in the number of avian influenza incidents recorded in England during 2022 compared to the previous year (footnote 1). If we deduct these cases, the figures for pathogenic microorganism incidents in food and feed remained broadly stable between 2021 and 2022, although this still represents a significant rise in cases compared to 2019 (figure 38).
Avian influenza and food safety
Although avian influenza does not pose a food safety concern, the FSA and FSS have a role to coordinate the response to notifiable disease in food-producing animals. In the case of avian influenza, this involves tracking and tracing poultry sent for slaughter in the lead up to confirmation of disease, for animal disease control purposes. A total of 228 cases of avian influenza were reported in 2022, compared to 56 in 2021.
Figure 38: Number of incidents of contamination by microorganisms in the UK
| N/A | 2019 | 2020 | 2021 | 2022 |
|---|---|---|---|---|
| Pathogenic Microorganisms | 360 (14%) | 431 (19%) | 584 (25%) | 647 (29%) |
(Text in brackets: Percentage of total number of food and feed incidents for that year)
Food incidents involving allergens
The number of reported incidents relating to undeclared or incorrectly declared allergens returned to pre-pandemic levels in 2022, following a decline in cases during 2020 and 2021. Incident reporting is now broadly on par with higher figures seen in previous pre-pandemic years, following reductions in 2020 and 2021.
Although we do not know for sure, the reduction seen in 2020 and 2021 may have been due to a combination of changes to consumer behaviours during the pandemic, the streamlining of food production lines, a reduction in the number of businesses operating at the time, and changes to food audits that were undertaken face to face on food premises. It appears that as things have returned to normal after the pandemic, the number of allergen-related incidents has also reverted to pre-pandemic trends.
The FSA and FSS will continue to support food businesses to implement effective allergen controls, including accurate labelling and consumer information and good allergen management in food production and supply.
Figure 39: Number of food incidents involving allergens
| N/A | 2019 | 2020 | 2021 | 2022 |
|---|---|---|---|---|
| Allergens | 355 | 240 | 272 | 322 |
The prevalence of foodborne disease
Although reported incidents of contamination by harmful microorganisms remained high, our analysis does not suggest any particularly marked changes in the rates of foodborne disease detected during 2022 - with one notable exception.
Data from the UK public health agencies (figure 40) shows that reported cases of Salmonella spp. infections in the UK increased during 2022 but remain below pre-pandemic levels. Reported cases of Campylobacter spp. infections and Listeria monocytogenes are comparable to pre-COVID-19 pandemic levels. Reports of STEC O157, however, rose to their highest level since 2015, largely due to a major national outbreak investigated in the summer of 2022.
It is important to note that not all cases of infection by these pathogens are due to foodborne transmission – for instance, infections can be acquired through person-to-person spread – and therefore changing levels may not necessarily provide a judgement on UK food standards.
Figure 40: Trends in the UK Laboratory confirmed cases per 100,000 population of the four major GI pathogens
Campylobacter

Salmonella

STEC O157

Listeria monocytogenes

Source: The data is derived from multiple live reporting systems managed by the UK public health agencies (UK Health Security Agency, Public Health Wales, Public Health Scotland and the Public Health Agency of Northern Ireland). Data is provisional and may change.
The data in figure 40 is derived from multiple live reporting systems. The rates per 100,000 population stated (y axis) are calculated using ONS mid-year population estimates (2021 estimates used for 2022 as 2022 estimates not yet available). Trends over time should be interpreted with caution, particularly over the COVID-19 pandemic period (2020 to early 2022) due to many factors which impacted pathogen reporting.
The role of whole genome sequencing
Since 2015, UK National Reference Laboratories at the UK Health Security Agency (UKHSA) have used routine WGS to detect, understand and track major gastrointestinal pathogens such as Salmonella spp, STEC, Shigella spp., and Listeria monocytogenes.
WGS is a laboratory-based method whereby the entire genetic makeup of a specific organism or cell type is rapidly determined in a single process. It provides a very precise DNA fingerprint that can help link cases to one another, thereby allowing an outbreak to be detected quickly.
Between January 2022 and December 2022, 40 foodborne outbreaks were identified and investigated (figure 41) that were attributed to specific pathogens, resulting in a number of successful outbreak investigations identifying the vehicle and/or source of contamination after which effective control measures were implemented including:
Case study: Salmonella spp. in Ferrero chocolate
The management of an outbreak of monophasic Salmonella Typhimurium in chocolate products made by the Ferrero group illustrates how whole genome sequencing is enhancing our ability to track, identify and respond to food safety issues across international boundaries.
The public health agencies analysed food exposure information collected from cases of illness in March 2022, and found that a common link across all cases was the reported consumption of Kinder eggs and other products manufactured by Ferrero. This was confirmed a fortnight before Easter 2022, when consumption of chocolate eggs by children was expected to increase dramatically.
WGS confirmed that cases of salmonellosis were linked and food chain investigations traced the issue to one manufacturing site in Belgium. This food chain link led to a major recall of affected products. As the UK was the first country to identify the outbreak and the source, the UK investigation findings were also shared internationally, leading to further product recalls in 98 other countries and the suspension of manufacturing at the Belgian Ferrero site during the summer of 2022.
Figure 41: Number of outbreaks attributed to specific pathogens reported in the UK, 2022

* Norovirus is largely, (but not exclusively), recorded as ‘suspected norovirus’ as this is not confirmed routinely by microbiology, but instead most commonly recorded as the cause based on symptoms reported by cases and clinical presentation.
Food alerts and recall notices
Once a food incident has been identified, the affected product may have to be withdrawn or recalled – as was the case in the Ferrero example described above. FSA and FSS publish various alerts to let consumers and other food businesses know about the issue and what action is needed to minimise the risk.
An Allergy Alert is published when the product has been, or is being, recalled from consumers because allergen information on food labels is either undeclared (including not in English) or incorrect.
A PRIN is published when there are concerns about the safety of a product, most often due to the contamination, mis-packing or mis-labelling of products.
A FAFA is issued to local authorities and consumers when the distribution of products is less well-defined or when a food business is not taking the required steps to remove products from sale and remedial action from local authorities is required.
There was no overall change in the combined number of Allergy Alerts published by the UK’s food agencies in 2022 compared to the previous year (figure 42) despite the number of allergen incidents increasing. This is largely because food safety actions were taken before the affected products reached consumers.
Products containing undeclared milk remain the most common food category for which an allergy alert was published, followed by undeclared nuts, eggs and cereals containing gluten (figure 43).
Meanwhile, a total of 80 PRINs were published in 2022 (figure 44), due to issues such as microbiological contamination, physical contamination, production faults or incorrect date codes applied to products.
Figure 42: Total number of Allergy Alerts published by the FSA and FSS
| N/A | 2019 | 2020 | 2021 | 2022 |
|---|---|---|---|---|
| UK | 115 | 77 | 83 | 83 |
Source: FSA/FSS Incident Management Systems
The year-on-year change in the number of PRINs issued between 2021 and 2022 (a 23% rise) is largely due to changes in the way we capture this data: all updated alerts that are published when there is a change to the original product recall are now recorded in the total. The trend therefore does not indicate any substantial increase in serious food incidents.
There have been no FAFAs published in the past two years, which indicates that where there is a safety issue, food businesses are working alongside local authorities and the two national food agencies to ensure safety requirements are followed.
Figure 43: Allergy alerts by type of allergen
Figure 44: Total number of PRINs issued in the UK
| Country | 2019 | 2020 | 2021 | 2022 |
|---|---|---|---|---|
| UK | 56 | 66 | 65 | 80 |
Source: FSA/FSS Incident Management Systems
Deep dive 2: Food Surveillance sampling
Introduction
Targeted food sampling is another important way of monitoring the safety and authenticity of our food While local authorities and food businesses routinely test products to ensure they meet legal requirements, scientists commissioned by the FSA, FSS and Defra periodically sample selected products to track emerging risks to ensure standards are being maintained and inform policy development The samples referred to in this section are unofficial samples, meaning samples were not directly taken by authorised sampling officers and the results could not be used in an enforcement case or prosecution.
The role of Official Laboratories
The UK is required by law to have designated Official Laboratories (OLs) that analyse the safety and composition of food and feed samples sent by local authorities or Port Health Authorities (PHAs) for enforcement or surveillance purposes.
Local authority sampling activity has reduced substantially in recent years – for instance, in England, Wales and Northern Ireland, the number of non-microbiological samples taken between 2016 and 2021 dropped by 79.1% while in Scotland, there was a 70.9% decrease in microbiology and chemistry samples between 2016/17 and 2020/21. As a result, many OLs have closed – for instance, England had nine in 2013 compared with four since 2019. With less access to European laboratories since our departure from the EU, FSA and FSS need to maximise UK testing capacity so that this important analysis can continue.
While the availability of laboratory resource has stabilised during 2022, we continue to invest in UK capacity, capability and expertise. In Scotland, there are four publicly funded food testing laboratories (public analyst laboratories). These four laboratories are responsible for microbiological examination and chemical analysis, including contaminants, standards, authenticity, and allergen testing of all food samples collected in Scotland.
In this section, we summarise the findings from the three surveys carried out in 2022: the FSA’s targeted sampling survey 2022, FSS’s compositional and chemical sampling programme and Defra’s meat and fish speciation survey These programmes and activities are carefully coordinated across government to ensure join-up, maximise efficiency and that FSA and FSS programmes are driven by regional needs and intelligence.
However, the results need to be understood in context. Since FSA and FSS surveys are highly targeted at where we know risks to be, they carry a greater likelihood of identifying unsatisfactory results and are therefore not representative of overall UK food standards. The findings do, however, offer crucial insights that help the national food safety authorities, industry and enforcement authorities respond to potential issues within the food chain and better target limited resources.
For example, local authorities have already taken direct action on the back of last year’s results, providing advice and support to individual businesses on issues ranging from undeclared milk in bread products, to oregano found to contain olive leaves. Both FSA and FSS also work closely with industry to share intelligence and tackle areas of concern, particularly through the FIIN.
The FSA targeted survey 2022
What was tested
Around 600 samples were tested for authenticity issues and the presence of allergens and contaminants. Labels were also checked for accuracy and compliance with food information standards. The items tested in the survey included those previously known to be at high-risk of failures in compositional standards or authenticity – for example, oregano was included due to international challenges regarding authenticity.
Some of the food items are the same as in previous years, so that we can see how failures change over time and identify emerging issues. Others were included to check that standards are being maintained despite the economic pressures on food producers (for example, compositional standards of sausages and minced beef). These were supplemented with other commonly consumed foods such as bread and milk.
Headline results
- 86% of samples passed all the checks, compared to 89% last year. For large food businesses (such as supermarkets or wholesalers) 96% of samples tested were fully compliant.
- around a third of all reported failures (28 out of 82) were related to labelling issues While most were relatively minor, there were some more serious breaches where ingredients labelling, including allergen information, was missing, or incorrectly presented on the packaging.
- a fifth of the bread samples analysed for milk and sesame (seven out of 35) were found to have undeclared allergens, all of them relating to products that were prepacked for direct sale. Five out of 106 samples of vegan products (which were tested for milk, egg, and peanut), and free-from products (tested for milk, gluten, and nuts) were also deemed unsatisfactory due to undeclared allergens or labelling. Of the four failures, one related to undeclared gluten in a free-from product and three were for vegan products containing undeclared milk and peanut.
- sausages and minced meat were checked to determine the exact species present in the food sample. The meat content of the sausages was also assessed and the fat, protein and collagen content of mince to make sure these matched the declared value on the packets. While only one sample out of 80 was unsatisfactory for authenticity (sheep DNA detected in pork sausage), 11 samples did not meet levels declared on the label: six out of 40 sausage samples, for example, contained less pork meat than declared.
- yoghurt, tested for the first time for composition issues (milk protein content, benzoic acid and sorbic acid), had three non-compliances. Butter and margarine spread (milk fat content), yielded results that were marginally better than the previous year. Oregano (authenticity, mycotoxins and heavy metals), basmati rice (authenticity), and milk (fat content), showed similar failure rates to the 2021/22 survey, indicating continued challenges with these products. The number of cheese (speciation and fat content) non-compliances increased, and there was also a notable increase in the failure rates of olive oil against the standards tested – from just 7% in 2021 to 25% in 2022. However, the majority of these were related to minor labelling inconsistencies, rather than the composition of the product (for example, mandatory storage instructions not being given).
Figure 45: Summary of unsatisfactory sampling results by category

*Five commodities were added in 2022/23 and therefore do not have comparison data from 2021/22.
Figure 46: Reasons for non-compliance across all samples

FSS compositional and chemical contaminants sampling programme 2021/22
What was tested
The programme tested prepacked beef mince, oats and oat-based foods and drinks, almond-based and coconut-based drinks for various compositional and chemical contaminants issues. In addition, a range of vegan and free-from food products were also checked for the presence of undeclared allergens.
Headline results
- Eight out of 45 samples (18%) of prepacked beef mince products were deemed unsatisfactory in compositional analysis.
- Mycotoxins were found in several samples of oats and oat-based products, but not at levels that would present any risk to public health. None of the samples failed due to unsafe levels of heavy metals.
- out of 80 samples of vegan and free-from products, three were found to contain undeclared allergens.
- none of the samples of almond-based drinks were found to contain unsafe levels of mycotoxins or heavy metals, and all coconut drinks sampled had less than 10 µg/kg of 3-monochloropropane diol (3-MCPD), a chemical contaminant, a level considerably below that considered to be a risk to health.
Defra's meat and fish speciation survey 2022
What was tested
In 2022, Defra funded an informal food authenticity sampling exercise as part of broader FSA-coordinated sampling activity to help inform future sampling programmes. The exercise examined the possible presence of undeclared species in 354 retail and wholesale processed meat and white fish products and was delivered by a commercial private laboratory.
The samples originated from one of three areas: UK, EU and outside the EU, and were purchased at different outlets spread over nine geographical locations within England. Any non-compliant Defra survey samples were flagged to the FSA and NFCU for follow-up action.
Results
The overall results showed the level of compliance with labelling rules covering the identification of species in meat and fish as 96%.
The four key elements of the FSS sampling programme
1. Prepacked beef mince and steak products were tested for levels of fat and connective tissue (which indicated presence of material other than the muscle meat). This testing helps to assess compliance with legislative labelling requirements and progress made towards the Scottish Food Enforcement Liaison Committee’s (SFELC’s) guidelines on quality standards for beef mince and steak mince.
2. Samples of oats and oat-based food and drink products were collected and tested for a range of mycotoxins and heavy metals. These contaminants can occur naturally in oats and if they are present in excessive levels, they can have negative effects on health.
3. Almond-based drink products were collected and tested for mycotoxins and heavy metals while coconut drinks were tested for 3-MCPD and other glycidal esters. Mycotoxins are naturally occurring toxins produced by moulds and can be found in almonds, while 3-MCPD is a contaminant which can occur in certain foods during processing. Both can be harmful if consumed in excessive amounts.
4. Samples from five food groups – vegan and dairy-free products, dairy-free meals, gluten-free cereal, cereal bars and cakes, and nut-free meals – were collected and tested for the presence of undeclared allergens to test compliance with labelling legislation.
Conclusions
Overall, in the areas targeted, there is no statistical difference in the level of non-compliant results from previous years for the sampling surveys, with large businesses having a higher level of satisfactory results than smaller food businesses. This provides a degree of confidence that food standards are being maintained, especially given that sampling was informed by intelligence and targeted at high-risk areas.
The findings also reveal some potentially serious public safety issues relating to allergen declarations, reinforcing the continued need for regular checks by local authorities and businesses as part of routine testing and enforcement. FSS funded sampling of mince and sausages, undertaken to assess the quality of products purchased by consumers, also showed a significant number of non-satisfactory results.
While providing useful insight, our sampling programmes focus limited resource to target specific risks and commodities in the UK food system and are not complete, comprehensive sampling programmes. Investment in wider surveillance would be required to give better coverage of the UK food system.
Country of origin testing
No Country of Origin (COO) testing was undertaken in these surveys. While this testing is offered commercially and can provide qualified insight into authenticity concerns in this area, there are challenges in terms of achieving a definitive result, with any anomalous results likely to require verification through other routes. Consumer interest remains high in this area of surveillance and sampling, and the FSA is working in partnership with Defra to review COO testing and to assess the feasibility of methods for use in enforcement.
Case study: Understanding authenticity challenges: honey
Honey is a natural, complex mixture of different sugars produced entirely by bees. While there is no evidence that any honey on sale in the UK is unsafe, it is a product that could be illegally substituted or adulterated by adding undeclared sugar. There is no single testing method that can confirm the authenticity of honey.
This has led to claims of honey fraud, and a recent report from the EU has highlighted concerns linked to adulteration with sugar syrups, based on the reported ‘suspicious’ results of coordinated sampling of imported honey conducted by member states. This report also highlighted the limitations of laboratory methods, if used alone, to prove adulteration and the need for improved, harmonised, widely accepted testing methods to validate the authenticity of the samples. Further investigations by the importing countries to follow-up on the results flagged as ‘suspicious’ are underway. An independent UK expert honey group has been set up by Defra to advise on the conclusions of the EU report based on the scientific analysis carried out and the interpretation of the approach used to determine the sample results.
The FSA, FSS and Defra have a significant programme of work devoted to honey. Its aim is to engage and work with the honey community including researchers, enforcers, industry, and international bodies to protect this important commodity. The work programme is taking steps to improve current authenticity testing methods, working with UK experts to solve this challenging problem. Through these advances – which include the development of better technology, standardising and validating testing approaches, improved understanding of weight of evidence application and good enforcement practices – we will have an improved suite of tools to ensure the authenticity of honey on sale in the UK.
Deep dive 3: Food crime
Introduction
As we have already seen, sampling can help the national food standards agencies work with local authorities and other partners to respond to recognised problems with safety and authenticity which can then be worked through with the businesses concerned However, surveillance sampling is one of the ways we can pick up more sinister examples of malpractice and plays an important role in enabling us to detect and respond to signs of criminality within our food system
Food crime is defined as serious fraud and related criminality in food supply chains, including drink and animals. It ranges from the theft, adulteration or misrepresentation of food and feed products to the unlawful processing and disposal of food, drink and feed during and after production. There is often a deliberate intention by criminals to keep this activity hidden, which is one of the reasons why so many instances of food crime go unseen and unreported. However, as a recent academic report commissioned by the FSA has found, food crime could cost the UK economy and society as much as £2 billion per year and affects consumers, businesses and regulators alike.
The NFCU and SFCIU work with the food and drink manufacturing industry, food retailers and local authorities to identify, investigate, disrupt and prevent food crime. Both units protect consumers and legitimate businesses by conducting intelligence-led investigations, bringing about criminal prosecutions, assessing and communicating threats, and working with other regulators, government, law enforcement and industry to prevent food crime.
What did the food crime units focus on in 2022?
Both food crime units set priorities that are described in their respective Control Strategies. These are based on their analysis of the opportunities for criminal behaviour or on known vulnerabilities within the food chain. While these priorities are balanced against a wider need to remain alert to other emerging food crime threats, they set the direction for the intelligence that the food crime units gather from a range of sources including the food industry, local authorities and the public. In fact, of the 1,814 food crime intelligence reports received during 2022 – defined as pieces of information relating to a new or already identified food crime – approximately two-thirds (65%) related to these strategic priorities.
Live investigations
Once intelligence is received and assessed, if there is reasonable suspicion that a crime has been committed, an investigation may be opened by the units or referred to other law enforcement agencies.
A total of 35 live investigations were led by the two UK food crime units during 2022. As figure 47 shows, they tackled a wide range of threats, including those involving:
- the red meat sector – such as falsifying where the meat comes from.
- the re-entry of products not intended for human consumption like Animal By-Products (ABP) into the food chain.
- the pursuit of suppliers of dangerous non-foods sold as food.
Serious fraud investigations undertaken in 2022 resulted in complex criminal cases progressing through the justice system. Currently, two cases relating to ABP diversion and conspiracy to steal high-value food items through the impersonation of legitimate businesses and an associated charge under the Proceeds of Crime Act 2002 are awaiting trial.
In Scotland, SFCIU investigations focused on suspected fraud in relation to counterfeit alcohol, traceability and adulteration issues in the meat supply chain, and illegal slaughter in non-approved premises, with several investigations similarly progressing through the criminal justice system.
As figure 47 shows, the focus of the investigative work carried out in 2022 shows a notable proportion of food crime investigations involved meat and meat products, although our enquiries continue to span a range of commodities.
While we should not necessarily draw any conclusions from this about the susceptibility to food crime across these food types, this does indicate where our investigators are focusing time and resource.
Figure 47: The key areas of focus for food crime investigations in 2022
| Key areas of focus | Number of live investigations |
|---|---|
| Meat and meat products | 10 |
| Other | 8 |
| Alcohol | 6 |
| Dangerous non-foods | 4 |
| Diversion of animal-by-products | 3 |
| Confectionary | 2 |
| Fish and seafood | 2 |
Disrupting food crime
Both the NFCU and SFCIU work with industry, local authorities and other enforcement agencies to disrupt or deter criminal behaviours. ‘Disruptions’ are recorded when an intervention has a direct impact on food crime like a criminal group being stopped from operating in the usual way, for example by seizing criminal assets or taking down websites illegally marketing dangerous non-foods.
A total of 102 disruptions were achieved across the units during 2022. In England, Wales and Northern Ireland, the majority (64%) of the NFCU’s disruptions involved actions taken against dangerous non-foods marketed for human consumption. This included the removal or suspension of websites offering the sale of the toxic chemical DNP marketed illegally as a fat burner.
New responsibilities for tackling illegal sales of DNP
From 1 October 2023, the police will hold responsibility for offences relating to DNP, including unlawful sales, through enforcement of the Poisons Act 1972. This will be part of a holistic approach across Government towards tackling the sale and use of the substance and the NFCU will be working to ensure a smooth transition of responsibility and continuity of focus.
Both food crime units also actively disrupted criminal activity in the red meat sector and the diversion of animal by-products into the food chain through operational activities, such as coordinated enforcement visits to processors and producers.
In Scotland, more than a third (35%) of SFCIU-led disruptions similarly centred on malpractice and criminality involving meat and meat products. The SFCIU took action against fraudulent activity involving tea, confectionary and honey and made a series of unannounced visits to various licensed venues to check for counterfeit products, support responsible businesses and deter any potential future criminal activity.
Both units also undertook targeted work with businesses to design out the opportunity for food fraud through better policies, procedures and controls.
Figure 48: The key areas of focus for disruptions carried out by food crime units in 2022
| Key areas of focus | Number of live investigations |
|---|---|
| Dangerous non-foods | 48 |
| Meat and meat products | 25 |
| Other | 19 |
| Diversion of animal-by-products | 5 |
| Fish and seafood | 3 |
| Alcohol | 2 |
A snapshot of major food crime investigations in 2022
Operation HAWK
Operation HAWK is an ongoing criminal investigation into suspected meat fraud. The NFCU began an investigation into food fraud allegations linked to the country of origin of cooked meat products supplied by a food business in August 2021 and began seizing evidence shortly afterwards. Affected products were removed from shelves immediately. Misrepresentation is the primary focus of Operation HAWK. Live food safety issues are not part of the investigation, but historical food safety concerns were investigated and addressed.
Operation PEARL
The NFCU supported Chichester District Council in tackling the harvesting of shellfish from beds that were classified as unsafe for human consumption. Shellfish beds are classified in accordance with the levels of E. coli detected in shellfish flesh. In this instance, the harvesters were picking from prohibited areas where high E. coli levels made the beds unsafe for human consumption. This operation seized and destroyed illegally harvested products and took enforcement action against both the harvesters and the business receiving the product. This has helped to deter offending in this area, with reduced reports of illegal harvesters.
Operation MOONRAKER
Led by Wiltshire County Council with NFCU support, Operation MOONRAKER investigated several illegal meat cutting plants operating out of car washes. The meat was being cut in unapproved premises, posing significant health risks to consumers. In 2021, the NFCU successfully supported Wiltshire County Council in criminal proceedings that resulted in a 10-month prison sentence for the offender.
During 2022, the NFCU was granted a confiscation order against the offender to the value of £154,000 – this included the seizure of realisable assets worth £3,500. Confiscation orders add an extra layer of consequence over and above standard criminal justice outcomes for offenders, increasing the deterrent effect.
Operation OPSON
Both NFCU and SFCIU participated in Operation OPSON, an international initiative co-ordinated by Europol and INTERPOL to tackle the sale of counterfeit and substandard food and drink products. The NFCU and SFCIU supported and coordinated partners, particularly local authorities, in completing over 400 checks throughout the UK during 2022. This included 300 checks of fish and seafood supply chains, which identified a number of minor breaches, and over 100 checks on alcohol products, which found that some small-batch gins and vodka did not meet advertised alcohol content levels.
Operation SLAINS
In the first case of its kind to be prosecuted in Scotland, a man pleaded guilty to culpably and recklessly supplying the public with the toxic chemical DNP for human consumption. It is often marketed as a fat burner and since 2007, 33 people have died in the UK through DNP ingestion. The SFCIU led joint investigation involving Falkirk Council and Police Scotland, completed in 2022, proved that between May 2017 and October 2021 the individual had supplied substantial amounts of DNP to customers in the UK and globally to USA, Asia and Australia for significant financial gain. He was subsequently sentenced to 37 months in prison. The circumstances of this case helped inform a Home Office review on DNP, leading to it being classified under the Poisons Act 1972 (see p.106).
Licensed premises visits in Scotland
In October 2022, as part of tackling fraud in the alcohol supply chain, the SFCIU and partners coordinated 43 unannounced visits to licensed premises in Glasgow. These were carried out over a two-day period to check the authenticity of specific brands being sold, support responsible businesses and deliver a prevention message to those knowingly selling counterfeit brands. No issues were identified, and businesses responded positively to the visits.
Did food crime increase in 2022?
Criminals will always seek opportunities to profit, and those opportunities can often arise from broader economic conditions. Particularly favourable conditions arose in 2022: price inflation, the disruption caused by the COVID-19 pandemic, extreme climate events, and the impact of the Ukraine conflict on supply chains opened new avenues for criminal behaviour and increased the incentives to commit food crime.
However, while there are some indications of some regulatory non-compliance driven by cost pressures, we have not detected any evidence from our intelligence, surveillance and sampling programmes that there has been a major shift in either the volume or pattern of serious food fraud during 2022.
This finding is backed up by data on authenticity shared by the food industry itself via the FIIN. However, this data is skewed towards larger businesses that are likely to be better protected against criminal influences within their supply chain.
That said, both FSA and FSS remain acutely aware of the heightened risks presented by the economic and geopolitical environment and continue to factor this into the food crime units’ work.
In summary
Available data on food and feed incidents paints a relatively stable picture for 2022. There have not been any meaningful shifts in the overall volume of food and feed incidents reported, or in the number of alerts issued by FSA and FSS. While cases of STEC O157 rose to their highest levels since 2015 due to a major outbreak in summer 2022, rates of other foodborne disease have returned to pre-pandemic levels.
The national food sampling programmes conducted last year show that products from large food businesses are achieving very high rates of compliance across a range of authenticity and safety checks. However, it is clear that more work is needed to help smaller food businesses improve their compliance levels, and further action is needed to tackle specific failures across certain product types, particularly with regards to breaches in allergen controls. Both FSS and Defra studies also show the importance of continued surveillance of meat products to ensure authenticity and composition standards are being met. Information gathered from the 2022 surveys will help inform future sampling in 2023/24 surveillance activities.
Our national food crime units carried out major investigations across the UK during 2022, resulting in high-profile prosecutions. They also delivered a range of targeted actions to disrupt criminal activity. However, our food system remains a target for criminals, particularly in light of the challenging economic environment and the disruption to food chains caused by global events. Although we have not found any evidence to suggest that this translated into more criminal activity during 2022, our food crime units continue to work closely with local police, trading standards and others to protect consumers and businesses and take effective action against perpetrators.
Our report highlights record numbers of people experiencing food insecurity in 2022.
In his first Christmas address to the nation last year, King Charles referred to the “great anxiety and hardship” experienced by people struggling to “pay their bills and keep their families fed and warm” His message reflected the experiences of many people as they struggled to cope with the rising cost of living.
The challenge people faced is reflected in the apparent paradox that, even as food prices rose, the overall amount we spent on in-home food went down by around £8 billion during 2022. Our own research shows that with higher housing costs, energy bills, petrol, and other household expenses, many have had to pare back our food budgets to make ends meet. Households across the income spectrum have been forced to make sacrifices as a result of cost of living pressures.
Our report highlights record numbers of people experiencing food insecurity in 2022. One in five households in England, Wales and Northern Ireland reported eating a “reduced quality, variety or desirability of diet”, while one in ten households also reported “disrupted eating patterns and reduced food intake” according to the FSA’s research. In Scotland, 41% of adults expressed concern about being able afford food compared to 25% in 2021, while the number of adults skipping meals and reducing portion sizes to save money also increased sharply.
These are distressing figures that show the scale and human cost of the inflationary pressures experienced across the UK in 2022. They also carry a warning for the future. When you consider that research published by the Food Foundation in June 2023 showed the poorest fifth of UK households need to spend 43% of their disposable income to achieve government healthy eating guidelines, it is reasonable to conclude that economic challenges present, and will continue to present, a barrier to good dietary health.
Only time will tell whether the differential patterns of inflation we have observed across the Eatwell food categories result in any long-term changes in our diet and health outcomes, but we cannot afford not to take what action we can right now to mitigate the risks. We believe it is vital that the government, the food industry, and regulators continue to work together so that healthy food is accessible to all.
Our assessment of standards in other parts of the food system – through data gathered on incidents, food crime, safety and hygiene in food and feed establishments – suggests that, overall, food standards remained stable in 2022. Intelligence and checks at the border do not suggest any significant change in the safety of imported food from outside the EU during 2022; however, the full picture remains incomplete until we have access to similar data for EU imports. We will continue to press the Government to introduce these checks as scheduled in January 2024.
Critical challenges
Just as last year, our conclusions on the overall state of UK food standards in 2022 are cautious and qualified as we believe there are several critical challenges ahead.
The first is local authority resourcing. If there are not enough people with the right skills to deliver essential food controls, local authorities cannot reliably identify, verify, and provide assurance on our food system and monitor and respond to problems in our food supply chains. The analysis in this report sets out the long-term decline in funding for local authorities and the reallocation of their resource away from food safety and food standards duties over the last decade. There are also worryingly high rates of unfilled vacancies in these posts.
It is vitally important that local authorities devote sufficient resource to food safety and standards controls and that they have the funding to do so. Local authorities, professional bodies, and others such as FSA and FSS, who rely on the environmental health and trading standards professions, also need to work together to ensure these professions attract and retain people for the future.
Local authority teams deserve credit for the way that they have restored inspection volumes since the pandemic, but we are concerned that the many pressures being placed on them – in making up the post-pandemic backlog of inspections, dealing with the increasing numbers of food business opening up (including the rising number of online food operators) and taking on additional responsibilities following EU Exit – are hampering their capacity to conduct critical food safety and standards checks. These pressures have also resulted in a decline in sampling activity by local authorities in recent years, making it more difficult to detect potential safety and authenticity issues.
The second relates to the availability of Official Veterinarians. During 2022, the FSA faced specific, complex challenges in recruiting and retaining vets as Official Veterinarians (OVs) to fulfil our statutory role in abattoirs - ensuring animal health and welfare, and food safety and security is maintained. Without OVs in abattoirs every day, abattoirs cannot legally operate. If sufficient OVs are not available, this would not only have animal health and welfare consequences, it could disrupt domestic food supply and the ability to export products of animal origin. There is a widely documented shortage of vets in the UK, with the UK historically relying heavily on overseas vets to fulfil public health roles. This shortage is more acutely felt in abattoirs because UK vets consider this role to be less appealing than other veterinary work such as private practice. More recently, veterinary shortages within the UK have resulted in higher salaries as demand for vets has increased, which has impacted recruitment in public health roles. Historically, there has also been pressure to reduce charges to industry for vet services and the financial constraints on the public purse means it is very difficult to compete with private sector salaries.
The FSA has relied on the continuation of temporary measures granted by the RCVS allowing appropriately qualified veterinarians from EAEVE-accredited universities to work as Temporarily Registered Novice OVs (TRNOV) under supervision during 2022 to help us deal with the capacity challenges within the veterinary profession. We need to recruit and retain enough vets to continue delivering official controls in slaughterhouses, as well as securing an adequate pipeline of trained professionals in the longer term. Without this, the meat supply chain cannot operate continuously and we risk having insufficient numbers of vets to sign export health certificates. The shortage of vets in the public sector has implications for the whole of Government and industry. We now need to consider more significant and fundamental steps to address this serious issue.
The third relates to import controls. We note the UK Government plan to introduce a new imports Border Target Operating Model in 2024, though are disappointed by the delays in implementation. These controls will help provide assurance that EU food and feed imports meet our safety standards and allow us to identify and stop potentially unsafe food at an earlier stage. We echo our call from last year to ensure that these controls are implemented without any further delay to provide a greater level of public health protection.
A constructive and open partnership
There are three key lines of defence in making sure that food is safe and authentic - food businesses, local authorities and FSA/FSS.
Our final message, therefore, is the need for a constructive and open partnership to solve these problems, working together in the interests of consumers in the UK and those abroad who trust in UK food. It has never been more important for everyone involved in food production, manufacture, or distribution and those who govern the system to work together to keep the consumer safe.
At a time when consumers are facing real challenges in purchasing food, and businesses are facing significant cost pressures in producing and supplying food, it is critical that those with power and influence in the system do everything we can to create a food system that seeks to provide safe, healthier, and more sustainable food for everyone and ensure that the high food standards we enjoy in the UK are maintained.
Appendix 1 a full list of acronyms used in the Annual report on food standards 2022.
| Acronym | Phrase |
|---|---|
| ABP | Animal By-Product |
| CIEG | Chartered Institute of Environmental Health |
| CTSI | Chartered Trading Standards Institute |
| COO | Country of Origin |
| CPIH | Consumer Prices Index including owner occupiers’ housing costs |
| DAERA | Department of Agriculture, Environment and Rural Affairs |
| DBT | Department for Business and Trade |
| Defra | Department for Environment, Food and Rural Affairs |
| DNP | 2,4 Dinitrophenol |
| EHO | Environmental Health Officer |
| EU | European Union |
| FAFA | Food Alert for Action |
| FBO | Food Business Operator |
| FHIS | Food Hygiene Information Scheme |
| FHRS | Food Hygiene Rating Scheme |
| FIIN | Food Industry Intelligence Network |
| FNAO | Food Not of Animal Origin |
| FSA | Food Standards Agency |
| FSS | Food Standards Scotland |
| FTA | Free Trade Agreement |
| GB | Great Britain |
| HIN | Hygiene Improvement Notice |
| HRFNAO | High-Risk Food Not of Animal Origin |
| IOC | Intensified Official Controls |
| IPAFFS | Import of Products Animals, Food and Feed System |
| MHI | Meat Hygiene Inspector |
| NDNS | The National Diet and Nutrition Survey |
| NFCU | National Food Crime Unit |
| OL | Official Laboratory |
| ONS | Office for National Statistics |
| OV | Official Veterinarian |
| PHA | Port Health Authority |
| POAO | Products of Animal Origin |
| PRIN | Product Recall Information Notice |
| RASFF | Rapid Alert System for Food and Feed |
| RCVS | Royal College of Veterinary Surgeons |
| SFELC | Scottish Food Enforcement Liaison Committee |
| SFCIU | Scottish Food Crime and Incidents Unit |
| SoCOEHS | Society of Chief Officers of Environmental Health in Scotland |
| TAC | Trade and Agriculture Commission |
| TOM | Target Operating Model |
| TSO | Trading Standards Officer |
| USDA | United States Department of Agriculture |
| UKHSA | UK Health Security Agency |
| WGS | Whole Genome Sequencing |
Glossary of terms used in the Annual report on Food Standards report 2022.
| Term | Explanation |
|---|---|
| Additives | Food additives are ingredients that are added to food for particular functions. |
| Aflatoxins | A toxic compound produced by certain moulds found in food, which can cause liver damage and cancer. |
| Allergens | There are 14 allergens declarable by law, but consumers may be allergic or have intolerance to other foods or ingredients. |
| Campylobacter | A cause of food poisoning, mainly spread by cross- contamination from raw chicken. |
| Climate events | Long-term shifts in weather patterns and temperatures, some natural and some caused by the burning of fossil fuels since the 19th century. |
| Dinitrophenol (DNP) | A highly toxic chemical, which is poisonous to humans and can cause death. |
| Disruptions | A recently implemented measure of food crime interventions which stop or reduce the opportunity for food crime offending and, in doing so, increase UK food security by ensuring food is safe. |
| E.coli | Escherichia coli is a type of bacteria that can be found in the intestines of animals and humans. Some strains can cause serious illness in humans, such as Vero Cytoxin-producing E. coli (VTEC). |
| Fibre | A type of carbohydrate that the body cannot break down. Found naturally in plant foods like wholegrains, beans, nuts, fruit and vegetables, it helps keep our digestive system healthy. |
| Free sugars | All sugars naturally present in fruit juices, vegetable juices, purées and pastes and similar products in which the structure has been broken down; all sugars in drinks (except for dairy based drinks); and lactose and galactose added as ingredients. |
| Free trade agreements | Trade agreements set out the rules that cover trade between two or more countries. They aim to make trading easier between those countries. They do this by reducing the restrictions on imports and exports between them. |
| Genome sequencing | A technique used to ‘read’ DNA which, in the context of this report, allows scientists to identify and differentiate between different bacterial and viral strains. |
| Household food insecurity | A term used to describe households that are without reliable access to a sufficient quantity of affordable, nutritious food. |
| 3-MCPD | A food contaminant that is a by-product of certain food manufacturing processes involving vegetable fats (for example, vegetable oil). |
| Official controls | Generally meaning inspections, enforcement, advice & guidance that are required in law or government guidance. |
| Online food operators | Online food operators Food providers engaged either by computer or smartphone via the internet to deliver food directly to the consumer. |
| Pathogen | A bacterium, virus or other organism that can cause disease. |
| Processed meat | Any meat which has been modified in order to alter the taste or extend its shelf life. |
| Rapid Alert System for Food and Feed (RASFF) | An EU system enabling information to be shared efficiently between EU, EEA and EFTA countries. |
| Risk analysis | The process of assessing, managing, and communicating food and animal feed safety risks. |
| Salmonella | Salmonellas are a group of common bacteria that cause food poisoning. They are usually spread by inadequate cooking and through cross-contamination. Salmonella infection (salmonellosis) is a common bacterial disease that affects the intestinal tract. Salmonella bacteria typically live in animal and human intestines and are shed through faeces. Humans become infected most frequently through contaminated water or food. |
| Sampling | Sampling is the taking of a product to check that it is up to the standard needed. This may include being safe, of the desired standard, or that labelling is correct. It is undertaken to support enforcement, as part of business checks, and for research and surveillance purposes. |
| Saturated fat | A type of fat associated with an increased risk of high blood cholesterol, which can increase the risk of heart disease and stroke. |
| Sustainable | Reducing our carbon-footprint, promoting sustainable best practice, conserving natural resources and building environmental awareness through our policies and practice. |
Table of figures included in the annual report on food standards report 2022.
Setting this year's report in context
| Figure | Title |
|---|---|
| Figure 1 | Percentage change over 12 months of inflation by commodity type |
| Figure 2 | Percentage change over 12 months (2022) - Food Inflation rates vs overall consumer prices index including owner occupiers' housing costs (CPIH) |
Chapter 1: The nation's plate
| Figure | Title |
|---|---|
| Figure 3 | Percentage change over 12 months of inflation by commodity type |
| Figure 4 | Percentage change over 12 months (2022) - Food Inflation rates vs overall consumer prices index including owner occupiers' housing costs (CPIH) |
| Figure 5 | The top reported food concerns for consumers in England, Wales and Northern Ireland |
| Figure 6 | The top reported food concerns for consumers in Scotland |
| Figure 7 | Who is most vulnerable to food insecurity? |
| Figure 8 | Reported changes in consumer behaviours in response to rising prices in England, Wales, and Northern Ireland. |
| Figure 9 | Scottish Health Survey 2021 |
| Figure 10 | Changes to consumers’ food storage and cooking practices in England, Wales, and Northern Ireland |
| Figure 11 | Changes to consumers’ food storage and cooking practices in Scotland |
| Figure 12 | Changes to consumers’ food storage and cooking practices |
Chapter 2: Going global
| Figure | Title |
|---|---|
| Figure 13 | Total UK import volumes of all food and feed over time, 2014-22 |
| Figure 14 | Yearly percentage change in total import volumes |
| Figure 15 | Top 10 countries by import volumes for 2022 |
| Figure 16 | Changes in import vales across selected countries |
| Figure 17 | Total volume of imports split by main categories of POAO, FNAO and animal feed |
| Figure 18 | Percentage of rest of world consignments failing import checks in Great Britain, 2021-22 |
| Figure 19 | Changes to designation of high-risk foods |
Chapter 3: Keeping it clean
| Figure | Title |
|---|---|
| Figure 20 | Responsibilities for maintaining food hygiene controls across the UK |
| Figure 21 | Percentage of UK food businesses achieving satisfactory or better ratings for food hygiene, as of 31 December 2022 |
| Figure 22 | Percentage distribution of FHRS ratings as of 31 December 2022 |
| Figure 23 | Percentage of food business operators in Scotland compliant with food laws for 2021/22 financial year |
| Figure 24 | The number of food businesses issued a food hygiene rating by quarter for England, Wales and Northern Ireland from Q1 19/20 to Q4 22/23 |
| Figure 25 | The number of food businesses issued a food hygiene rating by quarter in Scotland from Q1 19/20 to Q4 22/23 |
| Figure 26 | Percentage of meat establishments rated as good or satisfactory for hygiene in 2022 |
| Figure 27 | Breakdown of compliance ratings for meat establishments as of 31 December 2022 |
| Figure 28 | Percentage of dairy establishments in England, Wales and Northern Ireland which achieved the highest outcomes of either Good or Generally Satisfactory as of 31 December 2022 |
| Figure 29 | Dairy Hygiene compliance levels for inspections as of 31 December 2022 |
| Figure 30 | Dairy establishments enforcement activity in Scotland |
| Figure 31 | Percentage of feed organisations assessed as compliant with hygiene standards, according to latest available data |
| Figure 32 | Number of allocated food safety posts held by local authorities across England, Wales, and Northern Ireland from 2010/11 |
| Figure 33 | Percentage of unfilled food hygiene posts (FTE) in local authorities in England, Wales, and Northern Ireland |
|
Figure 34 |
Number of allocated food hygiene posts held by local authorities across Scotland as of November 2021 |
| Figure 35 | Number of filled local authority food law posts (FTE) in Scotland |
Chapter 4: Safe and sound: food incidents, food crime and surveillance sampling
| Figure | Title |
|---|---|
| Figure 36 | Number of reported food incidents in the UK |
| Figure 37 | Top six food categories involved in reported food incidents from 2019 to 2022 |
| Figure 38 | Number of incidents of contamination by harmful microorganisms in the UK |
| Figure 39 | Number of food incidents involving allergens |
| Figure 40 | Trends in UK laboratory confirmed cases per 100,000 population of the four major GI pathogens |
| Figure 41 | Number of outbreaks attributed to specific pathogens reported in the UK, 2022 |
| Figure 42 | Total number of Allergy Alerts published by FSA and FSS |
| Figure 43 | Allergy alerts by type of allergen |
| Figure 44 | Total number of product recall information notices issued in the UK |
| Figure 45 | Summary of Unsatisfactory Sampling Results by Category |
| Figure 46 | Reasons for non-compliance across all samples |
| Figure 47 | The key areas of focus for food crime investigations in 2022 |
| Figure 48 | The key areas of focus for disruptions carried out by food crime units in 2022 |
Chapter references and explanatory notes for the Annual report on Food Standards 2022.
- Allocated posts are professional posts allocated to deliver a local authority’s food hygiene controls service based on available budget.
- 2020 is the most recently published external paper on Trading Standard Officers resource.
- Dairy market outlook, AHDB
- Britain’s broken egg industry shows the price of food inflation, Reuters
- This excludes beans and pulses due to unavailability of data.
- All figures in this paragraph from ONS Consumer trends: chained volume measure, seasonally adjusted
- Respondents were asked: Do you have concerns about any of the following? The amount of sugar in food, food waste, animal welfare, hormones, steroids or antibiotics in food, the amount of salt in food, the amount of fat in food, food poisoning, food hygiene when eating out, food hygiene when ordering takeaways, the use of pesticides, food fraud or crime, the use of additives (for example, preservatives and colouring), food prices, genetically modified (GM) foods, chemical contamination from the environment, food miles, the number of calories in food, food allergen information, cooking safely at home, none of these, don’t know. Respondents could select multiple responses. The percentages indicate the proportion of respondents who selected each option.
- Differences in percentages between Scotland and the rest of the UK may be due to methodological differences in how data are collected.
- Social Grade has six possible classifications (A, B, C1, C2, D and E). Census data uses a combined, four-way classification. C1: Supervisory, clerical, and junior managerial, administrative and professional occupations. DE: Semi-skilled and unskilled manual occupations; unemployed and lowest grade occupations.
- The FSA has been measuring food insecurity since 2016. In 2016 and 2018, food insecurity was measured in Food and You. Since 2020 it has been measured in Food and You 2.
- Because of differences in the way that the data is collected, we cannot make direct comparisons between the official USDA measure as set out in Food and You 2 and the more informal measures of certain food insecurity behaviours tracked monthly.
- Free sugars refers to all added sugars in any form; all sugars naturally present in fruit and vegetable juices, purées and pastes and similar products in which the structure has been broken down; all sugars in drinks (except for dairy-based drinks); and lactose and galactose added as ingredients.
- Respondents were asked: To what extent do these areas concern you about the future of food in the UK over the next 3 years? Cost of healthy food. Response options: Not at all concerned, A bit concerned, Quite concerned, Extremely concerned. Reported percentage for concerned combines ‘Extremely concerned’ and ‘Quite concerned’ responses.
- Respondents were asked: To what extent do you agree or disagree with this statement? I feel priced out of healthy foods. Response options: Disagree strongly, Disagree slightly, Neither agree nor disagree, Agree slightly, Agree strongly. Reported percentage combines ‘Agree slightly’ and ‘Agree strongly’ responses.
- Respondents were asked: To what extent do you agree or disagree with this statement? It’s difficult to find fresh food (for example, fruit, vegetables, meat) that fits my budget. Response options: Disagree strongly, Disagree slightly, Neither agree nor disagree, Agree slightly, Agree strongly. Reported percentage combines ‘Agree slightly’ and ‘Agree strongly’ responses.
- Defra Food Statistics Pocketbook - Origins of Food Consumed in the UK 2021
- HM Revenue and Customs - UK trade data
- In Wales, the scheme also covers business-to-business operations such as manufacturers that fall under the remit of local authorities.
- Both the FHRS and FHIS provide information about the standard of food hygiene of establishments based on their most recent inspection. FHRS provides a rating between 0 and 5, with 5 being the highest score, indicating ‘very good’ hygiene standards. FHIS provides a rating of ‘pass’ or ‘improvement required’. For this analysis, we have taken an FHRS rating of 3 or above to indicate satisfactory or better rating for English, Welsh and Northern Irish businesses assessed under the FHRS, and a ‘pass rating’ for Scottish businesses assessed under the FHIS. Given differences between FHIS & FHRS, the data between Scotland and the rest of the UK is not comparable.
- Approved meat establishments handle, prepare or produce products of animal origin for which requirements are laid down in retained EU Regulation (EC) No. 853/2004.
- For an explanation of what the ratings categories mean, visit the FSA business guidance on auditing meat establishments
- This was primarily due to the transition in Scotland, with FSS becoming the competent authority for feed and moving to a new electronic system. Any feed inspection outcomes pre 2021 are taken from local authority information.
- Animal feed establishments are rated as either ‘Poor Compliance’, ‘Varying Compliance’, ‘Satisfactory Compliance’, ‘Broad Compliance or better’ and ‘Minimum of Satisfactory Compliance and a member of a FSA approved assurance scheme’. Any establishment rated above ‘Satisfactory’ is considered to be compliant. More information can be found in the Feed Law Code of Practice.
- Allocated posts are professional posts allocated to deliver a local authority’s food hygiene controls service based on available budget.
- Local authorities calculate the proportion of occupied posts using a variety of methods. These are often estimates of resource, which have not been fully validated by the FSA.
- Avian influenza notifications are recorded as microbiological contamination incidents since FSA coordination is required to ensure meat in the supply chain that becomes restricted after slaughter on confirmation of notifiable disease is traced and withdrawn.
Food categories involved in reported incidents from 2019 to 2022.
2019
| Combined incidents - product type | Combined incidents - product type | % of total incidents |
|---|---|---|
| Undefined | 488 | 18.78 |
| Meat and Meat products (other than poultry) | 309 | 11.89 |
| Fruits and Vegetables | 272 | 10.47 |
| N/A | 202 | 7.78 |
| Cereals and Bakery products | 140 | 5.39 |
| Dietic Foods/Food Supplements/Fortified Foods | 139 | 5.35 |
| Prepared Dishes and snacks | 116 | 4.46 |
| Milk and milk products | 115 | 4.43 |
| Confectionary | 105 | 4.04 |
| Nuts/nut products/seeds | 89 | 3.43 |
| Fish and fish products | 83 | 3.19 |
| Poultry meat and poultry meat products | 83 | 3.19 |
| Soups/broths/sauces and condiments | 65 | 2.50 |
| Herbs and spices | 64 | 2.46 |
| Other food product/mixed | 50 | 1.92 |
| Feed | 49 | 1.89 |
| Non-alcoholic beverages | 40 | 1.54 |
| Food Contact Materials | 26 | 1.00 |
| Fats and oils | 23 | 0.89 |
|
Cocoa/Cocoa Preparations/Coffee/Tea |
21 | 0.81 |
| Pet food | 20 | 0.77 |
| Bivalve Molluscs and products thereof | 17 | 0.65 |
| Food additives and flavourings | 15 | 0.58 |
| Alcoholic beverages | 14 | 0.54 |
| Ices and desserts | 11 | 0.42 |
| Egg and egg products | 10 | 0.38 |
| Crustaceans and products thereof | 9 | 0.35 |
| Honey and Royal Jelly | 8 | 0.31 |
| Water | 6 | 0.23 |
| Wine | 3 | 0.12 |
| Animal-by products | 2 | 0.08 |
| Compound feeds | 2 | 0.08 |
| Cephalopods and products thereof | 1 | 0.04 |
| Gastropods | 1 | 0.04 |
| Novel Food | 0 | 0.00 |
| Total | 2598 | 100.00 |
2020
| Combined incidents - product type | Combined incidents - product type | % of total incidents |
|---|---|---|
| Egg and Egg products | 12 | 0.53 |
| Crustaceans and Products thereof | 11 | 0.49 |
| Ices and desserts | 10 | 0.44 |
| Animal-by-products | 5 | 0.22 |
| Honey and Royal Jelly | 3 | 0.13 |
| Compound feeds | 2 | 0.09 |
| Novel Food | 2 | 0.09 |
| Water | 1 | 0.04 |
| Cephalopods and products thereof | 0 | 0.00 |
| Gastropods | 0 | 0.00 |
| Wine | 0 | 0.00 |
| Total | 2261 | 100.00 |
2021
| Combined incidents - product type | Combined incidents - product type | % of total incidents |
|---|---|---|
| Meat and Meat products (other than poultry) | 254 | 10.75 |
| Poultry Meat and Poultry Meat Products | 238 | 10.07 |
| Dietic Foods/Food Supplements/Fortified foods | 207 | 8.76 |
| N/A | 187 | 7.91 |
| Cereals and bakery products | 139 | 5.88 |
| Fruits and vegetables | 118 | 4.99 |
| Prepared dishes and snacks | 112 | 4.74 |
| Confectionary | 100 | 4.23 |
| Fish and fish products | 99 | 4.19 |
| Milk and milk products | 95 | 4.02 |
| Other food product/mixed | 88 | 3.72 |
| Herbs and spices | 82 | 3.47 |
| Feed | 80 | 3.39 |
| Undefined | 69 | 2.92 |
| Nuts/but products/seeds | 57 | 2.41 |
| Food Contact Materials | 52 | 2.20 |
| Bivalve Molluscs and products thereof | 48 | 2.03 |
| Soups/broths/sauces and condiments | 43 | 1.82 |
|
Pet food |
41 | 1.74 |
| Non-alcoholic beverages | 34 | 1.44 |
| Ices and desserts | 30 | 1.27 |
| Food additives and flavourings | 29 | 1.23 |
| Animal by-products | 28 | 1.18 |
| Crustaceans and products thereof | 23 | 0.97 |
| Egg and egg products | 20 | 0.85 |
| Honey and Royal Jelly | 18 | 0.76 |
| Alcoholic Beverages | 14 | 0.59 |
| Water | 12 | 0.51 |
| Fats and oils | 10 | 0.42 |
| Cephalopods and products thereof | 4 | 0.17 |
| Compound feeds | 3 | 0.13 |
| Gastropods | 2 | 0.08 |
| Novel Food | 2 | 0.08 |
| Wine | 2 | 0.08 |
| Total | 2363 | 100.00 |
2022
| Combined incidents - product type | Combined incidents - product type | % of total incidents |
|---|---|---|
| Meat and Meat products (other than poultry) | 284 | 12.79 |
| N/A | 626 | 11.80 |
| Dietic foods/food supplements/fortified foods | 192 | 8.64 |
| Cereals and Bakery products | 189 | 8.51 |
| Poultry meat and poultry meat products | 151 | 6.80 |
| Prepared Dishes and snacks | 123 | 5.54 |
| Confectionary | 104 | 4.68 |
| Fruits and vegetables | 90 | 4.05 |
| Other Food product/mixed | 80 | 3.60 |
| Milk and milk products | 74 | 3.33 |
| Herbs and spices | 65 | 2.93 |
| Fish and fish products | 63 | 2.84 |
| Feed | 62 | 2.79 |
| Nuts/nut products/seeds | 61 | 2.75 |
| Bivalve Molluscs and products thereof | 59 | 2.66 |
| Non-alcoholic beverages | 56 | 2.52 |
|
Food additives and flavourings |
36 | 1.62 |
| Cocoa/Cocoa preparation/Coffee/Tea | 30 | 1.35 |
| Soups/Broths/Sauces and condiments | 29 | 1.31 |
| Crustaceans and products thereof | 25 | 1.13 |
| Ices and desserts | 20 | 0.09 |
| Alcoholic beverages | 19 | 0.86 |
| Egg and egg products | 17 | 0.77 |
| Pet Food | 15 | 0.68 |
| Honey and Royal Jelly | 10 | 0.45 |
| Fats and oils | 9 | 0.41 |
| Undefined | 9 | 0.41 |
| Cephalopods and products thereof | 8 | 0.36 |
| Water | 7 | 0.32 |
| Animal-by products | 6 | 0.27 |
| Compound feeds | 5 | 0.23 |
| Gastropods | 0 | 0.00 |
| Novel Food | 0 | 0.00 |
| Wine | 1 | 0.05 |
| Total | 2221 | 100.00 |
Acknowledgements for the annual report on food standards 2022.
Firstly, we would like to thank the many contributors across the FSA and FSS who have made this report possible This is a genuine UK-wide effort, with extensive input from policy experts across the four home nations.
The report also benefited hugely from the expert input provided by the fourteen external reviewers who examined early drafts and provided support and constructive challenge throughout their development. Their combined wisdom and generous advice have made this report stronger, so we are particularly grateful to:
Full report: annual report (Our Food)
- Professor Guy Poppy, CB FMedSci, University of Southampton, Executive Chair of BBSRC
Chapter 1: The nation’s plate
- Professor Julie Barnett, University of Bath
- Professor Emma Roe, Professor of More-Than-Human Geographies, University of Southampton
- Professor Lynn Frewer, Professor of Food & Society, Newcastle University
Chapter 2: Going global
- Professor Dennis Novy, Professor of Economics, University of Warwick
- Professor L Alan Winters CB, Professor of Economics, University of Sussex
Chapter 3: Keeping it clean
- Dr Belinda Stuart-Moonlight, Moonlight Environmental Ltd
- Dr Nicholas Watson, Professor of Artificial Intelligence in Food, University of Leeds
Chapter 4: Safe and sound
- Ms Patricia Dodd
- Mr Alec Kyriakides, Independent Food Safety Consultant
- Mr John Barnes, Enmoore Ltd
- Professor John Threlfall, Independent Consultant
- Professor Louise Manning, Professor of Sustainable Agri Food Systems University of Lincoln
- Professor Tony Hines MBE, Independent Consultant