Estimating financial cost to individuals with a food hypersensitivity
Methodological approach
This study uses a price differential approach, comparing the household food consumption costs for an FHS group versus a non-FHS group, to understand the additional financial burden faced by people suffering with FHS.
2.1 Overview of methodology
This study uses a price differential approach, comparing the household food consumption costs for an FHS group versus a non-FHS group, to understand the additional financial burden faced by people with FHS. Additionally, other direct/ indirect costs incurred due to FHS were collected for the FHS households. The identification of such costs provided the study with a wider perspective that extends beyond the healthcare sector. Intangible costs, such as quality of life impacts, were out of scope for this study. The three main data collection activities are summarised below in Figure 2.1 (surveys are anonymised):
Figure 2.1 Project stages and methods for the examination of Direct and Indirect Costs associated with FHS

2.2 Scoping and design activity to understand existing research, methodologies and inform survey questions
2.2.1 Rapid evidence assessment
RSM conducted a rapid evidence assessment (REA) on the financial burden of restricted diets for individuals with FHS (see Appendix 1). The aim was to identify existing research on the cost of living with FHS, to understand methodologies used and their findings to inform the research design. Evidence was reviewed from four sources:
- research and literature recommended to us by the FSA team and our expert advisors
- searches of relevant academic literature databases
- grey literature
- national statistics on food consumption patterns
A search protocol was developed to guide the academic literature database searches (available in Appendix 2). Studies were screened for relevance and findings against the four research questions were extracted:
- what are the costs incurred by people living with FHS?
- what are the burdens of living with an FHS more generally?
- what research has been done in related areas on price differentials/representative ‘baskets of goods’ between groups?
- what statistics are available on food consumption patterns and costs among groups?
Intelligence gathered from the 107 studies was used to inform the design of the household survey questionnaire. Details on papers screened and included at each stage of the REA is summarised in the Prisma method diagram below.
Figure 2.2 PRISMA diagram

Note: Records were excluded because they did not meet the inclusion/exclusion criteria specified in Appendix 2. This could be due to studies not being in the scope of the research question, not within specified language and time of publication, or conducted in a non-OECD country.
2.2.2 Qualitative research: interview with people living with FHS (n=22)
Online interviews were completed with a sample of people living with FHS to inform the content of the household survey questions in August and September 2020. Semi-structured topic guides were developed after the REA was completed, to aid discussion with people living with FHS. All interviews lasted between 45 minutes to an hour. Topic guides were further refined following the pilot interviews (see Appendix 3). The three FHS charities (Allergy UK, the Anaphylaxis Campaign and Coeliac UK), recruited those living with FHS to take part in these interviews with RSM researchers.
Interviews were carried out with 20 respondents (all adults):
- 13 people living with FHS (CD=5 and FA=8)
- 1 person living with FHS who is also the parent of a child with FHS (FA=2)
- 5 parents responded on behalf of their child with FHS (FA=5)
- 1 parent who responded on behalf of their two children with FHS (FA=2)
In total, there were therefore 22 observations on people living with FHS including 14 adults and 8 children. Table 2.1 outlines the main demographics for this group, including gender, ethnicity, and age. The interviews focused on food consumption habits; identifying areas of financial burden; and capturing common adjustments made to lifestyle to manage FHS.
Table 2.1 Socio-economic characteristics of people living with FHS from the interviews used to inform household survey questions to calculate direct and indirect costs associated with FHS (n=22)
| Gender | Percentage of socio-economic characteristics |
|---|---|
| Male | 13 (59%) |
| Female | 9 (41%) |
| Race | Percentage of socio-economic characteristics |
|---|---|
| White British | 14 (64%) |
| Black British | 1 (4.5%) |
| White European | 1 (4.5%) |
| Indian | 1 (4.5%) |
| Mixed | 1 (4.5%) |
| Prefer not to say | 4 (18%) |
| Age group | Percentage of socio-economic characteristics |
|---|---|
| 0 to 4 | 2 (9%) |
| 5 to 9 | 3 (14%) |
| 10 to 14 | 3 (14%) |
| 15 to 19 | 1 (5%) |
| 20 to 29 | 4 (18%) |
| 30 to 39 | 1 (5%) |
| 40 to 49 | 2 (9%) |
| 50 to 59 | 1 (5%) |
| 60 to 69 | 5 (23%) |
2.3 FHS Household survey
Using intelligence from the REA and the qualitative interviews (n=22 people living with FHS) mentioned in Section 2.2.2, an anonymous online survey questionnaire was developed for households with people living with FHS. The survey questions were designed to capture details of each respondent’s condition (problem foods, length, and type of diagnosis, severity of reaction) and standard demographic / household composition data. A series of questions were asked about the financial burden of managing FHS and routing was used to ensure respondents were only asked relevant questions.
The survey collected both direct costs (spend on food shopping, takeaways and eating out, medical and kitchen equipment) and indirect costs (paid and unpaid days lost due to illness and appointments).
The survey was disseminated in November 2020 via the partner charities using membership email lists, social media channels, and websites; and ran until January 2021. The FSA and RSM also used social media to promote the survey. As the survey was open to all UK residents, responses were received from Scottish households (which is outside the FSA’s jurisdiction). It is not known how many people were invited to complete the survey and respondents were not compensated for taking part.
2.3.1 Breakdown of FHS household survey respondents (n=1,225)
A total of 1,559 complete responses from the FHS household survey were received but only 1,225 responses were used for analysis. This is because responses where the primary person living with FHS is below 18 years old and / or is from Scotland were removed for easier comparison with the non-FHS household survey which did not include responses from these categories as these categories were excluded (footnote 1). The FHS household survey had responses from Scottish households as it was open to Scottish households (because the FHS charities operate across the UK). However, only a total of 1,225 complete responses were used for analysis, with each response representing a unique household of an adult (>18 years) who reported to have FHS.
Of the 1,225 responses, 25% (n = 305) reported that their households had more than one person with FHS (other than the primary respondent). Furthermore, 14% (n = 176) stated that the primary person with FHS in their household had more than one FHS condition.
Coeliac disease made up the highest proportion of total responses (53%, n = 651) (footnote 2). Given that the coeliac population in the UK is the smallest of the three cohorts (estimated at 300,000 compared to 800,000 thousand with food allergy and approximately 1.2 million with food intolerance and other FHS conditions (footnote 3)), it is possible that the high response rate from the coeliac population is due to greater promotion of the survey by Coeliac UK or higher motivation to engage among this cohort.
As mentioned, the FHS household survey ran between November 2020 and January 2021. Although the survey asked for typical food consumption costs pre-Covid-19, concerns were raised by the study team and the FSA around the potential impact of the Christmas period on food consumption responses. To address these concerns, food costs were compared for responses submitted in the pre-festive period (19/11/2020 to 18/12/2020) against responses in the festive period (19/12/2020 to 03/01/2021). Reassuringly, no statistically significant differences in food consumption costs between the two periods were found (footnote 4). Figure 2.6 below summarises the breakdown of FHS respondents.
Figure 2.6 Summary dashboard for the FHS household group survey (n=1,225) conducted between November 2020 to January 2021

2.4 Non-FHS group household survey
BMG Research was commissioned to survey non-FHS households, on their food costs (food spend, takeaway and eating out). Respondents were recruited from panels using demographic criteria to represent the national population and each respondent was compensated to take part. The survey questionnaire was much shorter than the FHS survey and only collected demographic information and food consumption costs.
2.4.1 Breakdown of non-FHS group household survey respondents (n=1,530)
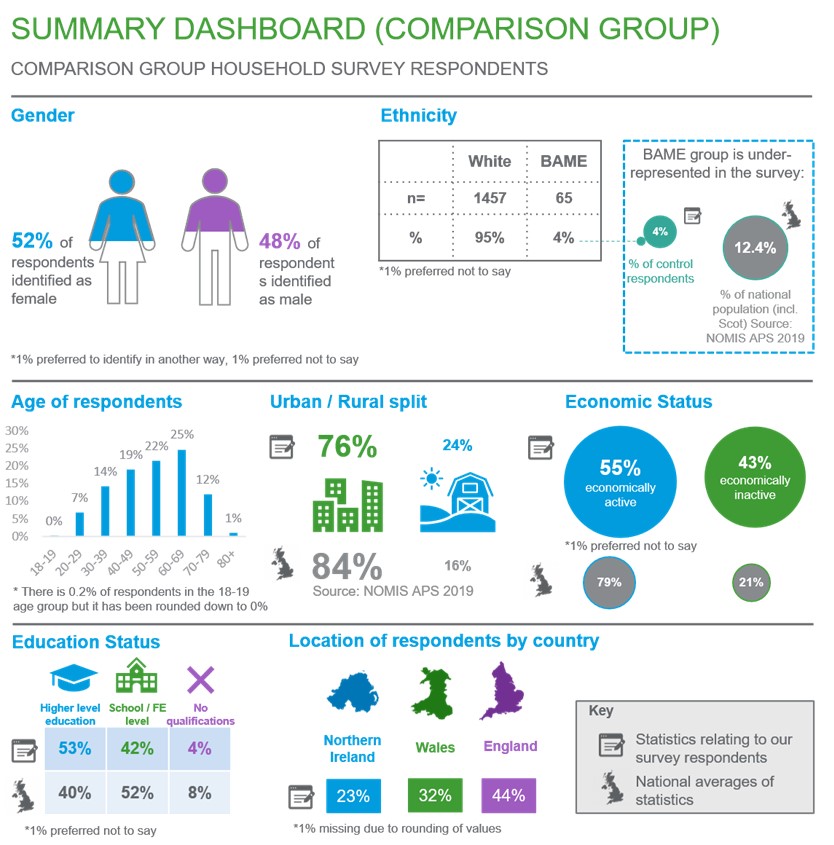
The survey ran between November and January 2021. In total, 1,530 completed responses were received. Due to the sampling and panel recruitment approach, respondents were more representative of the national population than the FHS household survey. Figure 2.7 below summarises the breakdown of non-FHS respondents.
Figure 2.7 Summary dashboard for the non-FHS (adult) group survey n=1,530) conducted between November 2020 and January 2021
2.5 Model and analytical approach for analysis of FHS and non-FHS household survey
For further information on the full statistical approach used including models developed and tests used, please see Appendix 6.
2.5.1 Data cleaning
Our data cleaning processes ensured consistent levels of data quality across FHS and non-FHS households and removed implausibly high outliers, using the boxplot method. A boxplot diagram has quartiles and inter quartiles which define the upper and lower limit and any data points beyond these limits can be considered as outliers. Outliers were only present in the FHS household survey and the breakdown of specific outliers for each cost as well further details about their removal can be found in Appendix 6. Additionally, analysis was conducted for food consumption costs with and without outliers and the results were similar overall except for the comparison of FA with non-FHS when we comparison of CD with non-FHS when weekly groceries costs were used (footnote 5). However, the outliers are likely to be measurement errors that will overinflate the estimates, they have been removed from the main analysis. The results with outliers can be found in Appendix 7.
2.5.2 Food consumption cost comparators
Data from both FHS and non-FHS household surveys were used for cost comparator analysis of household food consumption. To do this, a model was developed controlling for household composition and size, income level, education status, and other variables, to assess price differentials for the following food consumption costs:
- weekly groceries costs: Weekly costs on any food and non-alcoholic beverages bought from a store/supermarket (excluded eating out/takeaway costs). This is the primary outcome measure
- monthly eating out / takeaway costs: Monthly costs on food and beverages bought from restaurants, cafes, etc. This cost was converted into weekly costs for the primary analysis for consistency.
There were several missing data points for a few control variables and for one of the outcome variables, monthly eating out / takeaway costs (footnote 6). The missing data was dealt with using a combination of Multiple Imputation (MI) and the missing indicator method, which is an approach used for data that is not missing at random. The specific proportion of missing data and description of methods are detailed in Appendix 6.
Propensity score matching (PSM) was used to reduce any underlying differences between households/survey respondents that could potentially introduce bias when comparing food consumption costs in FHS and non-FHS households. PSM was performed for each type of FHS (FA, CD, and FIO) with the non-FHS group and for each type of food consumption cost. The balance statistics can be found in Appendix 10. PSM was applied using the “nearest neighbour” method which matches the closest eligible non-FHS unit to the FHS unit. Matched pairs of similar participants were selected (one from the relevant FHS group and one from the non-FHS group). The logit of the propensity score was used as the matching scale with a caliper width equal to 0.2 of the standard deviation of the logit of the propensity score, in line with the recommendations of Austin (2011) (footnote 7). Variables used in deriving the propensity score are similar to the demographic and household characteristics used in the multivariate regression which are:
- household size
- household income
- region
- gender
- education
- age
- ethnicity
- geography
- place of shopping (for example, large supermarket / online / specialist shops) – only for weekly grocery costs
- frequency of eating out – only for monthly eating out / takeaway costs
The propensity score matching resulted in smaller sample sizes for each FHS types as a consequence of selecting only participants who matched the non-FHS group and who contributed to achieving an overall covariate balance across groups. The final sample size of each dataset can be found in Chapter 5.3. To ensure that the most optimal matching parameters were selected for the PSM, a brief assessment of different matching methods was performed and is detailed in Appendix 7.
Multivariate regression analyses were performed for all three costs. The regression model used is a Gamma model with a “log” link. More detailed explanations on why this model was chosen can be found in Appendix 6. For each regression analysis, a separate analysis was performed using three datasets:
- dataset A: consisting of information from those in the FIO category and the non-FHS group
- dataset B: consisting of information from those with CD and the non-FHS group
- dataset C: consisting of information from those with FA and the non-FHS group
This generated estimates for the extra costs paid by each of the FHS groups compared to the non-FHS group, with results presented in Chapter 5.3.
2.5.3 Other direct costs for people living with FHS/FHS households
Direct costs were assessed for the three FHS cohorts and presented as average costs for each group. Questions on these costs were not asked of the non-FHS cohort because it was not relevant to them. All analyses focused on cost estimates for the following items:
Kitchen equipment: FHS households were asked to name items of additional kitchen equipment purchased to avoid cross-contamination of food prepared for FHS households. The items were coded into categories by analysts (for example, separate toaster, separate chopping board). These items were monetised using an average UK high street shopping price in 2021, with the assumption that these items were purchased in the last two years before the survey took place and that prices did not significantly fluctuate within these years. For items , such as having a separate preparation area or separate storage, these were assumed to be of zero cost as it is likely that households had existing storage space or preparation areas.
Medical costs: People living with FHS were asked to provide three costs for medications/ medical equipment. These costs were consolidated to give total monthly medical costs. The three costs are:
- nutritional supplement and/or over the counter medication costs
- prescription medication costs (for example, adrenaline auto-injectors, antihistamines, and corticosteroids)
- specialist medical costs (for example, medical bags and, inhalers)
The averages of the costs above are presented in Chapter 6.
Additionally, multivariate regression analysis was conducted to assess the difference in outcomes between the three FHS cohorts but as these are beyond the scope of the research question, these are not presented in the main paper. The full methodology used for the regression analysis can be found in Appendix 6 and the results in Appendix 7.
2.5.4 Indirect costs for people living with FHS
The third stage involved monetisation of the indirect costs by each FHS group, which included:
Days lost from paid work due to FHS: People living with FHS were asked how many days of absence from paid work they had taken in the past year due to FHS.
Days lost from unpaid work due to FHS: People living with FHS were asked how many unpaid days they had lost in the past year due to FHS. Unpaid work includes days spent on education, training, voluntary work, lost leisure time, caring for others, and housework time.
Extra time spent on food shopping/ planning/ FHS education due to FHS: People living with FHS were asked how many hours per week they spent on:
- time on food shopping per week
- time on planning food shop and reading food labels per week
- time to travel further for food shopping per week
- extra time on planning and preparing for eating out/takeaways per month
- extra time on planning and preparing for visiting/hosting friends and family per month
- time spent on research, training or education related to FHS per month
- time spent educating/informing other people about FHS per month
This information was consolidated to provide the total extra time spent per week on activities related to FHS. Questions on the time spent were not asked of the non-FHS cohort because it is not relevant to them as these are days lost / time spent due to FHS.
The time estimates were valued using secondary wage data. Days lost from paid work due to FHS were monetised by multiplying with the UK’s 2019-2020 annual median income of £29,900 (ONS, 2021) (footnote 8). Unpaid work and time spent on food shopping etc was monetised using the 2021 National Living Wage of £8.72 (GOV.UK, 2020) and the range of National Minimum Wages to provide a range of monetised costs. Different sources were used to monetise paid and unpaid work because they are not considered equivalent to each other. Additionally, there have been papers citing the use of hourly minimum wage to measure unpaid work (Care work and care jobs for the future of decent work, ILO 2018). Although there is an ONS designed Unpaid Work calculator which calculates the value of each type of unpaid work (for example, childcare, housework, transport, etc), it was inapplicable to this study as the survey aggregately asked respondents how many unpaid days they had lost due to FHS, rather than the individual categories of unpaid work in order to reduce the response burden on participants. The averages of the costs above are presented in Chapter 7.
Additionally, multivariate regression analysis was conducted to assess the difference in outcomes between the three FHS cohorts but as these are beyond the scope of the research question, these are not presented in the main paper. The full methodology used for the regression analysis can be found in Appendix 6 and the results in Appendix 7.
2.5.5 Sensitivity analysis
Heterogeneity of FHS effects
Due to the very high response rate from females compared to males in the FHS household survey (79%) sensitivity analysis was conducted to address potential response bias and effect modification. In addition to adjusting for any confounding effect of gender, a model with interaction effects was constructed to assess whether the cost differentials between FHS types and non-FHS varied between females and males.
To explain, FHS_Presence is the exposure variable consisting of either one of the three FHS groups (FIO, CD, or FA) and the non-FHS group. An interaction term of gender*FHS_Presence, was created for all food consumption cost models.
Multivariate regression using a fully adjusted model was then performed for food consumption costs in all datasets with the addition of the interaction term. If the coefficients of the interaction terms are statistically significant at the 95% confidence level, this indicates that there is a difference in the effect of FHS presence on costs between genders. The sensitivity analysis found no differences in FHS presence on food consumption costs between genders.
Modelling of missing data
The final model presented in the main analysis was originally run with five imputations. In general, two to 10 imputations are usually sufficient for the efficiency of point estimates however, a higher number of imputations may be needed for standard errors that would not significantly change if data was imputed again (von Hippel, 2018). Thus, the analysis for the food costs was run separately with imputations of 10, 20, 40, and 100 times to check the sensitivity of the results to different numbers of imputations (a pragmatic form of iterative multiple imputations). The results (described in Chapter 5.4.2 and presented in Appendix 7) remained stable even as the number of imputations increased from five to 100.
-
Under 18s were excluded from the non-FHS household survey as the only cost figures that were asked about were for household spending on food costs, thus it makes sense that respondents are adults and not children.
-
In addition, we received a total of 611 partial survey responses across all FHS groups which were not analysed due to missing cost data
-
Prevalence figures obtained from Food and You 2 Wave 3 data provided by the FSA.
-
A student’s t-test was performed to test for significant difference in costs between the two periods.
-
There were only 4 outcome / FHS type combinations with outliers removed
-
The specific number of missing observations are detailed in Appendix 6.
-
Austin P. C. (2011). An Introduction to Propensity Score Methods for Reducing the Effects of Confounding in Observational Studies. Multivariate behavioural research, 46(3), 399–424. https://doi.org/10.1080/00273171.2011.568786
-
Average household income, UK - Office for National Statistics (ons.gov.uk)
Revision log
Published: 28 July 2022
Last updated: 12 September 2023