Research project
What is the cost of a healthy food basket in Northern Ireland in 2022?
Northern Ireland specific
This report presents the cost of the minimum essential food basket for four household types.
Northern Ireland
Foreword
This research updates the cost of a Minimum Essential Food Basket, for four household types, in Northern Ireland to 2022.
Two previous research projects, in 2014 and 2016, worked with members of the public in multiple ‘deliberative focus groups’ across Northern Ireland, to agree what should be included in a minimum essential, but nutritionally adequate and socially acceptable, food basket.
This research uses Consensual Budget Standards methodology to establish the cost of the food element of a Minimum Essential Standard of Living (MESL) for four household types.
Separate groups of members of the public met for each household type, in three locations across Northern Ireland, and through iterative in-depth discussions, reached a consensus on what the food baskets should include.
This report presents the cost of the minimum essential food basket for the four household types, adjusted to reflect food costs in 2022, building on the data published thus far for 2014, 2016, 2018 and 2020. This demonstrates the average weekly cost of healthy food, and the level of household income that may need to be spent on attaining this minimum standard.
Executive Summary
Aim
This research calculates the cost of a Minimum Essential Food Basket for 4 household types with low-income scenarios in Northern Ireland in 2022. The research also presents the percentage of take-home income that needs to be spent by these households to achieve a minimum essential, nutritionally adequate and socially acceptable food basket.
Method
This research uses Consensual Budget Standards methodology to establish the average weekly cost of the food element of a Minimum Essential Standard of Living (MESL) for 4 household types in Northern Ireland adjusted to reflect food costs in March 2022. Previous research was undertaken in 2014(1) and 2016(2) with members of the public in multiple focus groups across Northern Ireland to agree what should be included in a minimum essential, nutritionally adequate and socially acceptable food basket. This research used the consensual budget standards method, where members of the public met to discuss the costs of food for a minimum essential standard of living (MESL) for four household types. People representing each of these household types met in separate groups in three locations across Northern Ireland and, through a series of in-depth discussions, came to an agreement on what the food baskets should include. The households included were:
- two-parents, 2 children (pre-school and primary school age)
- two-parents, 2 children (primary and secondary school age)
- one-parent, 2 children (pre-school and primary school age
- pensioner female living alone.
A low-income scenario was used to establish the percentage of take-home pay spent on a healthy food basket for the four household types, for example, a working-age household where one adult was employed, the income source applied was social welfare payments and/or the National Living Wage (NLW), the state pension was used for a pensioner.
The ‘UK Consumer Price Index data’ was used to update the price for 2022 from the 2020 price. The online calculator, Entitled calculator, was used to help generate the income scenarios. Income calculations are based on the current 2022/23 rates for the National Living Wage, personal taxation and State Benefits as detailed on www.gov.uk.
Key findings
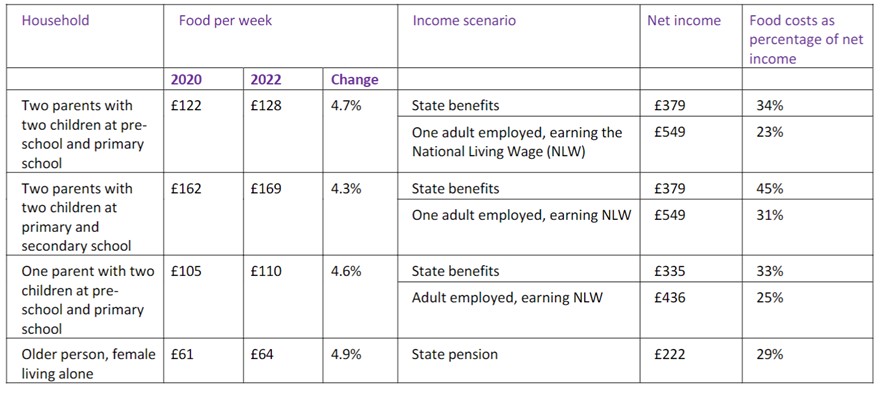
Table 1 presents the data on costs (as an absolute value in pounds sterling (£) and as a proportion of take-home income) of the acceptable and healthy food basket for four low-income households.
- the cost of a minimum essential food basket for the four household types ranged from £64 to £169.
- minimum food costs are highest for a household with an older child of second level (post-primary school) age. They are about one-third more than for a household with younger children.
- for households with children, an average of two-thirds of the minimum food costs come from meat, fruit, vegetables, dairy products, bread and cereals. Each of these food categories increased in price from 2020 to 2022 by between 3.1% and 7.0%.
- the cost of the minimum essential food basket increased by between 4.3% and 4.9% in the two-year period 2020-2022.
- the minimum food costs increased most – by 4.9% – for an older person living alone. The higher cost of the social inclusion aspects of the food basket (such as having meals out with friends), which are crucial for this household type, accounted for a quarter of the overall price increase.
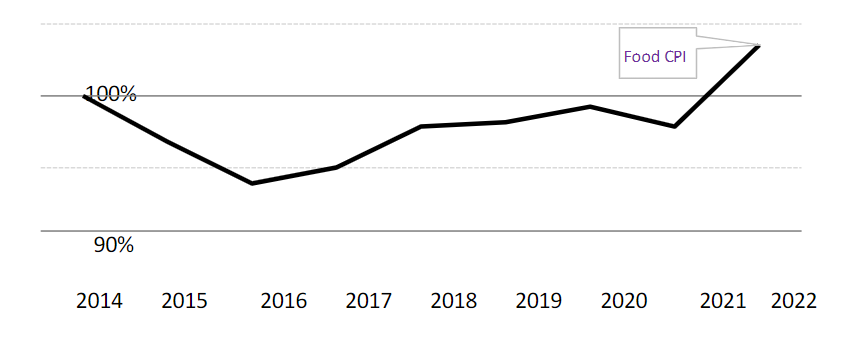
- between 2020 and 2022, the cost of food increased by an average of 4.6%. For the first time in this research series, average food prices are now higher than in 2014.
- increases in net household income from 2020 to 2022 were greater than the increase in minimum food costs. As a result, the proportion of income spent on food decreased slightly (or remained stable) in this period.
- temporary cost of living supports significantly increased household income between 2020 and 2022. Without these supports, food costs would have risen by more than the increase in net household income for working-age families reliant on state benefits.
Table 1: Minimum essential food basket 2022: summary of results
Introduction
Food poverty is defined as ‘the inability to have an adequate and nutritious diet due to issues of affordability and access to food, with related impacts on health, culture and social participation being felt’. Food poverty therefore not only affects what people eat, it also impacts on people’s lifestyles, social interactions and health. It is a core experience of poverty. Data published by the Northern Ireland Statistics and Research Agency show that 17%of the population were in relative poverty in 2020/21 and 12% in absolute poverty (before housing costs). The most recent data for Northern Ireland show that approximately 1 in 6 respondents were food insecure (for example, had low or very low food security) and that 4% of households are showing signs of food poverty.
The Minimum Essential Standard of Living (MESL) research applies the ‘Consensual Budget Standards methodology’. This method involves working with members of the public to reach agreement on the minimum needed to live and partake in the social and economic norms of everyday life. Through engaging with multiple deliberative focus groups, iterative in-depth discussions with members of the public produce a negotiated consensus on what people regard as essential for a socially acceptable minimum standard of living. The research identifies what is needed to meet physical, psychological and social needs at a minimum but acceptable level. It is not a poverty standard and represents a minimum level which people have agreed nobody should be expected to live below. This report presents the cost of the minimum essential food basket for the four household types, adjusted to reflect food costs in 2022.
Objectives
1) To determine the cost of a Minimum Essential Standard of Living (MESL) Healthy Food Basket for 2020 in Northern Ireland for 4 household types:
- two parents and two children (pre-school and primary school age)
- two parents and two children (primary and secondary school age)
- one parent and two children (pre-school and primary school age)
- pensioner, female living alone
2) To present the cost of the minimum essential food basket as a percentage of household take-home income for low-income scenarios:
- household in receipt of social welfare payments
- one adult employed and earning the National Living Wage (NLW)
- in receipt of a state pension in the case of the pensioner
3) To provide a breakdown of the cost of the food basket by sub-category.
Methods
Consensual budget standards methodology
Research on the minimum essential standard of living (MESL) uses the consensual budget standards methodology. This involves group discussions with members of the public to agree on the minimum needed to live within the social and economic norms of everyday life. Through a series of focus groups, in-depth discussions produce agreement on what people regard as essential for a socially acceptable minimum standard of living. Accordingly, the research identifies what is needed to meet physical, psychological and social needs at a minimum but acceptable level. It is not a poverty standard, but sets a minimum level which nobody should be expected to live below.
Food poverty is defined as the inability to get or afford enough food of adequate quality and quantity. Food poverty has wider impacts for wellbeing, culture and society, as it affects not only what people eat but also their lifestyles, social activities and health.
Cost of a minimum essential food basket
This report presents the cost of the minimum essential food basket for the four household types, reflecting food costs in 2022. The baskets were first established for 2014 and 2016, and are adjusted to 2022 prices using the appropriate CPI (four-digit level) classification, as published by the Office for National Statistics (footnote 1).
The previous research projects that applied this methodology to establish the cost of the food element of a minimum essential standard of living (MESL) for four household types in Northern Ireland are:
Mac Mahon, B. and Weld, G. (2015). The cost of a minimum essential food basket In Northern Ireland: Pilot study for two household types. Dublin: safefood.
Cost of the minimum essential food basket as a proportion of household take-home income
The cost of the food basket is broken down by sub-category for each household, which allows an examination of the composition of the basket. For this purpose, the price of each item in the basket is adjusted at the granular level, using the most detailed Consumer Price Index classification available from 2014 to 2022 i.e., the COICOP (Classification of Individual Consumption by Purpose) four-digit level classification. The school lunch and milk price were directly priced.
Income calculation notes
The income rates used in our scenarios are hypothetical and based on the average net take-home income for the household types under discussion.
The scenarios illustrate the food basket in relation to typical household income and are not real-life case studies. They were drawn up using the online calculator, Entitled online calculator.
Income calculations are based on the current 2022/23 rates for the National Living Wage, personal taxation and state benefits. The income details for each scenario are listed below. For details of the calculations see Appendix 1.
State benefit scenarios
We assume the household has full entitlement to payments in each case. We also make the following assumptions:
Table 1: Income scenarios
| Household types | Details |
|---|---|
| Households with children |
|
| Pensioner, living alone |
Rates Relief has been included as a component of household income at each stage of this research, and for consistency is included here . However, Rates Relief is not direct income, as it is not paid directly to the household but instead applied at source to reduce the rates bill. |
Employed scenarios
Wage rates are taken to be the National Living Wage as of April 2022 of £9.50 per hour (footnote 3). (This is the statutory minimum wage payable to adults aged 23 and over, not the voluntary ‘real living wage’ paid by certain employers.) In our scenarios:
- in two-parent households, one adult is in full-time (37.5 hours) employment
- in one-parent households, the adult is in part- time (16 hours) employment.
- the household is living in social housing
Income is net household income, after income tax and National Insurance have been taken off, and includes Universal Credit, Child Benefit and the 2022 Low Income Cost of Living Payment.
Results
Cost of a minimum essential food basket
Table 1 shows the cost of the minimum essential food basket for four household types in Northern Ireland in 2022.
- between 2020 and 2022, the cost of food in the minimum basket increased by an average of 4.3%. For the first time in this research series, average food prices are now higher than in 2014. Average food prices remained below 2014 levels until 2021, but by March 2022 food prices were on average 3.5% higher than in 2014. The average rate of change is based on the Consumer Prices Index (CPI) sub-rate for food, which reflects the change in the cost of the average food basket purchased across the UK.
- the cost of the minimum food basket has changed at a different rate than the average CPI food basket, increasing by 4.3-4.9% across the four household types examined
- the minimum food basket for Northern Ireland represents a more limited basket than the average UK basket, and consequently changes in cost affect it differently
- there is only a small difference in food costs between a one-parent and a two- parent household where each household has one pre-school and one primary-school-age child. This shows that food shopping for a two-adult household allows economy of scale
- minimum food costs for a two-parent household with a primary and second-level-age child are the most expensive of the four household types. The cost is one-third higher for this household than for a two-parent household with a pre-school and primary-school child
- the female pensioner living alone is the smallest type of household examined and has the lowest minimum food cost. However, her food basket shows the greatest rate of price increase in the two-year period: 4.9%.
Cost of the minimum essential food basket as a proportion of household take-home income
Net household income from state benefits, the National Living Wage (NLW) employment and state pension increased from 2020 to 2022. Income increased by more than the change in minimum food costs. As a result, the proportion of household income spent on food has remained stable or decreased slightly in the period examined.
Temporary cost of living supports have contributed significantly to the increase in household income. Without these supports, the increase in minimum food costs would have been greater than the increase in net household income for working-age families reliant on state benefits.
Table 1 summarises 2022 household income in scenarios where working-age households either have NLW employment or depend on state benefits (Universal Credit), and scenarios where an older person living alone receives the state pension. (For details of the income calculations see Income Calculation Notes).
The cost of the minimum food basket continues to use a significant proportion of household income. However, the same minimum food cost represents a smaller proportion of household income for people in employment (due to their higher income), compared to those who depend on state benefits only.
State benefits, households with children
- for 2022, the working-age state benefit household income is calculated on the basis of Universal Credit. Previous studies in this research series were based on Jobseeker’s Allowance (JSA)
- for working-age households dependent on state benefits, meeting the cost of the minimum food basket would require 33% to 45% of household income. The 2022 Low Income Cost of Living Payments are included in net household income. These totalled £650 in 2022 (adding an average of £12.50 to net weekly income)
- the 2022 Child Benefit and Universal Credit rates are higher than in 2020. This, combined with the Low Income Cost of Living Payments, means net household income for the three families with children has increased by an average of 6.9% compared to 2020
- the minimum food costs for households with children increased by an average of 4.5% from 2020 to 2022. Food costs in March 2022 accounted for a marginally smaller proportion (0.9 percentage points) of state benefit income
- The temporary Cost of Living Payment has contributed over half of the increase in net household income. Without this measure, the increase in food costs would have been greater than the increase in state benefits
- a two-parent household with an older child spends the highest proportion of household income on food. Meeting the cost of a minimum essential food basket would require almost half (44.6%) of this household type’s income from state benefits.
State pension, older person living alone
- an older person living alone would need to spend almost 28.8% of household income to meet the cost of the minimum essential food basket.
- this means they needed to spend 3.1% less of their income on food in 2022 (in 2020, food costs amounted to 31.9% of income).
- Minimum food costs for this household type increased by 4.9% to March 2022.
- income for this household type is 16% higher in 2022 than in 2020.
- the state pension has risen by £8.85 per week since 2020.
- cost of living income supports also contribute to the 2022 household income. These include both the Low Income Cost of Living Payments (£650 in 2022) and the Pensioner Cost of Living Payment (£300 in 2022), which is paid with the Winter Fuel Payment.
- cost of living supports have added over £18 to the average weekly income of this household type. This accounts for approximately two-thirds of the increase in income for this household type. This increase helps explain why a lower proportion of income is needed for food.
Employed, National Living Wage (NLW)
- for working-age employed households, the minimum food basket represents a lower proportion of their income: between 23% and 31%. This is because people can earn more from employment than from relying on state benefits only.
- net income has risen for the three household types with children. This is due in part to increases in the National Living Wage rate and Universal Credit, and adjustments to the Universal Credit taper and National Insurance, in addition to the temporary Low Income Cost of Living Payments.
- for a two-parent household with one adult in full-time NLW employment, net household income is 8% higher in 2022 than in 2020. As income has risen at a higher rate than minimum food costs, the proportion of income spent on food has fallen by an average of 1%.
- for a one -parent household with the adult in part-time NLW employment, net household income is 4.4% higher in 2022 than in 2020. Minimum food costs have increased by slightly more than this, so food spending accounts for a marginally higher proportion (0.05%) of net income in 2022.
- the Low Income Cost of Living Payment has added £12.50 to the average weekly income of households with children types. This accounts for 31% of the increase in net income for the two-parent households and 68% of the increase in net income for the one-parent households in our survey.
- the household type with an older child (two parents with a primary and secondary-school-age child) would need to spend 30.7% of household income to afford the minimum essential food basket. This is 1.1% percentage points lower than in 2020.
Minimum essential food costs by sub-category
For further insight into what goes into the minimum essential food basket, and why the prices change, we look at the basket and the different rate of price changes according to sub-category of food groups. Table 2 presents the cost by sub-category in 2022. The cost of food by sub-category for each of the households since 2014 is detailed in Appendix 2.
Proportional make-up of the basket
- meat accounts for the largest proportion of the minimum food cost: a quarter of the cost for households with children and a fifth for the older person living alone
- for households with children, an average of two-thirds of the minimum food costs are for meat, fruit, vegetables, dairy products, and bread and cereals
- dairy products (milk, cheese and eggs) take up a larger proportion of the food budget for households with younger children, than for households with an older child or for an older person living alone
- while meat represents the largest proportion of costs, fish accounts for only 3% to 4% of the minimum essential food basket. This reflects the preferences of the focus groups
- school meals account for up to 12% of food costs for two-parent households with a primary and second-level-age child. The costs are based on bringing a packed lunch two days a week and purchasing a school lunch on three days a week during term time. However, households on a low income or in receipt of certain state benefits may qualify for free school meals, reducing this cost.
Social and cultural dimensions of food
Food poverty is multi-dimensional. It includes being unable to afford a nutritious diet, which in turn affects health and social life. The minimum essential food basket provides for the social and cultural aspects of food. This aims to ensure that households can take part in activities that are seen as a normal part of everyday life.
- take-away food is included in the minimum food budget, with an allowance for one take-away a month. At an average of 5% of the budget across the four household types, this is a minor proportion of the total.
- a small amount is set aside for alcohol (wine or beer), accounting for 6% to7% of the minimum essential food budget.
- older people living alone are likely to spend more of their budget on eating socially. The focus groups agreed that a person living alone should be able to have visitors round for a meal and have an occasional meal out with others. Consequently, the older person budget includes an amount for having a meal out once a month and a weekly food shop for visitors. These make up 24% of their minimum food costs.
- by including alcohol, treats, a take-away once a month and providing for visitors, our report highlights the social and cultural aspects of food. This ensures that the minimum essential food basket is based on real-life experience and recognises that, while food is of course necessary for survival, it also has social and cultural dimensions.
Change in average food costs
- between 2020 and 2022, the cost of food increased by an average of 4.3%. The average rate of change is based on the CPI sub-rate for food, which reflects the change in the cost of the average food basket purchased across the UK.
- this research series has tracked changes in food costs since 2014. Average food prices decreased in 2015 and 2016. They increased from 2017 to 2020, but remained below 2014 levels.
- in 2021, average food prices reduced again, with an overall reduction of 2.1% in the seven-year period from 2014.
- in the 12 months to March 2022, there was a 5.8% increase in average food costs. This has resulted in 2022 food prices rising above 2014 levels by 3.5%. This is the first average increase measured in this research series.
Figure 1: Cumulative change in average food prices, 2014 – 2022, based on the 12-month rate of change in the CPI for food, March to March
Change in minimum food costs
- the minimum food basket contains a more limited set of items than that of the ‘average household’ in the UK, and therefore does not always reflect the same rate of change.
- the minimum essential food budgets for the four household types increased by an average of 4.6% in the two-year period 2020-2022.
- the significant increase in minimum food costs in 2022 has added to the trend of such increases since 2016. The cumulative change from the 2016 low-price point is 10.9%.
- there have been increases in all food categories in the minimum food basket, except for a very modest decrease (0.8%) in the cost of tea and coffee.
- areas of price increase with the most impact on the minimum food basket include meat (4.3%), fruit (7.0%), vegetables (4.3%) and dairy (milk, cheese and eggs) (6.2%).
- increases in the cost of social aspects of food have also had an impact on the price of the minimum food basket. The average cost of take-away food increased by 8.1%, affecting all household types examined. The increase of 7.1% in prices at restaurants and cafes is partly why older people living alone have had the largest proportional increase in cost over the two years.
Table 2: Minimum essential food basket by sub-category
Two parents and two children at pre-school and primary school
| Food type | Cost per week | % of food MESL |
|---|---|---|
| Bread and cereals | £13.95 | 11% |
| Meat | £30.94 | 24% |
| Fish | £4.38 | 3% |
| Milk, cheese and eggs | £13.96 | 11% |
| Oils and fats | £1.97 | 2% |
| Fruit | £15.02 | 12% |
| Vegetables including potatoes and tubers | £14.19 | 11% |
| Sugar, jam and syrups | £0.49 | 0% |
| Food products not elsewhere classified | £1.30 | 1% |
| Coffee, tea and cocoa | £2.02 | 2% |
| Mineral waters, soft drinks and juices | £2.65 | 2% |
| Alcoholic beverages | £8.90 | 7% |
| Take-away | £6.34 | 5% |
| Treats | £4.18 | 3% |
| Extra for visitors | - | 0% |
| Extra for Christmas | £1.23 | 1% |
| Eating out | - | 0% |
| Total | £127.78 | 100% |
Two parents and two children at primary and secondary school
| Food type | Cost per week | % of food MESL |
|---|---|---|
| Bread and cereals | £17.44 | 10% |
| Meat | £43.20 | 26% |
| Fish | £4.88 | 3% |
| Milk, cheese and eggs | £10.68 | 6% |
| Oils and fats | £4.38 | 3% |
| Fruit | £14.60 | 9% |
| Vegetables including potatoes and tubers | £18.59 | 11% |
| Sugar, jam and syrups | £0.95 | 1% |
| Food products not elsewhere classified | £3.41 | 2% |
| Coffee, tea and cocoa | £4.02 | 2% |
| Mineral waters, soft drinks and juices | £3.16 | 2% |
| Alcoholic beverages | £10.82 | 6% |
| Take-away | £7.75 | 5% |
| Treats | £3.32 | 2% |
| Extra for visitors | - | 0% |
| Extra for Christmas | £1.49 | 1% |
| Eating out | - | 0% |
| Total | £168.70 | 100% |
One parent and two children at pre-school and primary school
| Food type | Cost per week | % of food MESL |
|---|---|---|
| Bread and cereals | £12.46 | 11% |
| Meat | £25.84 | 24% |
| Fish | £2.86 | 3% |
| Milk, cheese and eggs | £10.10 | 9% |
| Oils and fats | £3.12 | 3% |
| Fruit | £10.76 |
10% |
| Vegetables including potatoes and tubers | £12.77 | 12% |
| Sugar, jam and syrups | £1.21 | 1% |
| Food products not elsewhere classified | £3.72 | 3% |
| Coffee, tea and cocoa | £1.60 | 1% |
| Mineral waters, soft drinks and juices | £1.60 | 1% |
| Alcoholic beverages | £6.49 | 6% |
| Take-away | £4.65 | 4% |
| Treats | £3.43 | 3% |
| Extra for visitors | - | 0% |
| Extra for Christmas | £1.06 | 1% |
| Eating out | - | 0% |
| Total | £109.70 | 100% |
Pensioner, female, living alone
| Food type | Cost per week | % of food MESL |
|---|---|---|
| Bread and cereals | £2.56 | 4% |
| Meat | £11.84 | 19% |
| Fish | £2.48 | 4% |
| Milk, cheese and eggs | £3.87 | 6% |
| Oils and fats | £0.63 | 1% |
| Fruit | £3.38 | 5% |
| Vegetables including potatoes and tubers | £9.64 | 15% |
| Sugar, jam and syrups | £0.00 | 0% |
| Food products not elsewhere classified | £1.99 | 3% |
| Coffee, tea and cocoa | £1.12 | 2% |
| Mineral waters, soft drinks and juices | £0.00 | 0% |
| Alcoholic beverages | £4.18 | 7% |
| Take-away | £3.80 | 6% |
| Treats | £2.63 | 4% |
| Extra for visitors | £10.64 | 17% |
| Extra for Christmas | £0.51 | 1% |
| Eating out | £4.59 | 7% |
| Total | £63.86 | 100% |
References
1. MacMahon B, Weld, G. The cost of a minimum essential food basket in Northern Ireland. Pilot study for two household types. Dublin: safefood; 2015.
2. MacMahon B, Moloney, N. What is the cost of a healthy food basket in Northern Ireland in 2016? Dublin: safefood; 2016.
3. Food Standards Agency. Food and You 2: Northern Ireland Wave 3-4 Key Findings DOI https://doi.org/10.46756/sci.fsa.ybe946 Food and You 2 Wave 3-4 Northern Ireland Key findings reports; 2022.
4. Department of Health Health survey Northern Ireland: first results 2021/22. Health survey Northern Ireland: first results 2021/22 | Department of Health (health-ni.gov.uk) hsni-trend-tables-21-22.xlsx (live.com); 2022.
Appendices
Appendix 1: Calculations for each household type and each income scenario
Table 3: Household income calculations, working-age families with children
State benefits
| Incomings and Outgoings | Two parents, children at pre-school and primary | Two parents, children at primary and secondary | One parent, children at pre-school and primary |
|---|---|---|---|
| Universal Credit - Standard | £121.32 | £121.32 | £77.29 |
| Universal Credit - Child element | £123.36 | £123.36 | £123.36 |
| Child Benefit | £36.25 | £36.25 | £36.25 |
| Cost of Living Payment | £12.50 | £12.50 | £12.50 |
| Housing Benefit (rates) | £16.85 | £16.85 | £16.85 |
| Universal Credit - Housing | £68.39 | £68.39 | £68.39 |
| Household income | £378.67 | £378.67 | £334.64 |
National Living Wage
| Incoming and Outgoings | Two parents, children at pre-school and primary | Two parents, children at primary and secondary | One parent, children at pre-school and primary |
|---|---|---|---|
| Gross salary | £356.25 | £356.25 | £152.00 |
| Income tax | -£23.03 | -£23.03 | £0.00 |
| National Insurance | -£13.71 | -£13.71 | £0.00 |
| Net earnings | £319.51 | £319.51 | £152.00 |
| Universal Credit - Adult | £121.32 | £121.32 | £77.29 |
| Universal Credit - Child | £123.36 | £123.36 | £123.36 |
| Universal Credit - Housing | £68.39 | £68.39 | £68.39 |
| Earnings Reduction | -£132.07 | -£132.07 | -£39.94 |
| Universal Credit | £181.01 | £181.01 | £229.10 |
| Child Benefit | £36.25 | £36.25 | £36.25 |
| Rate Relief | £0.00 | £0.00 | £5.99 |
| Cost of Living Payment | £12.50 | £12.50 | £12.50 |
| Household income | £549.26 | £549.26 | £435.84 |
Table 4: Household income calculations, pension-age household type
| Type of household income | Pensioner Living alone |
|---|---|
| Basic state pension | £141.85 |
| Pension Credit | £40.75 |
| Winter Fuel Payment | £9.59 |
| Rates Relief | £16.85 |
| Cost of Living Payment | £12.50 |
| Household income | £221.54 |
Appendix 2: Changes in cost of food by sub-category
Table 5: Two parents with two children at pre-school and primary school
| Food group | 2014 | 2015 | 2016 | 2017 | 2018 | 2019 | 2020 | 2021 | 2022 |
|---|---|---|---|---|---|---|---|---|---|
| Bread and cereals | £12.85 | £12.80 | £12.55 | £12.72 | £12.97 | £13.17 | £13.53 | £13.26 | £13.95 |
| Meat | £30.18 | £30.01 | £28.69 |
£28.69 |
£29.60 | £29.07 | £29.65 | £29.30 | £30.94 |
| Fish | £3.95 | £3.83 | £3.63 | £3.95 | £4.10 | £4.16 | £4.25 | £4.18 | £4.38 |
| Milk, cheese and eggs | £13.47 | £13.08 | £12.53 | £12.64 | £13.22 | £12.97 | £13.14 | £12.85 | £13.96 |
| Oils and fats | £1.54 | £1.48 | £1.37 | £1.59 | £1.73 | £1.69 | £1.71 | £1.67 | £1.97 |
| Fruit | £13.43 | £13.05 | £13.30 | £13.47 | £13.93 | £13.79 | £14.04 | £14.25 | £15.02 |
| Vegetables | £13.52 | £13.57 | £13.01 | £13.24 | £13.36 | £14.07 | £13.61 | £13.54 | £14.19 |
| Sugar, jam and syrups | £0.46 | £0.46 | £0.45 | £0.46 | £0.47 | £0.47 | £0.49 | £0.47 | £0.49 |
| Food products not elsewhere classified | £1.19 | £1.18 | £1.18 | £1.20 | £1.21 | £1.23 | £1.22 | £1.20 | £1.30 |
| Coffee, tea and cocoa | £1.89 | £1.88 | £1.89 | £1.95 | £2.04 | £2.03 | £2.04 | £1.96 | £2.02 |
| Mineral waters, soft drinks, etc. | £2.27 | £2.29 | £2.26 | £2.17 | £2.25 | £2.38 | £2.46 | £2.46 | £2.65 |
| Alcoholic beverages | £8.49 | £8.56 | £8.23 | £8.40 | £8.46 | £8.53 | £8.62 | £8.69 | £8.90 |
| Take-away | £5.00 | £5.02 | £5.11 | £5.26 | £5.44 | £5.63 | £5.86 | £6.04 | £6.34 |
| Treats | £3.93 | £3.89 |
£3.78 |
£3.84 |
£3.95 | £3.97 | £4.01 | £3.95 | £4.18 |
| School lunch and milk | £5.83 | £5.83 | £6.05 | £6.05 | £6.26 | £6.26 | £6.26 | £6.26 | £6.26 |
| Extra for Christmas | £1.15 | £1.14 | £1.11 | £1.13 | £1.16 | £1.16 | £1.18 | £1.16 | £1.23 |
| TOTAL | £119.17 | £118.09 | £115.14 | £116.75 | £120.17 | £120.59 | £122.07 | £121.23 | £127.78 |
Table 6: Two parents and two children at primary and secondary school
| Food group | 2016 | 2017 | 2018 | 2019 | 2020 | 2021 | 2022 |
|---|---|---|---|---|---|---|---|
| Bread and cereals | £15.69 | £15.91 | £16.22 | £16.48 | £16.92 | £16.58 | £17.44 |
| Meat | £40.06 | £40.06 | £41.34 | £40.60 | £41.41 | £40.91 | £43.20 |
| Fish | £4.05 | £4.40 | £4.58 | £4.64 | £4.74 | £4.66 | £4.88 |
| Milk, cheese and eggs | £9.59 | £9.68 | £10.12 | £9.93 | £10.06 | £9.84 | £10.68 |
| Oils and fats | £3.05 | £3.52 | £3.84 | £3.74 | £3.80 | £3.71 | £4.38 |
| Fruit | £12.93 | £13.10 | £13.54 | £13.41 | £13.65 | £13.85 | £14.60 |
| Vegetables | £17.05 | £17.35 | £17.51 | £18.44 | £17.83 | £17.74 | £18.59 |
| Sugar, jam and syrups | £0.89 | £0.89 | £0.92 | £0.93 | £0.95 | £0.92 | £0.95 |
| Food products not elsewhere classified | £3.09 | £3.14 | £3.17 | £3.21 | £3.19 | £3.13 | £3.41 |
| Coffee, tea and cocoa | £3.75 | £3.88 | £4.04 | £4.02 | £4.05 | £3.89 | £4.02 |
| Mineral waters, soft drinks, etc. | £2.70 | £2.58 | £2.68 | £2.84 | £2.94 | £2.94 | £3.16 |
| Alcoholic beverages | £10.00 | £10.20 | £10.28 | £10.36 | £10.47 |
£10.55 |
£10.82 |
| Take -away | £6.25 | £6.43 | £6.64 | £6.88 | £7.16 | £7.38 | £7.75 |
| Treats | £3.00 | £3.05 | £3.14 | £3.15 | £3.19 |
£3.14 |
£3.32 |
| School lunch and milk | £19.57 | £19.57 | £19.99 | £19.99 | £19.99 | £19.99 | £19.99 |
| Extra for Christmas | £1.35 | £1.37 | £1.41 | £1.42 | £1.43 | £1.41 | £1.49 |
| TOTAL | £153.00 | £155.14 | £159.44 | £160.04 | £161.78 | £160.64 | £168.70 |
Table 7: One parent and two children at pre-school and primary school
| Food group | 2016 | 2017 | 2018 | 2019 | 2020 | 2021 | 2022 |
|---|---|---|---|---|---|---|---|
| Bread and cereals | £11.21 | £11.36 | £11.58 | £11.76 | £12.08 | £11.84 | £12.46 |
| Meat | £23.96 | £23.96 | £24.73 | £24.28 | £24.77 | £24.47 | £25.84 |
| Fish | £2.37 | £2.58 | £2.68 | £2.72 | £2.78 | £2.73 | £2.86 |
| Milk, cheese and eggs | £9.06 | £9.15 | £9.57 | £9.38 | £9.51 | £9.30 | £10.10 |
| Oils and fats | £2.17 | £2.51 | £2.73 | £2.67 | £2.70 | £2.64 | £3.12 |
| Fruit | £9.53 | £9.65 | £9.98 | £9.88 | £10.06 | £10.21 | £10.76 |
| Vegetables | £11.71 | £11.92 | £12.02 | £12.66 | £12.24 | £12.18 | £12.77 |
|
Sugar, jam and syrups |
£1.12 | £1.13 | £1.17 | £1.17 | £1.20 | £1.16 | £1.21 |
| Food products not elsewhere classified | £3.37 | £3.43 | £3.46 | £3.51 | £3.48 | £3.42 | £3.72 |
| Coffee, tea and cocoa | £1.49 | £1.54 | £1.61 | £1.60 | £1.61 | £1.54 | £1.60 |
| Mineral waters, soft drinks, etc. | £1.37 | £1.31 | £1.36 | £1.44 | £1.49 | £1.49 | £1.60 |
| Alcoholic beverages | £6.00 | £6.12 | £6.17 | £6.22 | £6.28 | £6.33 | £6.49 |
| Take-away | £3.75 | £3.86 | £3.99 | £4.13 | £4.30 | £4.43 | £4.65 |
| Treats | £3.09 | £3.14 | £3.24 | £3.25 | £3.28 | £3.24 | £3.43 |
| School lunch and milk | £7.83 | £7.83 | £8.04 | £8.04 | £8.04 | £8.04 | £8.04 |
| Extra for Christmas | £0.96 | £0.98 | £1.01 | £1.01 | £1.02 | £1.01 | £1.06 |
| TOTAL | £99.00 | £100.46 | £103.33 | £103.72 | £104.86 | £104.03 | £109.70 |
Table 8: Pensioner living alone, female
| Food type | 2014 | 2015 | 2016 | 2017 | 2018 | 2019 | 2020 | 2021 | 2022 |
|---|---|---|---|---|---|---|---|---|---|
| Bread and cereals | £2.35 | £2.35 | £2.30 | £2.33 | £2.38 | £2.41 | £2.48 | £2.43 | £2.56 |
| Meat | £11.55 | £11.48 | £10.98 | £10.98 | £11.33 | £11.12 | £11.34 | £11.21 | £11.84 |
| Fish | £2.24 | £2.17 | £2.06 | 2.24 | £2.33 | £2.36 | £2.41 | £2.37 | £2.48 |
| Milk, cheese and eggs | £3.74 | £3.63 | £3.48 | £3.51 | £3.67 | £3.60 | £3.65 | £3.57 | £3.87 |
| Oils and fats | £0.49 | £0.47 | £0.44 | £0.51 | £0.55 | £0.54 | £0.54 | £0.53 | £0.63 |
| Fruit | £3.02 | £2.94 | £2.99 | £3.03 | £3.13 | £3.10 | £3.16 | £3.20 | £3.38 |
| Vegetables | £9.18 | £9.21 | £8.84 | £8.99 | £9.08 | £9.56 | £9.24 | £9.19 | £9.64 |
| Sugar, jam and syrups | £0.00 | £0.00 | £0.00 | £0.00 | £0.00 | £0.00 | £0.00 | £0.00 | £0.00 |
| Food products not elsewhere classified | £1.82 | £1.80 | £1.80 | £1.83 | £1.85 | £1.87 | £1.86 | £1.83 | £1.99 |
| Coffee, tea and cocoa | £1.05 | £1.04 | £1.05 | £1.08 | £1.13 | £1.13 | £1.13 | £1.09 | £1.12 |
| Mineral waters, soft drinks, etc. | £0.00 | £0.00 | £0.00 | £0.00 | £0.00 | £0.00 | £0.00 | £0.00 | £0.00 |
| Alcoholic beverages | £3.99 | £4.02 | £3.87 | £3.95 | £3.98 | £4.01 | £4.05 | £4.08 | £4.18 |
| Take -away | £3.00 | £3.01 | £3.07 | £3.16 | £3.26 | £3.38 | £3.52 | £3.62 | £3.62 |
| Treats | £2.47 | £2.45 | £2.38 | £2.41 | £2.49 | £2.49 | £2.52 | £2.49 | £2.63 |
| Extra for visitors | £10.00 | £9.91 | £9.61 | £9.77 | £10.06 | £10.09 | £10.20 | £10.06 | £10.64 |
| Extra for Christmas | £0.48 | £0.48 | £0.46 | £0.47 | £0.48 | £0.49 | £0.49 | £0.48 | £0.51 |
| Eating out | £3.75 | £3.76 | £3.84 | £3.94 | £4.05 | £4.16 | £4.28 | £4.33 | £4.59 |
| Total | £59.13 | £58.73 | £57.14 | £58.19 | £59.76 | £60.31 | £60.88 | £60.48 | £63.86 |
Revision log
Published: 19 May 2023
Last updated: 20 May 2024