Food and You 2: Wave 9 Key Findings
F&Y2 Wave 9, Chapter 5: Online platforms
This chapter provides an overview of respondents’ use of online platforms, including how frequently people use online platforms to buy food or drink, and the types of food and drink people order.
Introduction
An online food platform is a technology business that facilitates the exchange of food between vendor(s) and consumer(s). Any business selling food online, including food delivery businesses (footnote 1), must be registered as a food business. The FSA provides guidance for food businesses, which use online platforms (footnote 2). A food safety officer from the local authority will inspect a business to check that it follows food hygiene law so that the food is safe to eat.
Food and You 2 asks respondents about their use and experiences with different types of food-related online platforms. A range of online platforms were asked about including food business and delivery websites, food sharing apps and social media marketplaces.
This chapter provides an overview of respondents’ use of online platforms, including how frequently people use online platforms to buy food or drink, and the types of food and drink people order. It also provides information on people’s awareness and use of food hygiene ratings and allergen information on online platforms.
Which online platforms are used to order food or drink online?
Respondents were asked to indicate if they had ever ordered food or drink online from a number of different platforms. Six in ten respondents (60%) reported that they had ordered food or drink from the websites of a restaurant, takeaway or café and just over half of respondents had ordered from an online ordering and delivery company (for example, Just Eat, Deliveroo, Uber Eats) (55%). Around three in ten respondents (27%) had ordered via an online marketplace (for example Amazon, Gumtree, Etsy). The platforms used least by respondents were food sharing apps (for example Olio, Too Good To Go) (17%) and social media platforms (for example, Facebook, Instagram, Nextdoor) (7%) (Figure 16) (footnote 3).
Use of online marketplaces (for example Amazon, Gumtree, Etsy) to order food or drink varied between different categories of people in the following ways:
- age group: younger adults were more likely to have ordered food or drink from an online marketplace compared to older adults. For example, 33% of those aged 16- 24 years had ordered food or drink from an online marketplace compared to those aged 65-74 years (13%) and those aged 75 and above (7%)
- household size: respondents who lived in larger households were more likely to have ordered food or drink from an online marketplace than those living in smaller households. For example, 16% of those living in 1-person households had ordered food or drink from an online marketplace compared to 34% of those in households of 4-persons and 34% of those in households of 5-person or more
- children under 16 years in the household: 34% of those with children under 16 years in the household had ordered food or drink from an online marketplace compared to 24% of those without children under 16 years
- children under six years in the household: 35% of those with children under six years in the household had ordered food or drink from an online marketplace compared to 26% of those without children under six years
- annual household income: respondents with incomes less than £19,000 (33%) were more likely to have ordered food or drink from an online marketplace than households with incomes between £32,000-£63,999 (25%)
- food security: respondents with low (40%) or very low (38%) food security were more likely to have ordered food or drink from an online marketplace than those with marginal (27%), or high (23%) food security
- responsibility for food shopping: those who shop for food (28%) were more likely to have ordered food or drink from an online marketplace than those who never shop (15%)
Use of social media (for example, Facebook, Instagram, Nextdoor) to order food or drink varied between different categories of people in the following ways:
- age group: adults under 45 years were more likely to have ordered food or drink from social media than older adults. For example, 15% of those aged 25-34 years and 12% of those aged 35-44 years had ordered food or drink from social media compared to 2% of those aged 75 years or over
- food security: those who were less food secure were more likely to have ordered food or drink from social media. For example, 20% of those with very low food security had ordered food or drink from social media compared to 4% of those with high food security
Use of food sharing apps (for example Olio, Too Good To Go) to order food or drink varied between different categories of people in the following ways:
- age group: younger adults were more likely to have ordered food or drink from a food sharing app than older adults. For example, 27% of adults aged 16-24 years had ordered food or drink from a food sharing app compared to 6% of those aged 75 years or over
- household size: respondents who lived in larger households were more likely to have ordered food or drink from a food sharing app than those who lived in smaller households. For example, 32% of those who lived in households of 5- persons or more had ordered food or drink from a food sharing app compared to 9% of those in 1-person households
- NS-SEC: respondents who were long term unemployed and/or had never worked (27%) were more likely to have ordered food or drink from a food sharing app than those in occupations (for example, 12% intermediate occupations and 10% lower supervisory and technical occupations)
- food security: those who had marginal (20%), low (23%) or very low (27%) food security were more likely to have ordered food or drink from a food sharing app than those with high food security (13%)
Figure 16. Where respondents order food and drink online
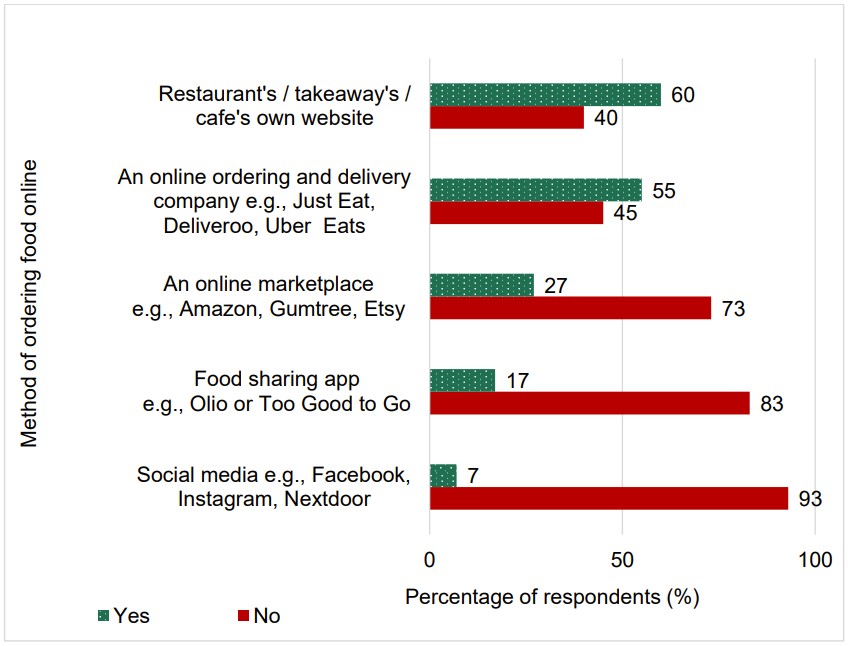
Source: Food and You 2: Wave 9.
What do individuals order online from a restaurant, take-away or café’s own website?
Respondents who ordered food or drink from a restaurant, take-away or café’s own website were most likely to order prepared cooked meals or snacks (90%), baked goods and desserts (19%) and milkshakes/ice creams (14%) (footnote 4). Similarly, those who ordered food or drink from an online ordering and delivery company were most likely to order prepared cooked meals or snacks (93%), baked goods and desserts (19%) and milkshakes/ice creams (19%) (footnote 5).
How often do respondents order food or drink through online platforms?
Respondents who had ordered food or drink from a range of online platforms were asked how frequently they ordered food or drink from that platform. Most respondents ordered food or drink from each type of online platform 2-3 times a month or less often, with a minority using these types of platforms about once a week or more often. For example, a fifth (21%) of respondents ordered food or drink from an online ordering and delivery company (for example, Just Eat, Deliveroo, Uber Eats) about once a week or more often, whilst 74% of respondents did this 2-3 times a month or less often. Nearly half (46%) of respondents reported that they couldn’t remember how often they ordered food or drink from a social media platform (e.g., Facebook, Instagram, Nextdoor) (Figure 17) (footnote 6).
Figure 17. How often respondents order food or drink from different online platforms
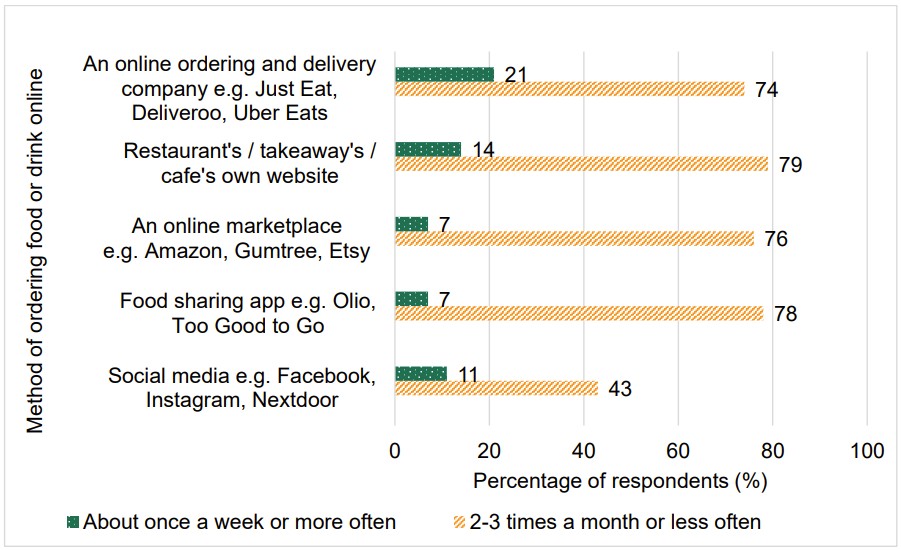
Source: Food and You 2: Wave 9
Use of FHRS on online platforms The Food Hygiene Rating Scheme (FHRS) helps people make informed choices about where to eat out or shop for food by giving clear information about the businesses’ hygiene standards. Businesses are given a rating from 0 to 5. A rating of 5 indicates that hygiene standards are very good and a rating of 0 indicates that urgent improvement is required. The FSA runs the scheme in partnership with local authorities in England, Wales, and Northern Ireland.
Respondents who had ordered food or drink through an online platform and had heard of the FHRS were asked how often they look for FHRS ratings when ordering food and drink online. Almost half of respondents (47%) ‘always’ or ‘most of the time’ looked for the FHRS ratings, 30% of respondents did this about half of the time or occasionally, and 21% of respondents never looked for the FHRS rating when ordering food and drink online (footnote 7).
Respondents who reported looking for FHRS ratings when ordering food or drink online were asked how often the ratings were easy to find. Half of respondents (50%) reported that the ratings were ‘always’ or ‘most of the time’ easy to find, 38% reported that the ratings were easy to find about half the time or occasionally, and 4% reported that the ratings were never easy to find (footnote 8).
Hypersensitivities and use of online platforms
Respondents who have a food hypersensitivity, and/or live with someone who has a food hypersensitivity, were asked how often they look for information which allows them to identify food that may cause a bad or unpleasant reaction when ordering food or drink online. Of those, a fifth (20%) reported that they always look for information that would allow them to identify food that might cause them a bad or unpleasant reaction, and 40% of respondents look for this information less often (i.e., ‘most of the time’, ‘about half of the time’, ‘occasionally’). However, 36% reported that they never look for information that would allow them to identify food that might cause a bad or unpleasant reaction when ordering food or drink online (footnote 9).
Of those respondents who look for information online that allows them to avoid food that may cause a bad or unpleasant physical reaction, half (48%) reported that this was always or most of the time easy to find whilst 30% reported that this information was occasionally or never easy to find (footnote 10). Of those who find allergen information when looking for this online, six in ten (60%) reported that this information was always or most of the time easy to understand (footnote 11).
-
Advice to businesses selling food online, FSA. Regulation (EC) no 178/2002 of the European parliament and of the council of 28 January 2002.
-
Distance selling, mail order and delivery, FSA. Food safety for food delivery, FSA.
-
Question: Have you ever ordered food or drink online through...? a) a restaurant's, cafe's or takeaway's own website. b) an online ordering and delivery company e.g. Just Eat, Deliveroo or Uber Eats, etc. c) an online marketplace, e.g. Amazon, Gumtree, Etsy, etc. d) social media, e.g. Facebook, Instagram, Nextdoor, etc. e) a food sharing app, e.g. Olio or Too Good To Go, etc. Responses: yes, no. Base= 3530, all online respondents.
-
Question: In the last 12 months, what food or drink have you ordered online directly through a restaurant’s, café’s or takeaway’s own website? Responses: prepared cooked meals or snacks, baked goods and desserts, such as cheesecakes, cakes, biscuits, breads etc or dough/mixes to make these, milkshakes / ice creams, protein shakes, fresh fruit or vegetables (uncooked), dairy products, such as milk, cheese, yoghurt, butter etc, alcoholic drinks, such as beer, wine, spirits, cocktails, non-alcoholic drinks, other (please specify). Base 1,879, all online respondents who have ever ordered food or drink online through this platform/website, excluding those who cannot remember what they purchased.
-
Question: In the last 12 months, what food or drink have you ordered online through an online ordering and delivery company (e.g., Just Eat, Deliveroo or Uber Eats etc.?) Responses: prepared cooked meals or snacks, baked goods and desserts, such as cheesecakes, cakes, biscuits, breads etc or dough/mixes to make these, milkshakes/ ice creams, protein shakes, fresh fruit or vegetables (uncooked), dairy products, such as milk, cheese, yoghurt, butter etc, sweets and chocolates, alcoholic drinks, such as beer, wine, spirits, cocktails, non-alcoholic drinks, other (please specify). Base 1603, all online respondents who have ever ordered food or drink online through this platform/website, excluding those who cannot remember what they purchased.
-
Question: How often do you order food or drink online...? A) a restaurant's, cafe's or takeaway's own website. b) an online ordering and delivery company e.g. Just Eat, Deliveroo or Uber Eats, etc. C) an online marketplace, e.g. Amazon, Gumtree, Etsy, etc. d) social media, e.g. Facebook, Instagram, Nextdoor, etc. e) a food sharing app, e.g. Olio or Too Good to Go, etc. Responses: every day, most days, 2-3 times a week, about once a week, 2-3 times a month, about once a month, less than once a month, never, can’t remember. Base A= 2006, B= 1682, C= 920, D= 223, E= 487, all online respondents.
-
Question: When you order food and drink online, how often do you look for Food Hygiene Rating Scheme (FHRS) ratings? Responses: always, most of the time, about half of the time, occasionally, never, don’t know. Base= 2317, all online respondents who have ordered food and drink online and have heard of the Food Hygiene Rating Scheme (FHRS).
-
Question: When you look for FHRS ratings when ordering food and drink online, how often are they easy to find? Responses: always, most of the time, about half of the time, occasionally, never, don’t know. Base= 1796, all online respondents who look for Food Hygiene Rating Scheme ratings when ordering food or drink online.
-
Question: When you order food and drink online, how often do you look for information that allows you to identify food that might cause you or another member of your household a bad or unpleasant physical reaction? Responses: always, most of the time, about half of the time, occasionally, never, don’t know, I don’t order food and drink online. Base= 2101, all online respondents who have ordered food or drink online and who suffer from a bad or unpleasant physical reaction after consuming certain foods or avoid certain foods because of the bad or unpleasant physical reaction they might cause, and/or live with at least one other adult or child in their household.
-
Question: When ordering food and drink online and you look for information that allows you to identify food that might cause you or another member of your household a bad or unpleasant physical reaction, how often, if at all, is this information easy to find? Responses: always, most of the time, about half of the time, occasionally, never, don’t know. Base= 1255, all online respondents who have ordered food or drink online, look for allergen information when ordering food or drink online, and who suffer from a bad or unpleasant physical reaction after consuming certain foods or avoid certain foods because of the bad or unpleasant physical reaction they might cause, and/or live with at least one other adult or child in their household.
-
Question: When ordering food and drink online and you find information that allows you to identify food that might cause you or another member of your household, a bad or unpleasant physical reaction, how often, if at all, is this information easy to understand? Responses: always, most of the time, about half of the time, occasionally, never, don’t know. Base= 1134, all online respondents who have ordered food or drink online, look for allergen information when ordering food or drink online, find allergen information when ordering food or drink online, and who suffer from a bad or unpleasant physical reaction after consuming certain foods or avoid certain foods because of the bad or unpleasant physical reaction they might cause, and/or live with at least one other adult or child in their household.