Inter-laboratory collaborative trial of real-time PCR method for the relative quantitation of horse DNA and pork DNA in raw and processed beef DNA: phase 1
Inter-laboratory collaborative trial of real-time PCR method phase 1: internal validation
Details on the internal validation and extraction method.
DNA extraction
Figure 1: Extracted Beef DNA assessed for fragmentation on an agarose gel.
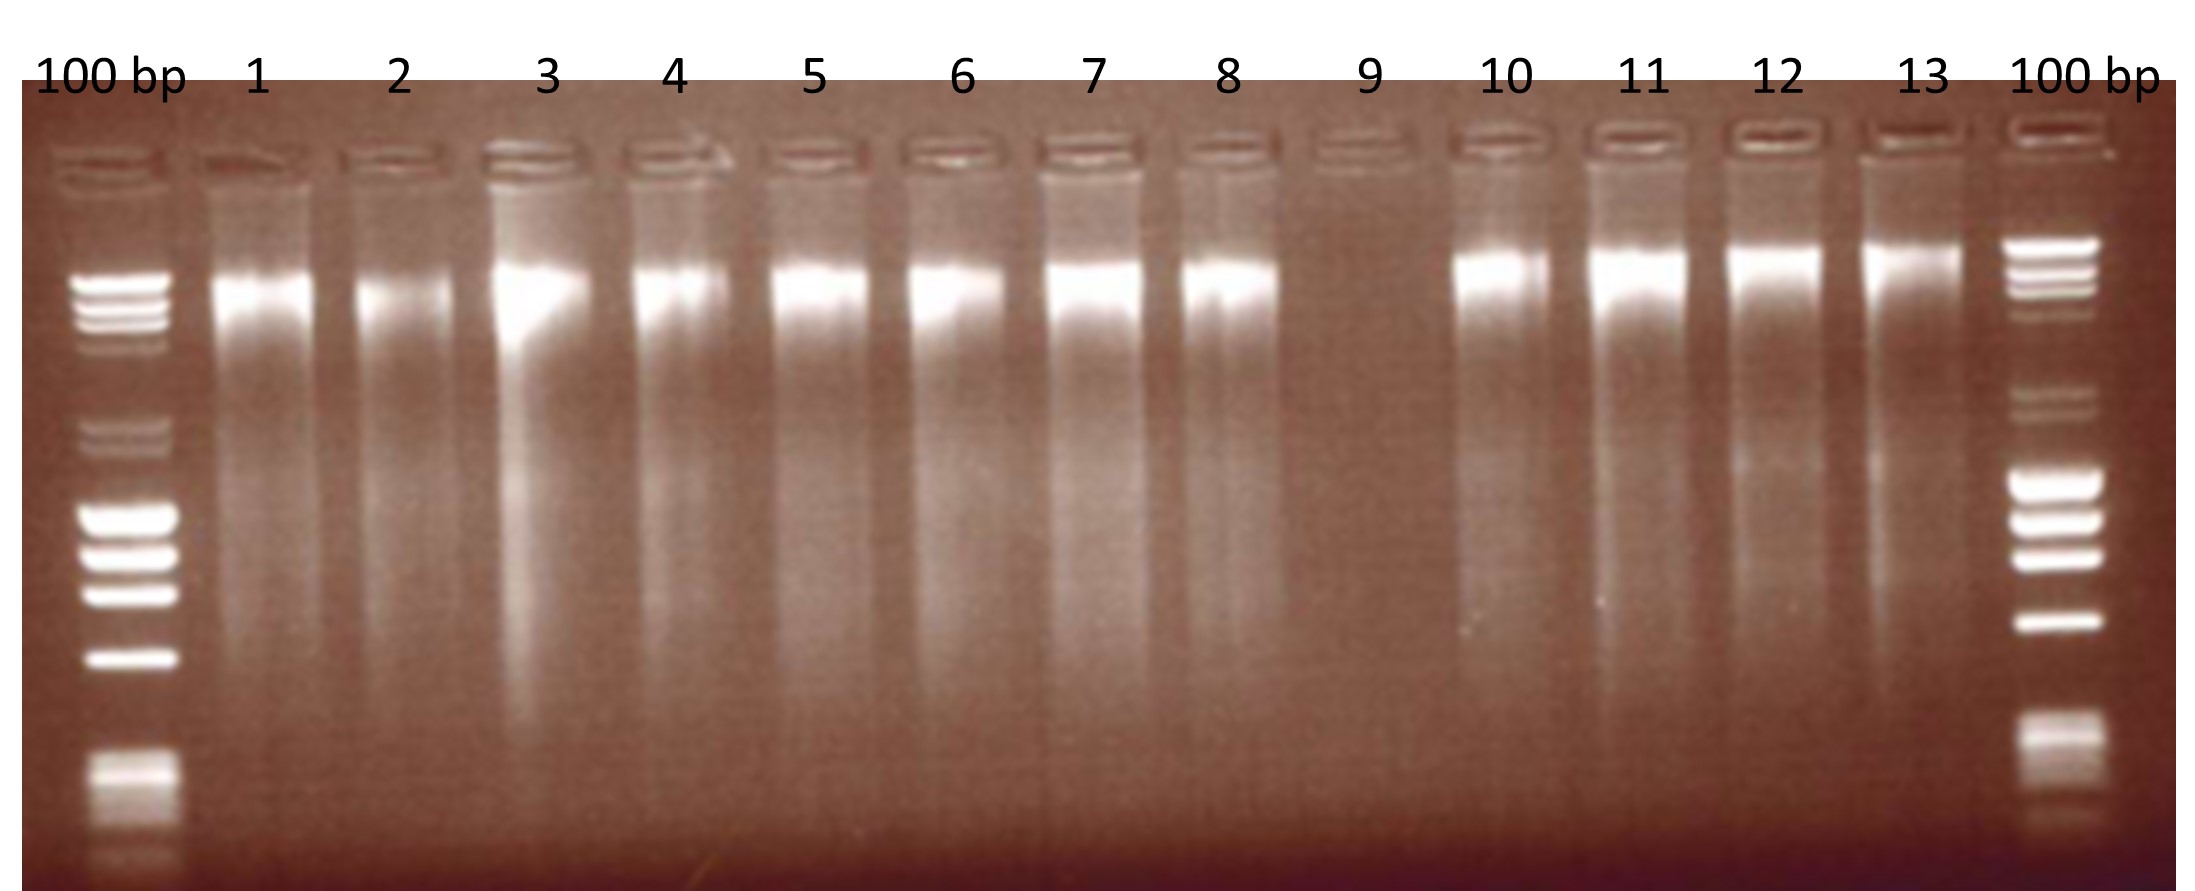
100 bp: DNA ladders, Lane 1: 30 min incubation, 100 µl elution; Lane 2: 30 min, 150 µl elution; Land 3: 30 min, 50 + 50 µl elution; Lane 4: 30 min, 100 + 50 µl elution; Lane 5: 60 min, 100 µl elution; Lane 6: 60 min, 150 µl elution; Lane 7: 60 min, 50 + 50 µl elution; Lane 8: 60 min, 100 + 50 µl elution; Lane 9: Blank; Lane 10 – 11: Environmental negative controls; Lane 12-13: first mince.
As the precise method of extraction was not defined in the supporting report [5] we based our extraction method on the same buffer-based methodology. DNA was extracted from each species using the commercially available DNeasy® Mericon Food Kit (Qiagen) which is a cetyltrimethylammonium bromide (CTAB) method. The quality and quantity of the DNA was measured on the NanoDropTM (Thermo Scientific) and by gel electrophoresis to check for DNA fragmentation. Both the horse and pork yielded 152.3 ± 3.0 ng/µl and 250.8 ± 2.0 ng/µl respectively. The background matrix of beef yielded 226.6 ± 1.6 ng/µl.
Appendix 1 Table A1 shows the NanoDropTM data from the individual extracts prior to pooling.
Variations on the extraction method were also assessed for suitability, i.e. quality of the extracted DNA was assessed for fragmentation by running 5 µl of beef DNA on an agarose gel (Figure 1). Minced meat (2 g) was homogenised in 10 ml lysis buffer and proteinase K by mechanical disruption in a vortex. The homogenised mixture was then incubated at 60 °C, centrifuged and the cell lysis supernatant was phase-separated with chloroform. DNA was washed and precipitated in ethanol and eluted in 50 µl of elution buffer from the kit. The extraction method was also assessed in DNA fragmentation and a variety of modifications were trialled in the method. Modifications included differing lengths of incubation (30 or 60 minutes) and differing elution volumes (50 µl, 100 µl or 150 µl).
Because the input mass of each test portion of the meat was restricted for practical reasons (due to tube sizes) the eluates were individually measured on the spectrophotometer and the 260/280 nm and 260/230 nm ratios were noted. All individual extracts passed minimum performance criteria for quality and quantity and so were pooled after extractions to make one homogenous extract for each meat species.
Authentication
Each meat species was authenticated by Sanger sequencing using cytochrome B primers fwd: 5’-CCATCCAACATCTCAGCATGATGAA-3’ and rev: 5’-CCCCTCAGAATGATATTTGTCCTCA-3’; against reference genomes for beef (D34635), horse (D82932) and pork (NC_000845). All alignment figures can be found in Appendix II, Figures A1-A3.
Inhibition
The pooled horse and pork DNA were examined for inhibitors that may affect PCR amplification. The myostatin assay was used to determine if there was inhibition, at a working dilution of 1:10 (from primary 100% extracts), and then three subsequent 1:4 dilutions for a four-point inhibition curve. There was no inhibition in any of the horse or pork DNA extracts (Figure 2), with the working concentration extrapolated values within 0.5 Cq of the measured values.
Figure 2: Inhibition curves for horse (empty circle) and pork (empty square).

The slopes and R2 for both matrices are within performance criteria. The measured Cq values for the horse assay (filled circle) and pork (filled square) are within limits as the extrapolated Cq value, indicating no inhibitory compounds influencing the PCR reaction.
Standard curves
The standard curves were produced from 100% raw horse and 100% pork species DNA, initially with a starting dilution of 22.5 ng/µl which we have estimated to be approximately 4096 copies for both species based on their equivalent genome sizes (2.47Mb horse and 2.45Mb pig). 4-fold and 8-fold curves showed similar results with all assays passing minimum performance criteria as set by the previous project [5, 6] and supporting standards [7, 8] (Figures 3 and 4).
Figure 3: Pork 4-fold and 8-fold standard curves for the pork specific assay (filled squares) and the mammalian myostatin assay (empty squares).

Data shown are Mean Cq ± Standard deviation (mean CT on axis label). S1 for both 4-fold and 8-fold standards are 22.5ng/µl.
Figure 4: Horse 4-fold and 8-fold standard curves for the horse specific assay (filled circles) and the mammalian myostatin assay (empty circles).

Data shown are Mean Cq ± Standard deviation (mean CT on axis label). S1 for both 4-fold and 8-fold standards are 22.5ng/µl.
10% and 3% initial raw samples indicative homogeneity
Once the 10% and 3% mixtures of raw horse in raw beef and raw pork in raw beef were made, they were quantified against the horse or pork standard curves respectively. 10% and 3% horse in beef samples measured (equine:myostatin) 12.88% ± 0.73 and 3.73% ± 0.46 respectively. 10% and 3% pork in beef samples measured (porcine:myostatin) 15.85% ± 0.76 and 5.26% ± 0.48.
Interpretation of the indicative homogeneity is that the relative variance in the samples ranges between 4.8% RSD and 12.3% RSD. Given that the target reproducibility precision of the interlaboratory trial shall be 25%, the variance in the indicative homogeneity is unlikely to significantly affect the outcome of the trial.
At this point of the sample verification, the decision was made to proceed with the remaining sample preparation and verification.
10% and 3% processed samples indicative homogeneity
The 10% and 3% pork in beef mixtures were processed by cooking. The recipe (ingredients) for the processed meat samples followed that of the previous project [4, 5], however, this lacked detail on the method of cooking. A trial was undertaken of cooking of the 10% and 3% pork mixtures on a hot plate. DNA was then extracted from the processed samples and these were quantified against the pork 8-fold standard curve (Figure 5). The results of the 10% and 3% processed samples were very close to the first dilution point on the mammalian standard curve. This was potentially due to the additional processing involved in the preparation of the mixtures and intensity of the heat was able to rupture additional muscle cells and release a higher concentration of myostatin in processed samples.
All further cooking of the samples was decided to be carried out in a Bain Marie to reduce the intensity of the heat during the cooking process and prevent as much DNA degradation as possible. Subsequently, the 10% and 3% horse mixtures were cooked, and DNA was extracted. The 10% and 3% horse raw and processed samples were then quantified against a horse 8-fold standard curve (Figure 6). Again, both the 10% and 3% processed horse samples were beyond the dynamic range of the myostatin standard curve. Further processing of the lower % w/w mixtures could fall off the standard curve, so we decided to increase the starting concentration (from 22.5 ng/µl to 40 ng/µl) to ensure the 8-fold standard curve was suitable for all further assessments (Figure 7). This brings the estimated genome copy number to approximately 31508 copies for both species based on their equivalent genome sizes (2.47Mb horse and 2.45Mb pig).
Figure 5: Quantification of 10% and 3% pork mixtures against the pork specific assay (top plot) or the mammalian myostatin assay (bottom plot).

8-fold curves with S1 at 22.5 ng/µl.
Figure 6: Quantification of 10% and 3% horse mixtures against the horse specific assay (top plot) or the mammalian myostatin assay (bottom plot).

8-fold curves with S1 at 22.5 ng/µl.
Figure 7: Pork (top plot) and horse (bottom plot) 8-fold standard curves.

Data shown are Mean CT ± Standard deviation. S1 for both pork and horse 8-fold standards are 40ng/µl.
Lower % w/w indicative homogeneity
The 1%, 0.5% and 0.1% raw mixtures of horse and pork meats were produced as previously described. We ensured all % combinations were within the dynamic range of the standard curve for each of pork (Figure 8) and horse (Figure 9).
Figure 8: Quantification of all % combinations of raw (left panels) and processed (right panels) pork samples against the 8-fold 40 ng/µl standard curve.

Figure 9: Quantification of all % combinations of raw (left panels) and processed (right panels) horse samples against the 8-fold 40ng/µl standard curve.

PCR assay volumes and cycling conditions
The LGC protocols (associated to [5]) used a variety of different concentrations for each assay and the rationale for this was not clear. Validation of the pork, horse and mammalian assays used the same compositions across all for ease of use Table 2. PCR thermal cycling conditions for all assays can be found in Table 3.
Table 2: Real-time PCR reaction composition for each assay (pork, horse and mammalian) for a total reaction volume of 25 µl. MGW: molecular grade water.
| PCR reagent | 1X per assay |
|---|---|
| 2x Universal Master mix | 12.5 |
| Forward primer (20µM) | 0.375 |
| Reverse primer (20µM) | 0.375 |
| Probe (5 µM) | 1 |
| MGW | 5.75 |
| Template DNA (Standards and test samples) | 5 |
Table 3: PCR thermal cycling conditions used for all assays.
| Temperature (c) | Time (s) | Repeat cycles |
|---|---|---|
| 50 | 120 | 1 |
| 95 | 600 | 1 |
| 95 | 15 | 45 |
| 60 | 60 | 45 |