Optimising extraction and RT-qPCR-based detection of hepatitis E virus (HEV) from pork meat and products (HEVDETECT)
Optimising extraction and RT-qPCR-based detection of hepatitis E virus (HEV) from pork meat and products: Appendices
Appendices for the report.
Appendix A: Full report of market share and consumption data of pork products in the UK.
The aim of this review was to help identify specific matrices which we will use for the next phase of the HEVDETECT project, so that we can optimize a detection method suitable for as wide a range of product types as possible, whilst this reflects the most consumed pork products in the UK. A case control study of 25 cases conducted in England identified pork pies (OR 6.33), and ham and sausages purchased from one particular supermarket chain (OR 10.12) as significantly associated with indigenous infection. (Said et al, 2014). A subsequent study in England supported this association of ham and sausages from a particular supermarket chain, with the G3-2 phylotype detected in cases not detected in indigenous pigs suggesting infection from pork originating outside the UK (Said et al, 2017). Recently Health Protection Scotland carried out an enhanced surveillance study for Scottish individuals confirmed positive for HEV. Among the clinical cases, the consumption of pork (i.e., pork chops, roast pork) at least once a week was reported by 17% of cases, 46% consumed sliced prepacked ham at least once a week, 40% consumed bacon at least once a week and 21% consumed pork sausages at least once a week.
Overall, 80% reported the consumption of at least one pork product in the nine weeks prior to onset. Further data will be added to the compilation to determine target products.
Review of available data
Three sets of data have been acquired. The first set is from the NDNS (National Diet and Nutrition Survey) covering a rolling program for 8 years from 2008 – 2016 (Bates et al 2014; Bates et al. 2016 and Roberts et al. 2018). This dataset includes consumption data split into 2 age groups of 19-40 years and 40 years plus and are also split by gender. Table 1 details the chronic consumption of pork carcass meat, whilst Table 2 details the acute consumption of pork carcass meat. Table 3 details the chronic consumption of processed pork and Table 4 details the acute consumption of processed pork. Statistical significance was calculated using a z score calculator for 2 populations to assess the difference in male and female consumption in each age grouping for each consumption category (https://www.socscistatistics.com/). Table 5 shows the number of respondents in the population groups.
Table 1: Chronic Consumption of pork carcase meat
| Gender | Age group | Number of consumers | (g/person/day) Mean | (g/person/day) 97.5th percentile | (g/person/day) Maximum | (g/kg bw/day) Mean | (g/kg bw/day) 97.5th percentile | (g/kg bw/day) Maximum |
|---|---|---|---|---|---|---|---|---|
| Female | 19 to 40 years | 132 | 31 | 80 | 127 | 0.46 | 1.3 | 1.9 |
| 3Female | 40+ years | 379 | 27 | 68 | 121 | 0.39 | 1.0 | 1.8 |
| Male | 19 to 40 years | 105 | 38 | 87 | 106 | 0.46 | 1.1 | 1.6 |
| Male | 40+ years | 317 | 37 | 92 | 150 | 0.43 | 1.1 | 1.8 |
Table 2: Acute Consumption of pork carcase meat
| Gender | Age group | Number of consumers | (g/person/day) Mean | (g/person/day) 97.5th percentile | (g/person/day) Maximum | (g/kg bw/day) Mean | (g/kg bw/day) 97.5th percentile | (g/kg bw/day) Maximum |
|---|---|---|---|---|---|---|---|---|
| Female | 19 to 40 years | 132 | 31 | 80 | 127 | 0.46 | 1.3 | 1.9 |
| 3Female | 40+ years | 379 | 27 | 68 | 121 | 0.39 | 1.0 | 1.8 |
| Male | 19 to 40 years | 105 | 38 | 87 | 106 | 0.46 | 1.1 | 1.6 |
| Male | 40+ years | 317 | 37 | 92 | 150 | 0.43 | 1.1 | 1.8 |
Table 3: Chronic Consumption of processed pork
| Gender | Age group | Number of consumers | (g/person/day) Mean | (g/person/day) 97.5th percentile | (g/person/day) Maximum | (g/kg bw/day) Mean | (g/kg bw/day) 97.5th percentile | (g/kg bw/day) Maximum |
|---|---|---|---|---|---|---|---|---|
| Female | 19 to 40 years | 384 | 22 | 64 | 94 | 0.32 | 0.9 | 1.8 |
| 3Female | 40+ years | 781 | 26 | 73 | 105 | 0.36 | 1.1 | 1.8 |
| Male | 19 to 40 years | 311 | 36 | 100 | 187 | 0.45 | 1.4 | 2.4 |
| Male | 40+ years | 718 | 34 | 97 | 148 | 0.40 | 1.2 | 2.1 |
Table 4: Acute Consumption of processed pork
| Gender | Age group | Number of consumers | (g/person/day) Mean | (g/person/day) 97.5th percentile | (g/person/day) Maximum | (g/kg bw/day) Mean | (g/kg bw/day) 97.5th percentile | (g/kg bw/day) Maximum |
|---|---|---|---|---|---|---|---|---|
| Female | 19 to 40 years | 384 | 71 | 170 | 310 | 1.0 | 2.5 | 3.9 |
| 3Female | 40+ years | 781 | 80 | 188 | 374 | 1.1 | 2.8 | 5.7 |
| Male | 19 to 40 years | 311 | 103 | 260 | 402 | 1.3 | 3.5 | 5.5 |
| Male | 40+ years | 718 | 102 | 254 | 432 | 1.2 | 3.2 | 5.7 |
Table 5. Number of respondents in the population group
| Gender | Age group | Number of respondents in Population group |
|---|---|---|
| Female | 19 - 40 years | 927 |
| Female | 40+ years | 1866 |
| Male | 19 - 40 years | 601 |
| Male | 40+ years | 1394 |
Key:
The number of people in the age group 19-40 years who took part in the NDNS survey = 927 female and 601 male.
The number of people in the age group 40 plus years who took part in the NDNS survey = 1866 female and 1394 male.
The number of consumers relates to the number of people in the population group who ate the food e.g. 397 people consumed pork carcass meat out of 1866.
“Chronic consumption” relates to food consumed over a long period of time continuously or intermittently i.e. daily average
“Acute consumption” relates to food consumed over a short time i.e. maximum day.
g/kg bw/day = g per kg bodyweight per day consumed
97.5th percentile = 97.5 percentage of the sample
The pork carcass meat consists generally of the following:
- Pork belly rashers
- Pork loin chops
- Pork leg joints
- Pork fat
- Pork belly
- Pork blood
- Pork shoulder
- Pork crackling
- Pork spare rib
- Pork hand or spring joint
- Pork loin joint
- Pork chump chops
- Pork leg steaks
- Diced / minced pork
- Pork tongue
- Kidneys
- Livers
The processed pork consists generally of the following:
- Chorizo
- Canned ham / pork
- Pork luncheon meat
- Black pudding
- Frankfurter
- Pork sausages
- Pork and beef sausages
- Saveloy
- Economy sausages
- Skinless sausages
- Premium sausages
- Pepperami
- Smoked pork sausages
- Sausage cakes
- Pork burgers
- Smoked / unsmoked / streaky bacon rashers
- Gammon / bacon joint
- Bacon fat
As a very general conclusion from the data in Tables 1-4 above, the daily average (Chronic consumption) and the maximum per day (Acute consumption) shows that males in both age categories consume more pork carcass meat (chronic consumption p=0.03; acute consumption p<0.0001) and processed pork meat in the 19-40 age group (chronic consumption p=0.0056; acute consumption p<0.0001) than females. For processed meat, in the 40+ age group, chronic consumption appears to be equivalent between males and females (p>0.5; NS) but still significant in the acute consumption of processed meat (p=0.018).
It can be assumed that the majority of the above cuts of meat, both carcass and processed is intended to be cooked before consumption, however there are certain products which may not have had any heat treatment, e.g. Chorizo, pepperami, etc., and are intended to be eaten without any cooking step. It is not possible to derive from the data how much of each of the listed products is consumed.
The second dataset is derived from “Family Food datasets: countries and regions (CR) (updated with revised 2016/17 data and new 2017/18 data): Household purchases”, DEFRA, 2020, and shows the Purchased quantities of household food & drink by Government Office Region and Country. Table 6 shows the averages of pork products purchased per person per week (grams) and per category and is the latest figures for 2017/2018 with the data in Figure 1. in funnel chart format.
Table 6. Averages purchased per person per week (grams)
| Product | England | Wales | Scotland | Northern Ireland |
|---|---|---|---|---|
| Pigs liver | 1 | 0 | 0 | 1 |
| Pork chops | 6 | 9 | 10 | 11 |
| All other pork | 11 | 12 | 6 | 9 |
| Pork fillets and steaks | 14 | 14 | 12 | 9 |
| Pork joints | 17 | 18 | 5 | 7 |
| Bacon and ham joints uncooked | 16 | 29 | 7 | 39 |
| Bacon and ham rashers uncooked | 40 | 48 | 31 | 59 |
| Bacon and ham cooked | 39 | 61 | 46 | 62 |
| Pork sausage uncooked | 56 | 69 | 54 | 72 |
| Totals | 200 | 251 | 171 | 271 |
Table 7 – Regional data for England – average consumption of pork products (g) 2017/2018
| Product | North East | North West | Yorkshire & Humber | East Midlands | West Midlands | East | London | South East | South West | Totals |
|---|---|---|---|---|---|---|---|---|---|---|
| Pork joints | 18 | 19 | 26 | 26 | 7 | 19 | 14 | 12 | 17 | 158 |
| Pork chops | 7 | 6 | 5 | 7 | 9 | 10 | 4 | 7 | 4 | 59 |
| Pork fillets and steaks | 24 | 9 | 17 | 12 | 13 | 17 | 10 | 16 | 13 | 131 |
| All other pork | 5 | 4 | 12 | 9 | 8 | 11 | 18 | 12 | 9 | 88 |
| Pigs liver | 2 | 1 | 1 | 0 | 2 | 1 | 0 | 0 | 0 | 7 |
| Bacon and ham joints uncooked | 17 | 21 | 16 | 10 | 18 | 18 | 12 | 18 | 16 | 146 |
| Bacon and ham rashers uncooked | 50 | 48 | 39 | 45 | 54 | 48 | 19 | 37 | 38 | 378 |
| Bacon and ham cooked | 56 | 34 | 40 | 40 | 39 | 36 | 26 | 35 | 57 | 363 |
| Pork sausages uncooked | 56 | 57 | 44 | 78 | 60 | 63 | 42 | 51 | 65 | 516 |
| Totals | 235 | 199 | 200 | 227 | 210 | 223 | 145 | 188 | 219 | 1846 |
| HEV Regional Data (16--17) | 77 | 197 | 185 | 160 | 255 | 228 | 258 | 300 | 353 | 2013 |
Figure 1. Funnel chart detailing the weight (g) of pork products by category purchased in the UK during 2017/2018.
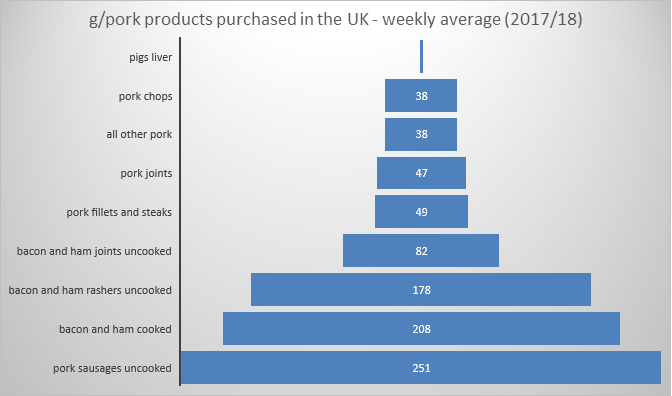
This data shows that uncooked pork sausages; cooked bacon and ham and uncooked bacon and ham rashers account for the majority of weekly purchases across all countries in the UK, followed by uncooked ham and bacon joints. It is not entirely clear from this dataset which of the above relates to “processed” pork as detailed in the first dataset, however the “all other pork” category may well include processed products such as chorizo and pepperami. It is not apparent from the data if uncooked / dried / fermented pork products including salamis are included in the “uncooked” categories in the top 4 listed above. Data for pies or pâtés were unavailable in this dataset. Table 7 illustrates the breakdown of consumption per region in England and also provides the number of cases which have been laboratory confirmed in that region for the period 16-17 (figure 3; Oeser et al 2019). The highest incidence of cases is in the South East and South West, which appears to coincide with the largest consumption of pork sausages. Further detailed statistical regression analysis is required to identify if any particular product is related in this data set. It has previously been shown that the increased autochthonous incidence was first recognised in the S. West (Dalton et.al 2006).
Figure 3: Estimated log relative risk for all hepatitis E virus (HEV) genotype 3 (G3) infections (A), HEV G3 group 1 infections (B), and HEV G3 group 2 infections (C). Tolerance contours are superimposed as solid lines at the 95% confidence level. Solid lines indicate areas of significantly higher risk. Dashed lines indicate areas of significantly lower risk. Data reproduced from J Infect Dis, Volume 220, Issue 5, 1 September 2019, Pages 802–810, https://doi.org/10.1093/infdis/jiz207
Table 8 shows the 3-year average of pork products purchased per person per week (grams) and per category and Figure 2 is in Funnel chart format.
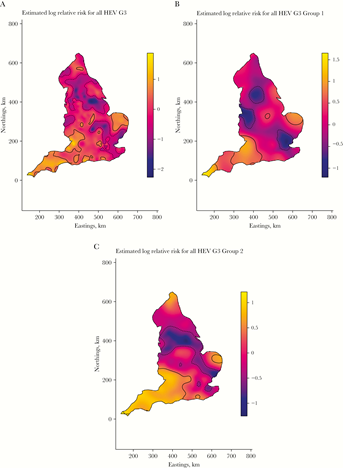
Table 8. 3-year average of pork products purchased per person per week (grams) in the UK
| Product | England | Wales | Scotland | Northern Ireland |
|---|---|---|---|---|
| Pigs liver | 1 | 0 | 0 | 1 |
| Pork chops | 6 | 9 | 10 | 13 |
| All other pork | 11 | 12 | 6 | 9 |
| Pork fillets and steaks | 14 | 14 | 12 | 9 |
| Pork joints | 17 | 18 | 5 | 7 |
| Bacon and ham joints uncooked | 16 | 20 | 7 | 39 |
| Bacon and ham rashers uncooked | 40 | 48 | 31 | 59 |
| Bacon and ham cooked | 39 | 61 | 46 | 62 |
| Pork sausages uncooked | 56 | 69 | 54 | 72 |
| Totals | 200 | 251 | 171 |
271 |
Funnel 2. Funnel chart detailing the 3-year average of weight (g) of pork products by category purchased in the UK
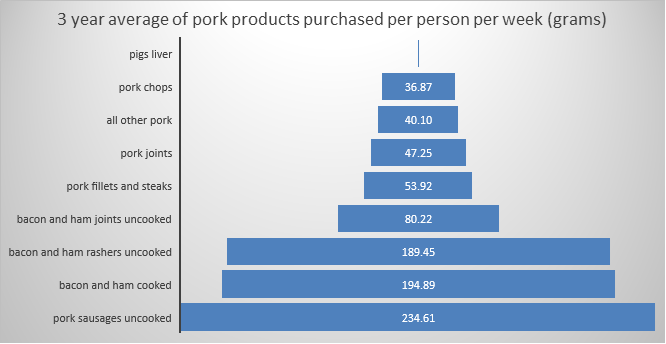
Both the one, and three year averages show the same pattern of consumption, with uncooked pork sausages being the largest by weight of product purchased in the UK, followed by cooked bacon and ham and uncooked bacon and ham rashers being the third.
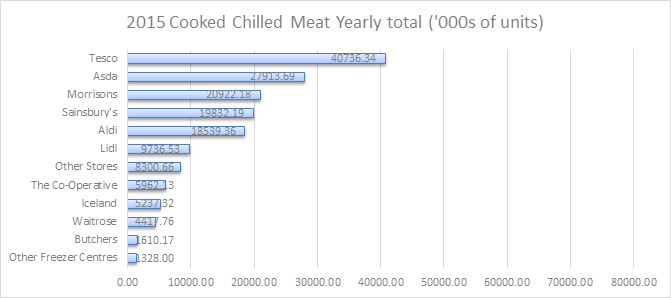
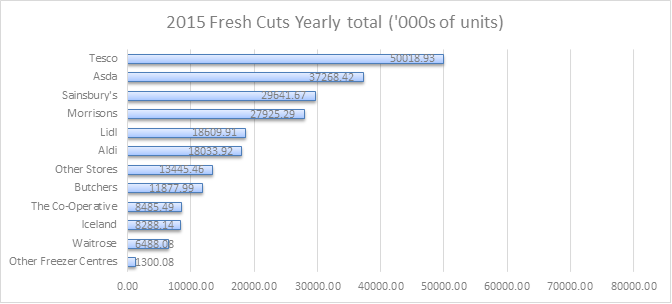
The third dataset has been obtained from Kantar UK – a data, insights and consulting company and details the purchase of pork products by UK retailers during the year 2015. The graphs below show the retailers purchase of chilled processed pork; cooked chilled pork products and fresh cuts as a yearly total in ‘000s of units sold. Again, this is not strictly consumption data, but for the purposes of this review we are assuming purchases relate to amounts consumed to give a general conclusion as to which product categories are consumed most across the UK.
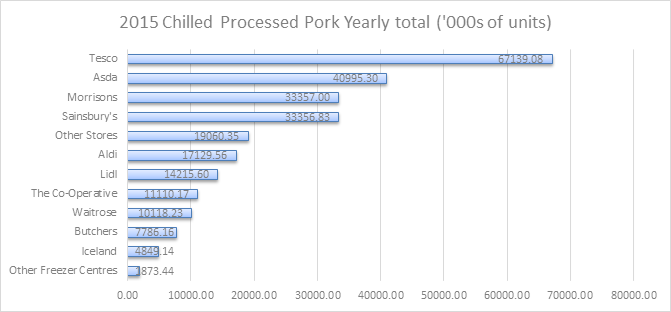
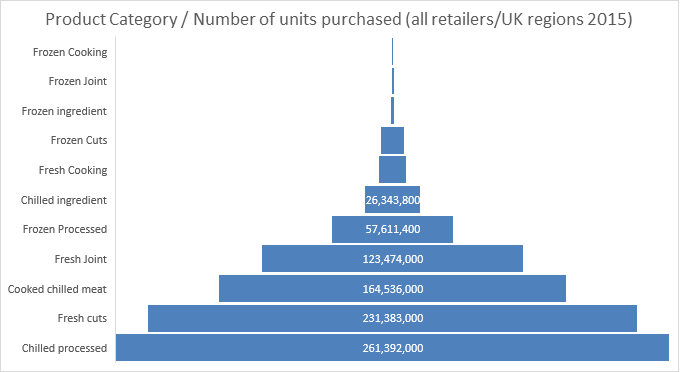
This dataset does not break down the products by type in the same way as the first two datasets, and neither does it break down the data between locally produced and imported products but it does give an overall picture of the sheer volumes of pork products sold over the course of a year by different retailers. A summary of the data for the product categories across all regions of the UK and across all retailers, whether Prepacked or loose, is shown in Table 8, with the funnel chart below.
Table 8. Number of units of each category purchased by UK retailers in 2015
| Product category | Number if units purchased |
|---|---|
| Chilled processed | 261,392,000 |
| Fresh cuts | 231,383,000 |
| Cooked chilled meat | 164,536,000 |
| Fresh joint | 123,474,000 |
| Frozen processed | 57,611,400 |
| Chilled ingredient | 26,343,800 |
| Fresh cooking | 12,984,000 |
| Frozen cuts | 11,459,900 |
| Frozen ingredient | 1,794,030 |
| Frozen joint | 1,443,440 |
| Frozen cooking | 17,441 |
Conclusions
In reviewing the data from the 3 datasets available, there are no solid conclusions we can come to with regard to specific product types consumed across the UK e.g., premium vs. economy pork sausages, salami, chorizo, hams etc. The general conclusion from these data shows that pork sausages are one of the highest consumed products across the UK and this is certainly one matrix which will be included in the next phase of the project. Many of the pork products listed in the datasets are intended to be cooked, including of course pork sausages, however we know already that pork sausages have had HEV RNA detected in them (Berto. et al 2012) and that inadequate cooking of such products may present a risk of HEV infection. Perhaps of more concern are the “uncooked” categories which are intended to be eaten uncooked or RTE. These may include chorizo, salami, fermented sausage products etc. We will continue to analyse the data from Public Health England as it becomes available and may include products which are linked to high case rates in the development of the method.
References
Bates, B.; Lennox, A.; Prentice, A.; Bates, C.; Page, P.; Nicholson, S.; Swan, G. (2014) National Diet and Nutrition Survey Results from Years 1, 2, 3 and 4 (combined) of the Rolling Programme (2008/2009 – 2011/2012) (PDF)
2. Bates, B.; Cox, L.; Nicholson, S.; Page, P.; Prentice, A.; Steer, T.; Swan, G. (2016) National Diet and Nutrition Survey Results from Years 5 and 6 (combined) of the Rolling Programme (2012/2013 – 2013/2014) (PDF)
Berto A, Martelli F, Grierson S, Banks M. Hepatitis E virus in pork food chain, United Kingdom, 2009-2010. Emerg. Infect Dis 2012; 18:1358–60.
Dalton, H. R.; Thurairajah, P. H.; Fellows, H. J.; Hussaini, H. S.; Mitchell, J.; Bendall, R.; Banks, M.; Ijaz, S.; Teo, C.-G.; Levine, D. F (2007). Autochthonous hepatitis E in southwest England. Journal of Viral Hepatitis. Vol. 14 Issue 5, p304-309
Kantar dataset kindly provided by FSS.
Oeser,C; Vaughan, A; Said, B; Ijaz, S; Tedder, R; Haywood, B; Warburton, F; Charlett, A; Elson, R and Morgan, D. (2019). Epidemiology of Hepatitis E in England and Wales: A 10-Year Retrospective Surveillance Study, 2008–2017. The Journal of Infectious Diseases, pp 802-10.
Roberts, C.; Steer, T.; Maplethorpe, N.; Cox, L.; Meadows, S.; Page, P.; Nicholson, S.; Swan, G. (2018) National Diet and Nutrition Survey Results from Years 7 and 8 (combined) of the Rolling Programme (2014/2015 – 2015/2016) (PDF)
Said, B., et al. (2014). Hepatitis E virus in England and Wales: indigenous infection is associated with the consumption of processed pork products. Epidemiol.Infect. 142:1467-1475
Said, B., et al. (2017). Pork products associated with human infection caused by an emerging phylotype of hepatitis E virus in England and Wales Epidemiol.Infect. 145:2417-2423
Appendix B: HEV recovery from pork sausage (high and low grade) and smooth pâté using four extraction and three different detection methods
| Protocol | Source | Elution buffer | 1 step RT-qPCR Mean CT and SD | 2 step RT-qPCR Mean CT and SD | Ceeram Mean CT and SD | 1 step RT-qPCR % recovery | 2 step RT-qPCR % recovery | Ceeram % recovery |
|---|---|---|---|---|---|---|---|---|
| GCU | Low grade Pork sausage 1 | RLT lysis | 35.184/0.338 | 38.438/0.118 | 34.871/0.382 | 64.16 | 27.72 | 5.49 |
| GCU | Low grade Pork sausage 2 | RLT lysis | 35.154/0.224 | 39.402/0.000 | 35.243/0.485 | 65.05 | 12.67 | 4.23 |
| GCU | High grade Pork sausage 1 | RLT lysis | 34.333/0.510 | 37.995/0.772 | 34.461/1.264 | 124.5 | 43.54 | 8.85 |
| GCU | High grade Pork sausage 2 | RLT lysis | 32.715/0.049 | 35.691/0.005 | 31.968/0.041 | 407.5 | 256.33 | 44.74 |
| GCU | Smooth Brussels Pâté 1 | RLT lysis | 0/0 | 36.867/0.484 | 33.738/0.651 | 0.000 | 102.63 | 13 |
| GCU | Smooth Brussels Pâté 2 | RLT lysis | 0/0 | 35.622/0.025 | 32.777/0.039 | 0.000 | 271.1 | 24.79 |
| Di Barolo et al (2015) | Low grade Pork sausage 1 | RLT lysis | 38.547/0 | 34.423/0.096 | 34.948/0.118 | 9.82 | 122.39 | 8.94 |
| Di Barolo et al (2015) | Low grade Pork sausage 2 | RLT lysis | 33.452/0.067 | 35.521/0.199 | 31.945/0.012 | 355.75 | 59.62 | 64.59 |
| Di Barolo et al (2015) | High grade Pork sausage 1 | RLT lysis | 36.713/0.220 | 32.260/0.005 | 31.135/0.042 | 35.97 | 508.27 | 110.37 |
| Di Barolo et al (2015) | High grade Pork sausage 2 | RLT lysis | 37.411/0.199 | 34.933/0.000 | 33.669/0.246 | 21.97 | 87.41 | 20.82 |
| Di Barolo et al (2015) | Smooth Brussels Pâté 1 | RLT lysis | 0.000/0.000 | 32.849/0.097 | 32.709/0.174 | 0.000 | 345.11 | 39.13 |
| Di Barolo et al (2015) | Smooth Brussels Pâté 2 | RLT lysis | 0.000/0.000 | 34.709/0.044 | 32.033/0.074 | 0.000 | 101.3 | 60.98 |
| Martin Latil et al (2015) | Low grade Pork sausage 1 | Distilled water | 0/0 | 37.440/0.181 | 33.293/0.031 | 0 | 28.58 | 144.25 |
| Martin Latil et al (2015) | Low grade Pork sausage 2 | Distilled water | 0/0 | 38.638/0.706 | 33.739/0.277 | 0 | 21.97 | 73.98 |
| Martin Latil et al (2015) | High grade Pork sausage 1 | Distilled water | 0/0 | 37.465/0.222 | 33.622/0.069 | 0 | 23.42 | 142.39 |
| Martin Latil et al (2015) | High grade Pork sausage 2 | Distilled water | 0/0 | 38.137/0.075 | 33.410/0.230 | 0 | 26.76 | 95.34 |
| Martin Latil et al (2015) | Smooth Brussels Pâté 1 | Distilled water | 0/0 | 38.263/0.492 | 33.976/0.354 | 0 | 19.11 | 90.33 |
| Martin Latil et al (2015) | Smooth Brussels Pâté 2 | Distilled water | 0/0 | 38.142/0.117 | 33.680/0.059 | 0 | 22.6 | 95.14 |
| CBRI | Low grade Pork sausage 1 | Trizol | 36.867/0.415 | 34.791/0.501 | 33.764/0.582 | 7.34 | 50.33 | 19.78 |
| CBRI | Low grade Pork sausage 2 | Trizol | 37.072/0.257 | 34.563/0.400 | 33.537/0.246 | 6.17 | 59.32 | 22.27 |
| CBRI | High grade Pork sausage 1 | Trizol | 35.745/1.598 | 36.738/0.751 | 33.769/0.179 | 23.82 | 15.29 | 19.1 |
| CBRI | High grade Pork sausage 2 | Trizol | 36.931/0.043 | 35.107/0.269 | 34.069/0.381 | 6.8 | 38.32 | 15.9 |
| CBRI | Smooth Brussels Pâté 1 | Trizol | 38.939/0.000 | 0.000/0.000 | 36.874/0.590 | 1.45 | 0 | 2.62 |
| CBRI | Smooth Brussels Pâté 2 | Trizol | 38.098/0.875 | 36.345/0.621 | 35.778/0.296 | 3.09 | 15.29 | 5.2 |
Revision log
Published: 26 July 2023
Last updated: 12 September 2023