Research project
Food Hygiene Rating Scheme (FHRS) Audit of Display and Business Survey 2022
Introduction
Under the scheme, places where food is supplied, sold or consumed are given a rating ranging from 0 to 5, with 5 indicating ‘very good’ food hygiene and 0 indicating ‘urgent improvement necessary’. In Wales and Northern Ireland, businesses have been legally required to display their food hygiene rating sticker in a prominent place like the front door, entrance or window of the business since 2013 and 2016 respectively. Businesses in England do not have to display their rating at their premises but are encouraged to do so. Across England, Northern Ireland and Wales, food hygiene ratings are also available to search on the Food Standards Agency (FSA) FHRS website.
The FSA has conducted research into the Display of Food Hygiene Ratings in England, Northern Ireland and Wales since 2011 (with a pause in 2020 due to COVID-19). As with the previous waves of the research, the objectives were threefold:
- provide a representative estimate of the display of food hygiene ratings by food businesses
- explore the reasons and drivers for display and non-display
- explore business awareness and attitudes towards the scheme
Mainstage fieldwork in October and December 2022 comprised 1,525 covert audits of food businesses in England, Northern Ireland and Wales (501, 527 and 497 respectively) and 1,500 telephone interviews of food businesses in England, Northern Ireland and Wales (500 per nation). In total, 484 food businesses that participated in the telephone survey were also audited.
Audit results
In England, around two-thirds (67%) of businesses were displaying a food hygiene rating, either inside or in a location visible from outside their premises. Although not significantly higher than in 2021 (64%), this represents a continuation of the steady upwards trend in rates of display by businesses in England since 2017, when 55% of businesses displayed a sticker. There has also been an increase since 2019 in the proportion of businesses displaying the sticker so that it is visible from the outside of their premises (63% in 2022 compared to 55% in 2019).
In Northern Ireland and Wales, where it is mandatory for businesses to display their food hygiene rating, the vast majority of businesses had their rating on display either inside or in a location visible from outside the premises (Northern Ireland 87% and Wales 91%). In both countries these figures represented a return to pre-pandemic levels of display following a slight dip in 2021 (84% and 88% respectively (footnote 1)). This still however left approximately one in 10 businesses in Northern Ireland and Wales not displaying in a compliant fashion. In the survey, businesses in Northern Ireland and Wales commonly reported that they did not display their rating because there was nowhere suitable to show it outdoors.
In England and Northern Ireland, takeaways and sandwich shops were more likely than average to have a sticker on display (England 79% and Northern Ireland 95%), while accommodation businesses, pubs, bars, and nightclubs were less likely (England 57% and Northern Ireland 67%). In Wales, restaurants and catering businesses were more likely than average to display their sticker (96%), while retail businesses (for example supermarkets and food shops) were less likely (81%).
Likely due to the statutory requirement to display, there was little difference in display rates between businesses with different food hygiene ratings in Northern Ireland and Wales. However, in England, businesses with a rating of 5 were more likely than average to display a sticker (77%), while those with a rating of 4 (43%) or 3 (39%) were less likely. Furthermore, focusing on audited food businesses with a rating of less than three, it was much more common for businesses in Northern Ireland (4 out of 6) and Wales (17 out of 20) to have an FHRS sticker on display than their counterparts in England (6 out of 22).
Alongside an audit of the business premises, auditors conducted an online review to see whether the food hygiene rating was displayed on the business’s website or Facebook Business Page (regardless of whether the business offered online sales). Most businesses had an online presence in either regard (England 84%, Northern Ireland 89% and Wales 87%). However, relatively few businesses with a website or Facebook Business Page displayed their rating on these platforms: 13% in England, 6% in Northern Ireland and 8% in Wales. Where displayed, ratings usually matched the rating shown on the FHRS database (95% in England, 100% in Northern Ireland and 92% in Wales).
Survey results
Awareness of the scheme and satisfaction with ratings
As found in previous years, most food businesses surveyed reported having heard of the FHRS (92% in England, Northern Ireland and Wales). Historically, awareness of the scheme in Northern Ireland and Wales has been higher than in England, likely reflecting the different legal requirements around the FHRS in the different countries. However, in 2022 awareness of the scheme was consistent across all three countries.
Within each country, self-reported awareness of the FHRS was at a similarly high level across the different sizes of food businesses, outlet types, and food hygiene rating that the business held. However, takeaways and sandwich shops stood out as being less likely than average to be aware of the scheme in England (85%), Northern Ireland (85%) and Wales (83%).
In line with 2021, most businesses reported being satisfied with their food hygiene rating (England 91%; Northern Ireland 95%; Wales 89%). Those with a higher rating showed higher satisfaction levels, but otherwise, satisfaction levels were similar across outlet types.
As few businesses stated being dissatisfied with their food hygiene rating, it is not possible to confidently report what was driving this dissatisfaction. But indicatively, the reasons reported by businesses that were dissatisfied were that they were expecting a higher rating than they were given, a sense that the rating was not fair, and situations where the inspection was conducted at an inconvenient time (it should be noted that inspections by Local Authorities are intended to be unannounced).
Most businesses in England (60%) and Northern Ireland (58%) reported feeling that the lowest food hygiene rating they would be satisfied with would be the top rating of a 5, while just under half (49%) of businesses in Wales would only be satisfied with a rating of 5. However, many businesses felt a 4 rating would be ‘good enough’ for them to display (England: 45%; Northern Ireland: 44%; Wales: 43%).
Reported display of ratings and reasons for non-display
The majority of surveyed food businesses reported being aware that they had been given a food hygiene rating (93% in England, 97% in Northern Ireland and 96% in Wales) and most of these said they displayed their FHRS sticker in a place clearly visible to customers.
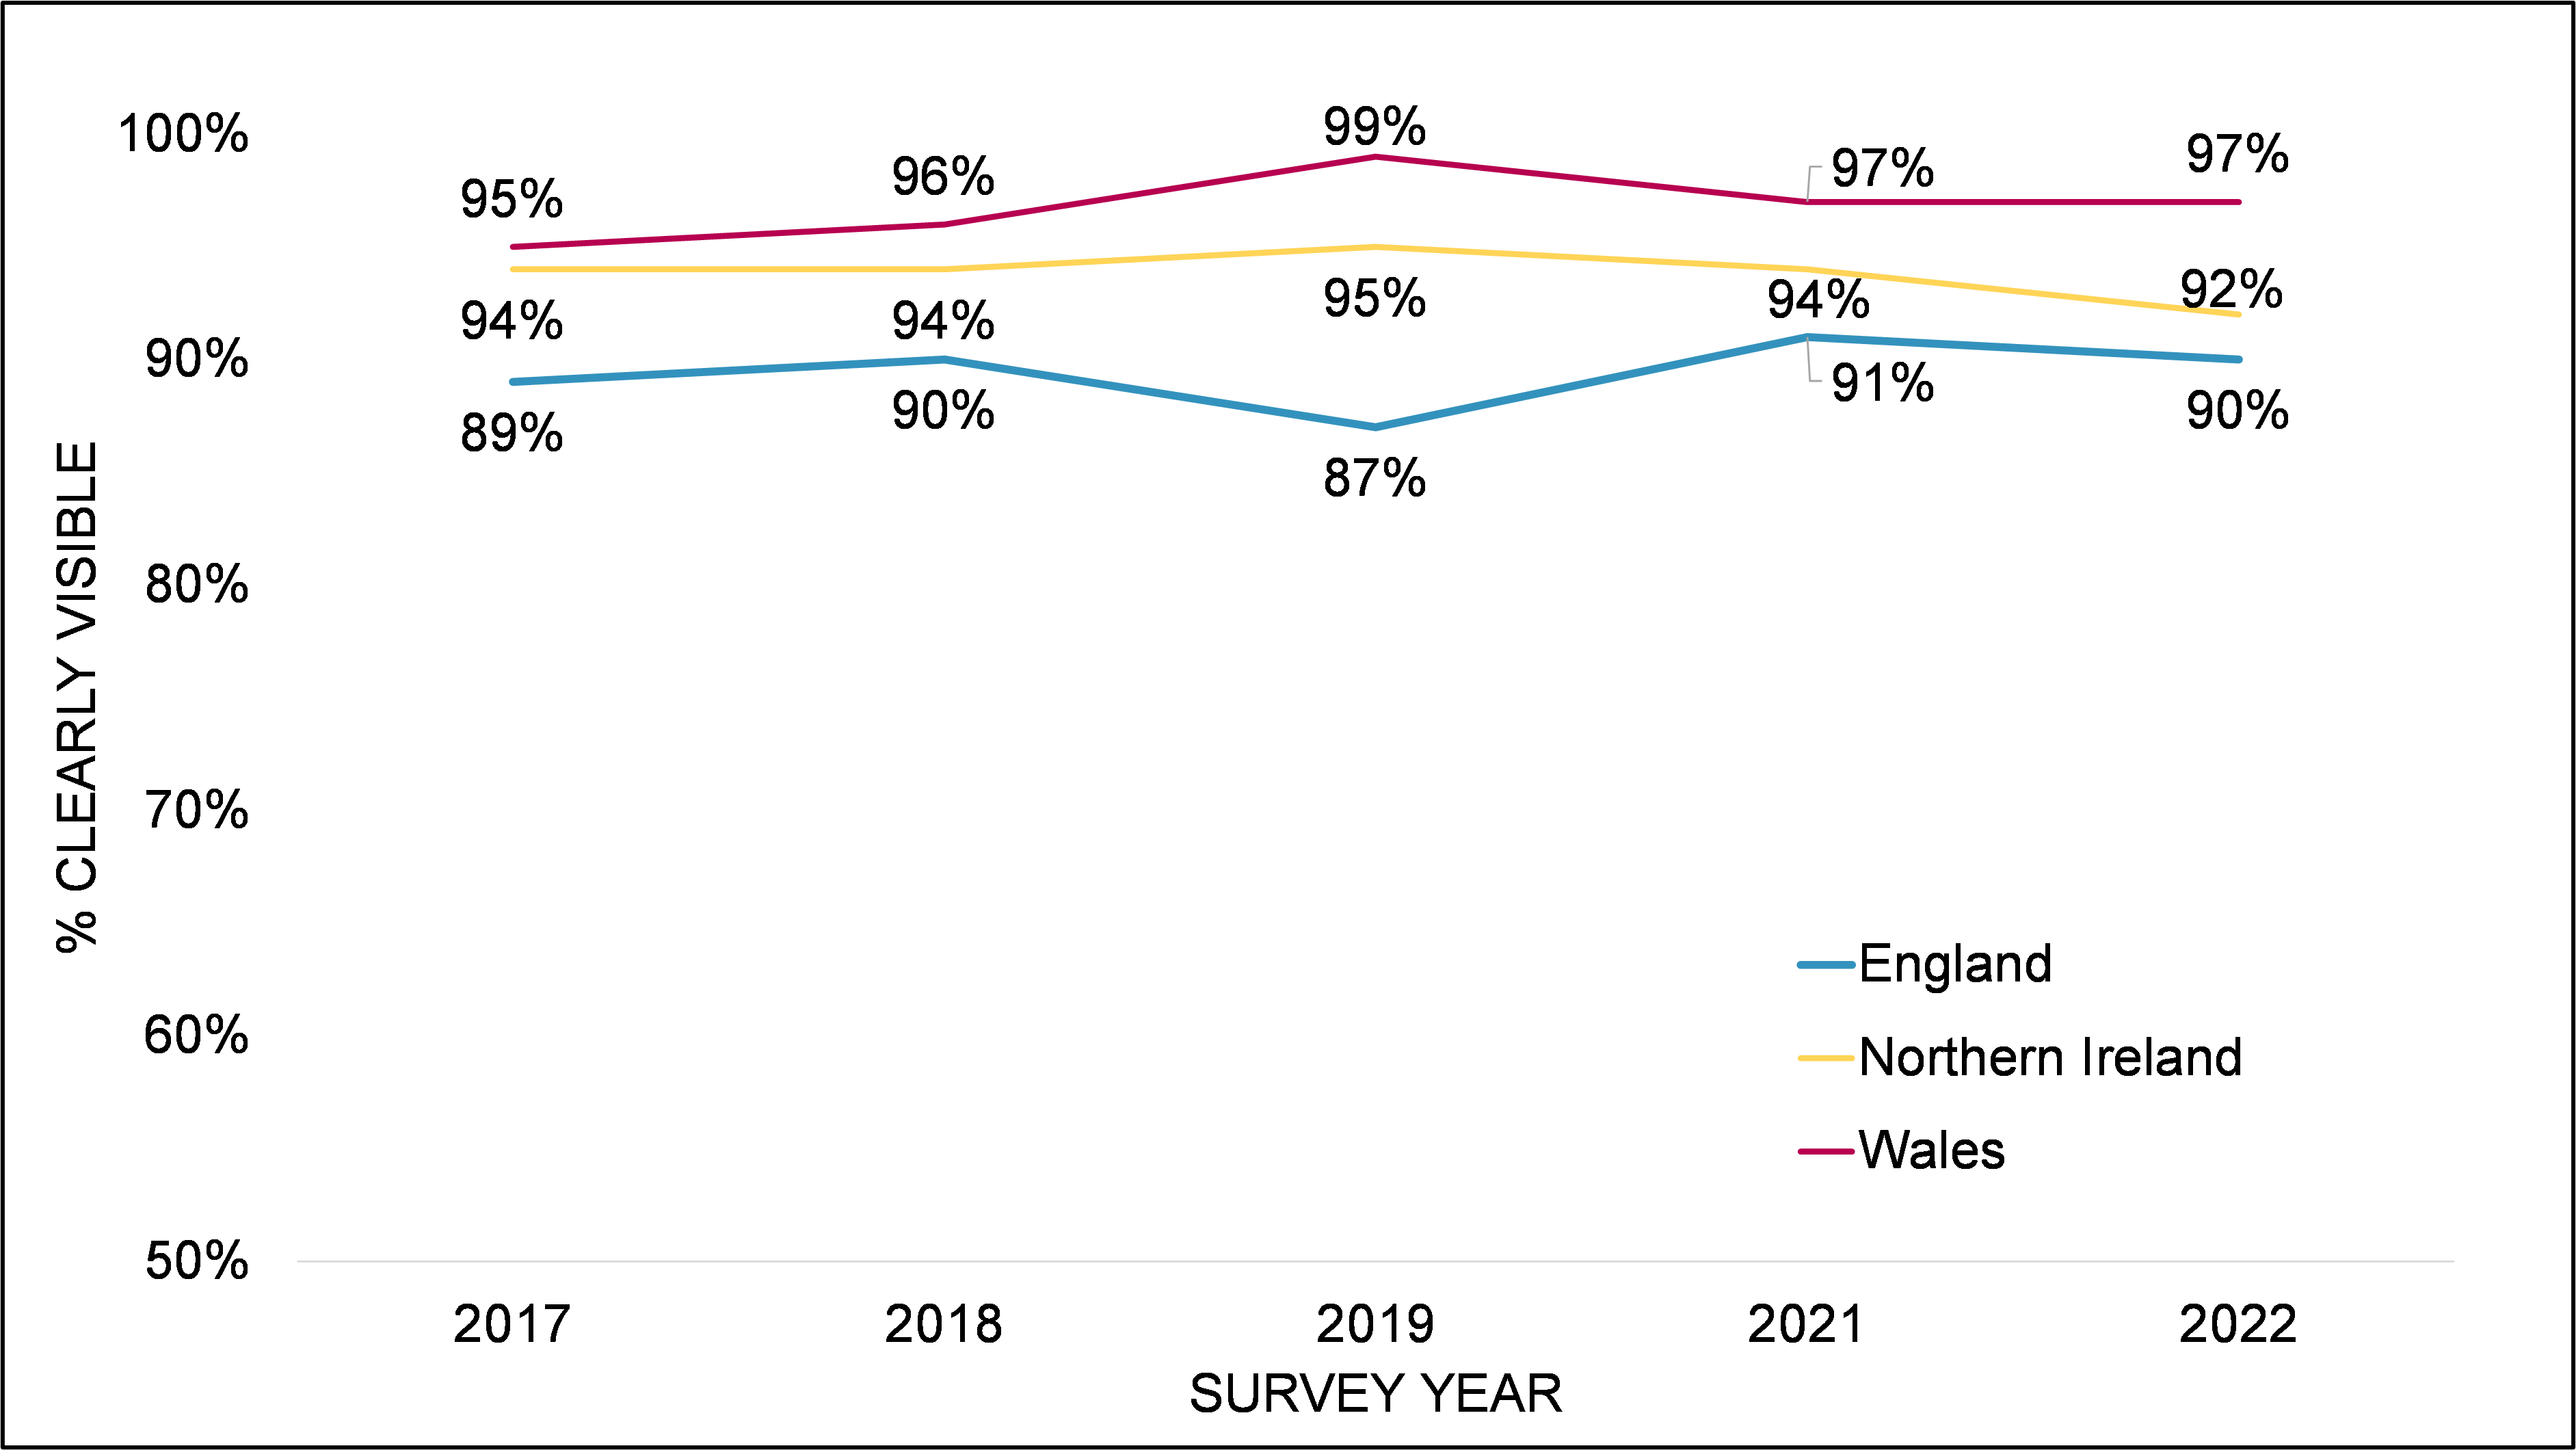
The proportion that said they displayed their FHRS sticker in a visible place was higher for businesses in Northern Ireland (98%) and Wales (97%) compared to England (87%), where it is not a legal requirement to display an FHRS sticker. (footnote 2) Furthermore, in line with 2021, most businesses that displayed an FHRS sticker said the sticker could be seen from outside their premises (England 90%; Northern Ireland 92%; Wales 97%).
Takeaways and sandwich shops in England (98%) and Northern Ireland (99%) claimed that they were more likely to display an FHRS sticker so that it was visible from outside their premises, while accommodation businesses and pubs, bars and nightclubs in Northern Ireland (80%) claimed that they were less likely.
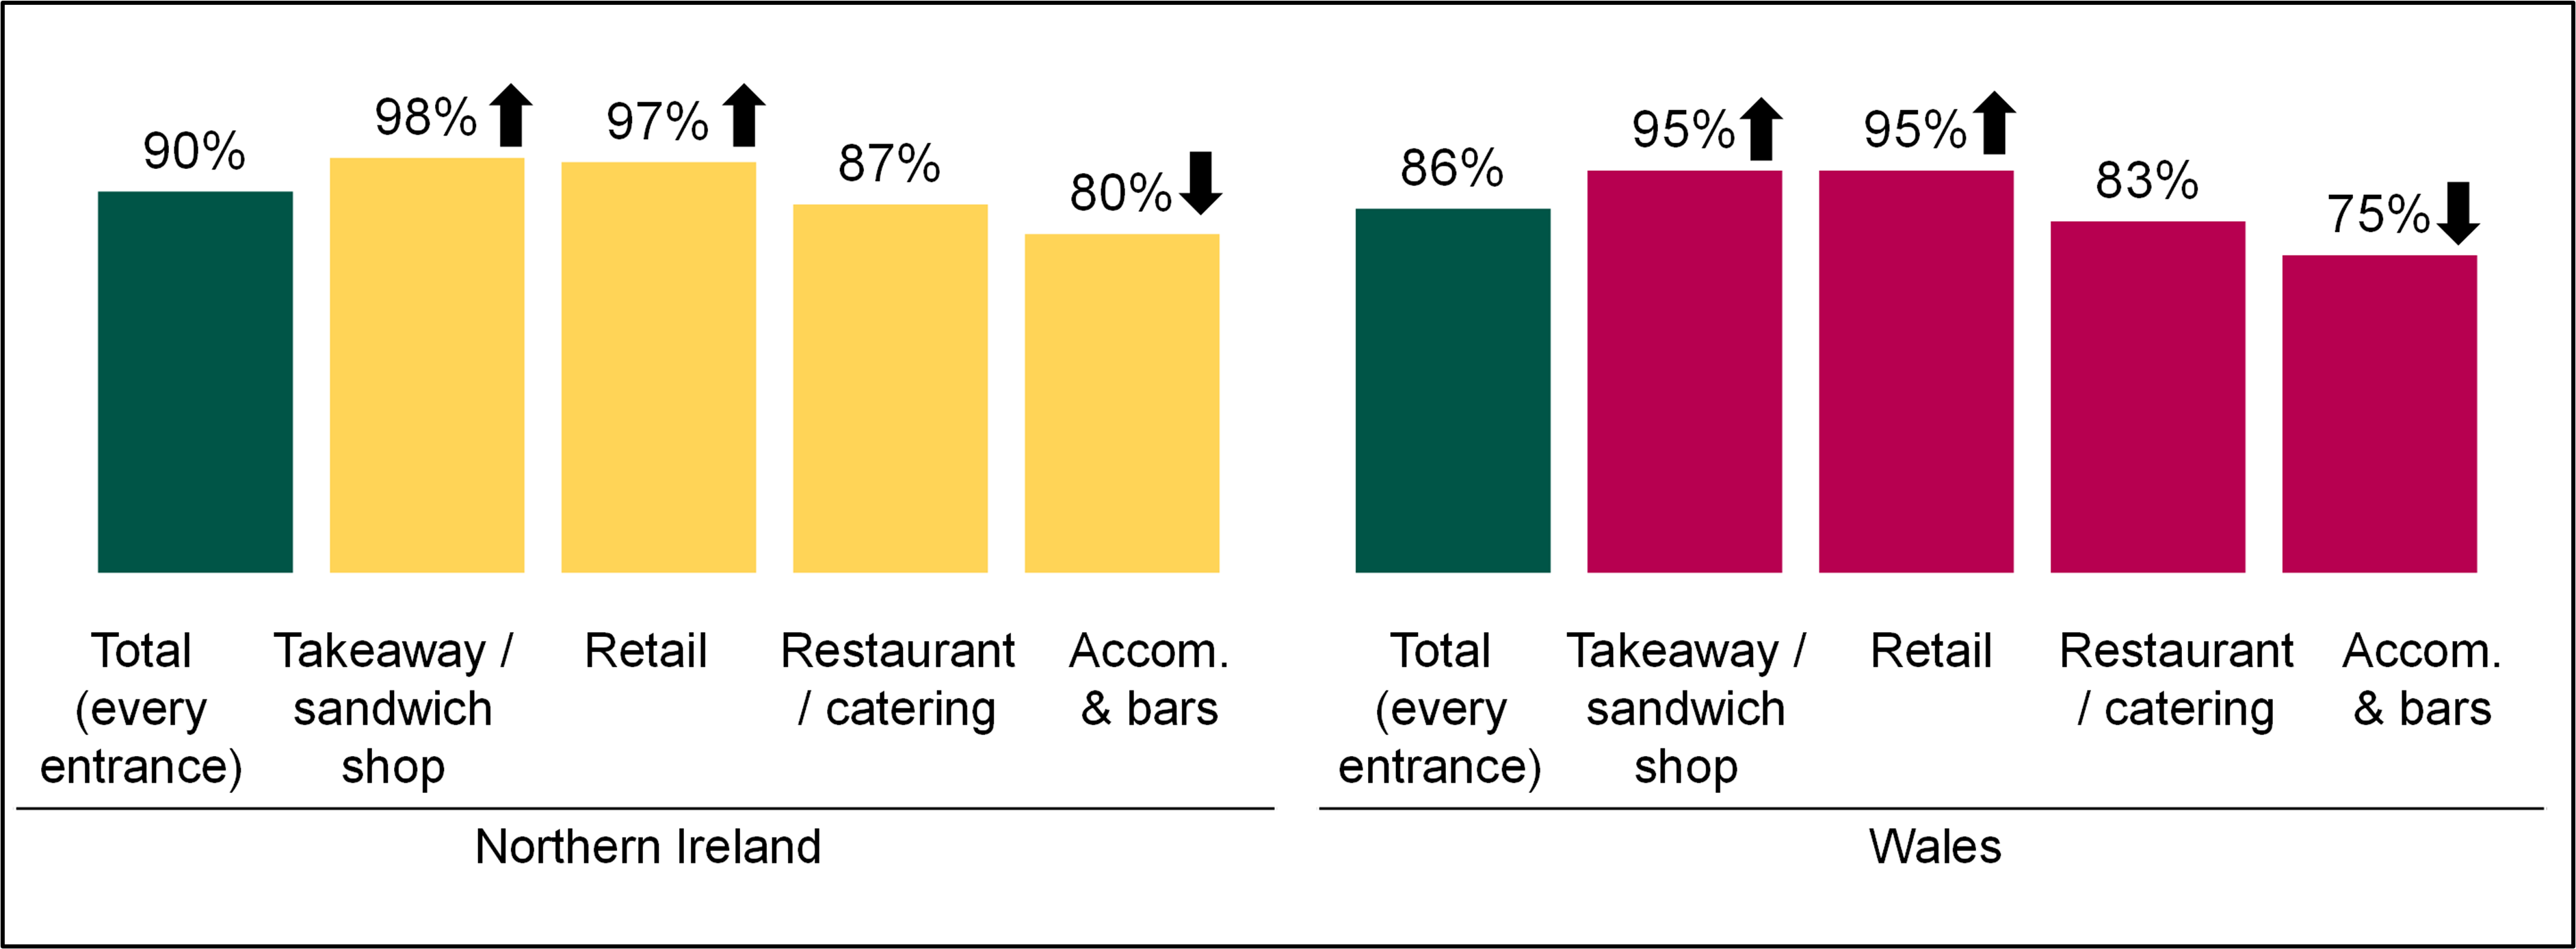
Most businesses in Northern Ireland (90%) and Wales (86%) reported having an FHRS sticker displayed at every entrance. In both countries, takeaways and sandwich shops (Northern Ireland 98%; Wales 95%) and retail businesses (Northern Ireland 97%; Wales 95%) reported that they were more likely to do so, while accommodation businesses and pubs, bars and nightclubs were less likely (Northern Ireland 80%; Wales 75%).
Businesses in England that did not display their FHRS sticker or who did not display it in a visible place for customers, gave a range of unprompted reasons why this was the case. The most common reasons given were there being nowhere suitable to show it outdoors (30%); ratings being displayed inside the premises (11%); and having never received a sticker (11%).
Around one in five businesses in England that did not display their FHRS sticker in a location where customers could see it from outside or did not display it at all claimed nothing would encourage them to do so (21%). Amongst the remainder, having a better rating was the most reported action that would encourage display (11%). This was closely followed by having an appropriate place to display the sticker (10%), while 9% did not think it was necessary to change their practices because they already displayed their sticker inside their premises.
A minority of businesses in England (29%), Northern Ireland (25%) and Wales (29%) reported displaying their food hygiene rating online. Amongst those that said they displayed their rating online, by far the most common platform used was business websites (England 63%; Northern Ireland 48%; Wales 50%), followed by delivery service websites and apps (England 22%; Northern Ireland 11%; Wales 18%).
Mandatory display
As found in previous years, amongst those aware of their FHRS rating, awareness that it is a legal requirement to display their food hygiene rating sticker at their premises in Northern Ireland and Wales was extremely high (Northern Ireland: 95%; Wales: 96%). Furthermore, there is strong support for compulsory display with around nine in ten businesses in Northern Ireland and Wales saying that the legal requirement to display the rating is a good thing (Northern Ireland: 91%; Wales: 89%). Positive attitudes towards mandatory display typically centred around the theme of openness and business promotion.
In both countries, there was self-reported evidence of attitudes towards mandatory display varying by sector. In Northern Ireland, takeaways and sandwich shops were more likely than average to consider mandatory display a good thing (97%). Meanwhile, in Wales, accommodation businesses and pubs, bars and nightclubs were less likely than average to consider mandatory display a good thing (84%).
Support for introducing mandatory display was also high in England with 82% of businesses reporting they believed it would be a good thing, broadly in line with 2021 (85%). Businesses in England with a food hygiene rating of 5 were more likely to have a positive view on the introduction of such a scheme (84%).
Amongst the food businesses in England that reported having positive views on the introduction of mandatory display, the most common reason was the view that it is important to be transparent about food hygiene (33%), followed by the view that it helps customers decide where’s safe to eat or buy food from (21%) and that it helps drive standards or helps businesses maintain their high standard (20%).
Across England, Northern Ireland and Wales, the majority of businesses felt that the display of food hygiene ratings should become mandatory for at least some online platforms (England: 92%; Northern Ireland: 93%; Wales: 93%). Furthermore, almost half were of the opinion that mandatory display should be introduced for all the online platforms they were probed with (footnote 3) (England: 49%; Northern Ireland: 49%; Wales 45%). This marks a significant increase since 2021, where only around one in five businesses felt that mandatory display should be introduced for all platforms (England: 17%; Northern Ireland: 19%; Wales: 19%).
Businesses that reported supporting mandatory online display typically also reported supporting display at physical premises and considered an extension of existing regulations to online platforms as a logical progression. Some commented that mandatory online display would benefit customers by providing them with information to inform purchasing decisions, while others said that it would be beneficial to their business as it would promote their high standards.
The minority of businesses that reported not being supportive of mandatory online display often had concerns about the cost and complexity of implementing this change to their websites, social media platforms and other online platform whilst the remainder took issue with mandatory online display because of their perceived reservations about the efficacy and fairness of the FHRS.
Awareness and ease of use of safeguards
In line with results in 2021, more than three quarters of businesses in each country recalled receiving their inspection letter (Northern Ireland 86%, Wales 82%, England 78%). Of those businesses that received a letter and had an FHRS rating of less than five, most could recall if their letter told them what improvements they would need to make in order to achieve the highest food hygiene rating of 5 at their premises (England 80%; Northern Ireland 89%; Wales 84%).
Businesses were asked if they knew they could appeal their rating, request a re-rating inspection, and have a ‘right to reply’ if they were unhappy with their FHRS rating. (footnote 4) In line with 2021, overall self-reported awareness was high, with more than three-quarters aware of each option in England (76% for appeal, 77% for ‘right to reply' and 79% for re-rating) and closer to nine in ten aware in Northern Ireland (87% for appeal, 87% for ‘right to reply’ and 87% for re-rating) and Wales (89% for appeal, 89% for ‘right to reply’ and 91% for re-rating).
Businesses in the retail sector in Northern Ireland were less likely than average to be aware they could request a re-rating (82% compared to the 87% average in Northern Ireland). In Wales, retail businesses were less likely than average to be aware they could request an appeal (83% compared to the 89% average in Wales) as well as the ‘right to reply’ (84% compared to the 89% average in Wales).
Few businesses reported that they had requested a ‘re-rating’ inspection or ‘right to reply’. Only around 1 in 20 in each country reported that they had applied for a re-rating (4% in England, 3% in Northern Ireland and 6% in Wales) and around 1 in 10 self-reported exercising their right to reply (9% in England, 10% in Northern Ireland and 10% in Wales) (footnote 5), similar proportions to those found in 2021.
Businesses who were not satisfied with their food hygiene rating and did not apply for a re-rating inspection were asked why not. Combined results across countries show the most common reasons were that the fees were too high (26%), the business had not yet made all of the changes suggested (20%) or a lack of time (18%).
There were fewer businesses in 2022 reporting they had other priorities than applying for re-rating (down to 1% from 16% in 2021 when the COVID-19 pandemic would still have been top of mind for many) or that they had not yet made all the changes suggested (down to 20% from 25% in 2021). In 2021, the impact of the pandemic was mentioned by one in five (19%) but in 2022, it was not mentioned at all.
Of businesses that did apply for a re-rating, more than half reported being awarded a higher rating. This is a significant increase from 2021 (56%, compared to 28%). The number of businesses reporting that they were still waiting for a requested re-inspection or to hear back from their local authority remained similar to previous years (36% in 2021 and 37% in 2022).
Businesses who were not satisfied with their food hygiene rating and did not exercise their ‘right to reply’ were also asked why. Combined results across countries show that they have or are making the changes required (27%) and other competing priorities (19%) were the primary reasons. The impact of COVID-19 was not directly mentioned in 2022, whereas it was given as a reason by 12% of businesses in 2021.
Impacts of the scheme
Most businesses reported being incentivised to maintain or improve their food hygiene rating and consider that the display of their rating has a range of positive impacts on customer perceptions of the business. Nearly all food businesses agreed that they work hard to maintain or improve their food hygiene rating (England 99%; Northern Ireland 97%; Wales 98%) and that displaying a food hygiene rating proves to consumers that the business takes food hygiene seriously (England 97%; Northern Ireland 96%; Wales 94%).
Almost as many businesses stated that they were proud of their food hygiene rating (England 94%; Northern Ireland 94%; Wales 89%). Across all countries, those with a rating of 5 were more likely to be proud (England 98%; Northern Ireland 97%; Wales 96%). There were also differences by outlet type within both Northern Ireland and Wales. In Northern Ireland, restaurants and catering businesses were more likely to be proud of their rating (97%), while in Wales accommodation and pubs, bars and nightclubs were less likely to be proud (83%).
As in 2021, there was widespread agreement that good food hygiene ratings were attractive to customers (England: 92%; Northern Ireland: 91%; Wales: 90%) and around two-thirds agreed that displaying a food hygiene rating resulted in more customers (England: 67%; Northern Ireland: 65%; Wales: 65%).
Across each nation, less than one in five food businesses said they used their food hygiene rating to promote their business, for example through display in advertising or on menus (England: 14%; Northern Ireland: 11%; Wales: 9%). In England, takeaways and sandwich shops stood out as more likely to use food hygiene ratings in promotional materials (27%), while retail businesses were less likely to (4%).
The mix of channels used to promote food hygiene ratings differed quite widely by country. In England and Northern Ireland, it was most common to use their food hygiene rating to promote their business through take-away menus. While in Wales, free advertising and table menus were the more common channels.
Most food businesses that had received a food hygiene rating of 4 or less reported making changes to try to improve their rating across all three countries (England: 83%; Northern Ireland: 85%; Wales: 82%). However, the most common actions differed by country. In England, the most common action was undertaking repairs or improvements (25%), closely followed by cleaning the workplace or premises (24%). Whereas in Northern Ireland and Wales, the most common action was improving documentation or record keeping (Northern Ireland 38%; Wales 30%).
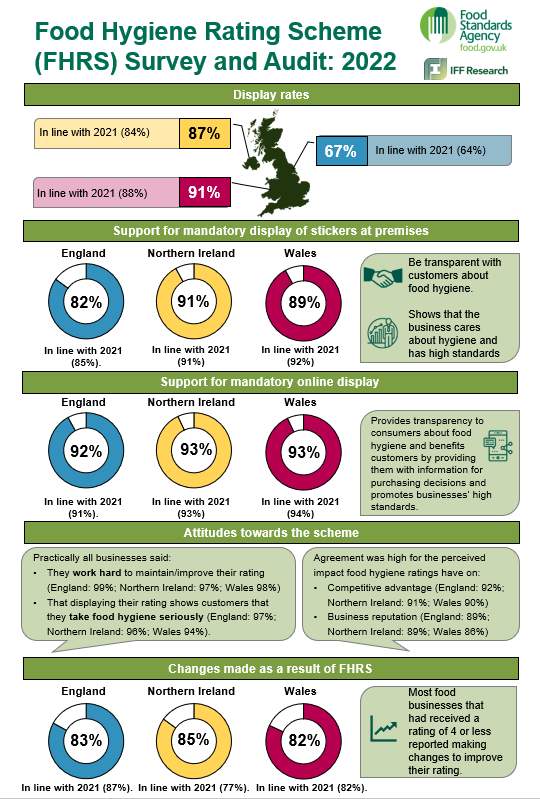
Infographic for the Food Hygiene Rating Scheme (FHRS) Survey and Audit: 2022. Display rates. England. 67%. In line with 2021 (64%). Northern Ireland. 87%. In line with 2021 (84%). Wales. 91%. In line with 2021 (88%). Support for mandatory display of stickers at premises. England. 82%. In line with 2021 (85%). Northern Ireland. 91%. In line with 2021 (91%). Wales. 89%. In line with 2021 (92%). Be transparent with customers about food hygiene. Shows that the business cares about hygiene and has high standards Support for mandatory online display. England. 92%. In line with 2021 (91%). Northern Ireland. 93%. In line with 2021 (93%). Wales. 93%. In line with 2021 (94%). Provides transparency to consumers about food hygiene and benefits customers by providing them with information for purchasing decisions and promotes businesses’ high standards. Attitudes towards the scheme. Practically all businesses said: They work hard to maintain/improve their rating (England: 99%; Northern Ireland: 97%; Wales 98%) That displaying their rating shows customers that they take food hygiene seriously (England: 97%; Northern Ireland: 96%; Wales 94%). Agreement was high for the perceived impact food hygiene ratings have on: Competitive advantage (England: 92%; Northern Ireland: 91%; Wales 90%) Business reputation (England: 89%; Northern Ireland: 89%; Wales 86%). Changes made as a result of FHRS. England. 83%. In line with 2021 (87%). Northern Ireland. 85% In line with 2021 (77%). Wales. 82%. In line with 2021 (82%). Most food businesses that had received a rating of 4 or less reported making changes to improve their rating.
-
In the 2021 report, the main figure of display in Wales (inside and outside) of 88%, was comprised of 85% of establishments displaying the sticker with the dragon logo and 3% without the dragon logo. In the 2022 report, no distinction is made between the dragon and non-dragon style FHRS stickers on display. Given the Welsh statutory FHRS came into effect in 2013, the number of FHRS dragon stickers should be negligible and at a similar level to 2021 (3%).
-
Self-reported rates of display were higher than rates of display observed during audits.
-
Online platforms businesses were probed with were: restaurants and takeaways' own online ordering facilities; takeaway ordering aggregators or apps; hotels' and guest houses' own websites where they serve or supply food; restaurants and takeaways' own websites; restaurant table booking sites; supermarket websites; accommodation booking websites; and social media.
-
If businesses make the improvements to hygiene standards that the food safety officer raised at the last planned inspection, businesses can request a re-visit before the next planned inspection. Right to reply allows businesses to tell customers how their business has improved its hygiene standards or if there were unusual circumstances at the time of inspection. The response is published online, alongside the rating, by the local authority.
-
FSA data indicates that the re-rating inspection request is more commonly used than the right to reply safeguard.
Background to the FHRS
Under the scheme, places where food is supplied, sold or consumed are given a rating ranging from 0 to 5, with 5 indicating ‘very good’ food hygiene and 0 indicating ‘urgent improvement necessary’. The ratings are determined by three elements: hygienic food handling; physical condition of the premises and facilities; and food safety management. Figure 2.1 provides examples of the FHRS stickers currently in use in England and Northern Ireland (left) and Wales (right).
Figure 2.1 Examples of FHRS stickers in England and Northern Ireland (left) and Wales (right)
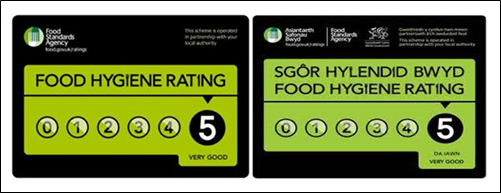
In Northern Ireland (since 2016) and Wales (since 2013), businesses are legally required to display their ratings in a prominent place, like the front door, entrance or window of the business where it can be easily read by customers. They are also required to provide information on their rating verbally if requested in person or over the phone. Businesses in England are not legally required to display their rating at their premises but are encouraged to do so. Across England, Northern Ireland and Wales, food hygiene ratings are available to search on the FSA's rating website, and the FSA provides guidance and a free toolkit to help businesses get the most from their ratings.
In Wales, the scheme differs slightly in that it also applies to businesses that sell food to other businesses, including food manufacturers and wholesalers. Furthermore, establishments that supply takeaway food must include a bilingual statement on menu leaflets and flyers which tells customers how to find details of their food hygiene rating on the FSA website, as well as reminding consumers that they have a legal right to ask the food business for their food hygiene rating when they order.
Research objectives
The FSA has conducted research into the Display of Food Hygiene Ratings in England, Northern Ireland and Wales since 2011. As with the previous waves of the research, the objectives were threefold:
- provide a representative estimate of the display of food hygiene ratings by food businesses
- explore the reasons and drivers for display and non-display
- explore business awareness and attitudes towards the scheme
Methodology
To meet the research objectives a two-pronged approach was adopted, consisting of:
- A covert audit of 1,525 food businesses in England, Northern Ireland and Wales (501, 527 and 497 respectively), conducted by Mystery Shoppers. (footnote 1)
- A telephone survey of 1,500 food businesses in England, Northern Ireland and Wales, conducted by IFF Research (500 per nation).
Sampling
For both the audit and telephone survey of food businesses, a sample was drawn from the FSA’s FHRS database. (footnote 2) The sample included food businesses that sell or serve food to the public and had received a food hygiene rating following an inspection by a food safety officer. (footnote 3)
Food businesses were excluded from the sample if they were a new business and had not yet been inspected and issued with a food hygiene rating. Food businesses were also excluded if not publicly accessible, a mobile food business or a food business in a residential property. (footnote 4)
The starting sample for the audit and telephone survey of food businesses included the following outlet types:
- accommodation (for example hotels) & pubs, bars, and nightclubs
- restaurants, cafes, and other catering businesses (for example event caterers and home caterers)
- retail (for example supermarkets, butchers, and bakeries)
- takeaways and sandwich shops
The sample frame for the 2022 wave of the FHRS Audit differed slightly from previous waves as Bed & Breakfasts were excluded from the sample of accommodation businesses due to the difficulty in gaining public access to these types of premises and home caterers were included in the sample of catering businesses for the survey. Although the 2022 sample frame differs slightly from the 2021 sample frame, there are no concerns about the comparability of data as Bed & Breakfasts and home caterers only make up a small proportion of their respective outlet type groupings.
The sample was stratified by country, outlet type, and food hygiene rating to reflect the profile of the underlying population of food businesses. Businesses in Northern Ireland and Wales, takeaways and sandwich shops and those with a food hygiene rating of 3 or less were oversampled to ensure that robust results could be produced for each sub-group.
More information on sampling for the 2022 wave of the FHRS Audit and Survey can be found in the accompanying Technical Report.
Audit of food businesses
Following a short period of pilot fieldwork, mainstage audit fieldwork took place between 25th October and 23rd November 2022. In total, 1,525 audits were completed. The final profile of the audits achieved by country, outlet type and food hygiene rating are detailed in Tables 2.1 to 2.3.
Table 2.1: Profile of audited food businesses - Country
| Country | Completed audits |
|---|---|
| England | 501 |
| Northern Ireland | 527 |
| Wales | 497 |
Table 2.2 Profile of audited food businesses - Outlet type
| Outlet type | Completed audits |
|---|---|
| Accommodation and pubs, bars and nightclubs | 267 |
| Restaurants, cafes and catering | 608 |
| Retail | 417 |
| Takeaways and sandwich shops | 233 |
Table 2.3 Profile of audited food businesses: Food Hygiene Rating
| Food Hygiene Rating | Completed audits |
|---|---|
| 0-2 | 48 |
| 3 | 114 |
| 4 | 265 |
| 5 | 1,098 |
Audit results were weighted so that findings were representative of the underlying population of food businesses in terms of outlet type and food hygiene rating within England, Northern Ireland, and Wales.
More information on the survey methodology, including pilot fieldwork and weighting, can be found in the accompanying Technical Report.
Telephone survey
Following a short period of pilot fieldwork, mainstage quantitative fieldwork took place between 1st November and 9th December 2022. In total, 1,500 interviews were completed. The final profile of the interviews achieved by country, outlet type, food hygiene rating and size is presented in Tables 2.4 to 2.7.
Table 2.4 Profile of mainstage interviews with food businesses - Country
| Country | Completed interviews |
|---|---|
| England | 500 |
| Northern Ireland | 500 |
| Wales | 500 |
Table 2.5 Profile of mainstage interviews with food businesses - Outlet type
| Outlet type | Completed interviews |
|---|---|
| Accommodation and pub, bar, nightclub | 314 |
| Restaurants, cafes and catering | 591 |
| Retail | 424 |
| Takeaways and sandwich shop | 171 |
Table 2.6 Profile of mainstage interviews with food businesses - Food Hygiene Rating
| Food Hygiene Rating | Completed interviews |
|---|---|
| 0-2 | 49 |
| 3 | 103 |
| 4 | 256 |
| 5 | 1,092 |
Table 2.7 Profile of mainstage interview with businesses - Number of employees
| Number of employees | Completed interviews |
|---|---|
| 1 | 73 |
| 2 to 9 | 810 |
| 10 to 24 | 415 |
| 25 to 49 | 131 |
| 50 to 99 | 42 |
| 100 to 199 | 19 |
| 200 to 249 | 2 |
| 250+ | 7 |
| Don't know | 1 |
In total, 484 food businesses that participated in the telephone survey were also audited.
Survey results from mainstage fieldwork were weighted so that findings were representative of the underlying population of food businesses in terms of outlet type and food hygiene rating within England, Northern Ireland and Wales.
More information on the survey methodology, including pilot fieldwork and weighting, can be found in the accompanying Technical Report.
Reporting notes
Throughout the report the terms ‘business’, ‘establishment’, ‘premises and ‘outlet’ are used interchangeably to refer to food business sites.
In charts, upward arrows are used to denote a significantly higher figure – compared to the average or 2021 - while downward arrows are used to show a significantly lower figure. In tables statistically significant differences are denoted by asterisks (a single asterisk is used to denote a significant increase and two asterisks are used to denote a significant decrease).
All differences between sub-groups and previous waves of the research stated in this report are statistically significant at the 95% confidence level unless otherwise stated.
-
This encompassed both an audit of the businesses’ physical premises and their website or Facebook Business Page, where they had one.
-
The FSA holds Food Hygiene Ratings and a summary of the standards found at the last time of inspection on behalf of local authorities in England, Northern Ireland, Wales and Scotland. This data can be found at: https:// ratings.food.gov.uk.
-
Kitchens without physical premises were not included in the audit Food businesses not accessible to the public (e.g. staff canteens) were also not intended to be audited, although in 2022 we conducted two audits of staff canteens.
-
The FHRS applies to food manufacturers and wholesalers in Wales. These businesses were excluded from the sample because their premises are typically not publicly accessible, and so it would not be possible to audit them.
Rates of display
As illustrated in Figure 3.1, rates of display in England, and Northern Ireland and Wales remained broadly consistent with the findings in 2021. The rate of display in England remained significantly lower than in Northern Ireland and Wales, likely a direct result of the lack of legal obligation to display a rating sticker at business premises in England. (footnote 1)
Figure 3.1 Proportion of audited businesses in England, Northern Ireland and Wales that are displaying food hygiene ratings either inside or in a location visible from outside the premises (2011 to 2022). (footnote 2)
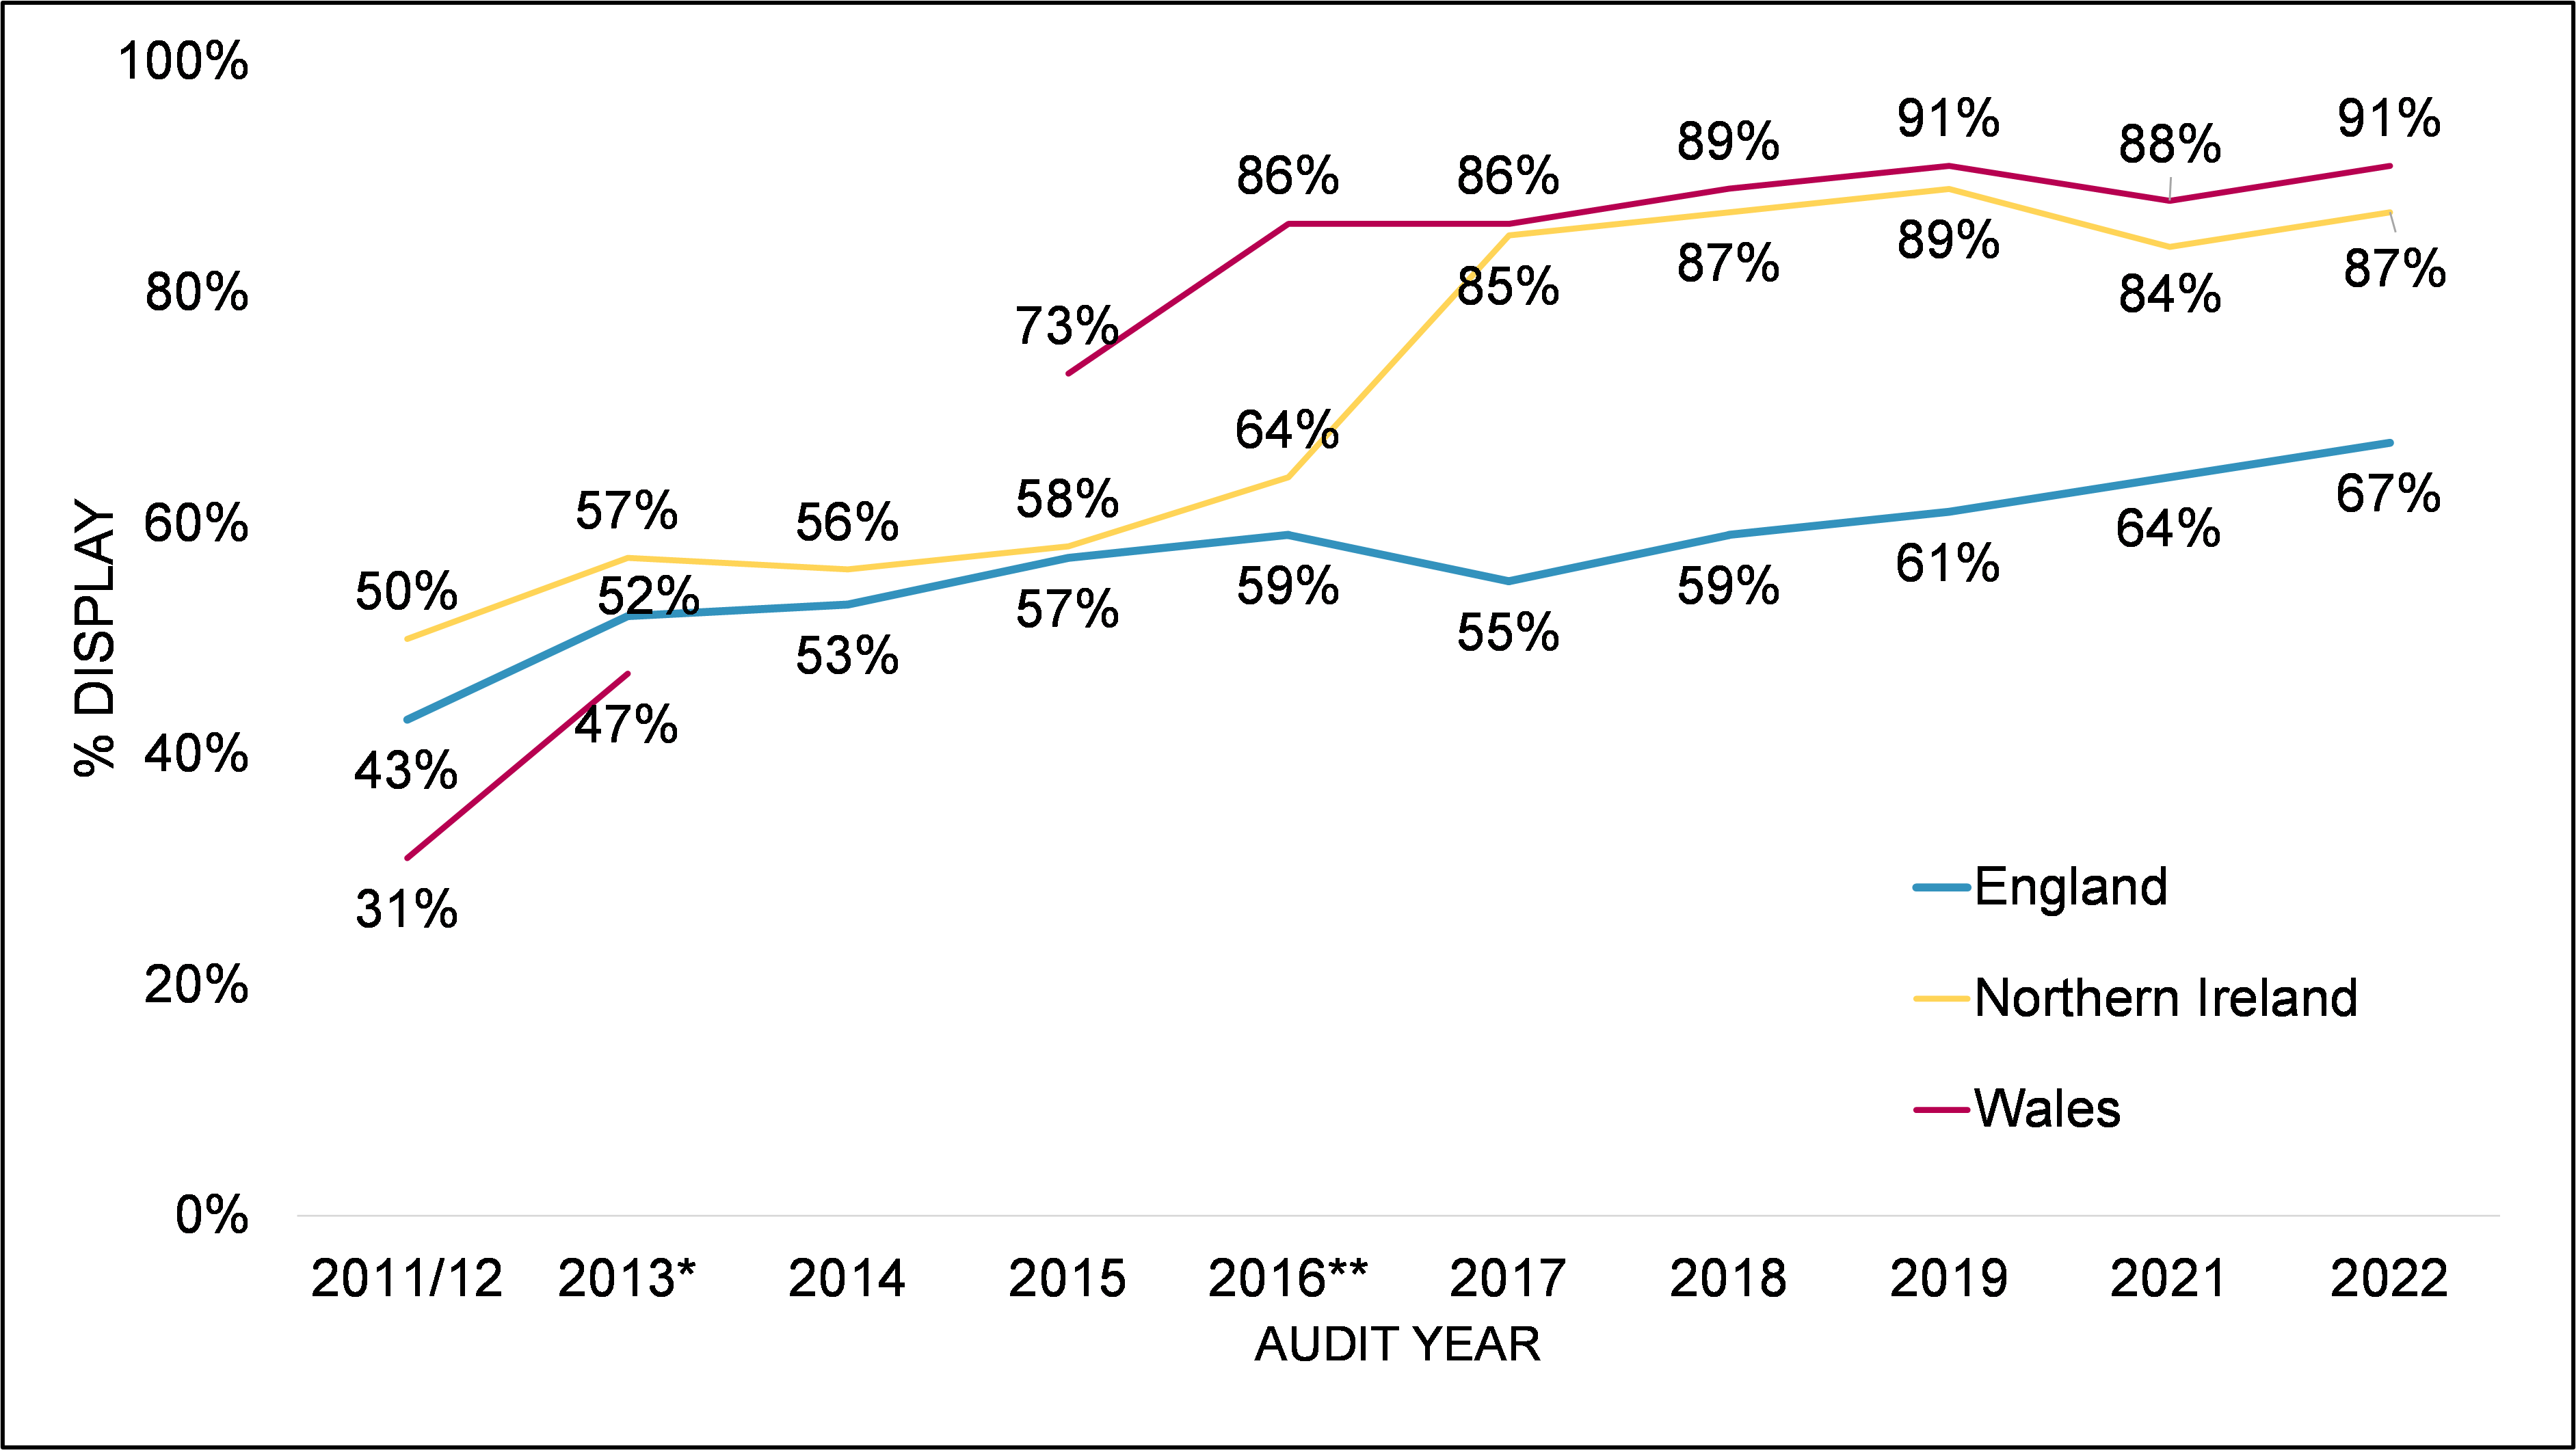
Base: All audited businesses 2022/2021/2019/2018/2017/2016/2015/2014/2013/2012 (England 501/502/479/500/500/412/429/490/462/452; NI 527/515/480/500/500/450/445/431/429/418; Wales 497/505/498/500/500/417/430/NA/455/447). Figures for Wales for 2013, 2014, 2015, 2016, 2017, 2018 and 2019 are based on display of the statutory sticker only. ↑ / ↓ denotes a significant difference compared to 2021.
In England, 67% of businesses displayed an FHRS sticker (either inside or in a location visible from outside the premises). Although not significantly higher than in 2021, this represents a continuation of the steady upwards trend in rates of display by English businesses since 2017, when 55% of businesses displayed a sticker. Takeaway and sandwich shops were more likely than average to have a sticker on display (79%), while accommodation businesses, pubs, bars, and nightclubs were less likely (57%).
In Northern Ireland, 87% of businesses displayed an FHRS sticker. The overall picture in Northern Ireland has remained broadly consistent over time, with the 2022 figure in line with the percentage displaying the sticker in 2018, the second year after displaying the rating became mandatory in Northern Ireland. As in England, takeaway and sandwich shops were more likely than average to display a sticker (95%), while accommodation businesses, pubs, bars, and nightclubs were less likely (67%).
In Wales, 91% of businesses displayed an FHRS sticker, increasing from 88% in 2021 (footnote 3) , but not significantly. (footnote 4)This increase in display at an overall level was driven by an increase in display amongst restaurants and catering businesses (from 90% to 96%) and accommodation, pubs, bars and nightclubs (from 83% to 93%) between 2021 and 2022. Focusing on results from the 2022 audit, restaurants and catering businesses were more likely than average to display their sticker (96%), while retail businesses were less likely (81%).
In England, food businesses with a rating of 5 were more likely to display their FHRS sticker (77%). As presented in Figure 3.2, the proportion of businesses displaying a sticker inside or in a location visible from outside decreased as ratings became lower, dropping to 43% of those with a rating of 4 and 39% of those with a rating of 3. There was less difference in display rates between different food hygiene ratings in Northern Ireland and Wales, likely due to the statutory requirement to display.
Figure 3.2 Display of FHRS sticker inside or in a location visible from outside, by food hygiene rating (3-5)
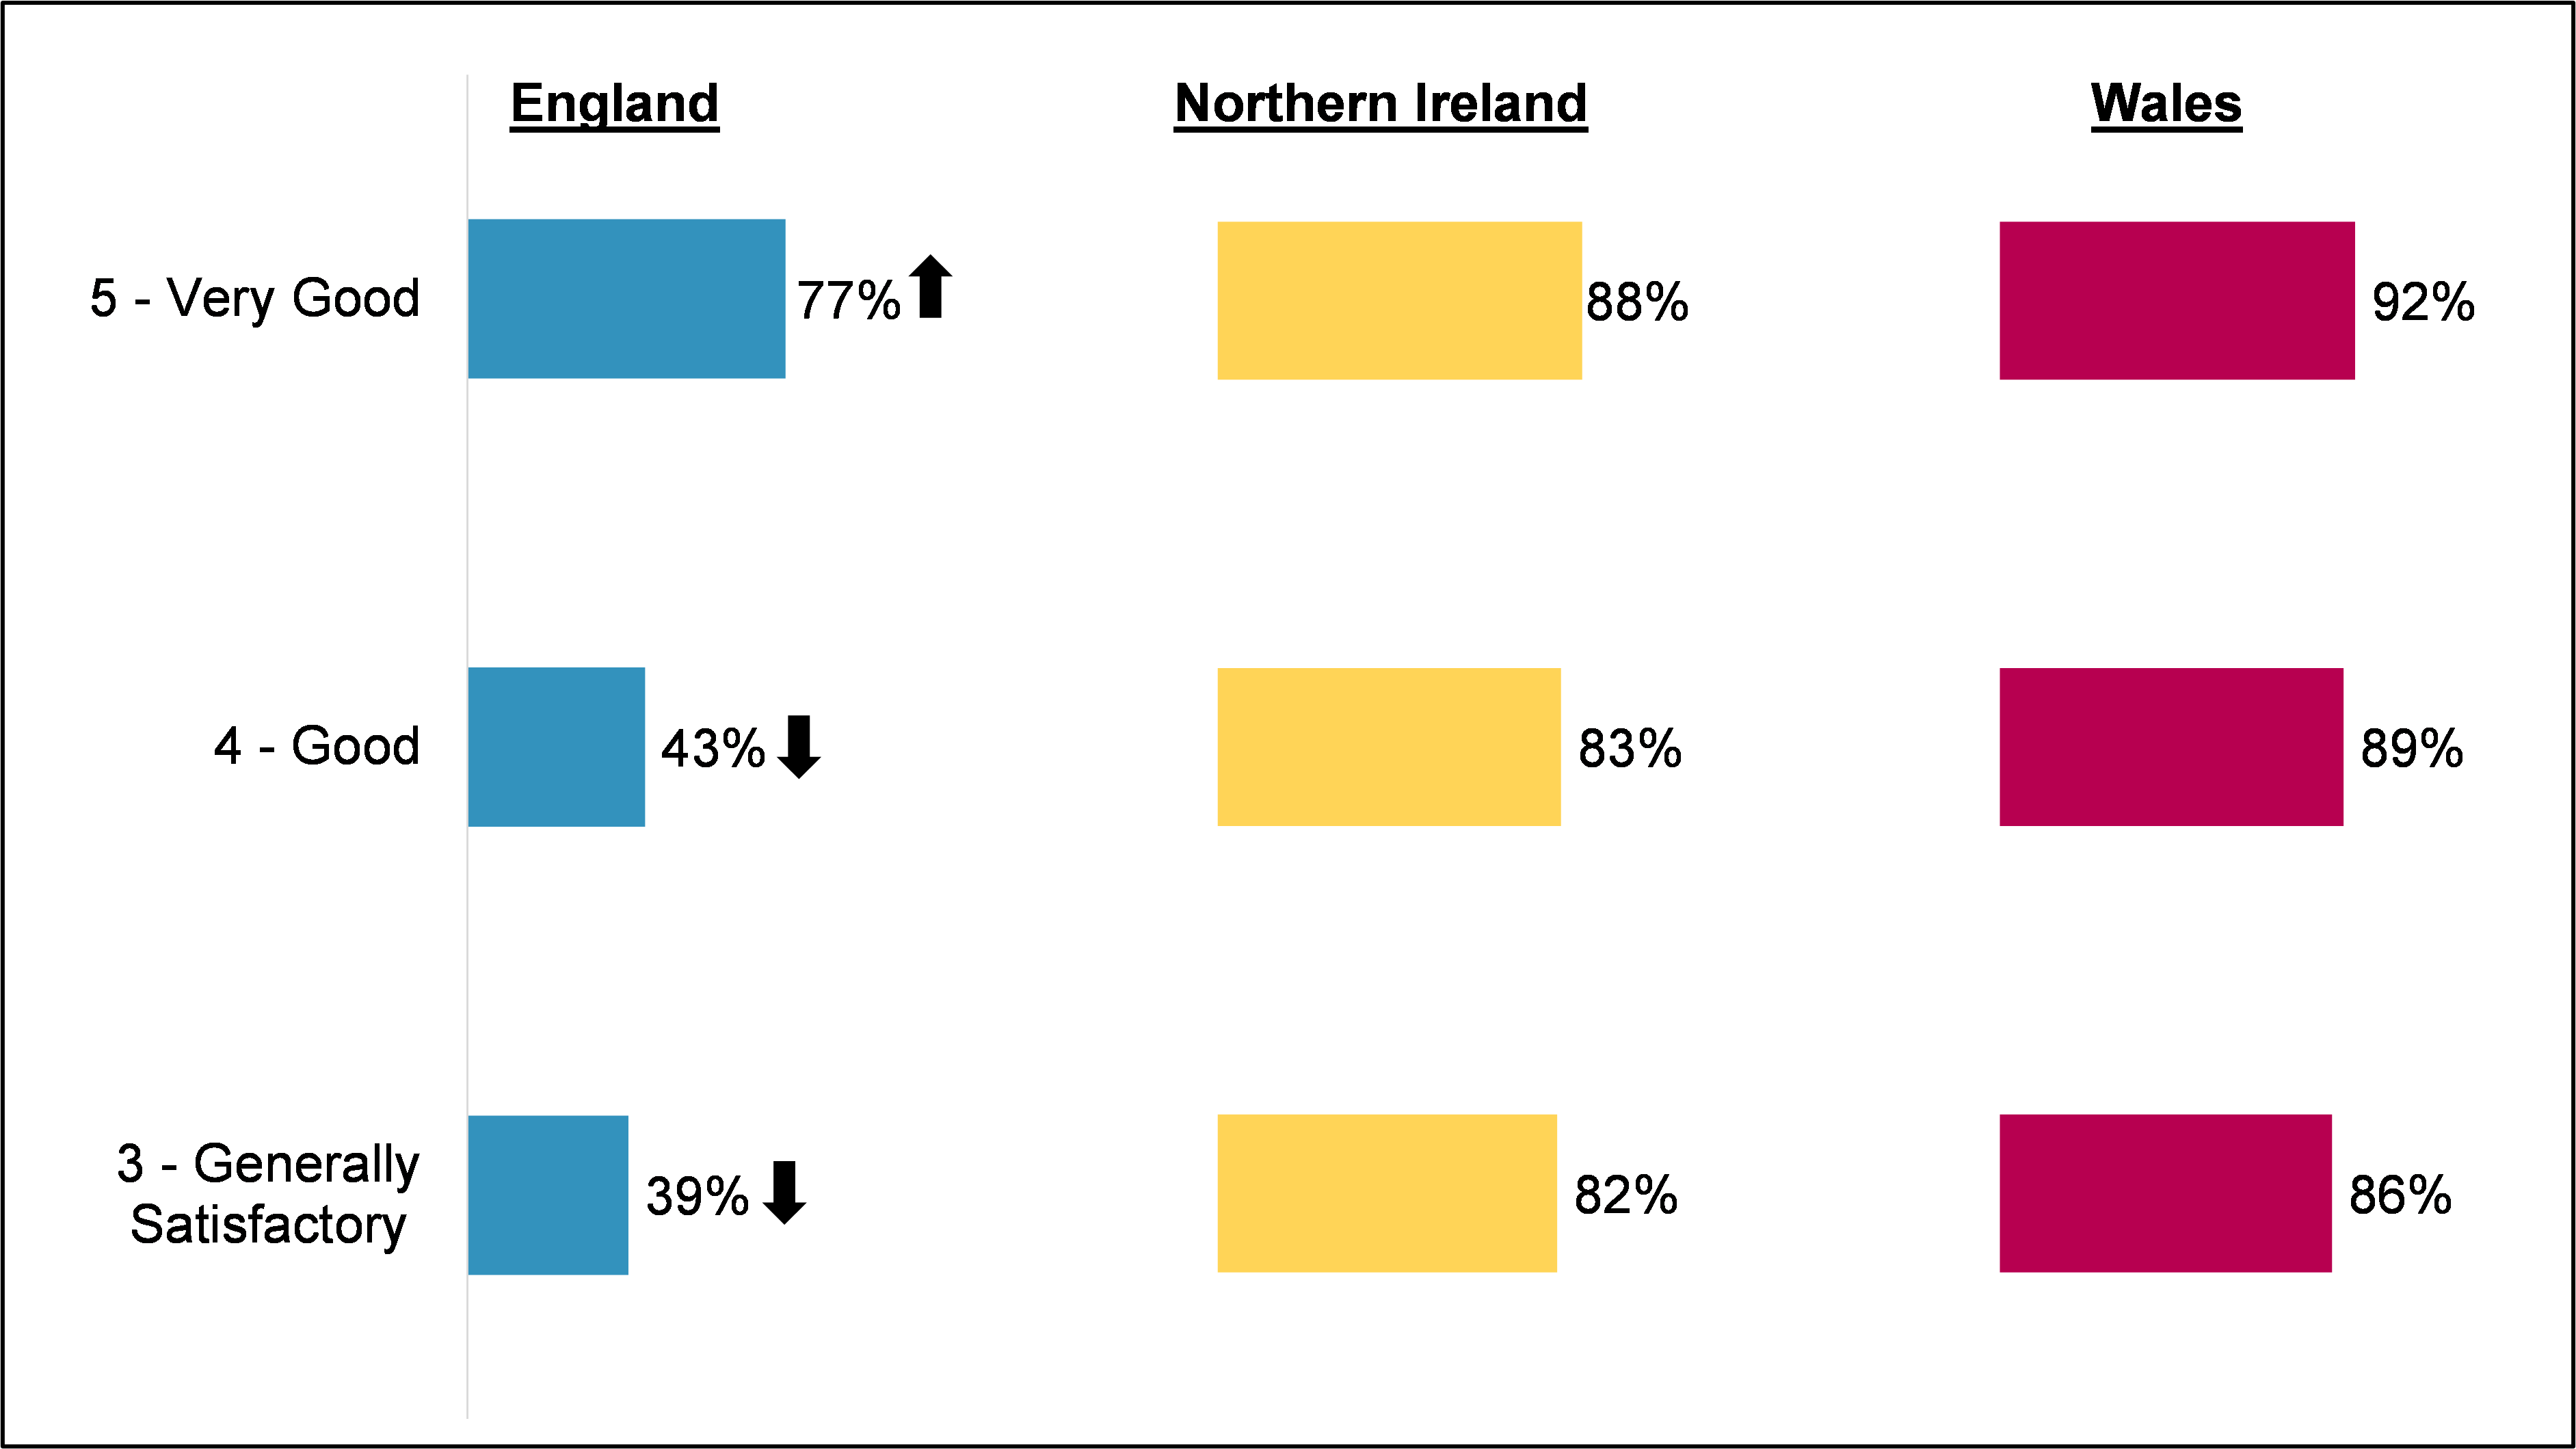
Did you see an FHRS sticker at this outlet? – Yes. Base: All audited food businesses, food hygiene rating 5/4/3 (England 339/96/44; NI 427/72/22; Wales 332/97/48) ↑ /↓ Denotes a significant increase from 2021.
Focusing on audited food businesses with a food hygiene rating of 2 or below, it was much more common for businesses in Northern Ireland and Wales to have an FHRS sticker on display than their counterparts in England.
- In England, 6 out of 22 businesses with a rating of 2 or below had a sticker on display.
- In Northern Ireland, 4 out of 6 businesses with a rating of 2 or below had a sticker on display. (footnote 5)
- In Wales, 17 out of 20 businesses with a rating of 2 or below had a sticker on display.
Whether rating was clearly visible
The audits captured whether ratings were visible from outside business premises and whether they were clearly visible to customers (either inside or outside) (footnote 6). As in previous years, the vast majority of FHRS stickers observed were clearly visible.
In England, 63% of businesses had a sticker displayed outside. As presented in Table 3.2, this figure has steadily increased over the last few years. While not significantly higher when compared to 2021, the proportion displaying a sticker outside was significantly higher in 2022 than in 2019 (63% vs 55%). Fewer than one in twenty businesses in England (4%) displayed a sticker inside their premises but not outside. Irrespective of the location of display, two thirds (66%) of businesses displayed a sticker in a location deemed ‘clearly visible’ by auditors.
Table 3.1 Display rates in England
| Type of display | 2022 (n=501) | 2021 (n=502) | 2019 (n=479) |
|---|---|---|---|
| Displayed outside | 63% | 59% | 55% |
| Displayed inside | 4% | 5% | 6% |
| Not displayed | 33% | 36% | 39% |
| Summary: Displayed inside or visible outside | 67% | 64% | 61% |
| Deemed ‘clearly visible’ | 66% | 63% | 59% |
Did you see an FHRS sticker at this outlet? – Yes. Base: All audited food businesses 2022/2021/2019 (England 501/502/479) – * Denotes a significant increase since 2021. ** Denotes a significant decrease since 2021.
As illustrated by Figure 3.3, those with a rating of 5 in England were more likely than average to display their sticker in a location visible from outside the premises (73%), while those with a rating of 4 (39%) or 3 (37%) were less likely than average.
Figure 3.3 Outside display split by FHRS rating
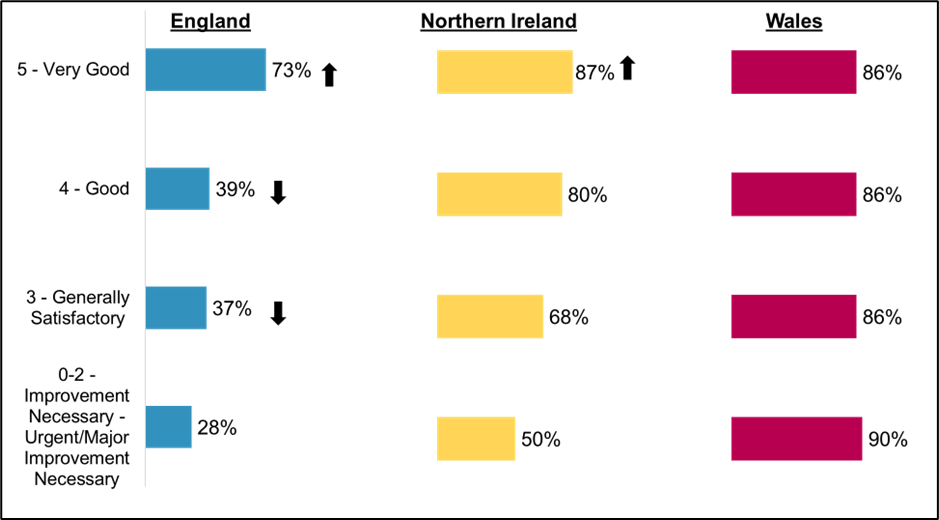
Did you see an FHRS sticker at this outlet? (Outside/Inside display) – Outside. Base: All audited food businesses, food hygiene rating 5/4/3 (England 339/96/44/22; NI 427/72/22/6; Wales 332/97/48/20). ↑ /↓ Denotes a significant increase/decrease compared to the average. Although figures for businesses with a rating of 0-2 the results here should be taken indicatively because the base sizes are low.
As presented in Table 3.2, amongst the minority of businesses in England that displayed a sticker inside their premises but not outside, most of these businesses had a rating of 5.
Table 3.2 Inside only display split by FHRS rating
| FHRS rating | England | Northern Ireland | Wales |
|---|---|---|---|
| 5 – Very good | 11 | 2 | 7 |
| 4 – Good | 4 | 2 | 3 |
| 3 – Generally satisfactory | 1 | 3 | 0 |
| 0-2 | 0 | 0 | 0 |
| Total | 16 | 7 | 10 |
Was the food hygiene rating sticker visible from the outside of the premises? – No. Base: Audited food businesses that had an FHRS sticker on display inside their premises but not outside (England: 16; NI: 7; Wales: 10)
In Northern Ireland, 85% of businesses had a sticker visible from outside. After a decline in the number of businesses in Northern Ireland displaying a sticker in a location visible from outside between 2019 and 2021, the rate significantly increased in 2022, bringing the rate of outside display broadly in line with the level recorded in 2019 (see Table 3.3). Those with a rating of 5 were more likely than average to display a sticker in a location visible from outside the premises (87%) (see Figure 3.3).
A factor that may have contributed to this change is that in 2022, all the audited premises had their own entrance, compared to 95% in 2021, where fewer could display their sticker in a way which was visible from outside the premises. Alongside this, the number of food businesses displaying a rating inside significantly decreased to 2% (down from 8% in 2021). More than four-fifths (86%) displayed a sticker in a location deemed ‘clearly visible’ by auditors (either inside or outside).
Table 3.3 Display rates in Northern Ireland
| Type of display | 2022 (n=527) | 2021 (n=515) | 2019 (n=480) |
|---|---|---|---|
| Displayed outside | 85%* | 77% | 87% |
| Displayed inside | 2%** | 8% | 3% |
| Not displayed | 13% | 16% | 11% |
| Summary: Displayed inside or visible outside | 87% | 84% | 89% |
| Deemed ‘clearly visible’ | 86% | 83% | 89% |
Did you see an FHRS sticker at this outlet? – Yes. Base: All audited food businesses 2022/2021/2019 (NI 527/515/480) –* Denotes a significant increase since 2021. ** Denotes a significant decrease since 2021.
In Wales, 88% of businesses had a sticker visible from outside. As presented in Table 3.4, this seems slightly higher than in 2021 but is not a statistically significant difference. (footnote 7) Concurrently, the number of food businesses not displaying a sticker has decreased slightly between 2021 and 2022, but again not to a statistically significant extent. Close to nine in ten businesses (89%) displayed a sticker in a location deemed ‘clearly visible’ by auditors (either inside or outside).
Table 3.4 Display rates in Wales
| Type of display | 2022 (n=497) | 2021 (n=505) |
|---|---|---|
| Displayed outside | 88% | 84% |
| Displayed inside | 3% | 4% |
| Not displayed | 9% | 12% |
| Summary: Displayed inside or visible outside | 91% | 88% |
| Deemed ‘clearly visible’ | 89% | 87% |
Did you see an FHRS sticker at this outlet? – Yes. Base: All audited food businesses 2022/2021/2019 (Wales 497/505/498) – * Denotes a significant increase since 2021. ** Denotes a significant decrease since 2021.
In England and Northern Ireland, takeaways and sandwich shops were more likely to have a sticker visible from outside (England 79%; Northern Ireland 95%), while accommodation businesses, pubs, bars and nightclubs were less likely (England 52%; Northern Ireland 66%). In Wales, restaurants and catering businesses were more likely to have a sticker visible from outside (93%), while retail businesses were less likely (78%).
Number of food hygiene rating stickers on display
In addition to recording the rating displayed by businesses, auditors recorded the number of stickers that they saw on the premises. Auditors were asked to check in several different areas around the outlet, and record the rating displayed on each sticker they found (footnote 8). As with previous years, a minority of businesses in each country displayed more than one sticker. Businesses that had multiple stickers displayed were typically establishments with multiple entrances.
In England, amongst businesses displaying a food hygiene rating, 12% of businesses had more than one food hygiene rating on display, consistent with 2021 (12%). Similarly, in Northern Ireland 12% of businesses displayed more than one FHRS sticker, consistent with 2021 (14%). The figure was slightly higher in Wales, with 16% of businesses displaying more than one sticker, compared to 11% in 2021.
Where multiple stickers were displayed, ratings generally matched; of the 163 businesses that had more than one sticker, there were five cases in which there were discrepancies in the ratings displayed. In four of these cases a business had two stickers, one displaying a rating of 4 and the other displaying a rating of 5. In the other case, a business had three stickers; two displayed a rating of 5 and one displaying ‘rating awaited’. (footnote 9)
Comparison of ratings on display to those recorded in FHRS database
To check the accuracy of FHRS stickers being displayed, auditors compared the ratings they observed within businesses to those found on the FHRS database. As shown in Figure 3.4, the number of food businesses whose displayed food hygiene rating matched the rating recorded in the database was in line with that recorded in previous years and has remained broadly consistent since 2017.
Most of the food businesses in each country that displayed a sticker, displayed a rating which matched the FHRS database (England 92%; Northern Ireland 95%; Wales 92%). In the small number of cases where the rating displayed did not match the database rating, more food businesses displayed a higher rating (England 7%; Northern Ireland 3%; Wales 4%) than a lower rating (England 1%, Northern Ireland 1%; Wales 3%).
For all three nations, nearly all businesses with a rating of 5 on the FHRS database were observed to be displaying the correct rating (England 99%; Northern Ireland 99%; Wales 96%). By comparison, 73% of businesses in England, 83% of businesses in Northern Ireland and 87% of businesses in Wales with a rating of 4 on the FHRS database were observed to be displaying the correct rating.
Figure 3.4 Whether displayed FHRS sticker matched FHRS database
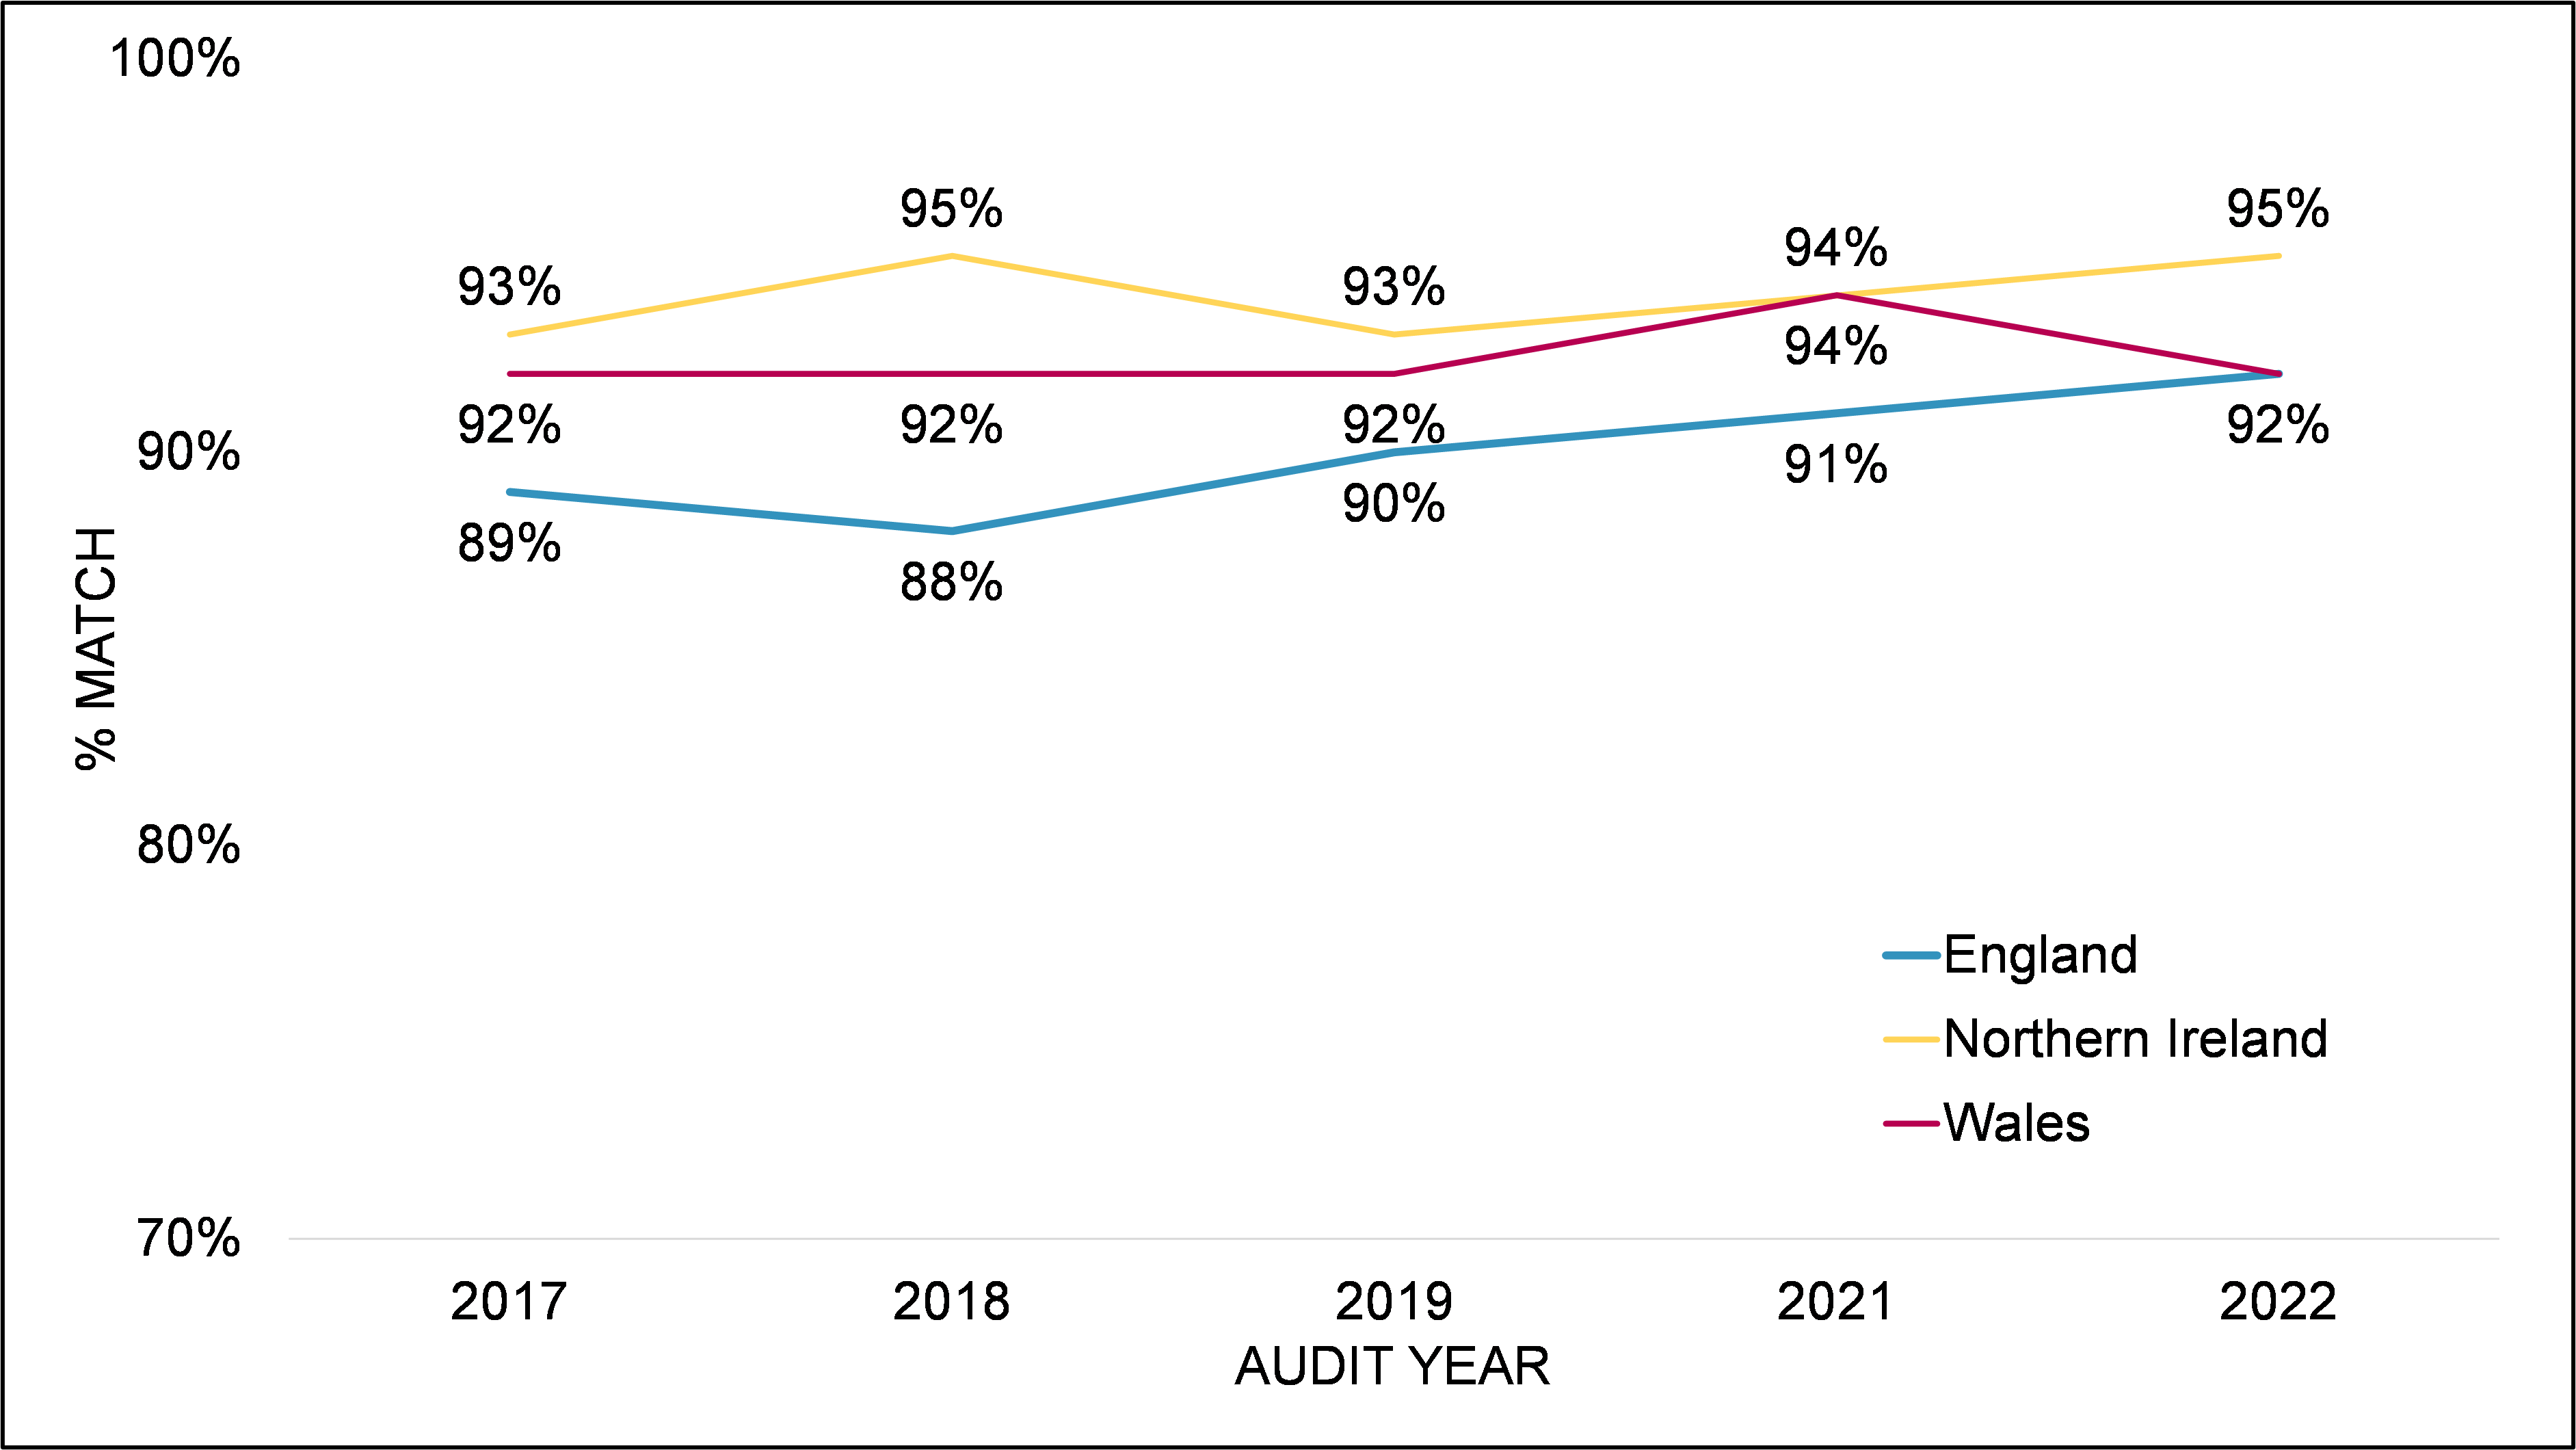
Does the food hygiene rating at location match what is in the FHRS database? – Yes Base: All businesses displaying FHRS 2022/2021/2019/2018/2017 (England 323/315/294/294/276; NI 458/448/429/446/435; Wales 450/435/467/454/438). ↑ /↓ Denotes a significant increase from 2021.
Online display of food hygiene ratings
Alongside an audit of the business premises, auditors conducted an online review to see whether the food hygiene rating was displayed on the business’s website or Facebook Business Page. (footnote 10) Checking the business’s Facebook Business Page is a new addition since the last wave so it is not possible to compare 2022 and 2021 findings for this metric.
As presented in Figure 3.5, 84% of businesses in England had a website or a Facebook Business Page. Of these, 13% had a rating displayed. Most (95%) of these businesses displayed a rating that matched the FHRS database, while 4% were found to be displaying a higher rating and 2% were found to be displaying a lower rating.
In Northern Ireland, 89% of businesses had a website or Facebook Business Page. Of these, 6% had their rating on display. Of these, all food businesses displayed the correct food hygiene rating online.
In Wales, 87% food businesses had a website or Facebook Business Page. Of these, 8% had their rating on display online. Most (92%) of these businesses displayed a rating that matched the FHRS database, while 5% were found to be displaying a higher rating and 3% were found to be displaying a lower rating.
Figure 3.5 Whether food businesses in England, Northern Ireland and Wales have a website or Facebook Business Page, and the rate of online food hygiene rating display 2022
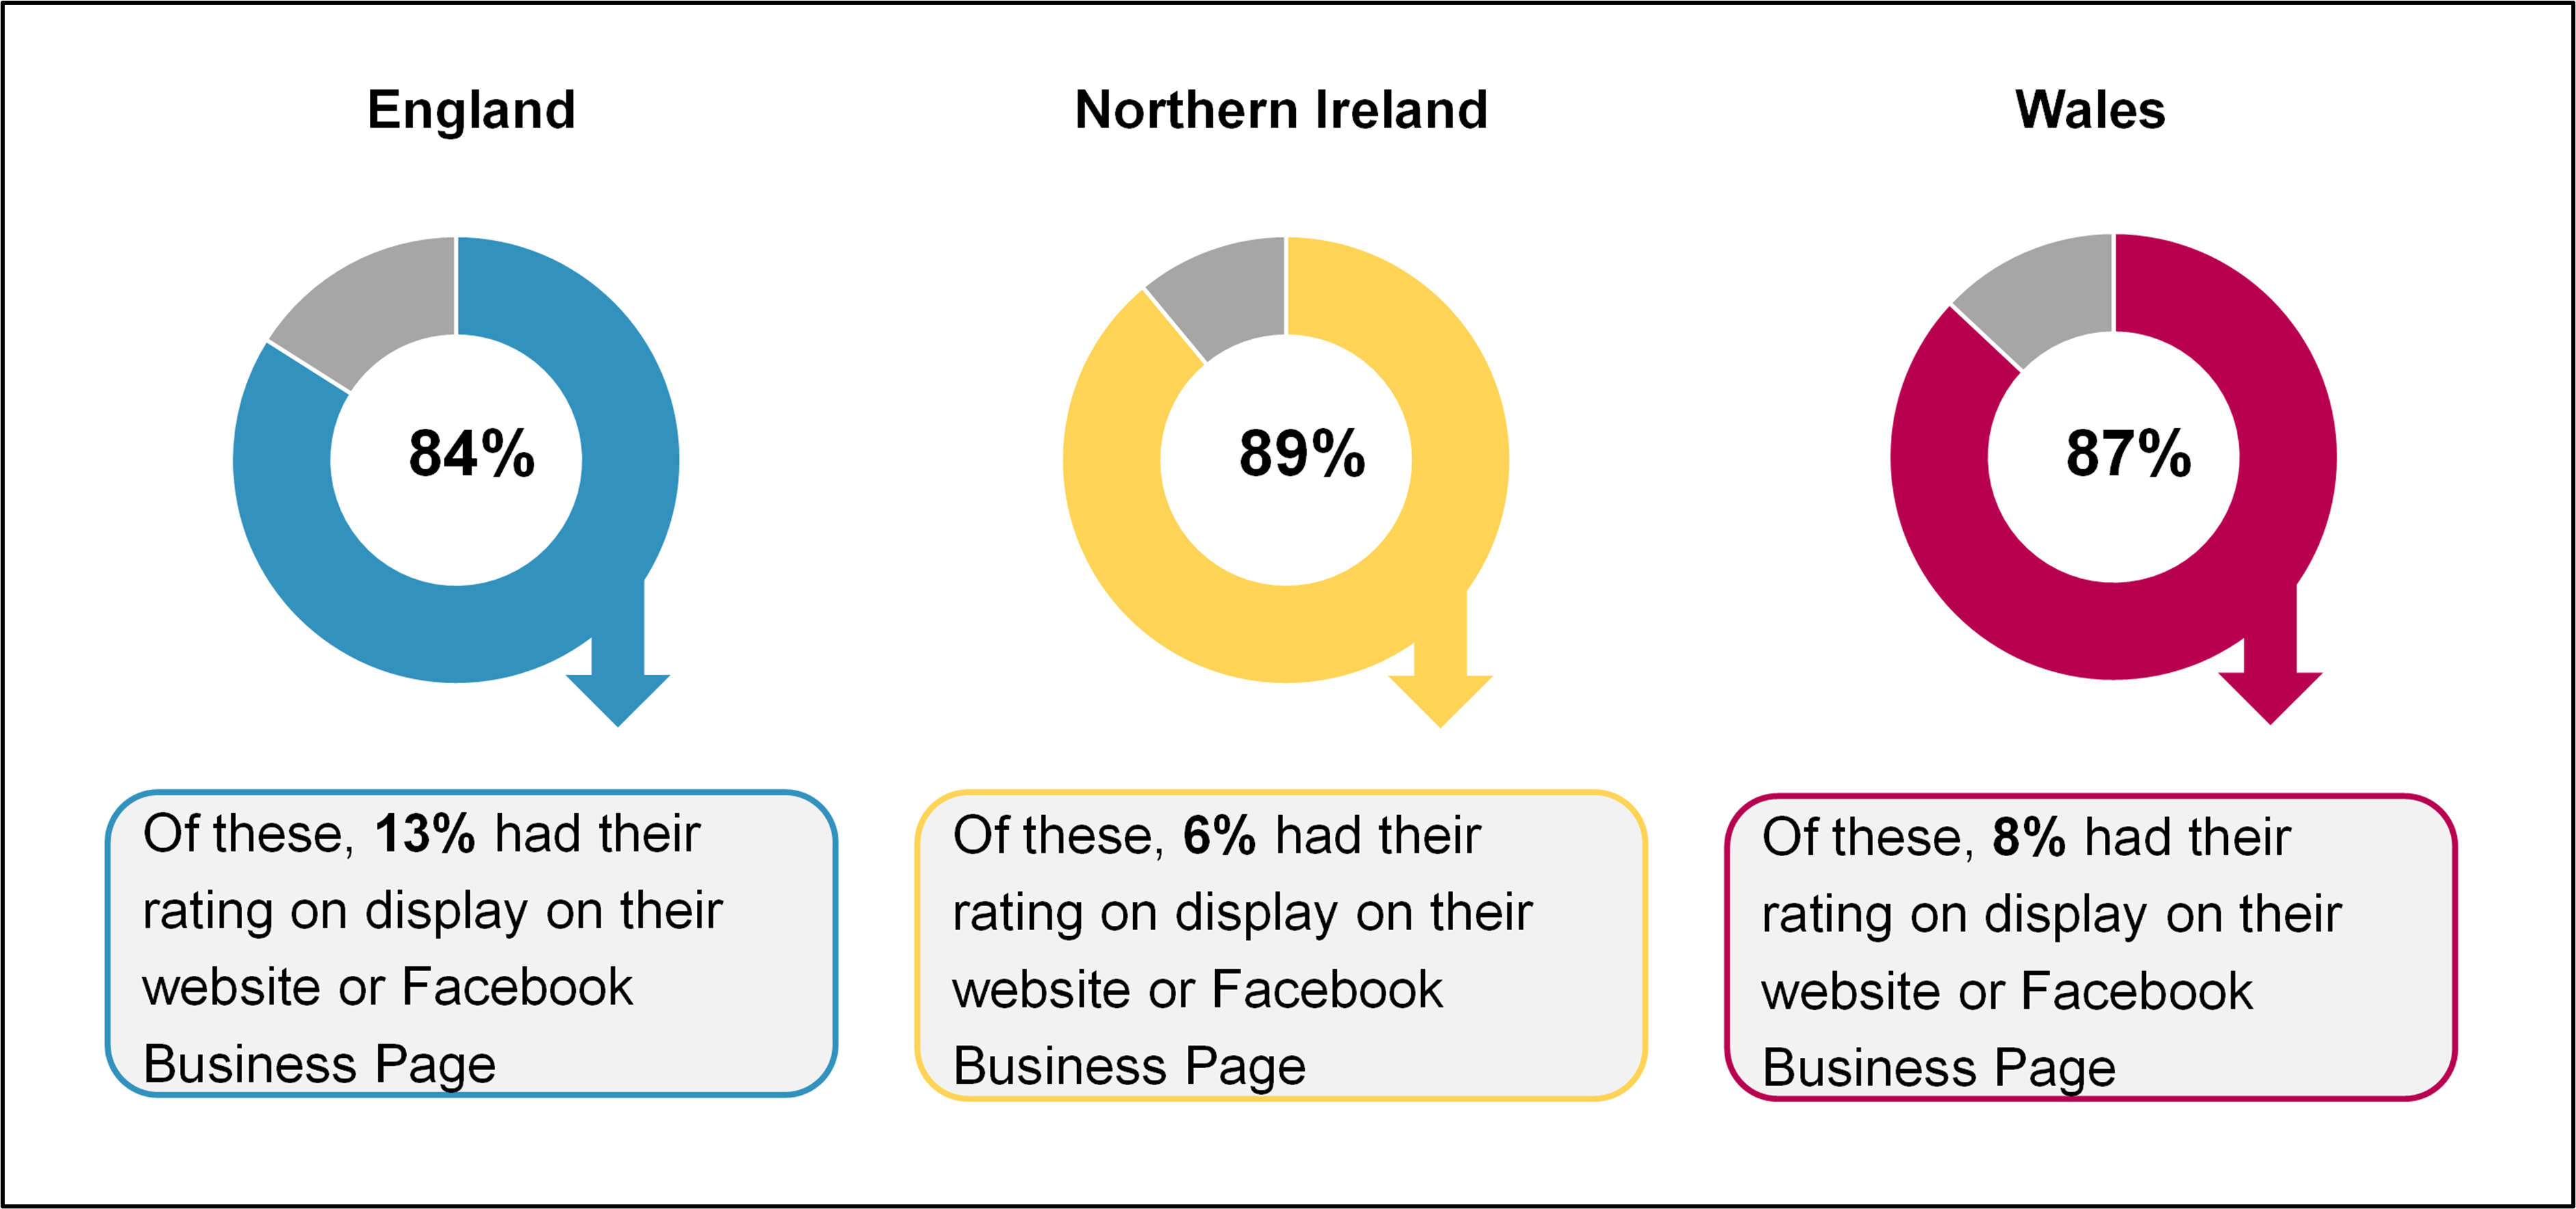
What FHRS rating was displayed on the location's website or Facebook Business Page? Base: All audited businesses (England: 501; NI: 527; Wales; 497).
-
In the 2021 report, the main figure of display in Wales (inside and outside) focused on the sticker with the dragon logo (85%). In the 2022 report, the question changed in the audit to not separate the dragon style sticker and non-dragon style, as the assumption was that because the sticker came out in 2013, most will now be dragon style stickers. Therefore, in this report separation cannot be made for the display of sticker with or without the dragon. Hence, when reporting the overall display figure for Wales in 2021 to make it comparable, the audit display figure focuses on the figure that for display of the dragon style sticker as well as the non-dragon style sticker (88% in 2021 report). No comment can be made in the 2022 report on the display of the dragon style sticker only.
-
Data on the proportion of Welsh businesses displaying FHRS rating stickers is unavailable for 2014.
-
In the original published 2021 report, the 2021 display figure was incorrectly reported as 87% for Wales. Please see the Errata on the FSA website regarding the version of the report that was published in September 2021 for more details.
-
Comparisons to rates of display observed before 2021 are not possible as the data from audits prior to this data are based only on the display of the statutory sticker with the dragon logo.
-
Six audits were conducted in Northern Ireland with businesses with a rating less than 3. This equated to 1.1% of all Northern Ireland audits, in line with the 1% who have a rating of less than 3 in the nation. Due to low base size in the raw data, this finding should be interpreted with caution.
-
‘Clearly visible’ is defined as not obscured by any other stickers or posters and not blocked from view by any furniture or objects
-
Comparisons with display data recorded before 2021 are not possible as the previous waves are based only on the display of the statutory sticker with the dragon logo.
-
This included but was not limited to: On the walls in the main service area, at the counter or till, at the entrances to any non-public areas e.g. the kitchen.
-
There may be temporary differences between the rating displayed at a business (or their website) and online rating for which there are valid reasons, such as: the business has appealed its latest rating and is awaiting the result; or the local authority is in the process of uploading the new rating to the FSA’s ratings website. Even if a business achieves the top rating there can be a short delay while the local authority updates the ratings website.
-
It should be noted that the survey sample did not include online only food businesses.
Awareness of the scheme
More than nine in ten food businesses (92%) in England, Northern Ireland and Wales reported having heard of the FHRS. Historically, awareness of the scheme in Northern Ireland and Wales has been higher than in England, likely reflecting the different legal requirements around the FHRS in the different countries (with display being mandatory in Northern Ireland (since 2016) and Wales (since 2013) but only encouraged in England). However, in 2022 self-reported awareness of the scheme was consistent across all three countries. This corresponds with a slight decrease in awareness in Northern Ireland since 2021 (from 95% to 92%), however this decrease is not statistically significant. When comparing awareness in 2022 to 2019, there has been a significant decrease amongst businesses in Northern Ireland (92% vs 96%) and Wales (92% vs 97%).
Figure 4.1 Awareness of the Food Hygiene Rating Scheme (FHRS)
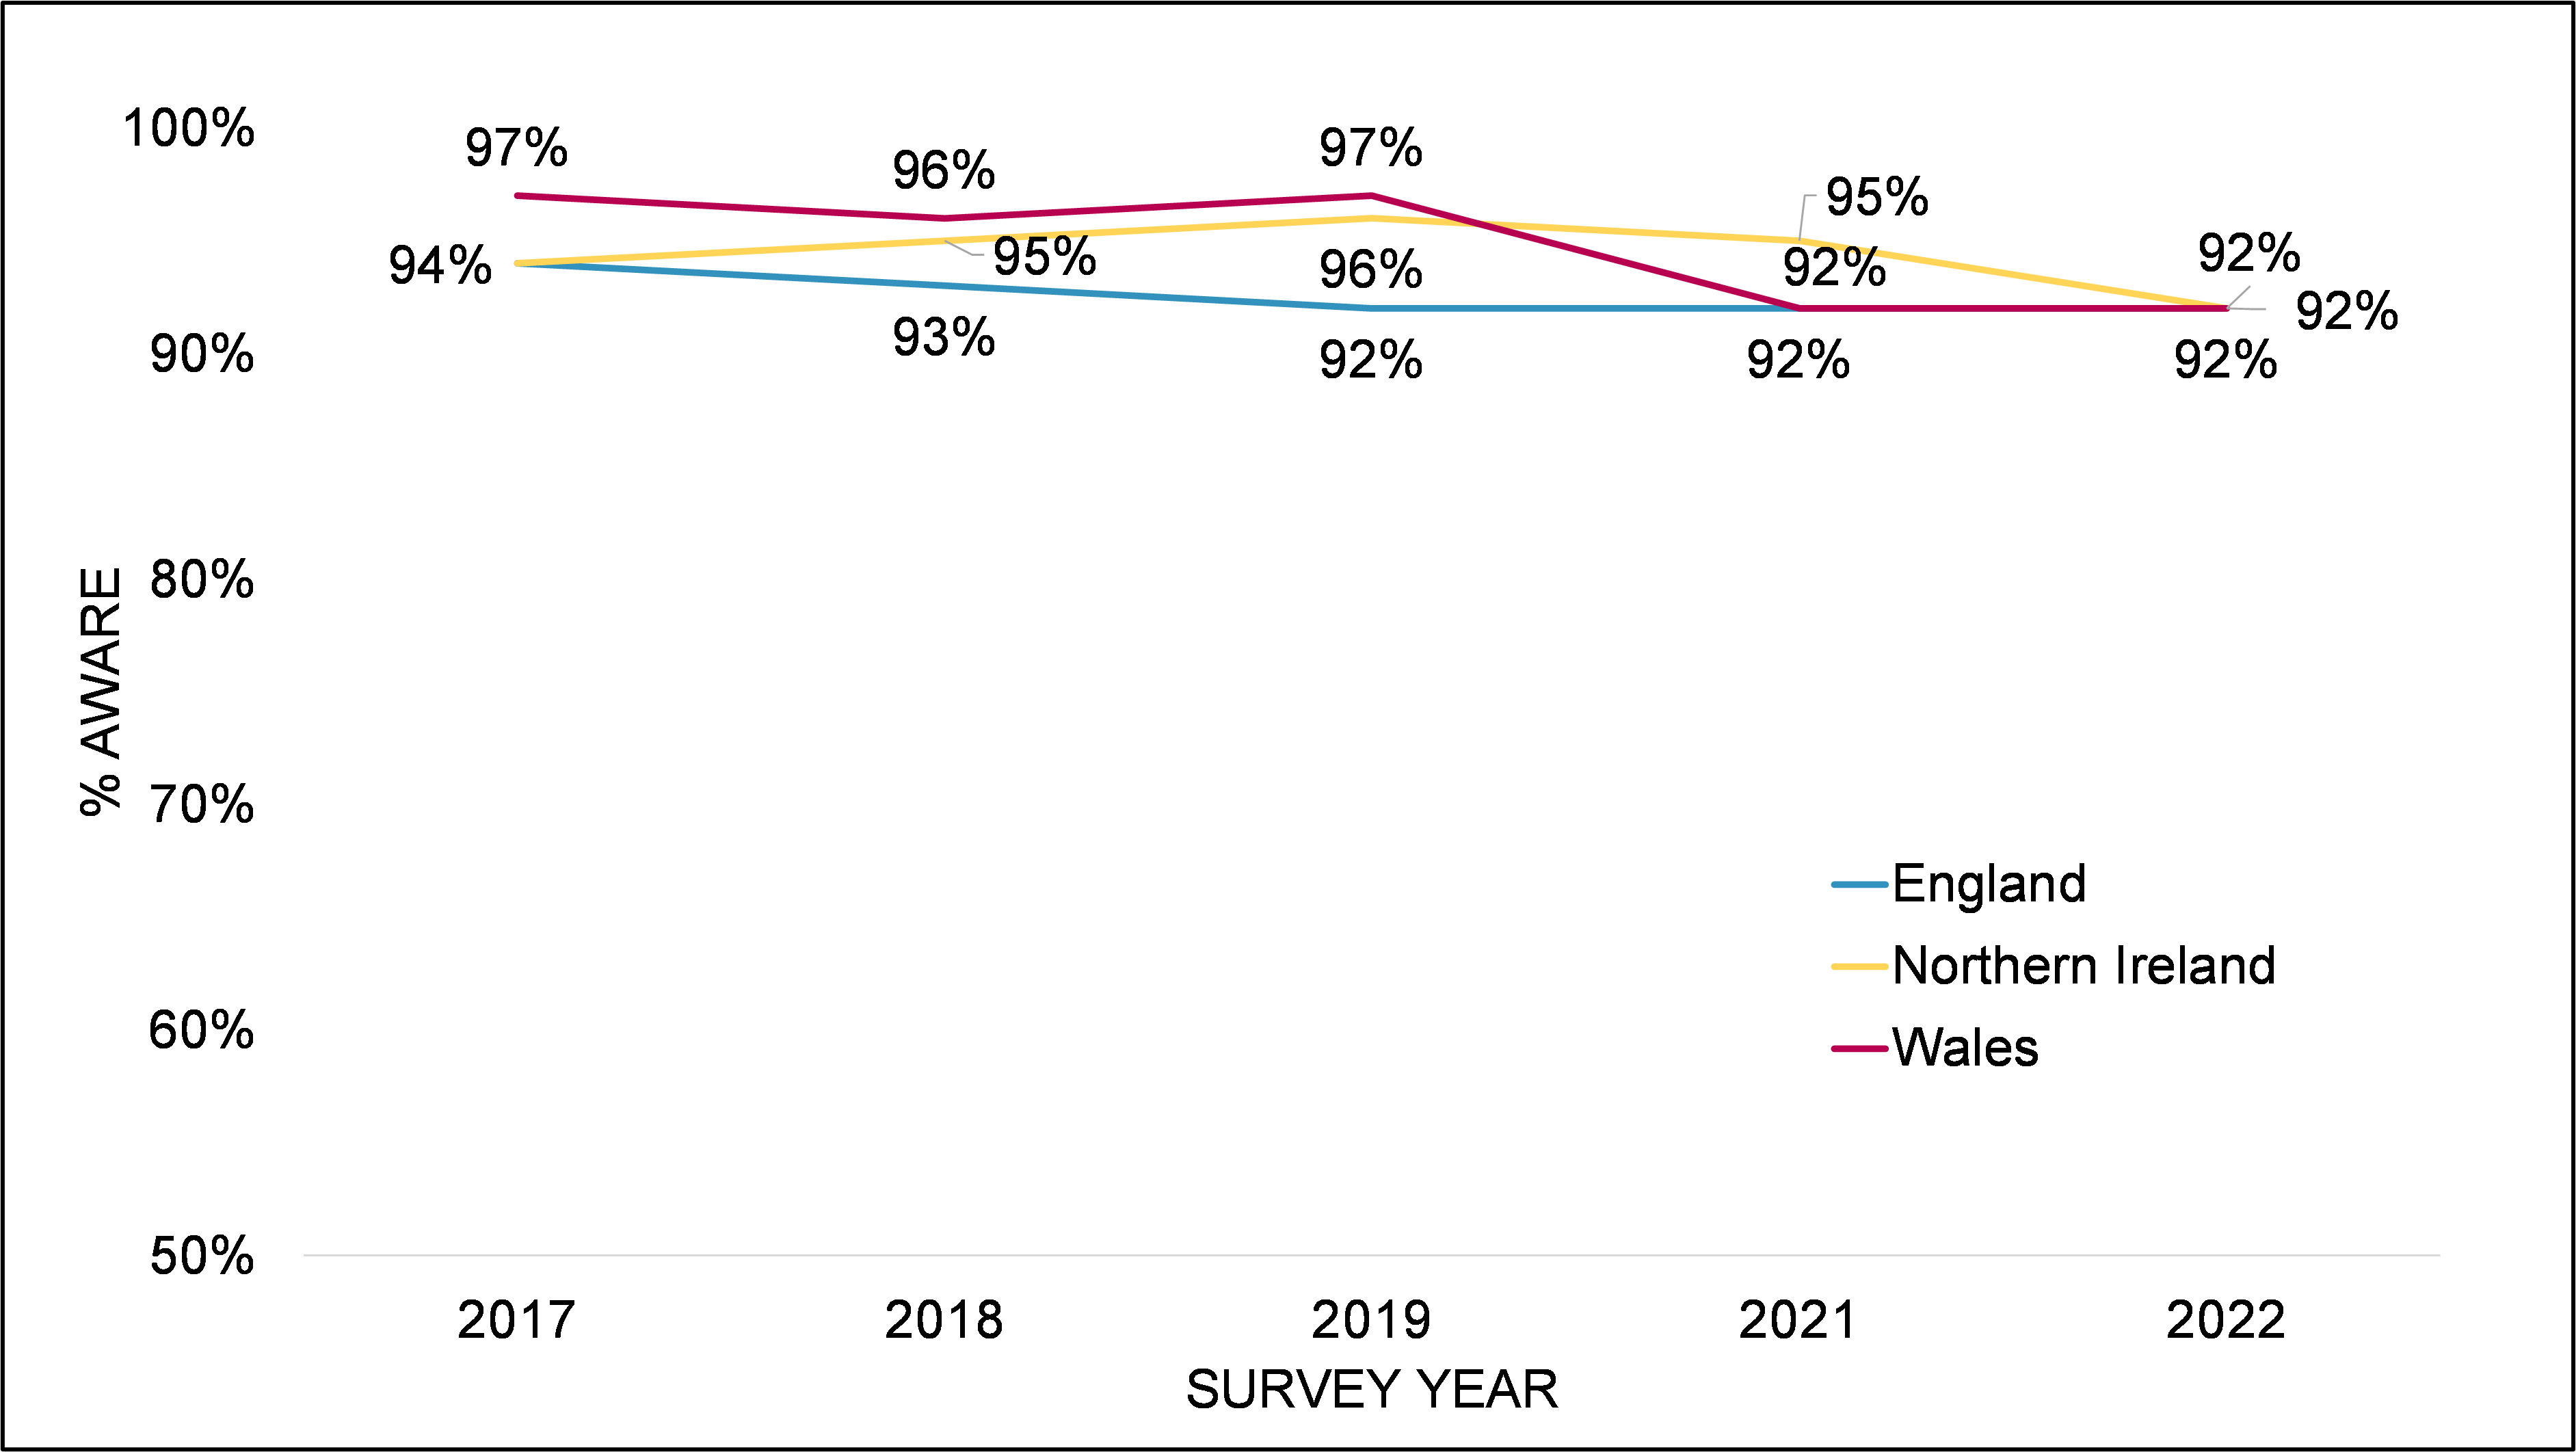
B1. Have you heard of the Food Hygiene Rating Scheme? Base: Base: All FBOs. England (2022: 500, 2021: 500, 2019: 498, 2018: 465, 2017: 498); Northern Ireland (500, 500, 500, 469, 494); Wales (500, 500, 507, 478, 501).
Within each country, self-reported awareness of the FHRS was at a similarly high level across the different sizes of food businesses, outlet types, and food hygiene rating that the business held. However, takeaways and sandwich shops stood out as being less likely than average to be aware of the scheme in England (85%), Northern Ireland (85%) and Wales (83%).
After further prompting – for example, referencing green and black stickers – slightly more businesses in Northern Ireland and Wales could recall being given a food hygiene rating by their local authority than had recognised the name of the FHRS (Northern Ireland 97% vs 92% and Wales 96% vs 92%). This suggests that some businesses are aware of the scheme but are unfamiliar with its official title.
Satisfaction with food hygiene ratings
As presented in Figure 4.2, amongst those aware of their food hygiene rating, most businesses in England (91%), Northern Ireland (95%) and Wales (89%) reported being satisfied with their rating. In all three countries, satisfaction with food hygiene ratings has not changed significantly since 2021.
Figure 4.2 Satisfaction with the food hygiene ratings
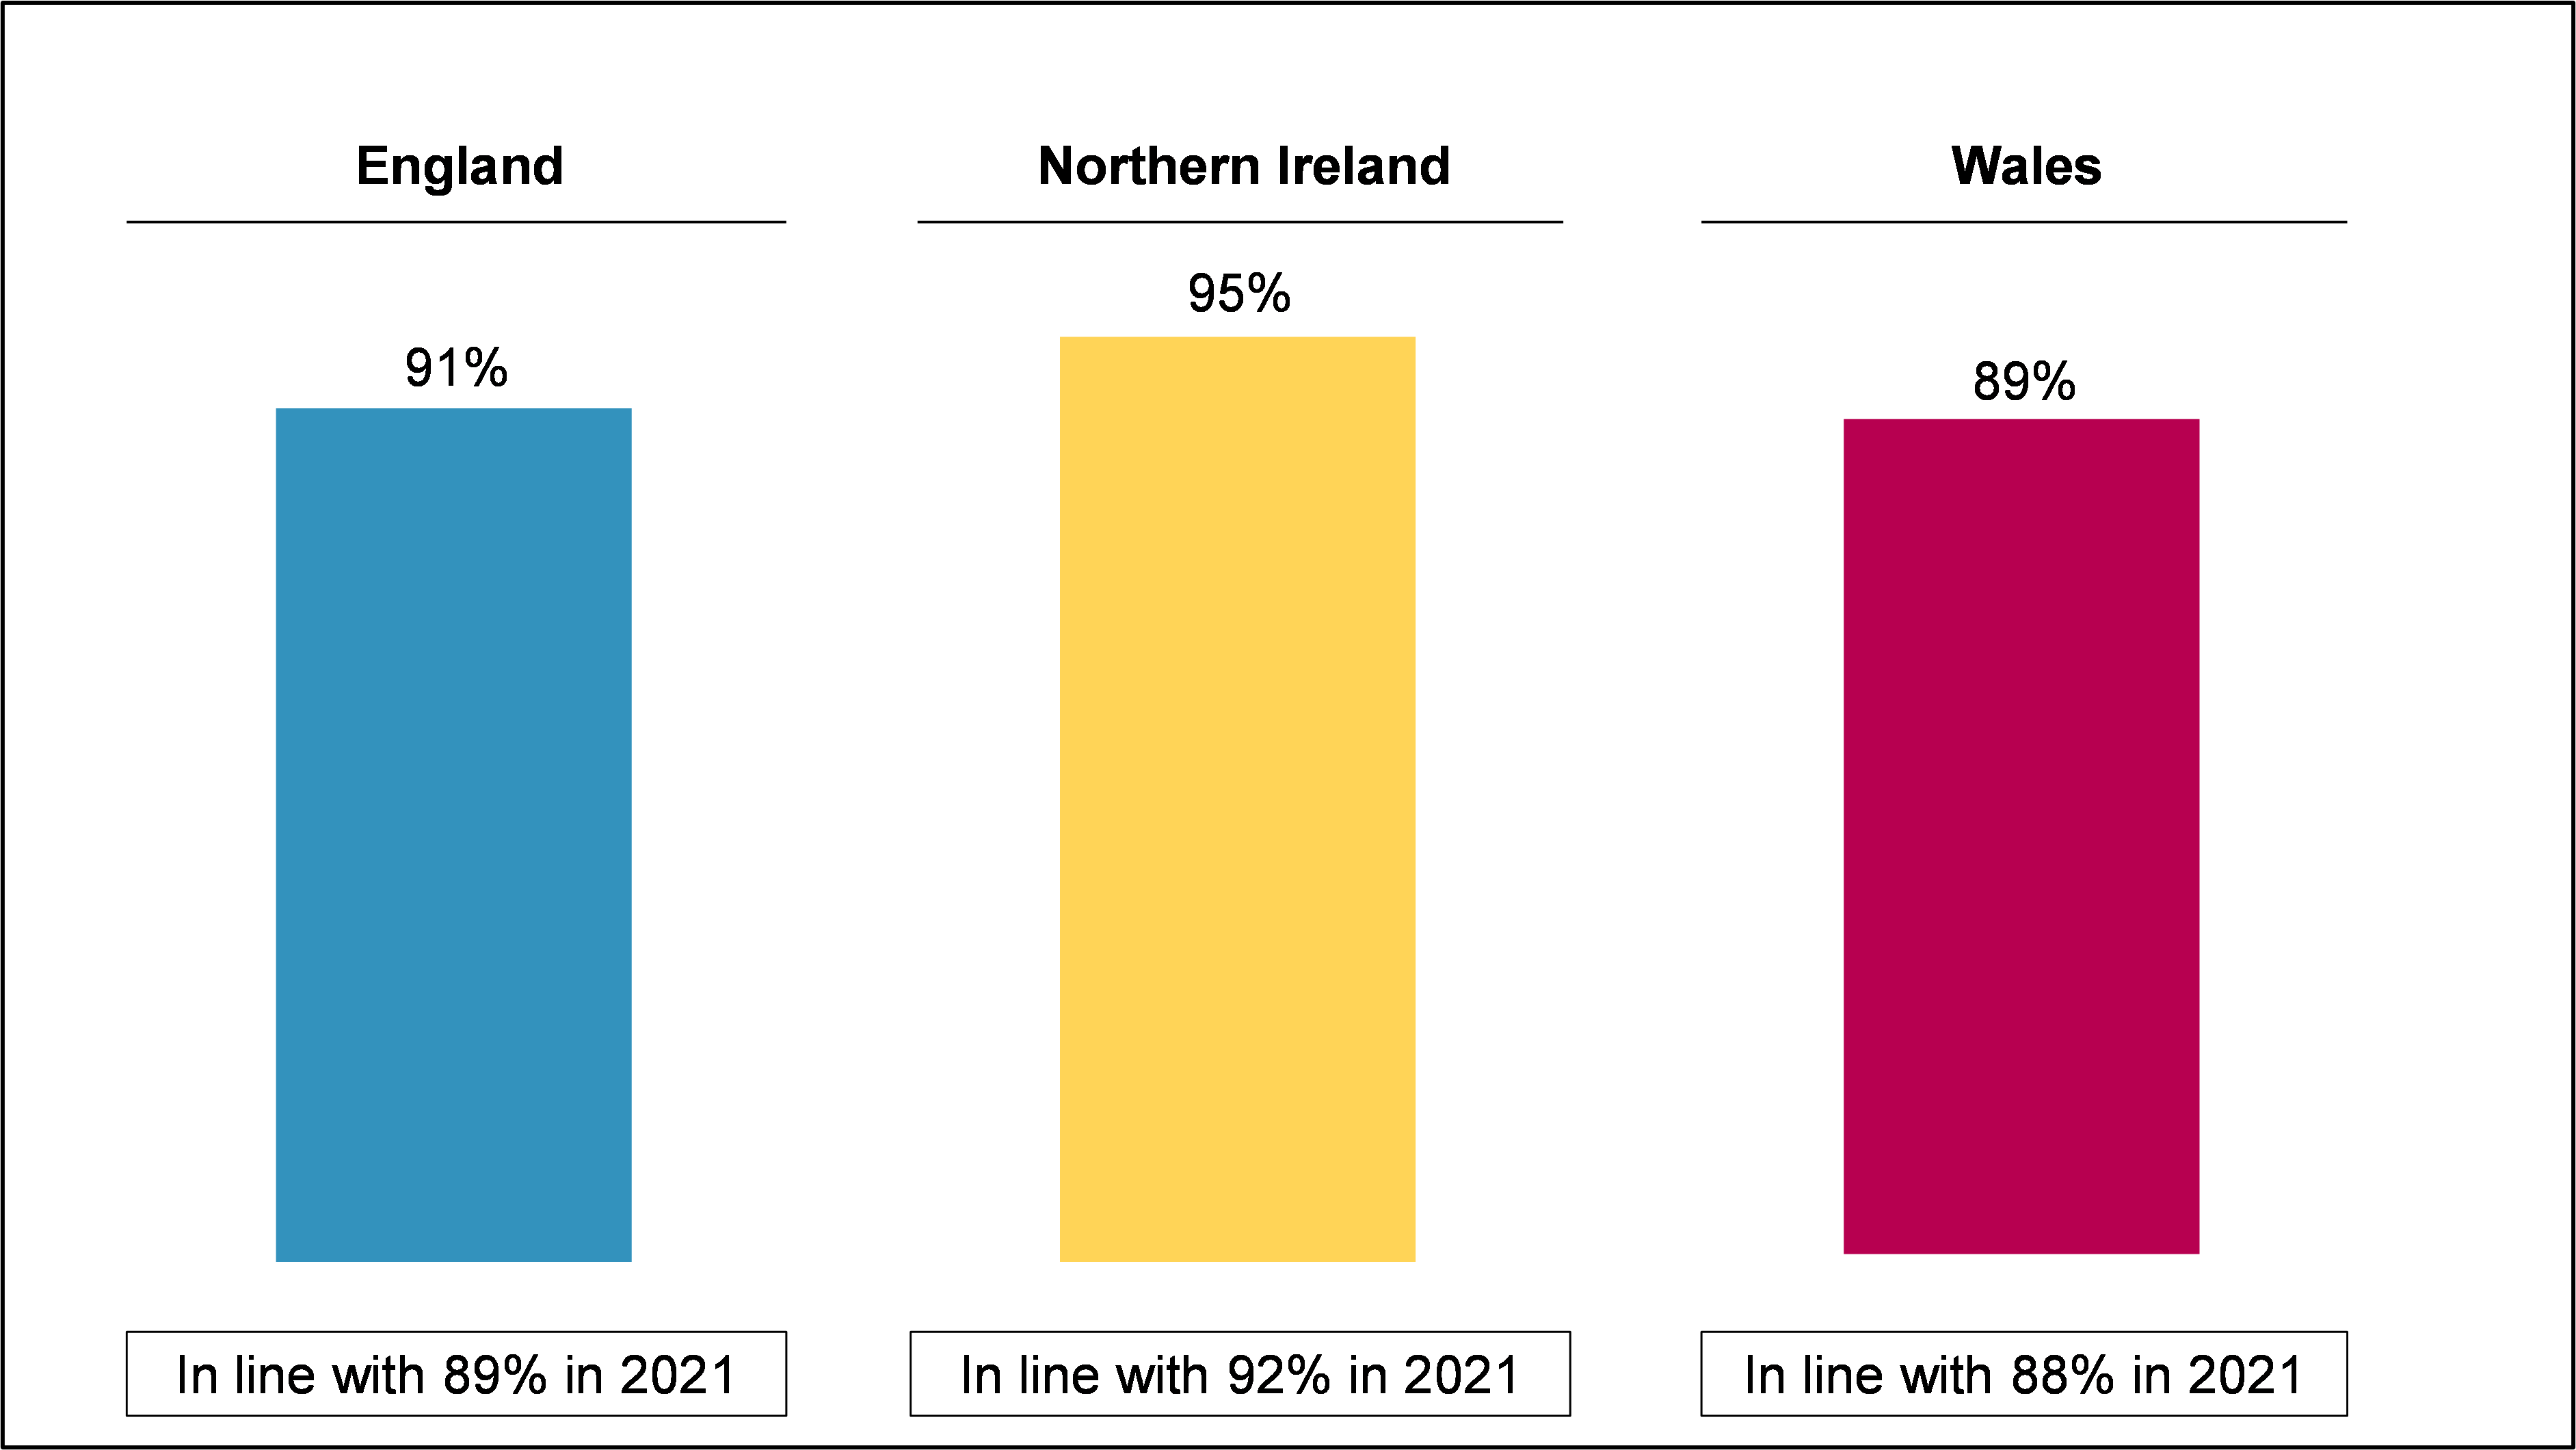
B6. Are you satisfied with the rating you received? – Yes; Base: Where knows food hygiene rating 2022/2021 (England 452/464; NI 482/484; Wales 471/472). This question refers to the numerical rating a business received, not necessarily the signage.
Unsurprisingly, across all three countries, businesses with higher ratings were more likely to be satisfied. For example, nearly all businesses with a rating of 5 were satisfied with their rating (England 99%, Northern Ireland 98% and Wales 98%) while significantly fewer businesses with a rating of 4 were satisfied (England 84%, Northern Ireland 87% and Wales 78%).
Amongst the minority of businesses that were dissatisfied with their food hygiene rating, most said that this was because they felt that they deserved a higher rating, with many of the opinion that they should have been awarded a rating of 5. Some attributed their lower than desired rating to food safety officers being unfair in their assessments or putting too much emphasis on what the business considered to be non-food hygiene aspects (i.e., structure and confidence in management), while others said that inspections had been conducted at inconvenient times (for example during a busy period or during a deep clean).
“We always got 5 and on the last visit they came on a day when we were deep cleaning and because of that the kitchen was not on top of cleaning process and they decided to lower rating to 4… that day was not the best day for a visit.”
Restaurants and catering, England, FHRS rating of 4
“The rating should have been higher. When the Environmental Health Officer came in first thing they went to do is wash their hands, but at the time we were busy and soap dispenser was empty. We got marked down for that.”
Accommodation, Wales, FHRS rating of 3
Minimum satisfactory rating
Businesses were asked what was the lowest food hygiene rating which they would be satisfied with. As shown in Figure 4.3, six in ten businesses in England (60%) and Northern Ireland (58%) reported they would only be satisfied with a rating of five, while just under half (49%) of businesses in Wales mentioned they would only be satisfied with a rating of five. Around one third of businesses also considered a rating of 4 to be the minimum (England 33%, Northern Ireland 33%; Wales 38%). Across all three countries, very few would be satisfied with a rating of 3 or less (England 6%, Northern Ireland 7%; Wales 12%).
Figure 4.3 Lowest food hygiene rating businesses would be satisfied with
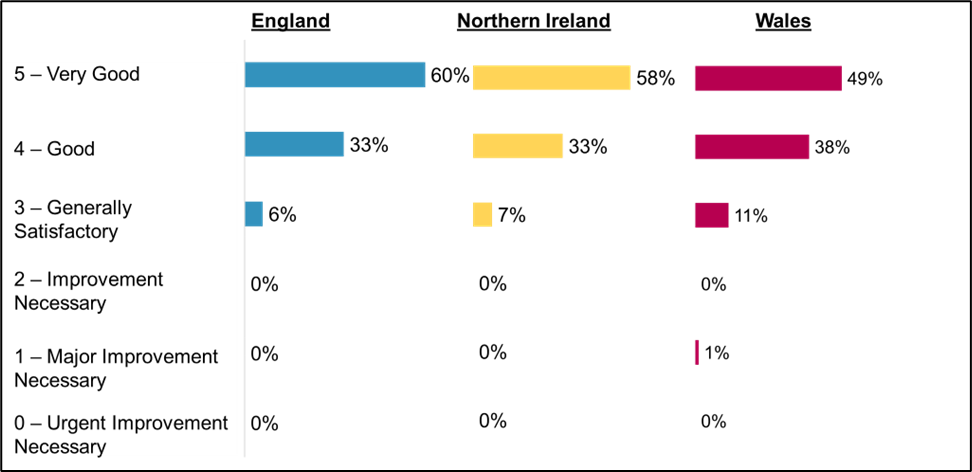
England: Very Good (5): 60%, Good (4): 33%, Generally Satisfactory (3): 6%, Improvement Necessary (2): 0%, Major Improvement Necessary (1): 0%, Urgent Improvement Necessary (0): 0% Northern Ireland: Very Good (5): 58%, Good (4): 33%, Generally Satisfactory (3): 7%, Improvement Necessary (2): 0%, Major Improvement Necessary (1): 0%, Urgent Improvement Necessary (0): 0% Wales: Very Good (5): 49%, Good (4): 38%, Generally Satisfactory (3): 11%, Improvement Necessary (2): 0%, Major Improvement Necessary (1): 1%, Urgent Improvement Necessary (0): 0%
B7a. What is the lowest Food Hygiene Rating you would be satisfied with? Base: Where knows food hygiene rating 2022 (England 452; NI 482; Wales 471).
Across all three countries, there was a strong correlation between the rating businesses had and the lowest ratings they would be satisfied with. For example, 72% of businesses in England with a rating of 5 considered 5 to be the lowest rating they would be satisfied with (compared to 60% on average), while 73% of businesses with a rating of 4 considered four to be the lowest rating they would be satisfied with (compared to 33% on average).
In addition to being asked about the lowest food hygiene rating they would be satisfied with, businesses were also asked what was the lowest rating they would consider ‘good enough’ to display. As illustrated in Figure 4.4, across England, Northern Ireland and Wales most businesses said that only a rating of 4 or above would be appropriate (England: 86%; Northern Ireland: 85%; Wales: 76%), with a rating of 4 being identified as the baseline for many (England: 45%; Northern Ireland: 44%; Wales: 43%). Across all three countries, the higher the food hygiene rating the business currently held at present, the higher the minimum rating they would consider to be ‘good enough’ to display.
Figure 4.4 Lowest food hygiene rating businesses would consider ‘good enough’ to display
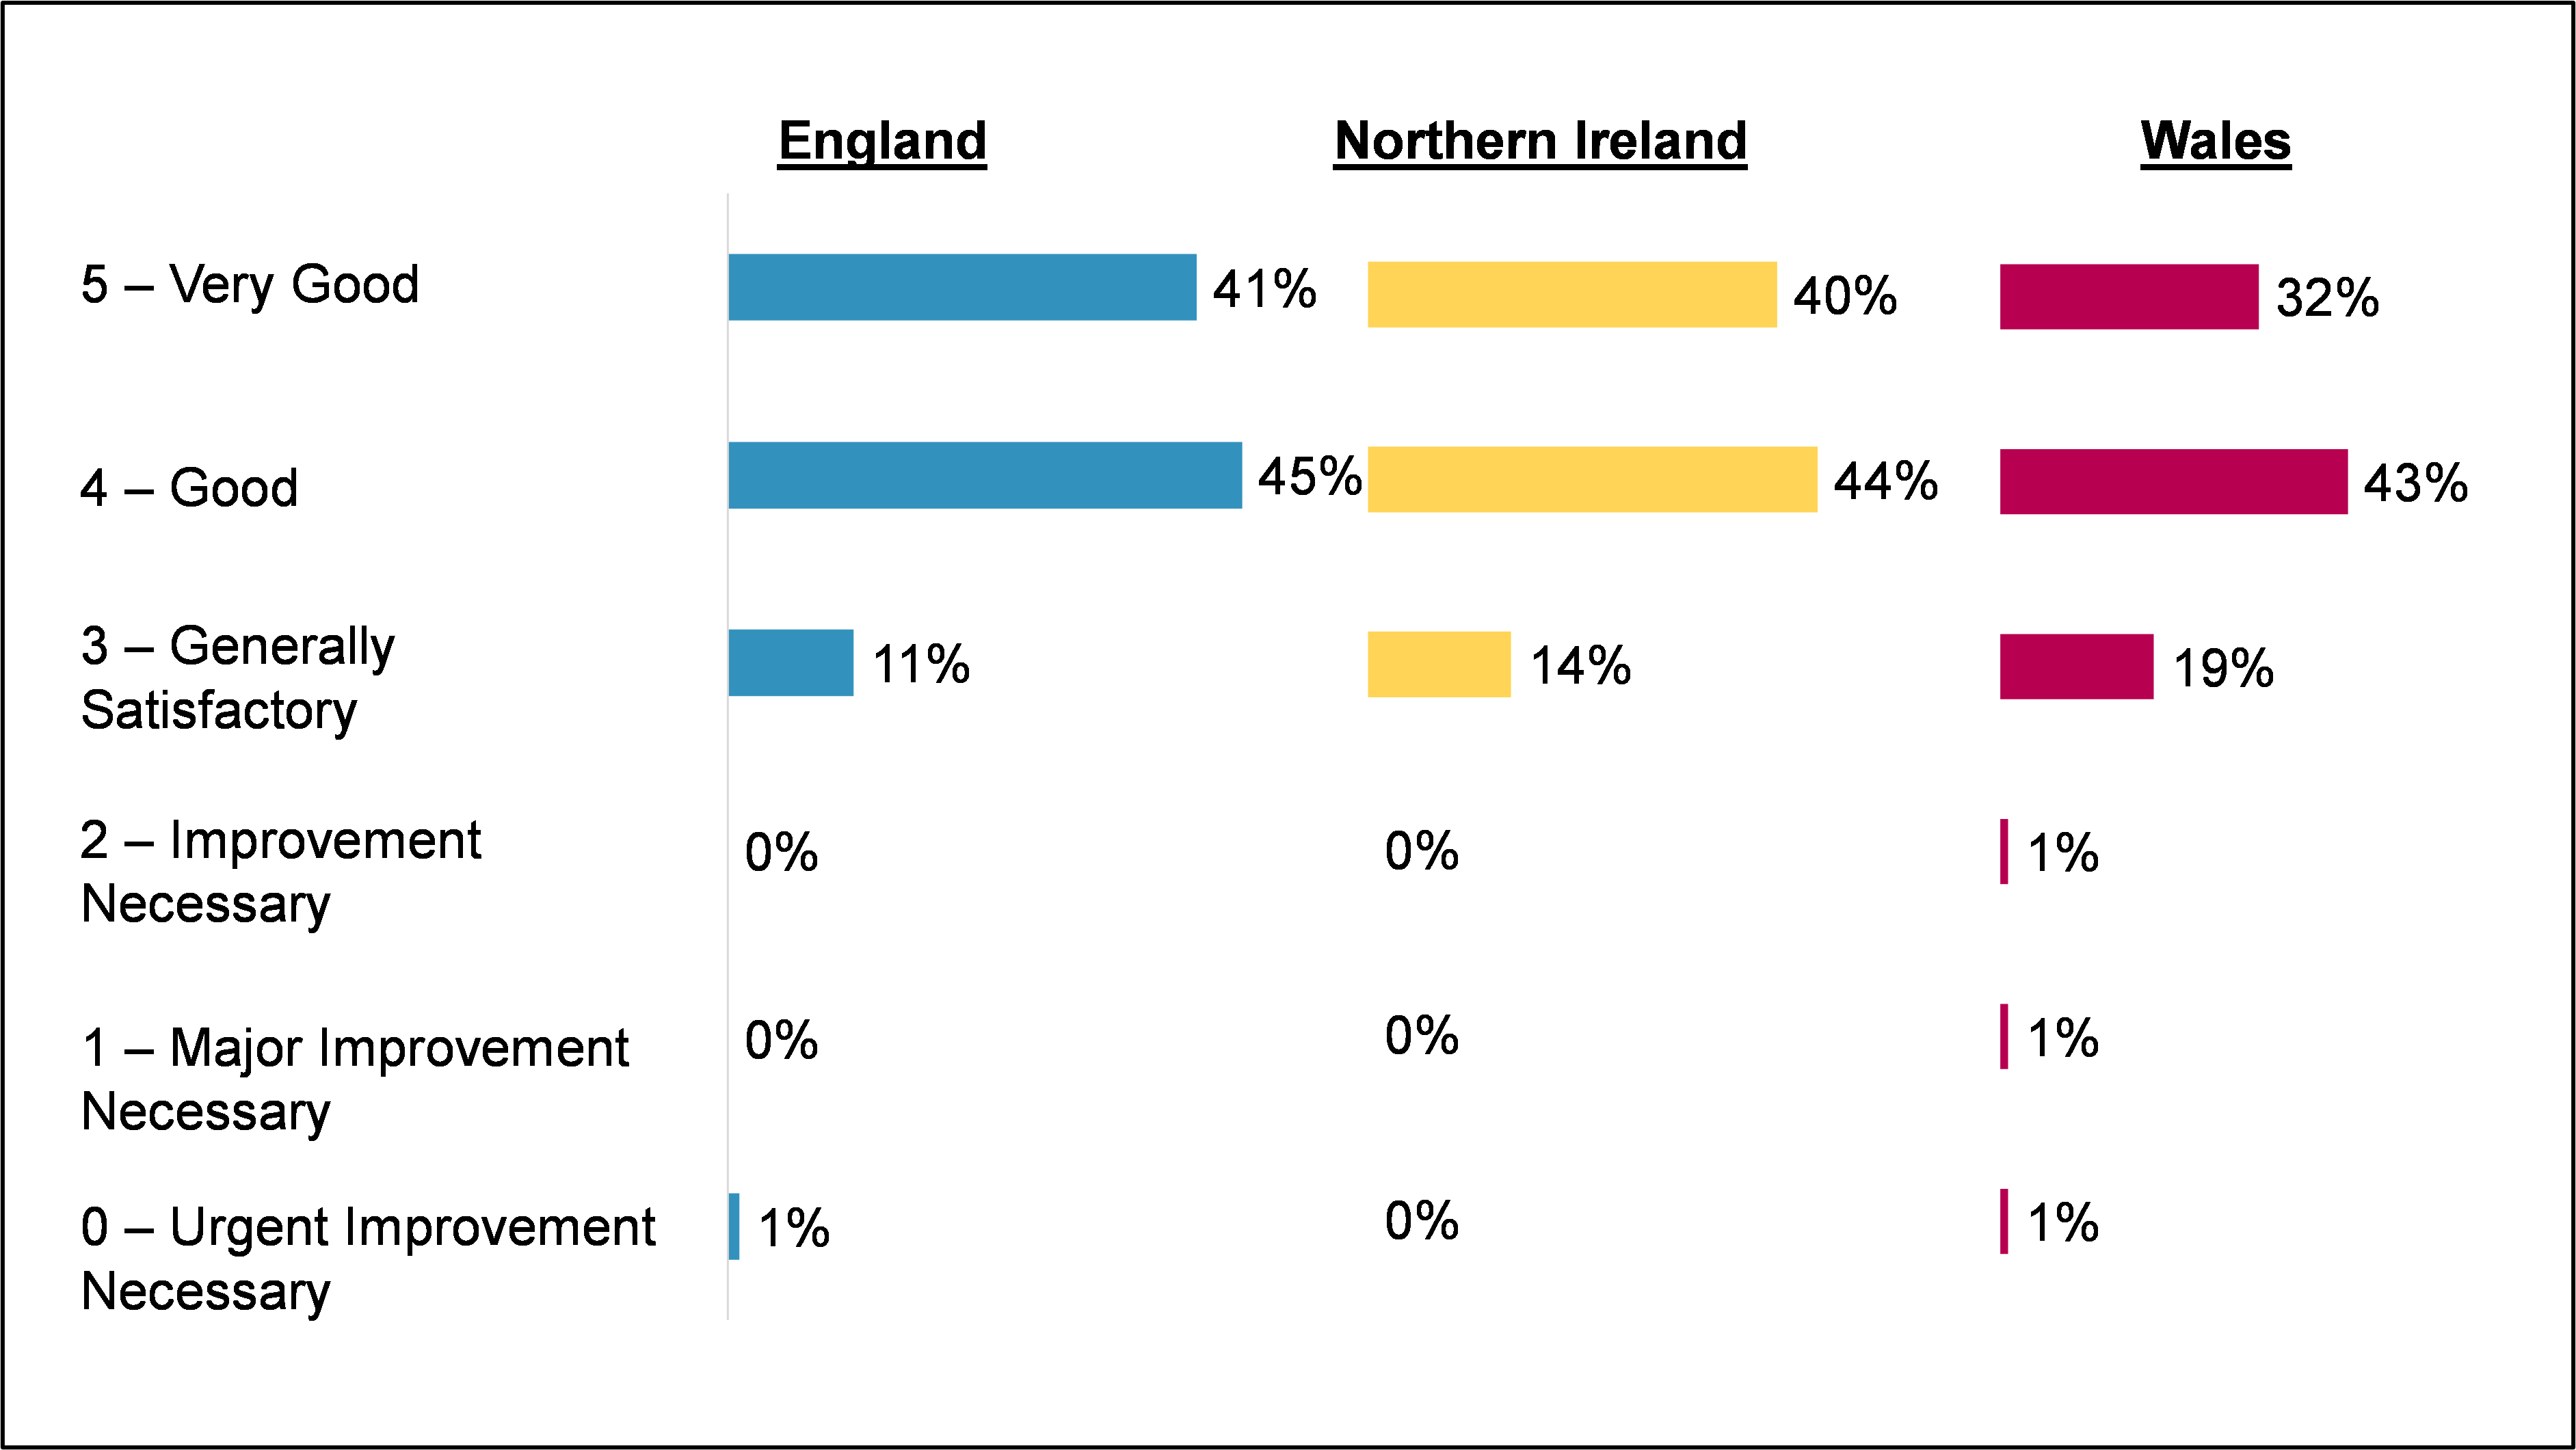
England: Very Good (5): 41%, Good (4): 45%, Generally Satisfactory (3): 11%, Improvement Necessary (2): 0%, Major Improvement Necessary (1): 0%, Urgent Improvement Necessary (0): 1% Northern Ireland: Very Good (5): 40%, Good (4): 44%, Generally Satisfactory (3): 14%, Improvement Necessary (2): 0%, Major Improvement Necessary (1): 0%, Urgent Improvement Necessary (0): 0% Wales: Very Good (5): 32%, Good (4): 43%, Generally Satisfactory (3): 19%, Improvement Necessary (2): 1%, Major Improvement Necessary (1): 1%, Urgent Improvement Necessary (0): 1%
B17. And thinking more generally now about the Food Hygiene Rating, what is the lowest Food Hygiene Rating that you would consider ‘good enough’ to display at your business? Base: Where have FHRS certificate/sticker rating (England 465; NI 487; Wales 478).
This chapter also addresses the reasons some businesses do not display stickers and possible actions that could motivate businesses to start displaying their sticker in England, where display is not mandatory. The chapter concludes with reported display rates of food hygiene ratings online, according to survey findings.
Stated display of ratings
Across all three countries, most businesses reported displaying their FHRS sticker somewhere that was clearly visible to customers, although this was higher for businesses in Northern Ireland (98%) and Wales (97%) compared to England (87%), where it is not a legal requirement to display an FHRS sticker. (footnote 1)
As shown in Figure 5.1, 98% of businesses in Northern Ireland, 97% of businesses in Wales and 87% of businesses in England reported display of stickers in a clearly visible location, which is broadly consistent with rates reported in 2021.
Figure 5.1 Proportion of food businesses reporting display of an FHRS sticker in a clearly visible location
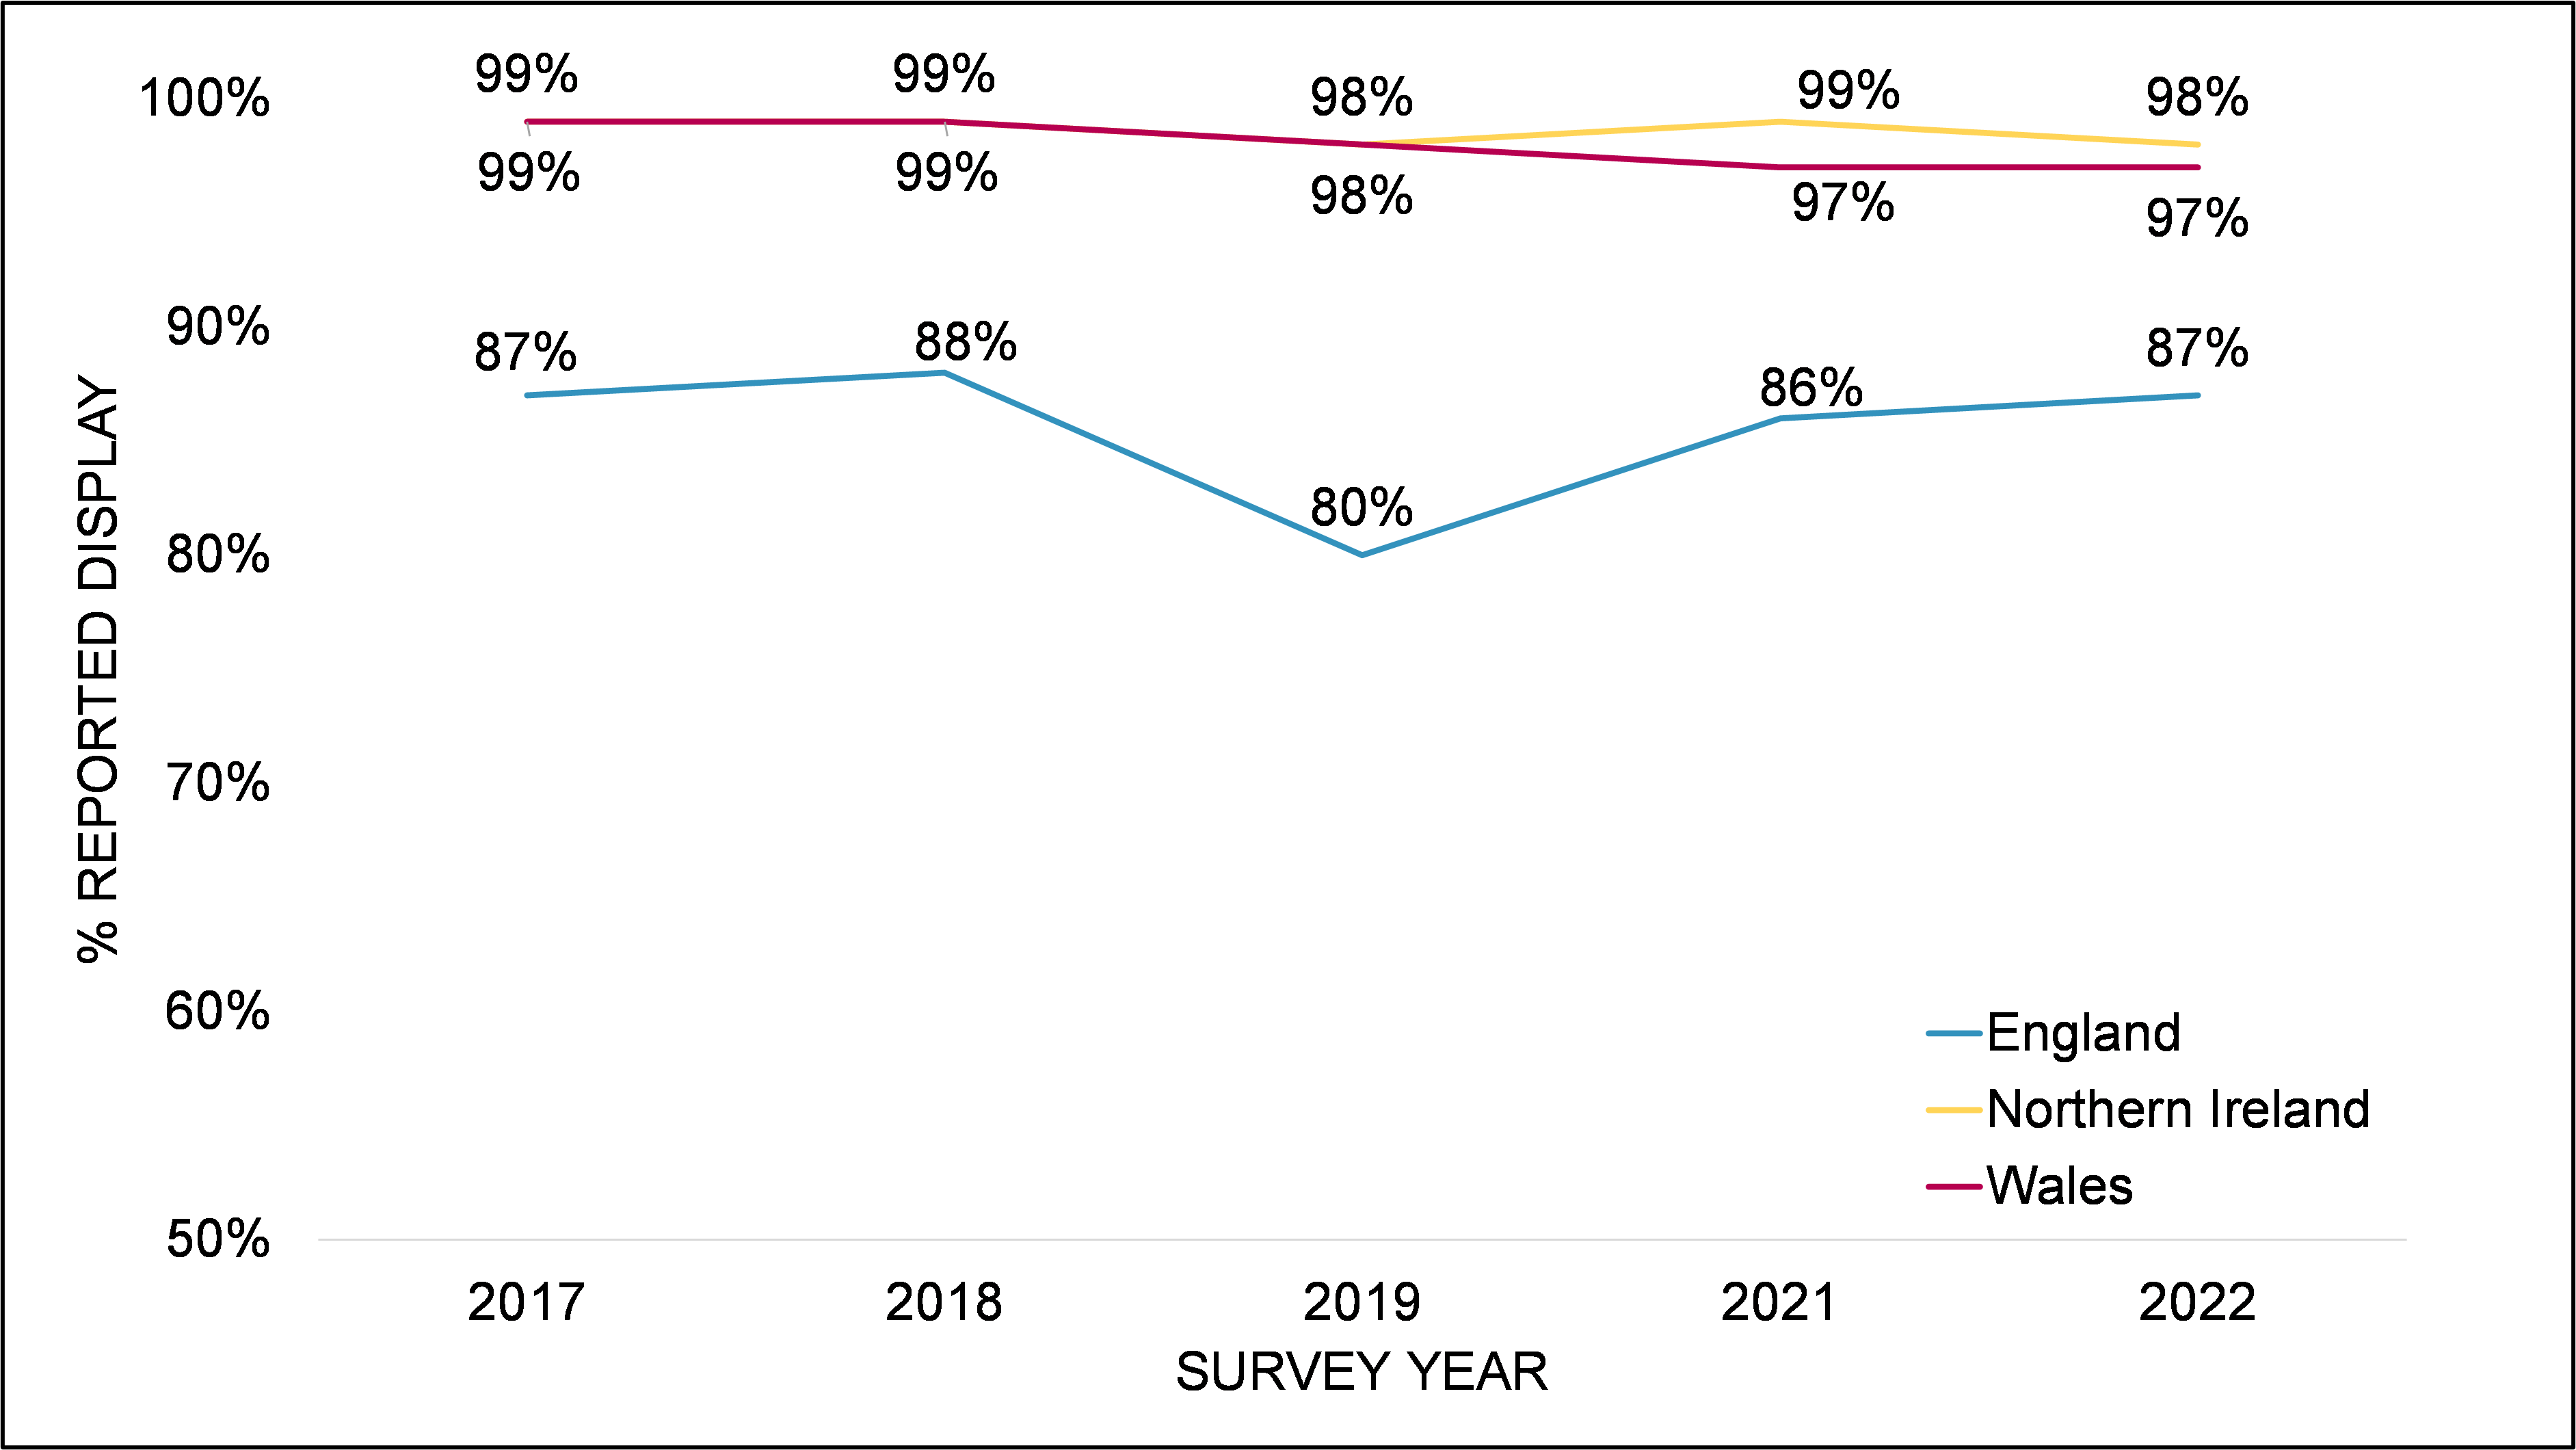
B10. Is your Food Hygiene Rating sticker on display on your premises? – Yes – Somewhere it is clearly visible; Base: Businesses aware of FHRS rating 2022/2021/2019/2018/2017 (England 465/469/475/462/438; NI 487/486/495/491/476; Wales 478/479/494/500/487).
Given that nearly all businesses in Northern Ireland and Wales reported displaying a sticker somewhere that was clearly visible to customers, there was no significant variation between subgroups within these countries. However, in England, takeaways and sandwich shops (96%) and those with a food hygiene rating of 5 (93%) were more likely than average (87%) to state that their sticker was clearly displayed.
As might be expected, self-reported rates of display were higher than rates of display observed during audits (see Chapter 4). In total, 484 food businesses that participated in the telephone survey were also audited. Of these, the majority (83%) self-reported display and this was confirmed when audited. Of the remainder, 14% self-reported display but were found to not be displaying when audited; 2% were unsure of their rating or whether they displayed it in a visible location but were found to be displaying when audited; and 1% self-reported non-display of their rating.
Stated location of display
Businesses that stated that they displayed their FHRS sticker in a clearly visible location were also asked whether their sticker could be seen by customers from outside their premises. As shown in Figure 5.2, amongst those that reported displaying a sticker, 97% of businesses in Wales, 92% of businesses in Northern Ireland and 90% of businesses in England said the sticker could be seen from outside their premises, which is broadly consistent with rates reported in 2021.
Figure 5.2 Proportion of food businesses reporting display of an FHRS sticker in a clearly visible location from outside the premises
B11. Can I just check, can customers clearly see your Food Hygiene Rating sticker from the outside of your premises, in other words, without having to enter your premises? – Yes; Base: Businesses that display an FHRS sticker in a clearly visible location 2022/2021/2019/2018/2017 (England 406/408/402/415/400; NI 479/483/490/486/473; Wales 467/465/489/495/479).
As nearly all businesses in Wales that reported displaying an FHRS sticker said that the sticker was visible from outside their premises, there was no significant variation between subgroups within this country. However, there were some small differences in England and Northern Ireland by business type:
- takeaways and sandwich shops in England (98%) and Northern Ireland (99%) that reported displaying an FHRS sticker were more likely than average to have reported displaying the stickers somewhere visible from outside.
- accommodation businesses and pubs, bars and nightclubs in Northern Ireland that reported displaying an FHRS sticker (80%) were less likely than average (92%) to report displaying stickers somewhere visible from outside. Businesses in this sector that reported not displaying stickers typically attributed this to there being nowhere suitable to display in location visible outside.
Businesses in Northern Ireland and Wales who stated that they displayed their sticker on their premises in a clearly visible location were also asked whether they had stickers at all entrances to their premises, providing they had a customer entrance. As shown in Figure 5.3, most of these businesses reported having an FHRS sticker at every entrance (90% in Northern Ireland and 86% in Wales). Fewer businesses said they had a sticker displayed at some of their entrances but not all (8% in Northern Ireland and 12% in Wales) while very few reported not having a sticker displayed at any entrance (1% in Northern Ireland and 2% in Wales).
Figure 5.3 Proportion of Northern Irish and Welsh food businesses reporting display of an FHRS sticker at entrances
B13. Do you have the sticker displayed at your customer entrance? B14. At how many customer entrances do you have the sticker displayed? Base: Businesses with at least one customer entrance and food hygiene rating sticker is clearly on display, by outlet type Total/Retail/Take-away/Catering/ Accommodation and bars (NI 440/142/66/181/51; Wales 445/111/43/176/115). ↑ / ↓ denotes a significant difference compared to the total.
In both Northern Ireland and Wales, takeaways and sandwich shops (Northern Ireland 98%; Wales 95%) and retail businesses (Northern Ireland 97%; Wales 95%) were more likely to report having FHRS stickers displayed at every entrance. Accommodation businesses and pubs, bars and nightclubs on the other hand were less likely to report displaying stickers at every entrance in both countries (Northern Ireland 80%; Wales 75%).
Reasons for not displaying in England
Businesses in England that said that they did not display their FHRS sticker in a location where customers could see it from outside or did not display it at all were asked why they did not, as well as what might encourage them to start doing so.
As presented in Figure 5.4, the top three unprompted reasons given by businesses in England for not displaying FHRS stickers were: there being nowhere suitable to show it outdoors (30%); ratings being displayed inside the premises (11%); and having never received a sticker (11%).
Figure 5.4 Reported reasons for not displaying an FHRS sticker, England (unprompted)
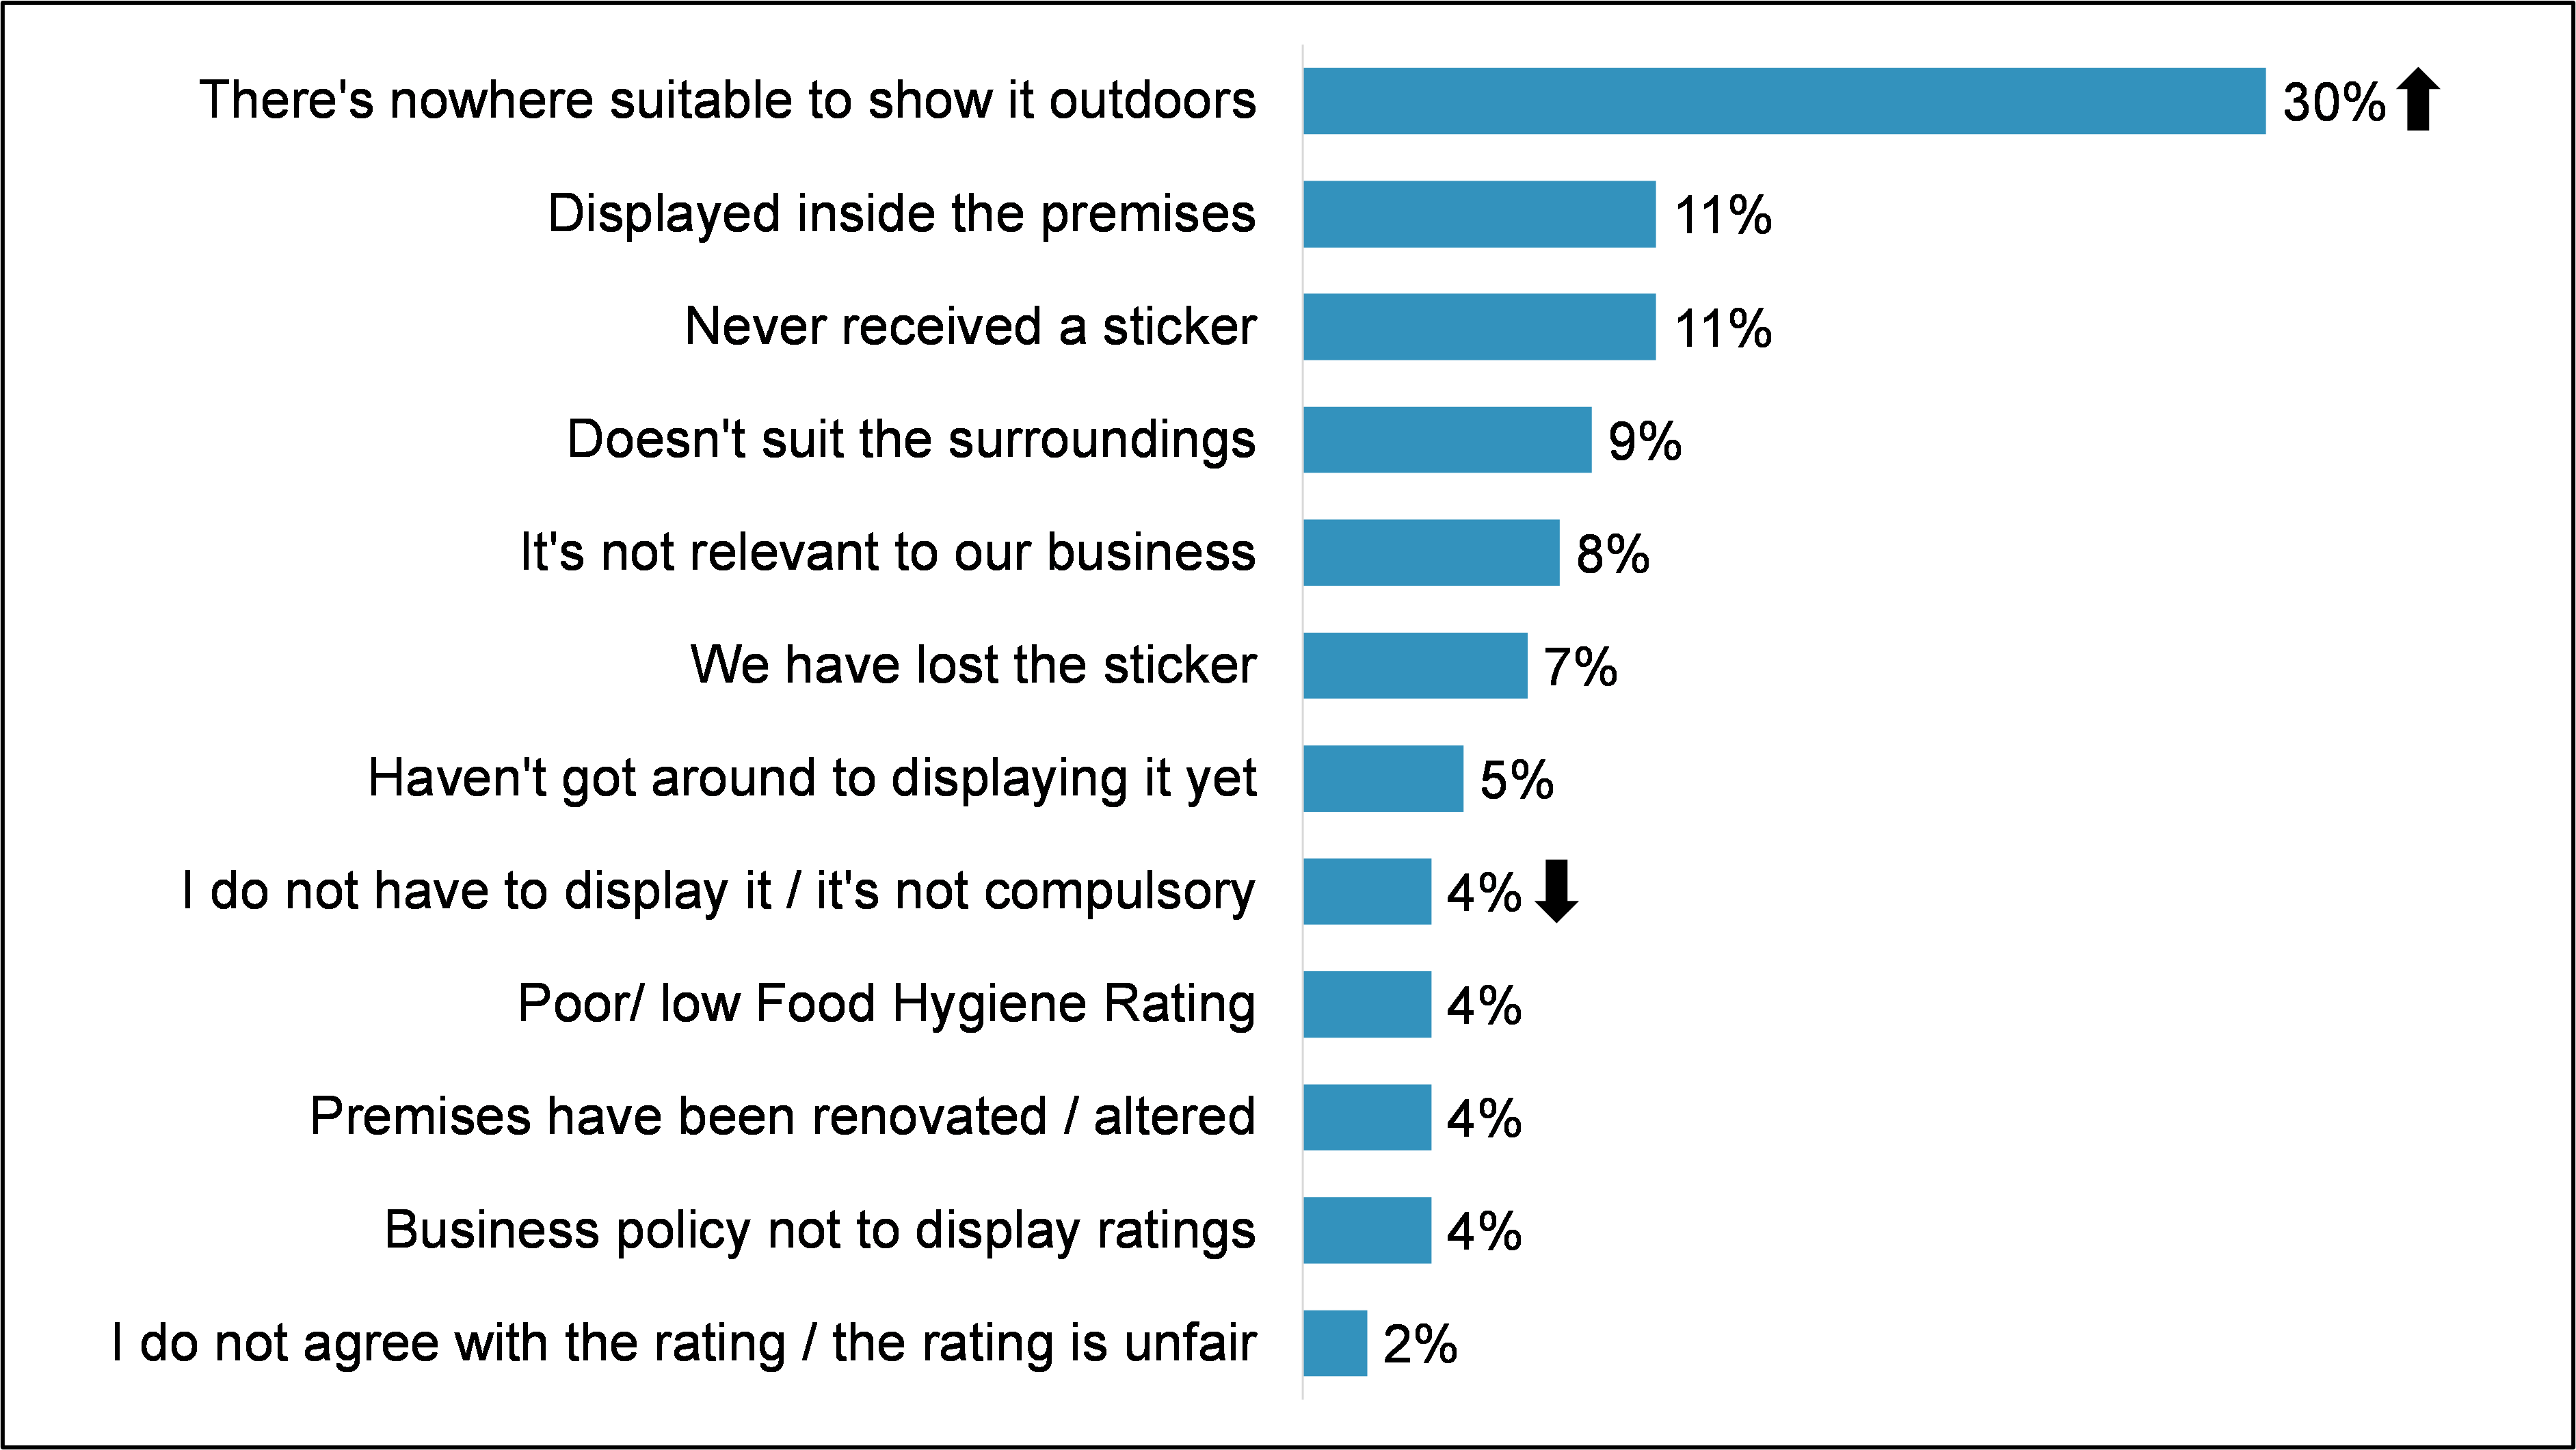
B15. Why is your Food Hygiene Rating not on display where your customers can clearly see it? Base: Businesses that did not display stickers at all or did not display them in a location where customers could see them from outside (England 94). Please note that responses under 2% have not been displayed. ↑ / ↓ denotes a significant difference compared to 2021.
Compared to 2021 there has been a significant increase in the number of businesses that said they did not display their sticker in a location where customers could see it from outside or not at all because there was nowhere suitable to display it outside their premises (30% in 2022 vs 10% in 2021). Conversely, there has been a significant decrease in the number that did not display their sticker because it was not compulsory (4% in 2022 vs 15% in 2021). (footnote 2)
As shown in Figure 5.5, around one in five businesses in England that did not display their FHRS sticker in a location where customers could see it from outside or did not display it at all claimed nothing would encourage them do so (21%). Amongst the remainder, although having a low food hygiene rating was not frequently mentioned as a reason for non-display, having a better rating was the most common action that would encourage display (11%). This was closely followed by having an appropriate place to display the sticker (10%), while 9% did not think it was necessary to change their practices because they already displayed their sticker inside their premises. Compared to 2021, there were no significant differences in the actions that would encourage display.
Figure 5.5 Actions that may encourage displaying an FHRS sticker
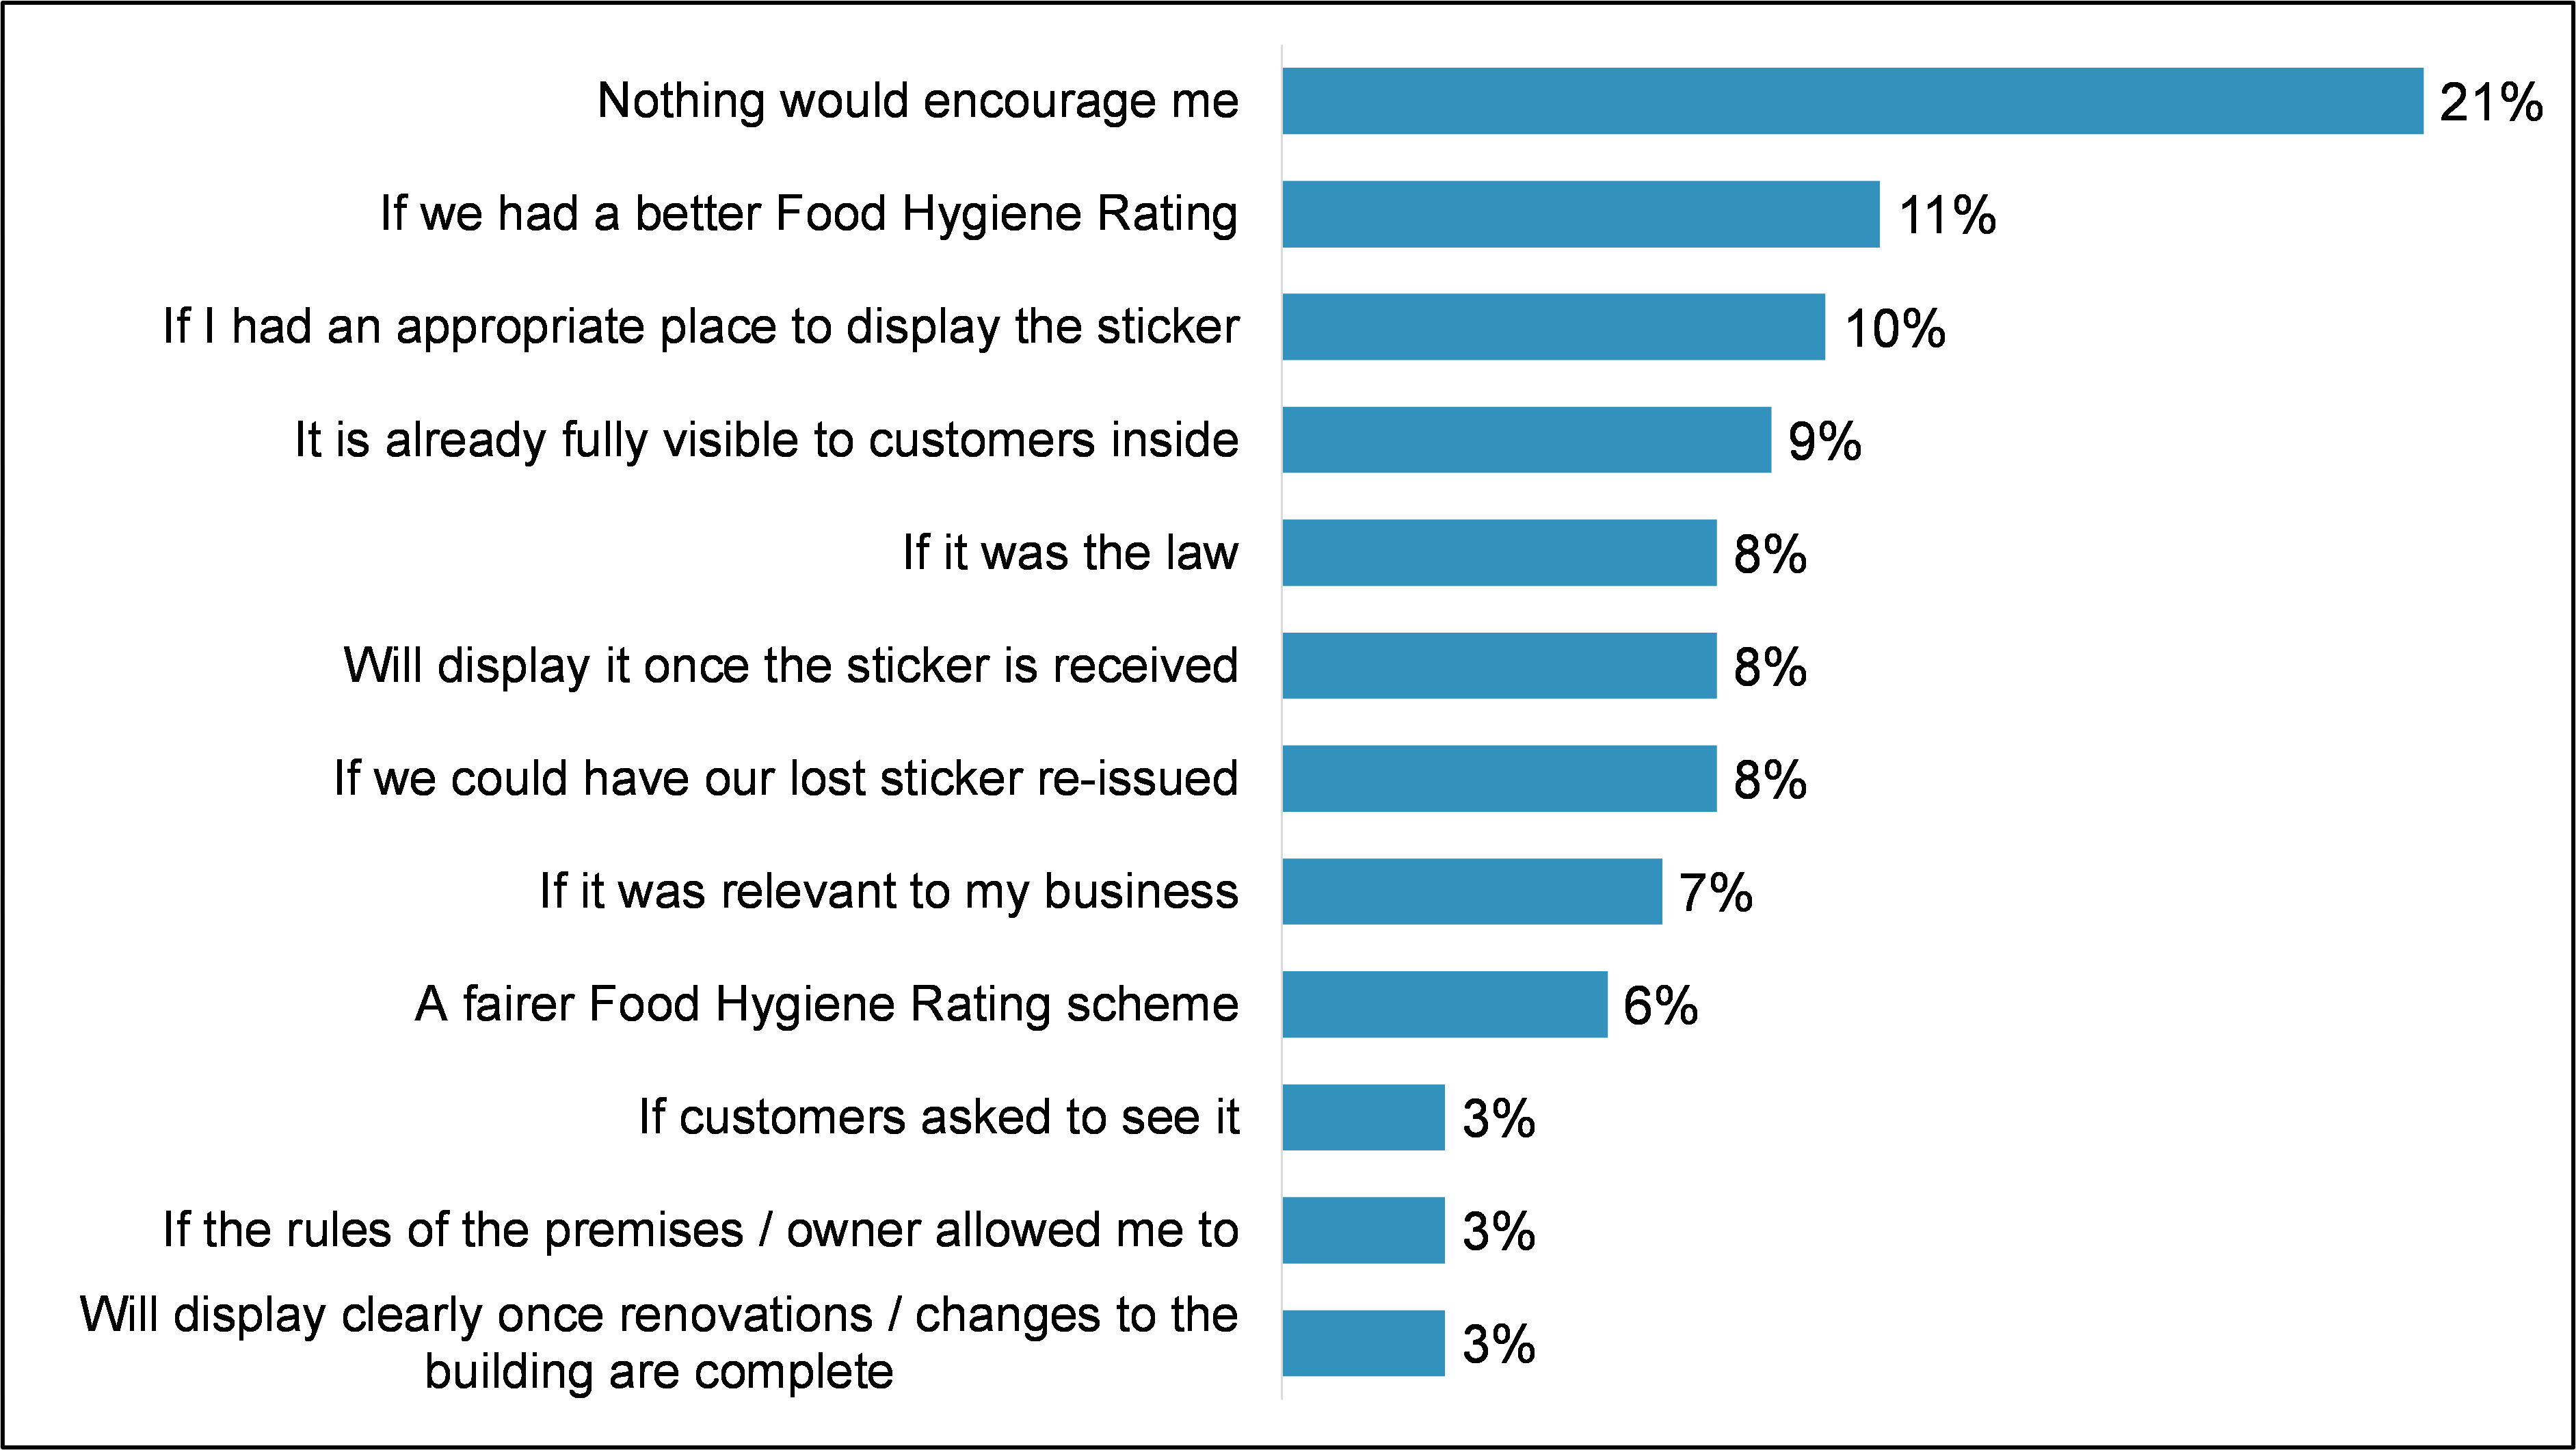
Nothing would encourage me 21%, If we had a better Food Hygiene Rating 11%, If I had an appropriate place to display the sticker 10%, It is already fully visible to customers inside 9%, If it was the law 8%, Will display it once the sticker is received 8%, If we could have our lost sticker re-issued 8%, If it was relevant to my business 7%, A fairer Food Hygiene Rating scheme 6%, If customers asked to see it 3%, If the rules of the premises / owner allowed me to 3%, Will display clearly once renovations / changes to the building are complete 3%.
B16. What would encourage you to display your Food Hygiene Rating where customers could clearly see it? Base: Businesses that did not display stickers at all or did not display them in a location where customers could see it from outside (England 94). Please note that responses under 3% have not been displayed.
Online display
All businesses were asked whether customers can order food from their business through a third party website/ app (such as JustEat, UberEATS or Deliveroo), through an ordering function on their own website, or through their social media accounts (such as Instagram, Twitter or, Facebook).
As displayed in Figure 5.6, only a minority of businesses typically used online platforms to sell food to customers. Platforms used varied by country; third-party website/apps were more common in England (23% enabled their customers to order food this way) than Northern Ireland (11%) and Wales (13%). Businesses in Northern Ireland and Wales more commonly used an ordering function on their own website (15% and 17% respectively),
Figure 5.6 Proportion of business where customers can order food through the following online platforms
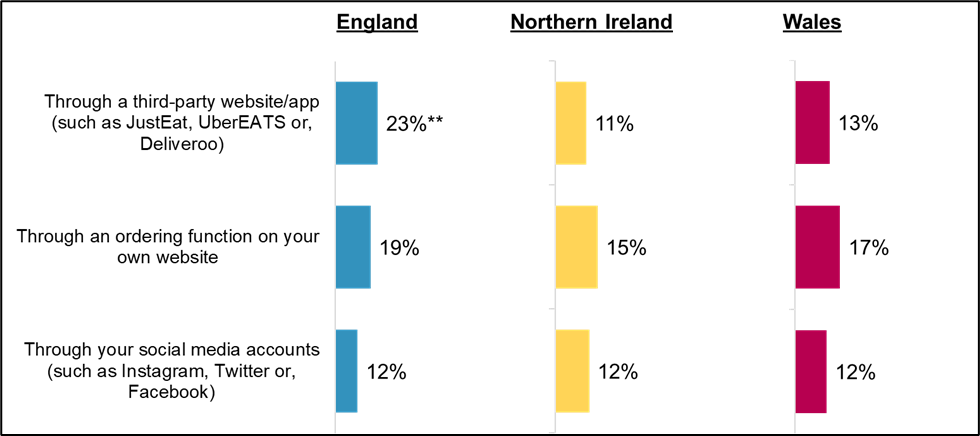
England: Through a third-party website/app (such as JustEat, UberEATS or Deliveroo): 23%, Through an ordering function on your own website: 19%, Through your social media accounts (such as Instagram, Twitter or Facebook): 12% Northern Ireland: Through a third-party website/app (such as JustEat, UberEATS or Deliveroo): 11%, Through an ordering function on your own website: 15%, Through your social media accounts (such as Instagram, Twitter or Facebook): 12% Wales: Through a third-party website/app (such as JustEat, UberEATS or Deliveroo): 13%, Through an ordering function on your own website: 17%, Through your social media accounts (such as Instagram, Twitter or Facebook): 12%
A4.X. Can customers order food from your business in any of the following ways...X: ‘Yes’ Base: All FBOs (England 500; NI 500; Wales 500).
** Denotes significantly higher compared to both Northern Ireland and Wales.
Food businesses who use an aggregator were asked which delivery service websites/ apps customers can order their food from UberEATS, Just Eat and Deliveroo were the most commonly used platforms across all countries, as shown in Figure 5.7. While in England these platforms were used broadly evenly, Just Eat was somewhat more common in Wales, and in particular, Northern Ireland.
Figure 5.7 Most common online food selling platform

A5. What delivery service websites/apps can customers use to order food from your business? Base: FBOs who use an aggregator (England 105; NI 55; Wales 60).
Food businesses who use social media were asked specifically which social media platforms customers can use to order food from specifically. Most used Facebook (91% in England, and Wales; 90% in Northern Ireland), while Instagram was used by around a third (34% England, 31% Northern Ireland and 32% in Wales).
As presented on the left hand side of Figure 5.8, a minority of all businesses reported displaying their food hygiene rating online in England (29%), Northern Ireland (25%) and Wales (29%). Among those who allow customers to order food via a third party application or website, through their own website or via social media (for simplicity: ‘those who sell food online’) this figure increased to two in five in each nation.
Figure 5.8 Proportion of food businesses reporting display of food hygiene ratings online

England: FBOS who display their FHRS rating online: 29%, FBOS who display their FHRS rating online and can order food through a third party, their own website or through social media: 39% Northern Ireland: FBOS who display their FHRS rating online: 25%, FBOS who display their FHRS rating online and can order food through a third party, their own website or through social media: 40% Wales: FBOS who display their FHRS rating online: 29%, FBOS who display their FHRS rating online and can order food through a third party, their own website or through social media: 40%
B18A. Do you display your Food Hygiene Rating online? Base: Businesses aware of FHRS rating (England: 452; Wales; 471; NI: 482) and FBOs who display their FHRS rating online and can order food through a third party, their own website or through social media (England: 162; Wales; 153; NI: 128).
The potential for subgroup analysis is limited owing to the small sample sizes among food businesses who sell food online. In England, those with a rating of 5 were more likely than average to report displaying their rating online (45% compared to 24% among those with a rating under 5). While similar trends occurred in Northern Ireland and Wales, these were not statistically significant, in part due to lower base sizes. While there were no differences across sectors within this group, if the sample is broadened to include all those that were aware of their FHRS rating there were notable differences. In England, restaurants and catering businesses were more likely to do so (35%). Meanwhile, in Northern Ireland and Wales it was takeaways and sandwich shops that were more likely to (Northern Ireland 36%; Wales 42%). In all three countries retail businesses were less likely than average to display their rating online (England 17%; Northern Ireland 19%; Wales 17%).
Amongst those that reported displaying their rating online, by far the most common platform used was business websites (England 63%; Northern Ireland 48%; Wales 50%). Where businesses sold food via ordering functions on their own website, delivery service websites or apps or social media, most reported displaying their food hygiene ratings on these platforms. However, the base sizes of these questions are low so should be treated with caution (see Table 5.1).
Table 5.1 Reported online platform display split by country
| Online platform | England | Northern Ireland | Wales |
|---|---|---|---|
| Use an ordering function on their own website and display FHRS rating on it | 20 out of 29 | 20 out of 30 | 17 out of 32 |
| Use a third-party delivery website or app and display FHRS rating on it | 25 out of 35 | 12 out of 22 | 21 out of 25 |
| Sell food via social media delivery website and display FHRS rating on it | 16 out of 26 | 19 out of 26 | 12 out of 16 |
B18b. Does your business currently display its Food Hygiene Rating on any of the following online platforms? (see table for base size). NB: data reported as unweighted integers due to low base size.
Amongst those that reported not displaying their rating online, most said they would consider doing so in the future (England 61%; Northern Ireland 53%; Wales 56%). There was little variation in how likely different types of businesses were to consider this within the three countries. However, in Northern Ireland retail businesses were less likely than average to consider doing so (43%) and in Wales those with a rating of 5 were more likely to consider doing so (60%).
-
It should be noted that the results for Northern Irish and Welsh food businesses may be affected by a self-report bias due to the statutory requirement to display FHRS stickers in these countries.
-
Base sizes are relatively small here, which is why we show businesses that did not display stickers at all (53 in 2022 and 55 in 2021) and those who did not display them in a location where customers could see them from outside (41 in 2022 and 38 in 2021) together. These low base sizes also mean that changes over time should be interpreted with caution.
In Northern Ireland and Wales, food businesses are legally required to display their food hygiene rating sticker in a prominent place, for example at the entrance to their premises. In England, businesses are not legally required to display their rating but are encouraged to do so.
Awareness and attitudes in Northern Ireland and Wales
Most food businesses in Northern Ireland (95%) and Wales (96%) that were aware of their FHRS rating reported being aware of the legal requirement to have their food hygiene rating on display, in line with previous years. In Northern Ireland, accommodation businesses and pubs, bars and nightclubs were less likely than average to be aware of mandatory display (89%).
As illustrated in Figure 6.1, around nine in ten businesses in Northern Ireland (91%) and Wales (89%) felt that the legal requirement to display their food hygiene rating is a good thing, and most believed it is 'very good’ (Northern Ireland: 66%; Wales: 71%). The proportion of businesses in Wales that considered mandatory display to be a good thing was broadly in line with previous years. The proportion in Northern Ireland has remained identical since 2019.
Figure 6.1 Positive attitudes towards mandatory display requirements in Northern Ireland and Wales
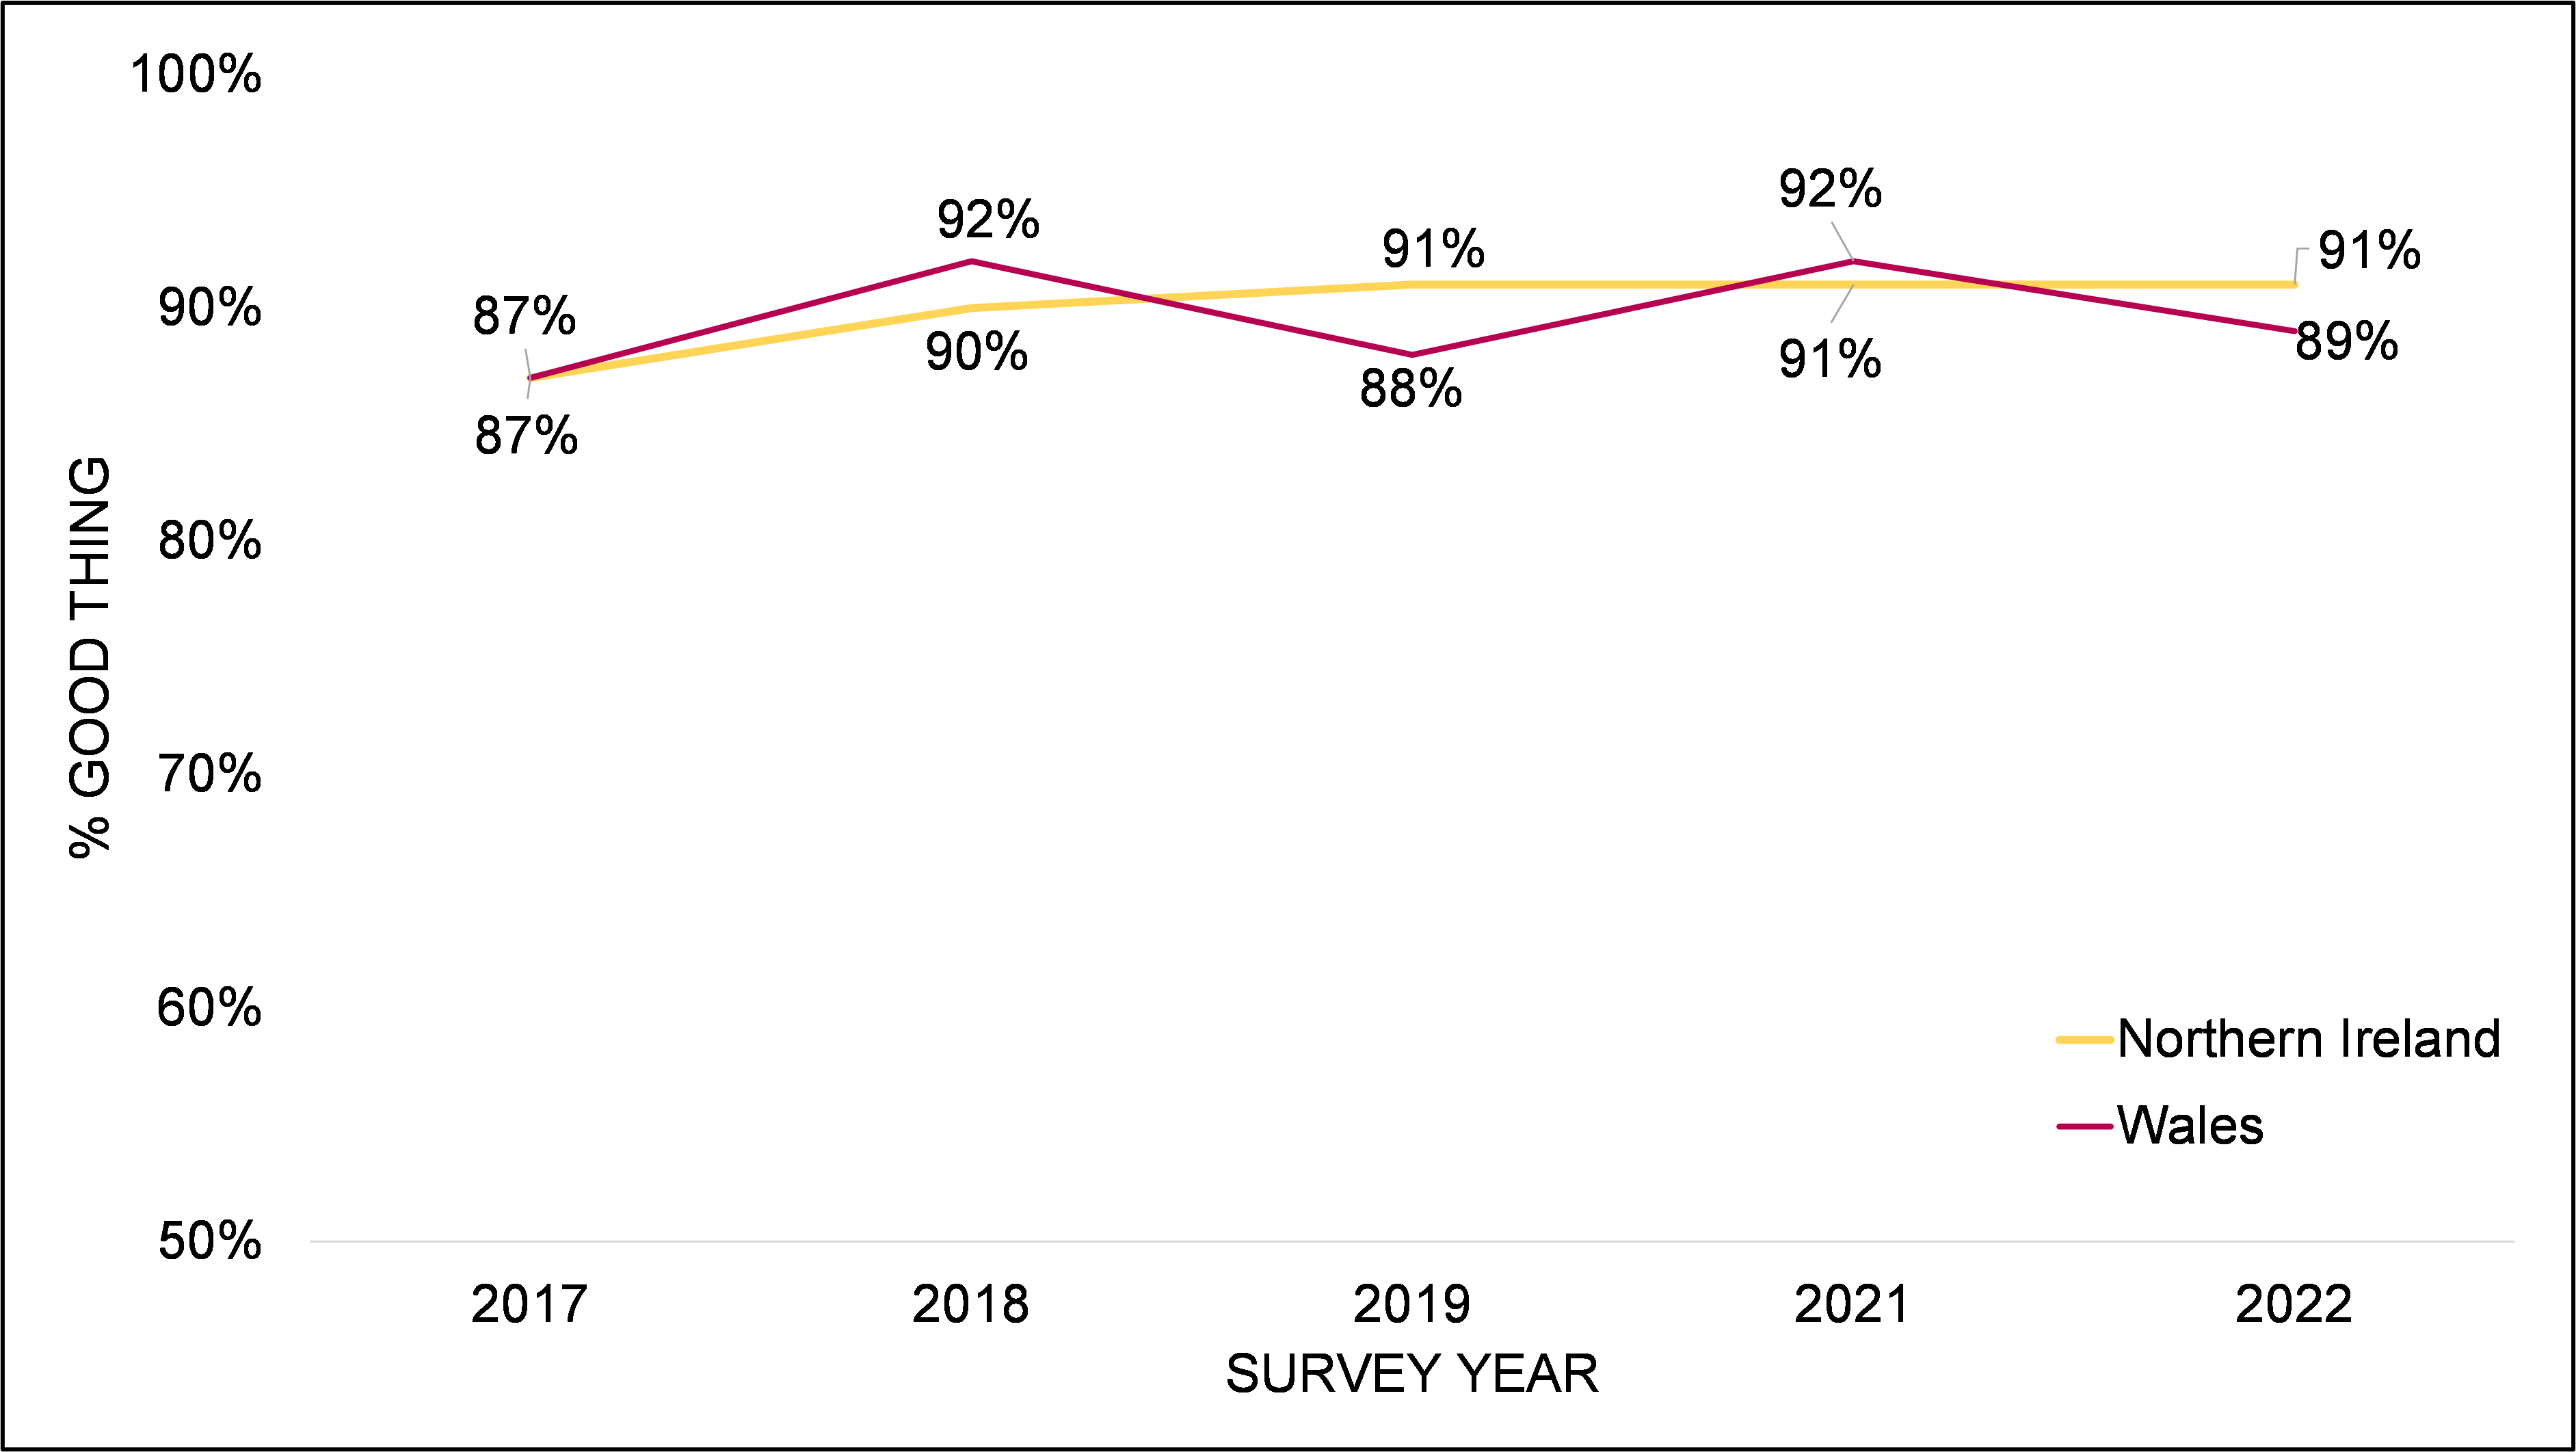
C12. How do you feel generally about the legal requirement to display your Food Hygiene Rating at your premises? Base: FBOs in Wales/NI aware of their FHRS rating (Northern Ireland: 487, Wales: 478).
In both countries, there was evidence of attitudes towards mandatory display varying by sector. In Northern Ireland, takeaways and sandwich shops were more likely than average to consider mandatory display a good thing (97%). Meanwhile, in Wales, accommodation businesses and pubs, bars and nightclubs were less likely than average to consider mandatory display a good thing (84%).
Positive attitudes towards mandatory display typically centred around the theme of transparency to customers of hygiene standards and business promotion. Specifically, as presented in Figure 6.2, the top three reasons were the view that it is important to be transparent about food hygiene (Northern Ireland 38%; Wales 35%), to demonstrate high standards to consumers (Northern Ireland 28%; Wales 28%) and the view that it helps drive businesses to maintain high standards (Northern Ireland 21%; Wales 21%).
Figure 6.2 Reasons for positive attitudes towards mandatory display in Northern Ireland and Wales (Unprompted)
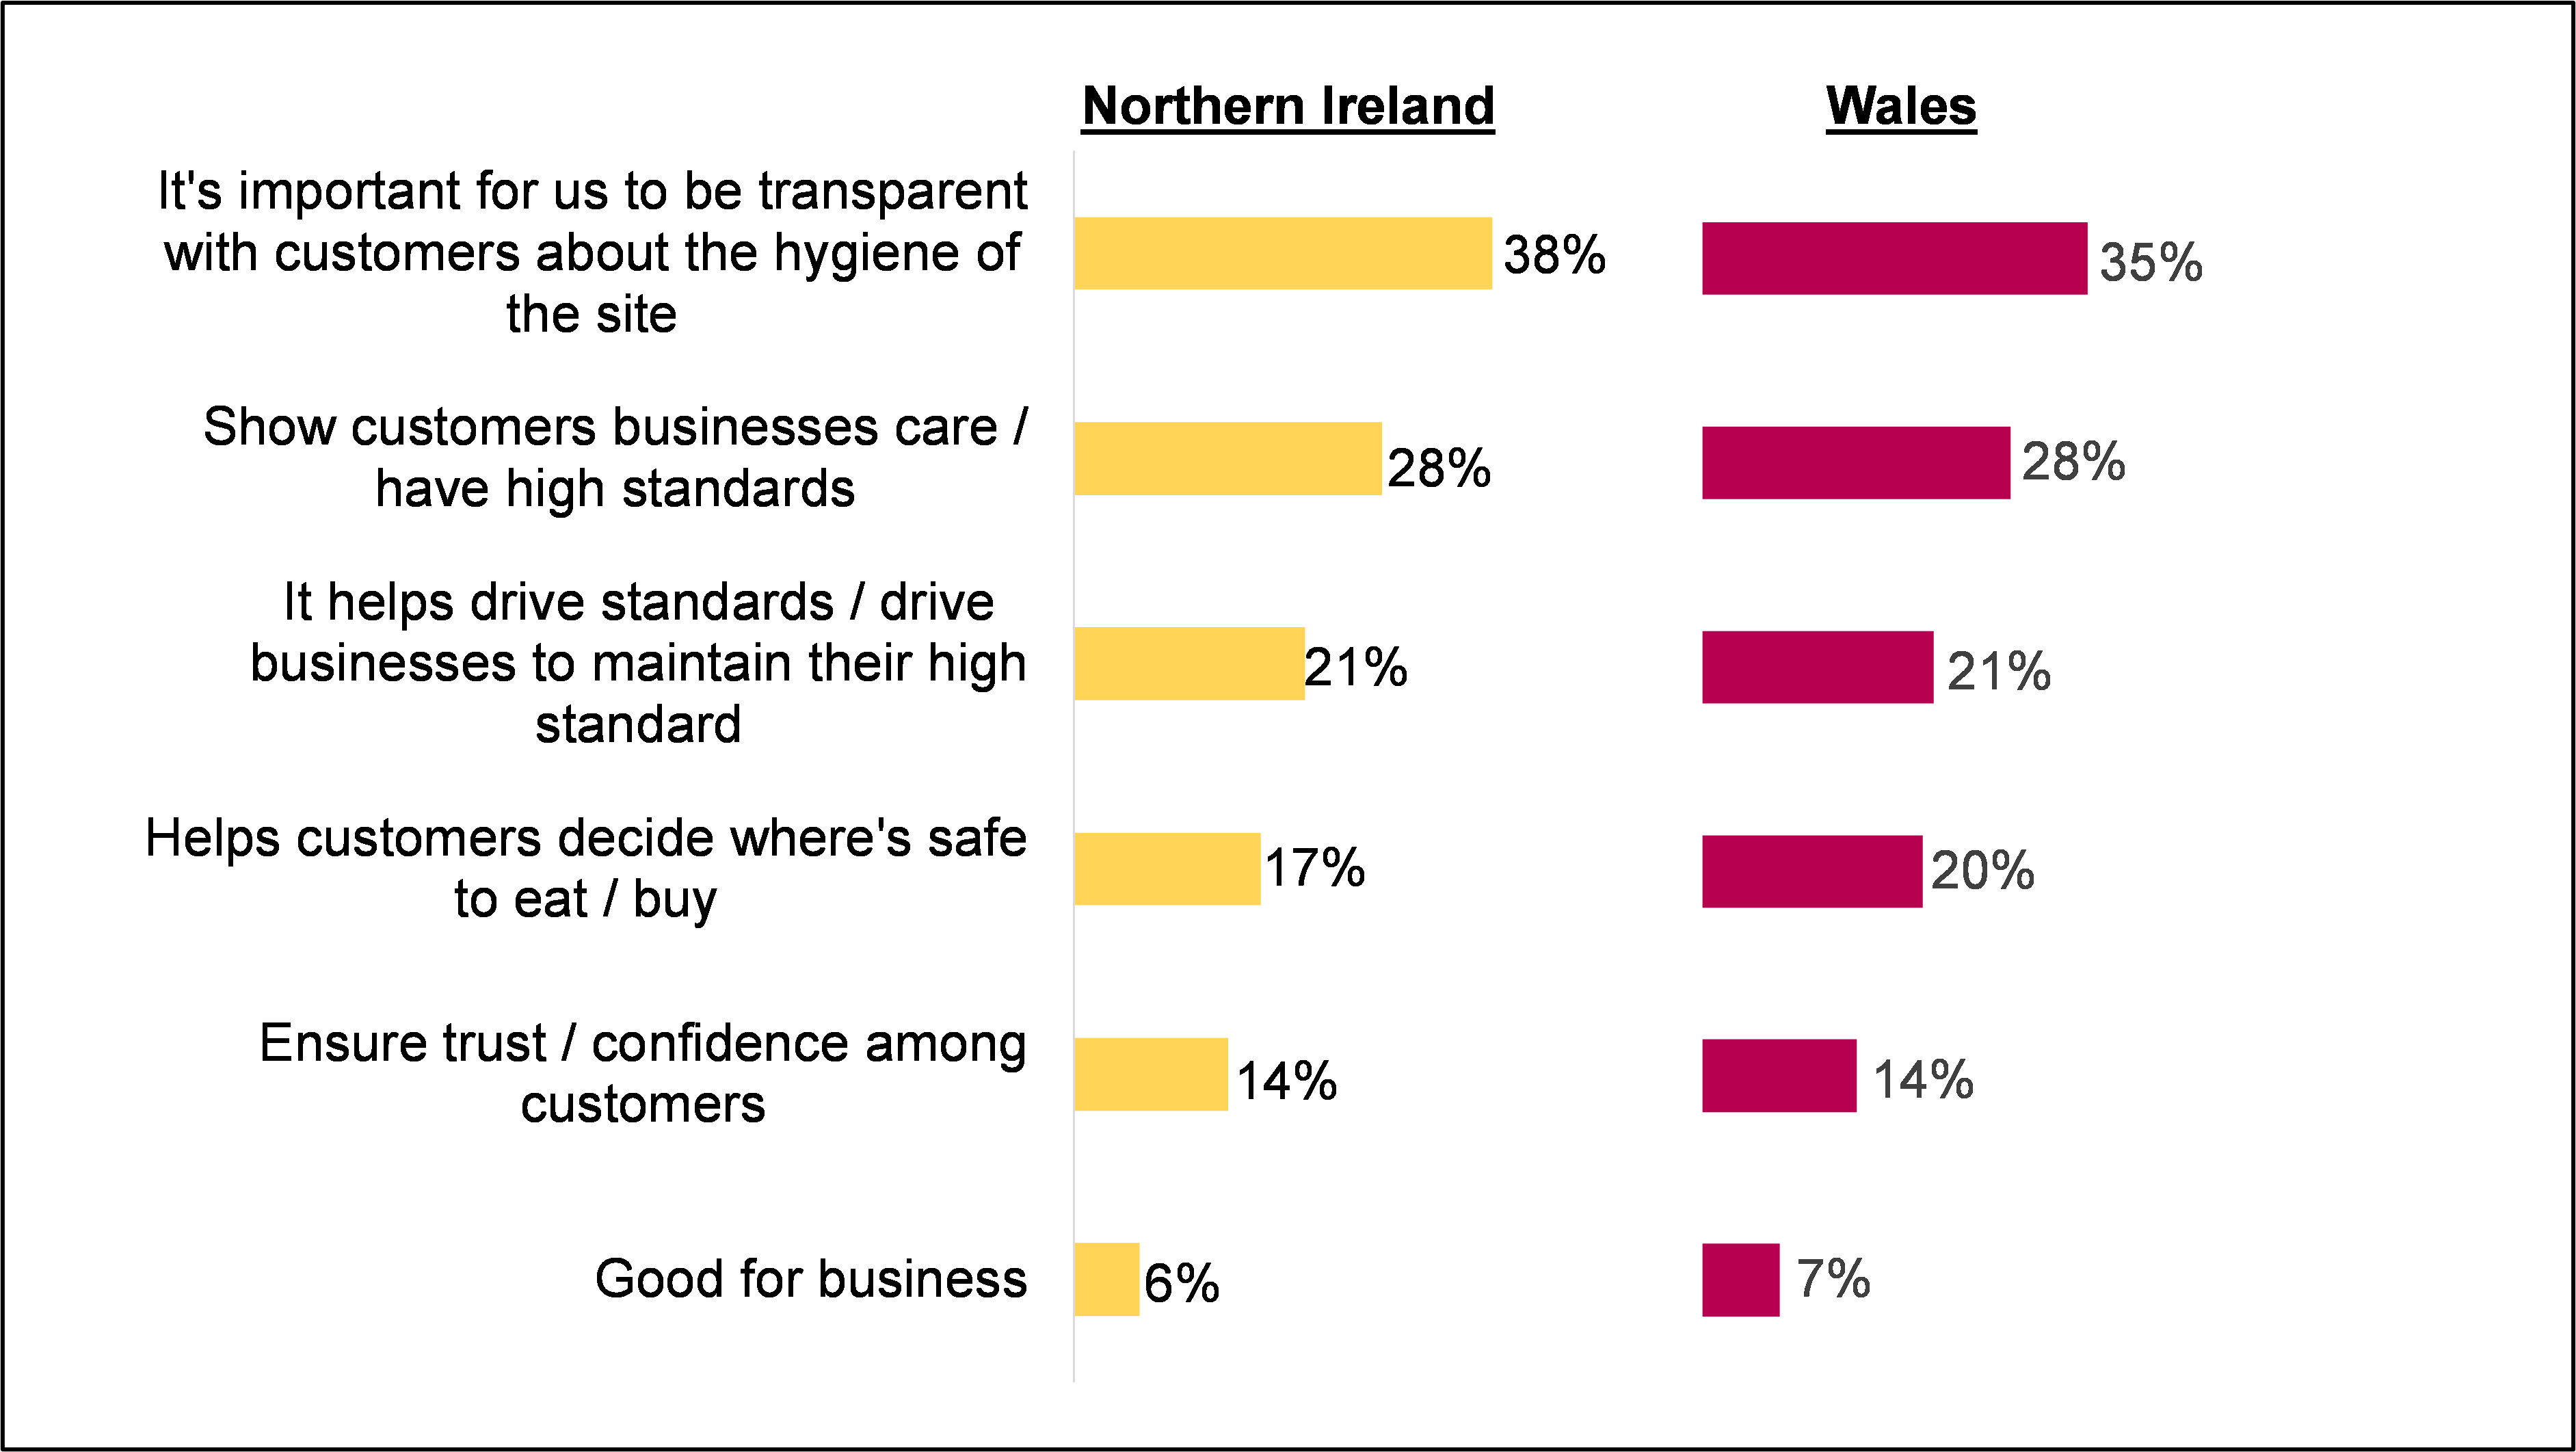
Northern Ireland: It's important for us to be transparent with customers about the hygiene of the site 38%, Show customers businesses care / have high standards 28%, It helps drive standards / drive businesses to maintain their high standard 21%, Helps customers decide where's safe to eat / buy 17%, Ensure trust / confidence among customers 14%, Good for business 6%. Wales: It's important for us to be transparent with customers about the hygiene of the site 35%, Show customers businesses care / have high standards 28%, It helps drive standards / drive businesses maintain their high standard 21%, Helps customers decide where's safe to eat / buy 20%, Ensure trust / confidence among customers 14%, Good for business 7%.
C12A. Why do you feel good about the legal requirement to display your Food Hygiene Rating at your premises? Base: FBOs that think it is good thing that it is a legal requirement to display FHRS in Wales/NI (Northern Ireland: 441, Wales: 424). Please note that responses under 6% have not been displayed.
Amongst the minority of businesses in Northern Ireland and Wales that were neutral or had negative perceptions of mandatory display, this was typically attributed to reservations around the efficacy and fairness of the FHRS:
- in Northern Ireland, of the 40 businesses that did not think mandatory display was good, 13 said that displaying the rating made no difference to their business and 8 felt there were flaws in how ratings are determined.
- similarly, in Wales, of the 50 businesses that did not think mandatory display was good, 13 said that displaying the rating made no difference to their business and 17 felt there were flaws in the way ratings are determined.
Attitudes in England
As presented in Figure 6.3, more than four in five businesses in England (82%) agreed that the introduction of a scheme where they are required by law to display their food hygiene rating was a good idea, with most (61%) considering it to be a ‘very good’ concept. Businesses with a rating of 5 were more likely to have a positive view on the introduction of such a scheme (84%), while those with a rating of 3 or less were less likely (68%). The proportion of businesses in England supporting mandatory display seems to have dipped slightly since 2021 but this difference is not statistically significant.
Figure 6.3 Positive attitudes towards mandatory display in England
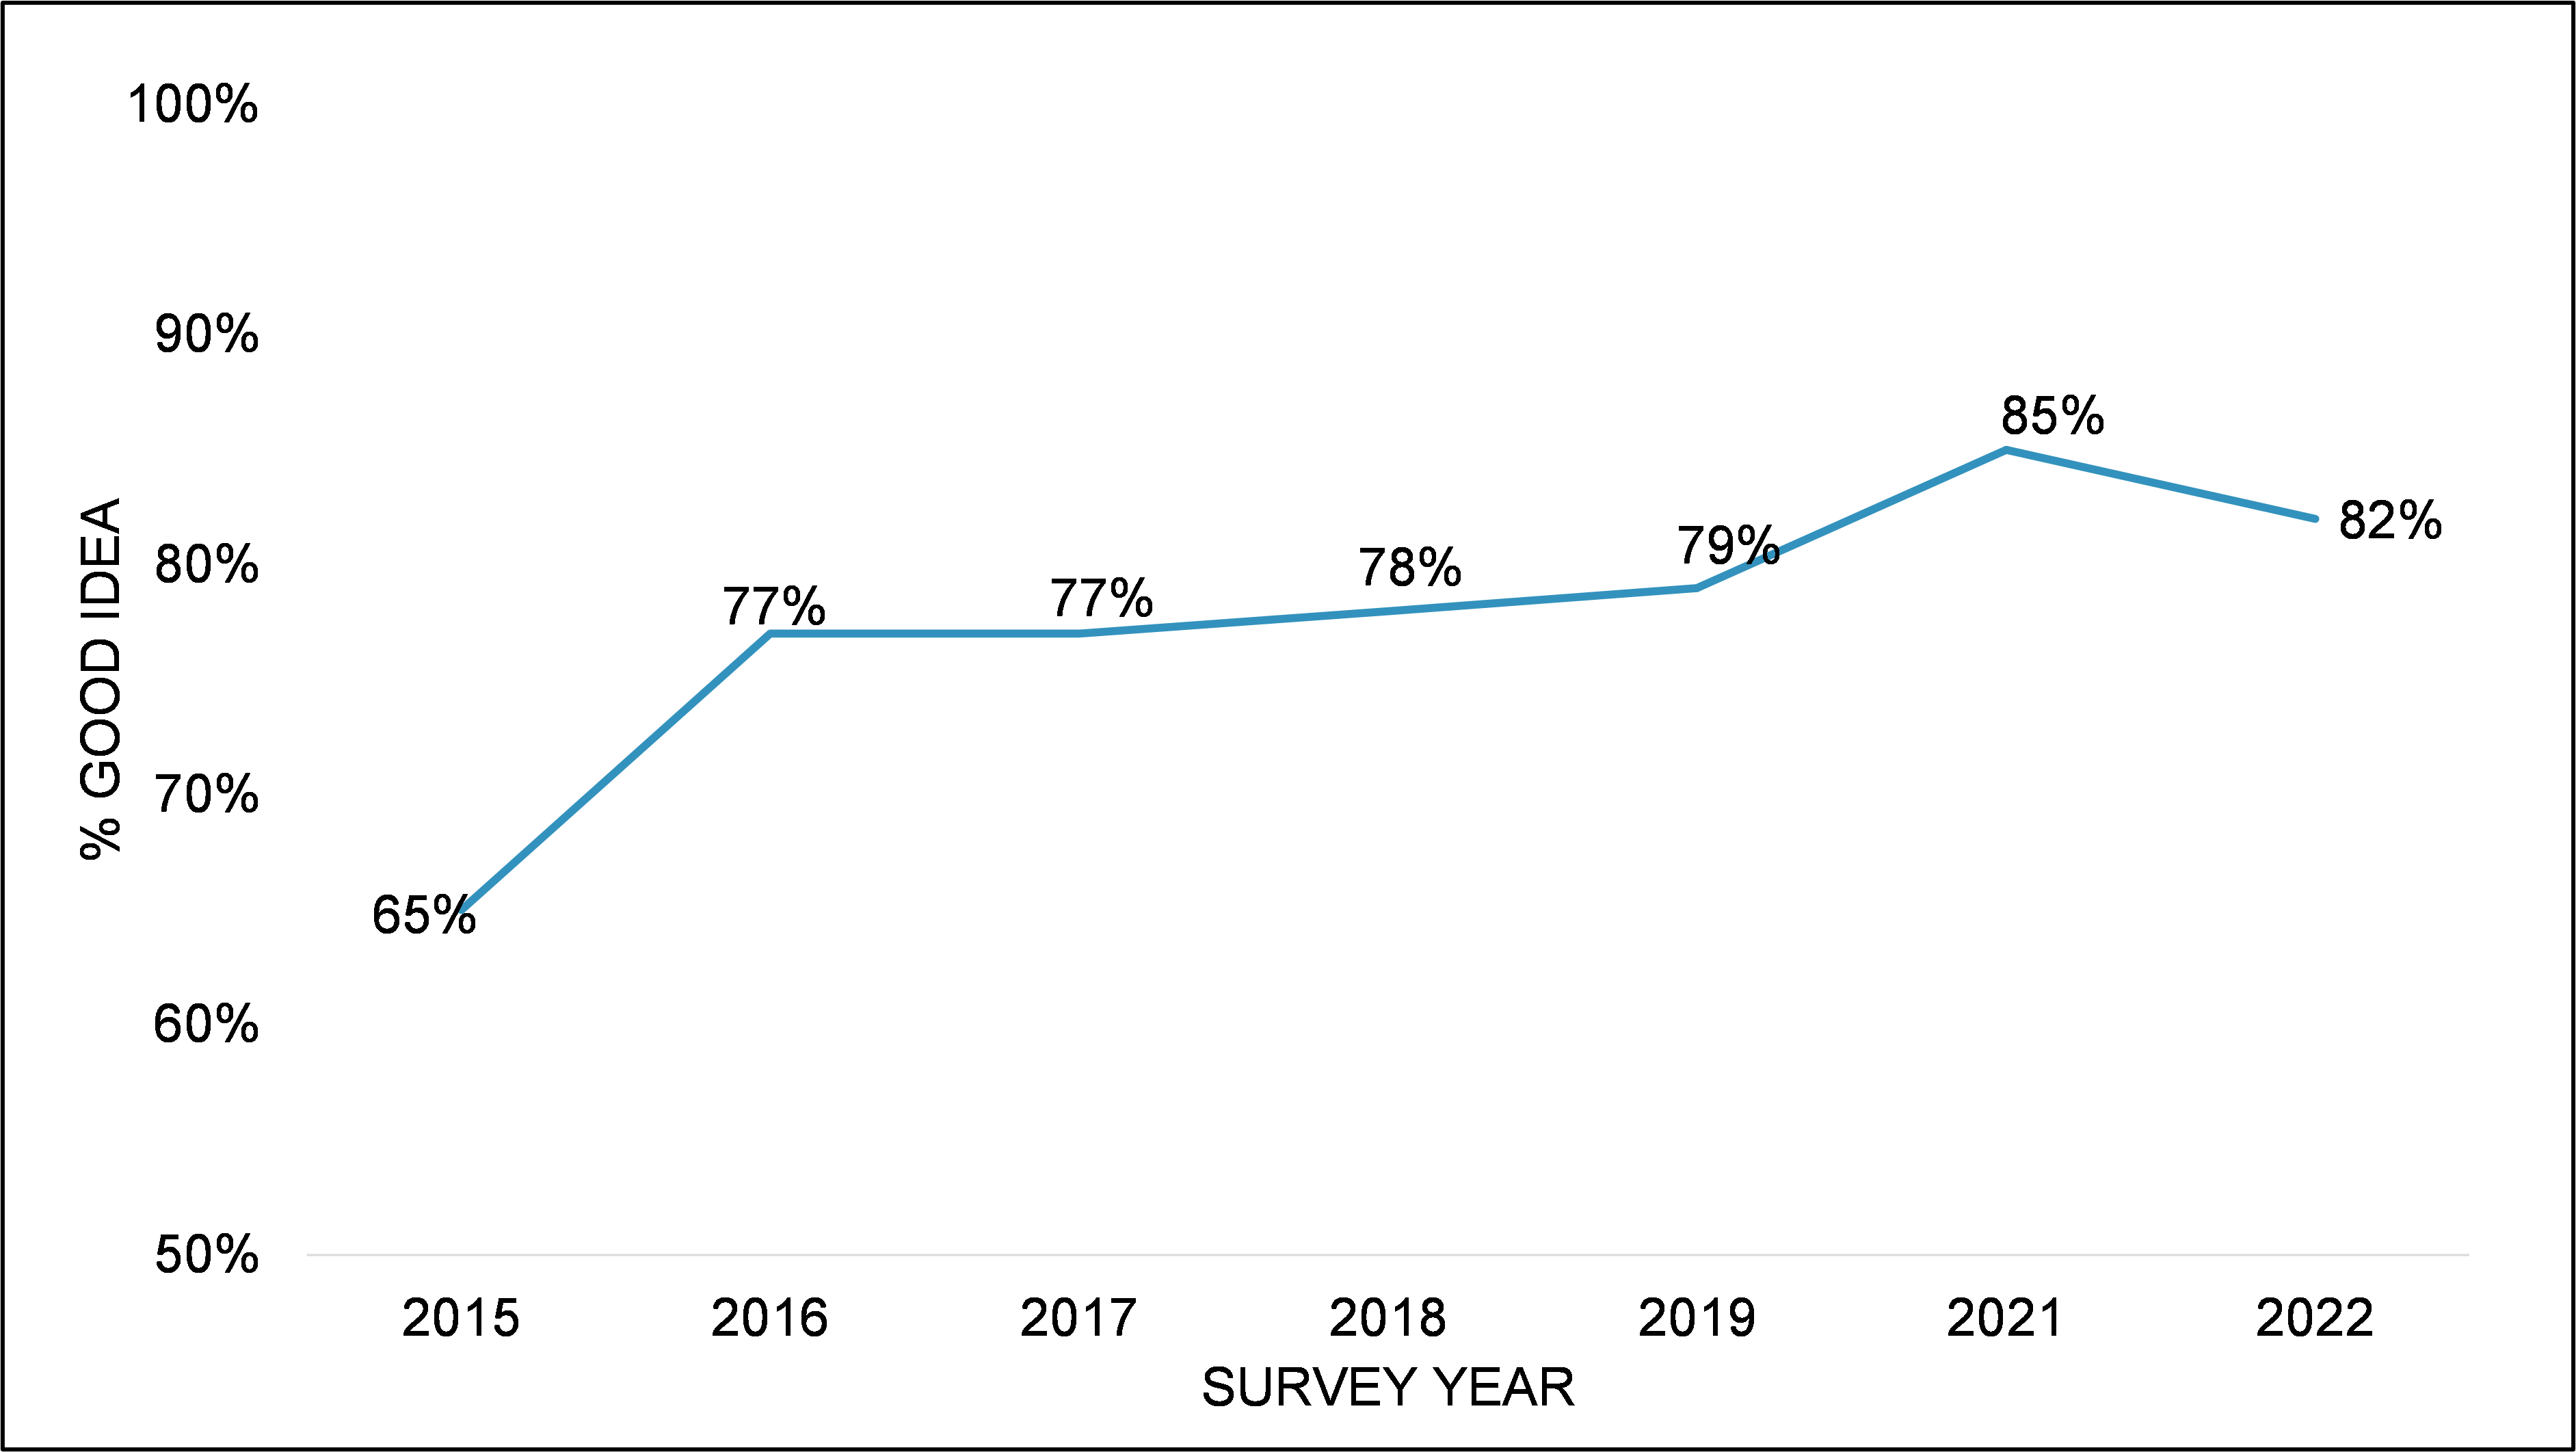
C9. How would you feel if a scheme was introduced where you were required by law to display your Food Hygiene Rating? Base: FBOs in England (465).
Amongst the food businesses in England that had positive views on the introduction of mandatory display, the most common reason was the view that it is important to be transparent about food hygiene (33%). This was also the most common reason in Northern Ireland and Wales. As presented in Figure 6.4, other reasons included helping customers make informed decisions about where is safe to purchase food (21%) and the view that it drives businesses to maintain or improve standards (20%).
"If you don’t display [a rating] it’s misleading. It’s important for transparency; communicating with your customer and giving them the opportunity to ask questions. If fully informed, customers can make a decision.”
Restaurants and catering, England, FHRS rating of 5
“It gives consumers confidence in terms of whether a premises is of a standard they require it to be. It also imposes pressure on business owners to have high standards.”
Retail, England, FHRS rating of 5
“Customers look at ratings, so if a business got anything under a 5 or 4 it would prompt you to improve the standards and procedures to improve the rating.”
Restaurants and catering, England, FHRS rating of 5
Figure 6.4 Reasons for positive attitudes towards mandatory display in England (Unprompted)
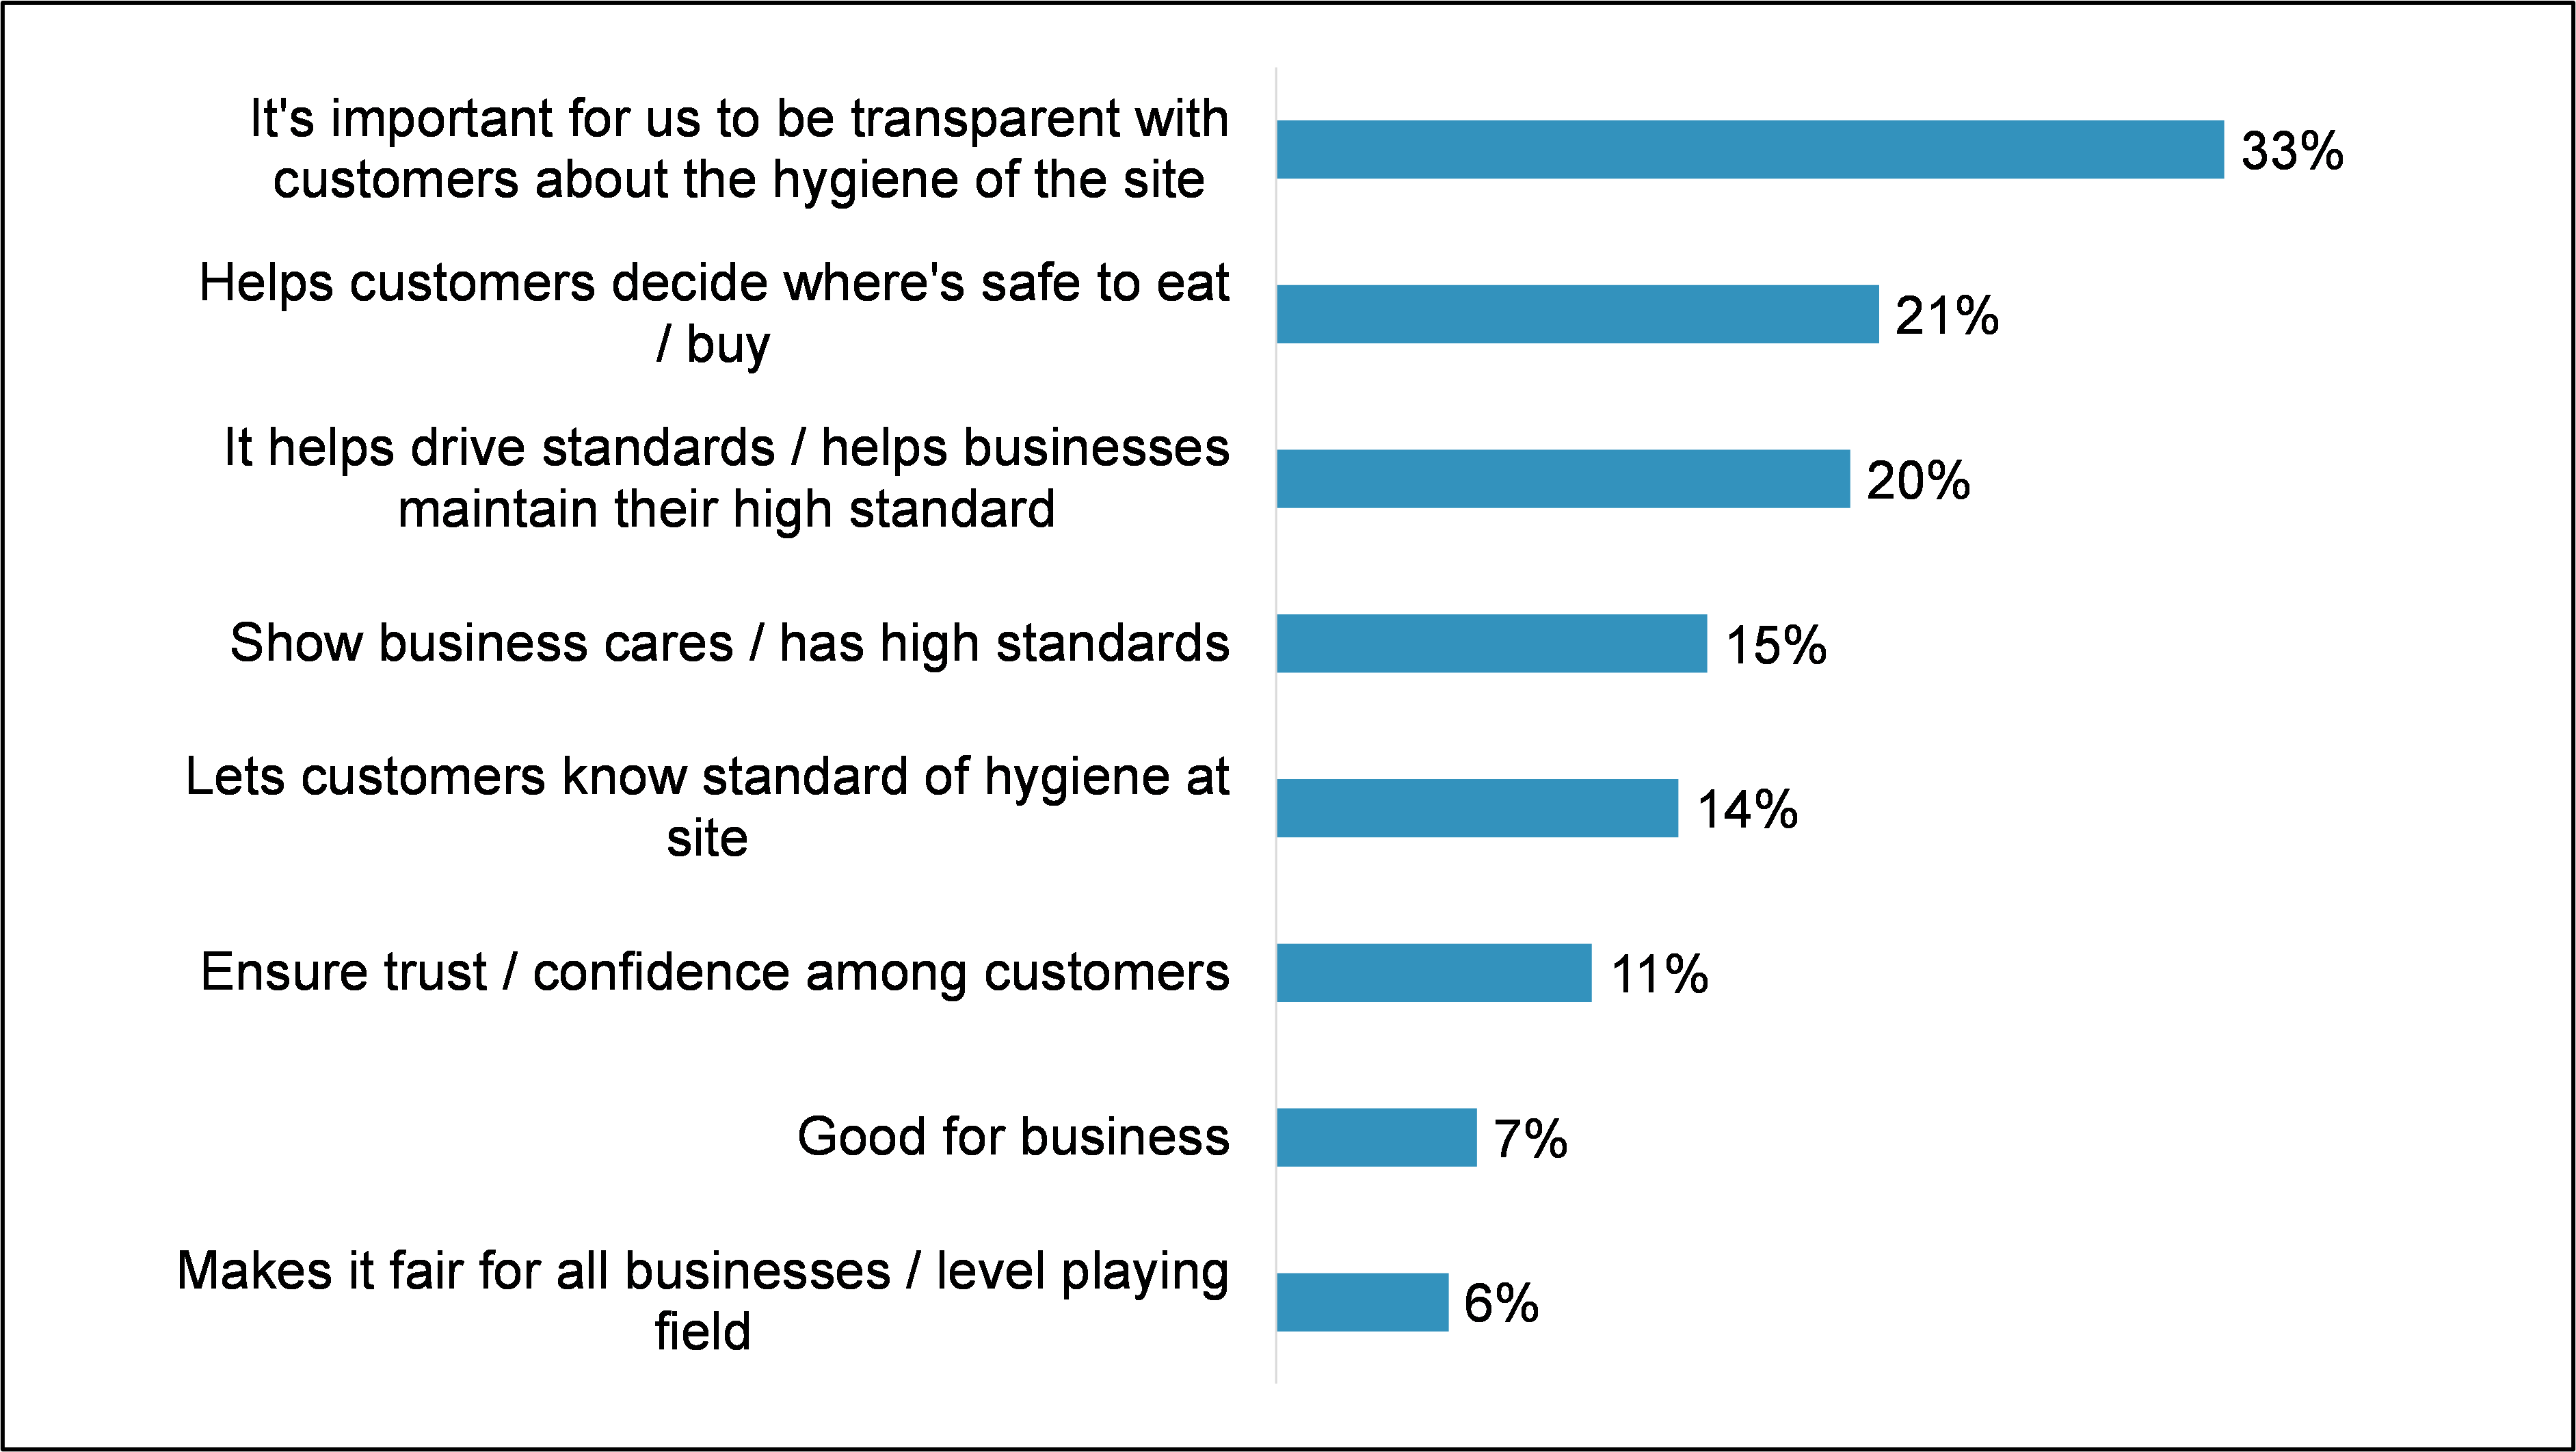
C10B. Why do you say it would be a good thing? Base: FBOs that think it would be a good thing if it was a legal requirement to display FHRS in England (380). Please note this was an open-ended question. Please note that responses under 6% have not been displayed.
As presented in Figure 6.5, amongst food businesses in England that were neutral or had negative perceptions towards the concept of mandatory display, the most common reason for this was because the business already displayed their food hygiene rating and so the introduction of a legal requirement would make no difference to the business (27%). Other reasons included the view that it would be unfair to some businesses (19%) and because of perceived flaws in the way businesses are rated (18%).
Figure 6.5 Reasons given by those businesses reporting negative attitudes towards mandatory display of FHRS ratings in England
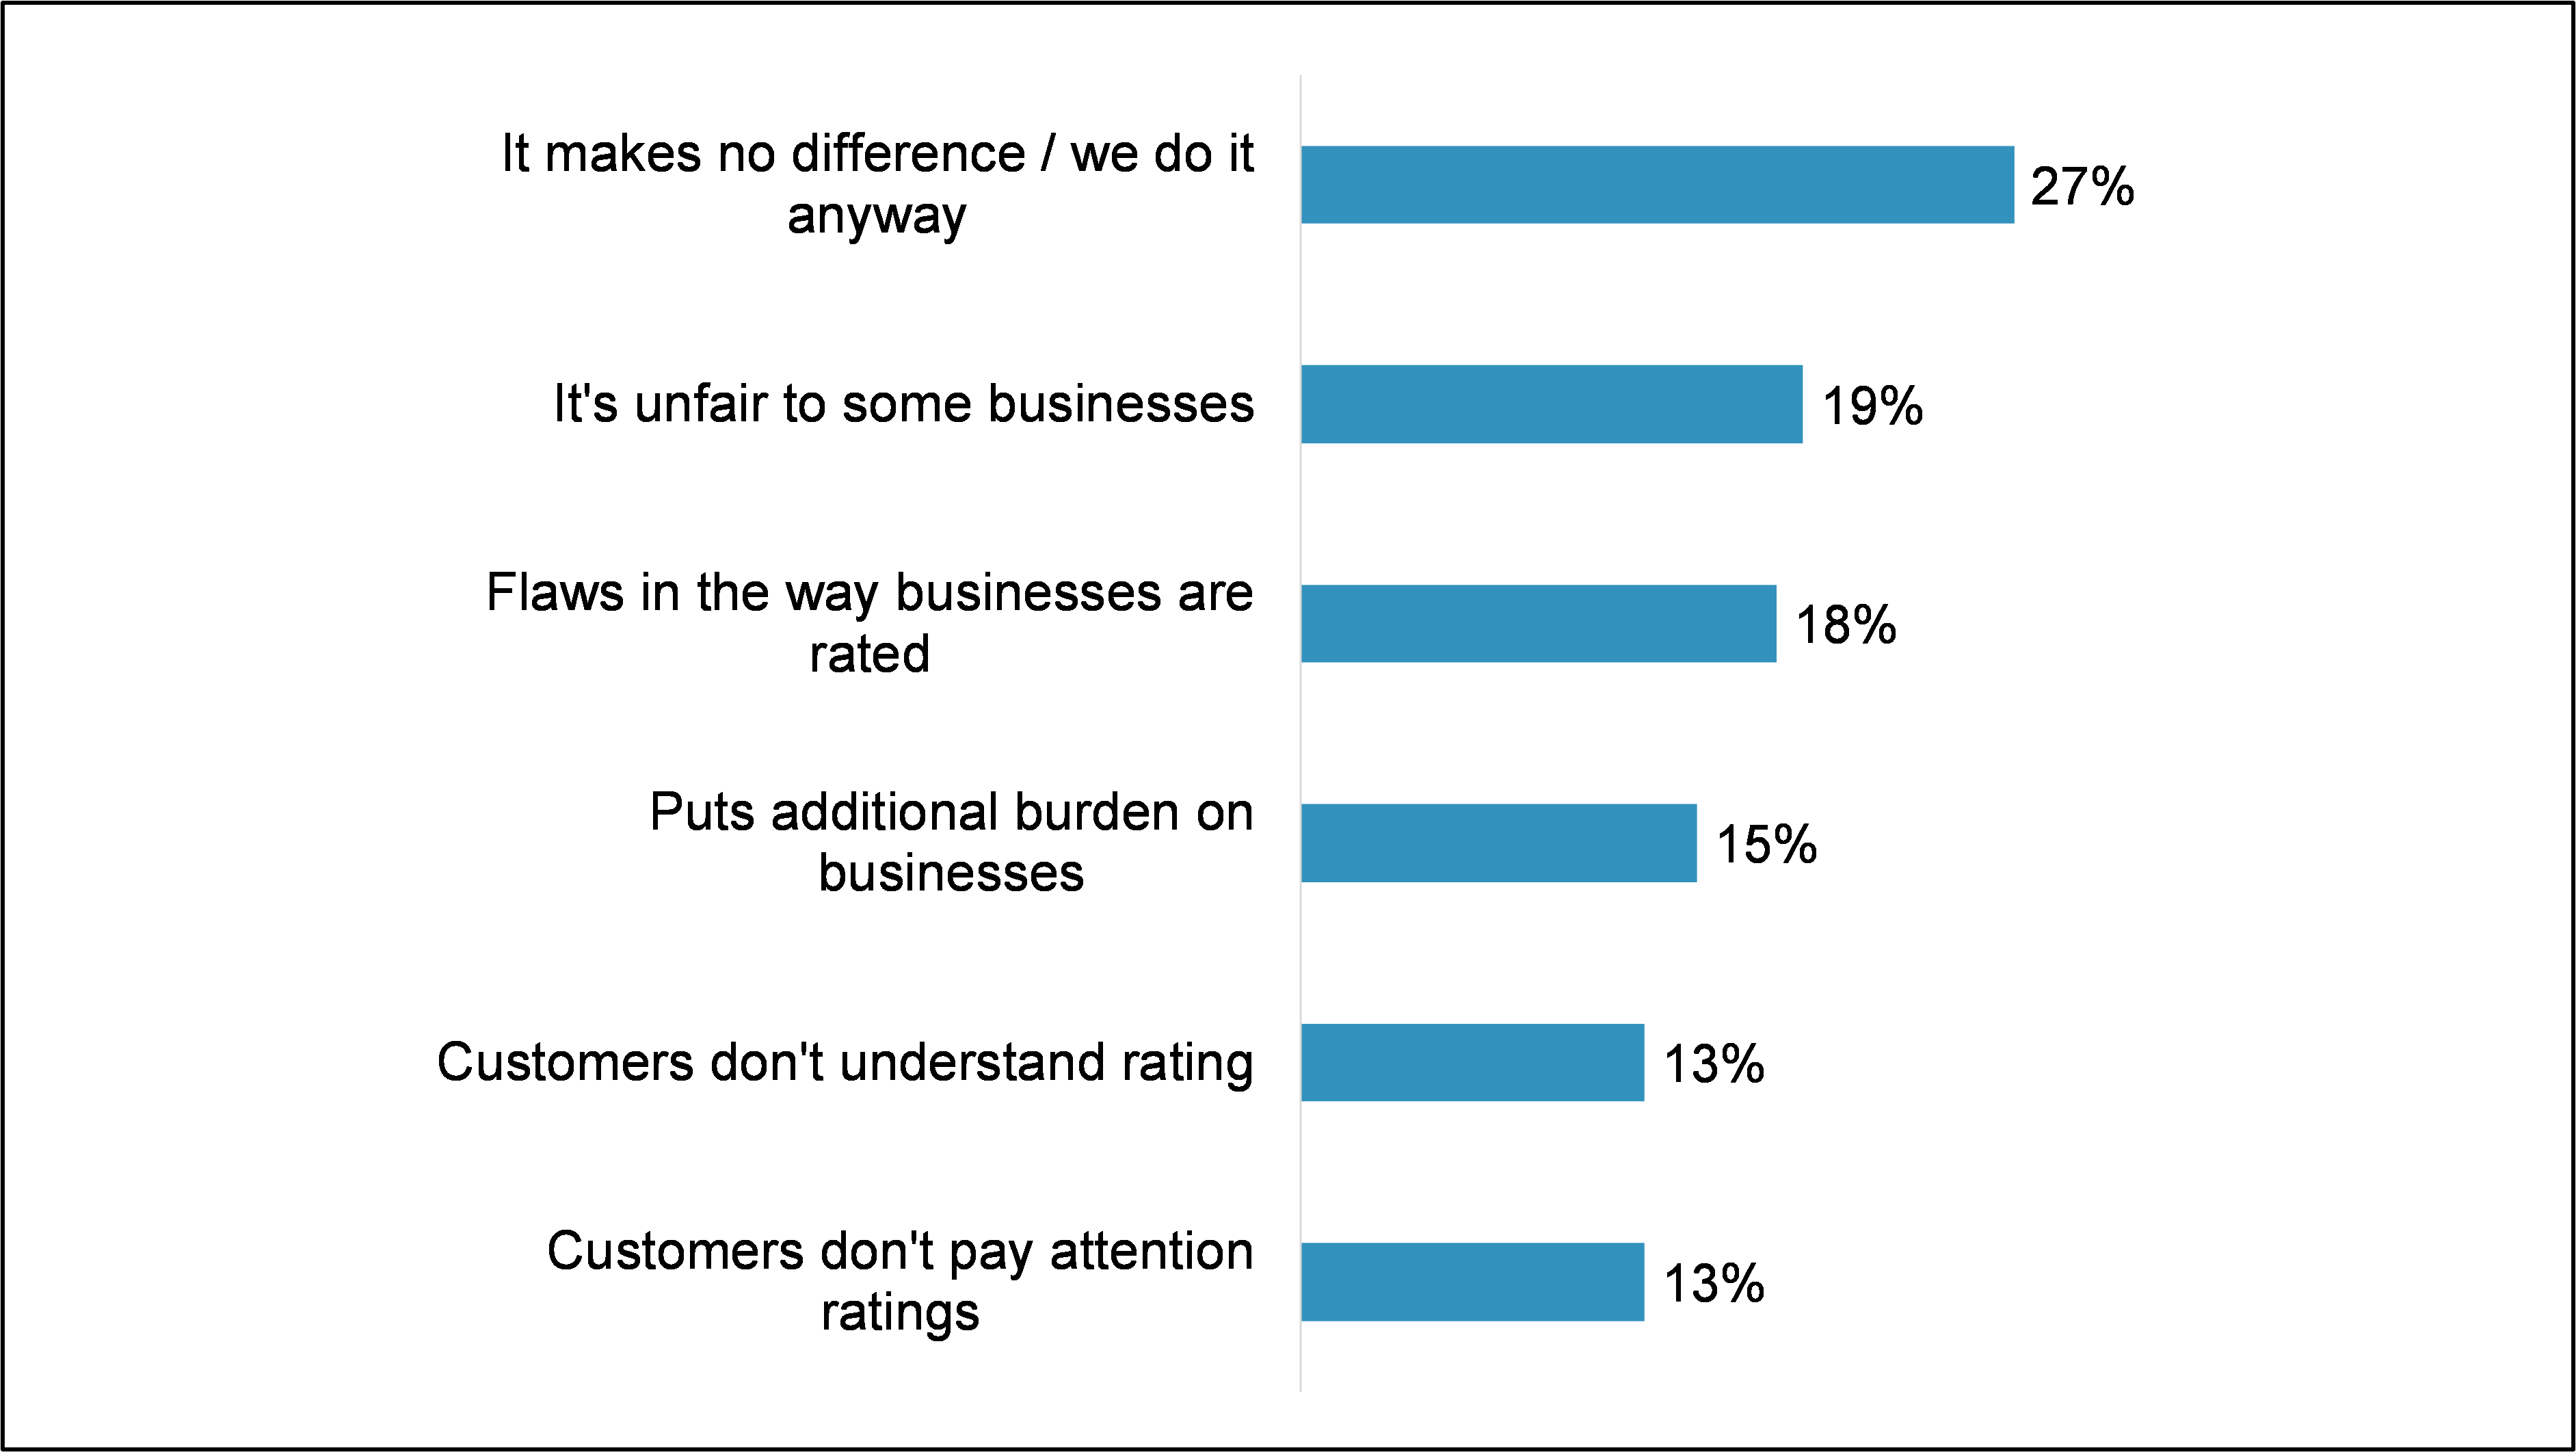
C10A. Why do you say it would be a bad thing? Base: FBOs that think it would not be a good thing if it was a legal requirement to display FHRS in England (80). Please note that responses under 10% have not been displayed.
Attitudes towards mandatory display online
In addition to monitoring attitudes towards mandatory display of food hygiene ratings at physical premises, the research also explored views on whether the display of food hygiene ratings online should be made compulsory. (footnote 1)
Across England, Northern Ireland and Wales, the majority of businesses felt that the display of food hygiene ratings should become mandatory for at least some online platforms (England: 92%; Northern Ireland: 93%; Wales: 93%), with almost half of the opinion that mandatory display should be introduced for all the online platforms they were probed with (footnote 2) (England: 49%; Northern Ireland: 49%; Wales 45%). This marks a significant increase since 2021, where only around one in five businesses felt that mandatory display should be introduced for all platforms (England: 17%; Northern Ireland: 19%; Wales: 19%).
As presented in Figure 6.6, compared to 2021 there has been a significant increase in support for mandatory display across all the online platforms that businesses were probed with. The three platforms where businesses most commonly supported mandatory online display were:
- restaurants and takeaways’ own online ordering facilities (England 83%; Northern Ireland 84%; Wales 83%, up from 68%, 69% and 70% in 2021)
- takeaway ordering aggregators or apps (England: 82%; Northern Ireland: 83%; Wales: 81%, up from 66%, 68% and 70% in 2021)
- websites of restaurants and takeaways (England: 82%; Northern Ireland: 83%; Wales: 80%, up from 66%, 68% and 68% in 2021).
Social media had the lowest level of support, but still more than half of businesses in England (57%), Northern Ireland (59%) and Wales (53%) supported mandatory online display on this platform. Furthermore, compared to 2021, there has been a significant increase in support for mandatory display on social media in England (57% vs 43%) and Northern Ireland (59% vs 46%).
Figure 6.6 Online facilities that should be required by law to display Food Hygiene ratings
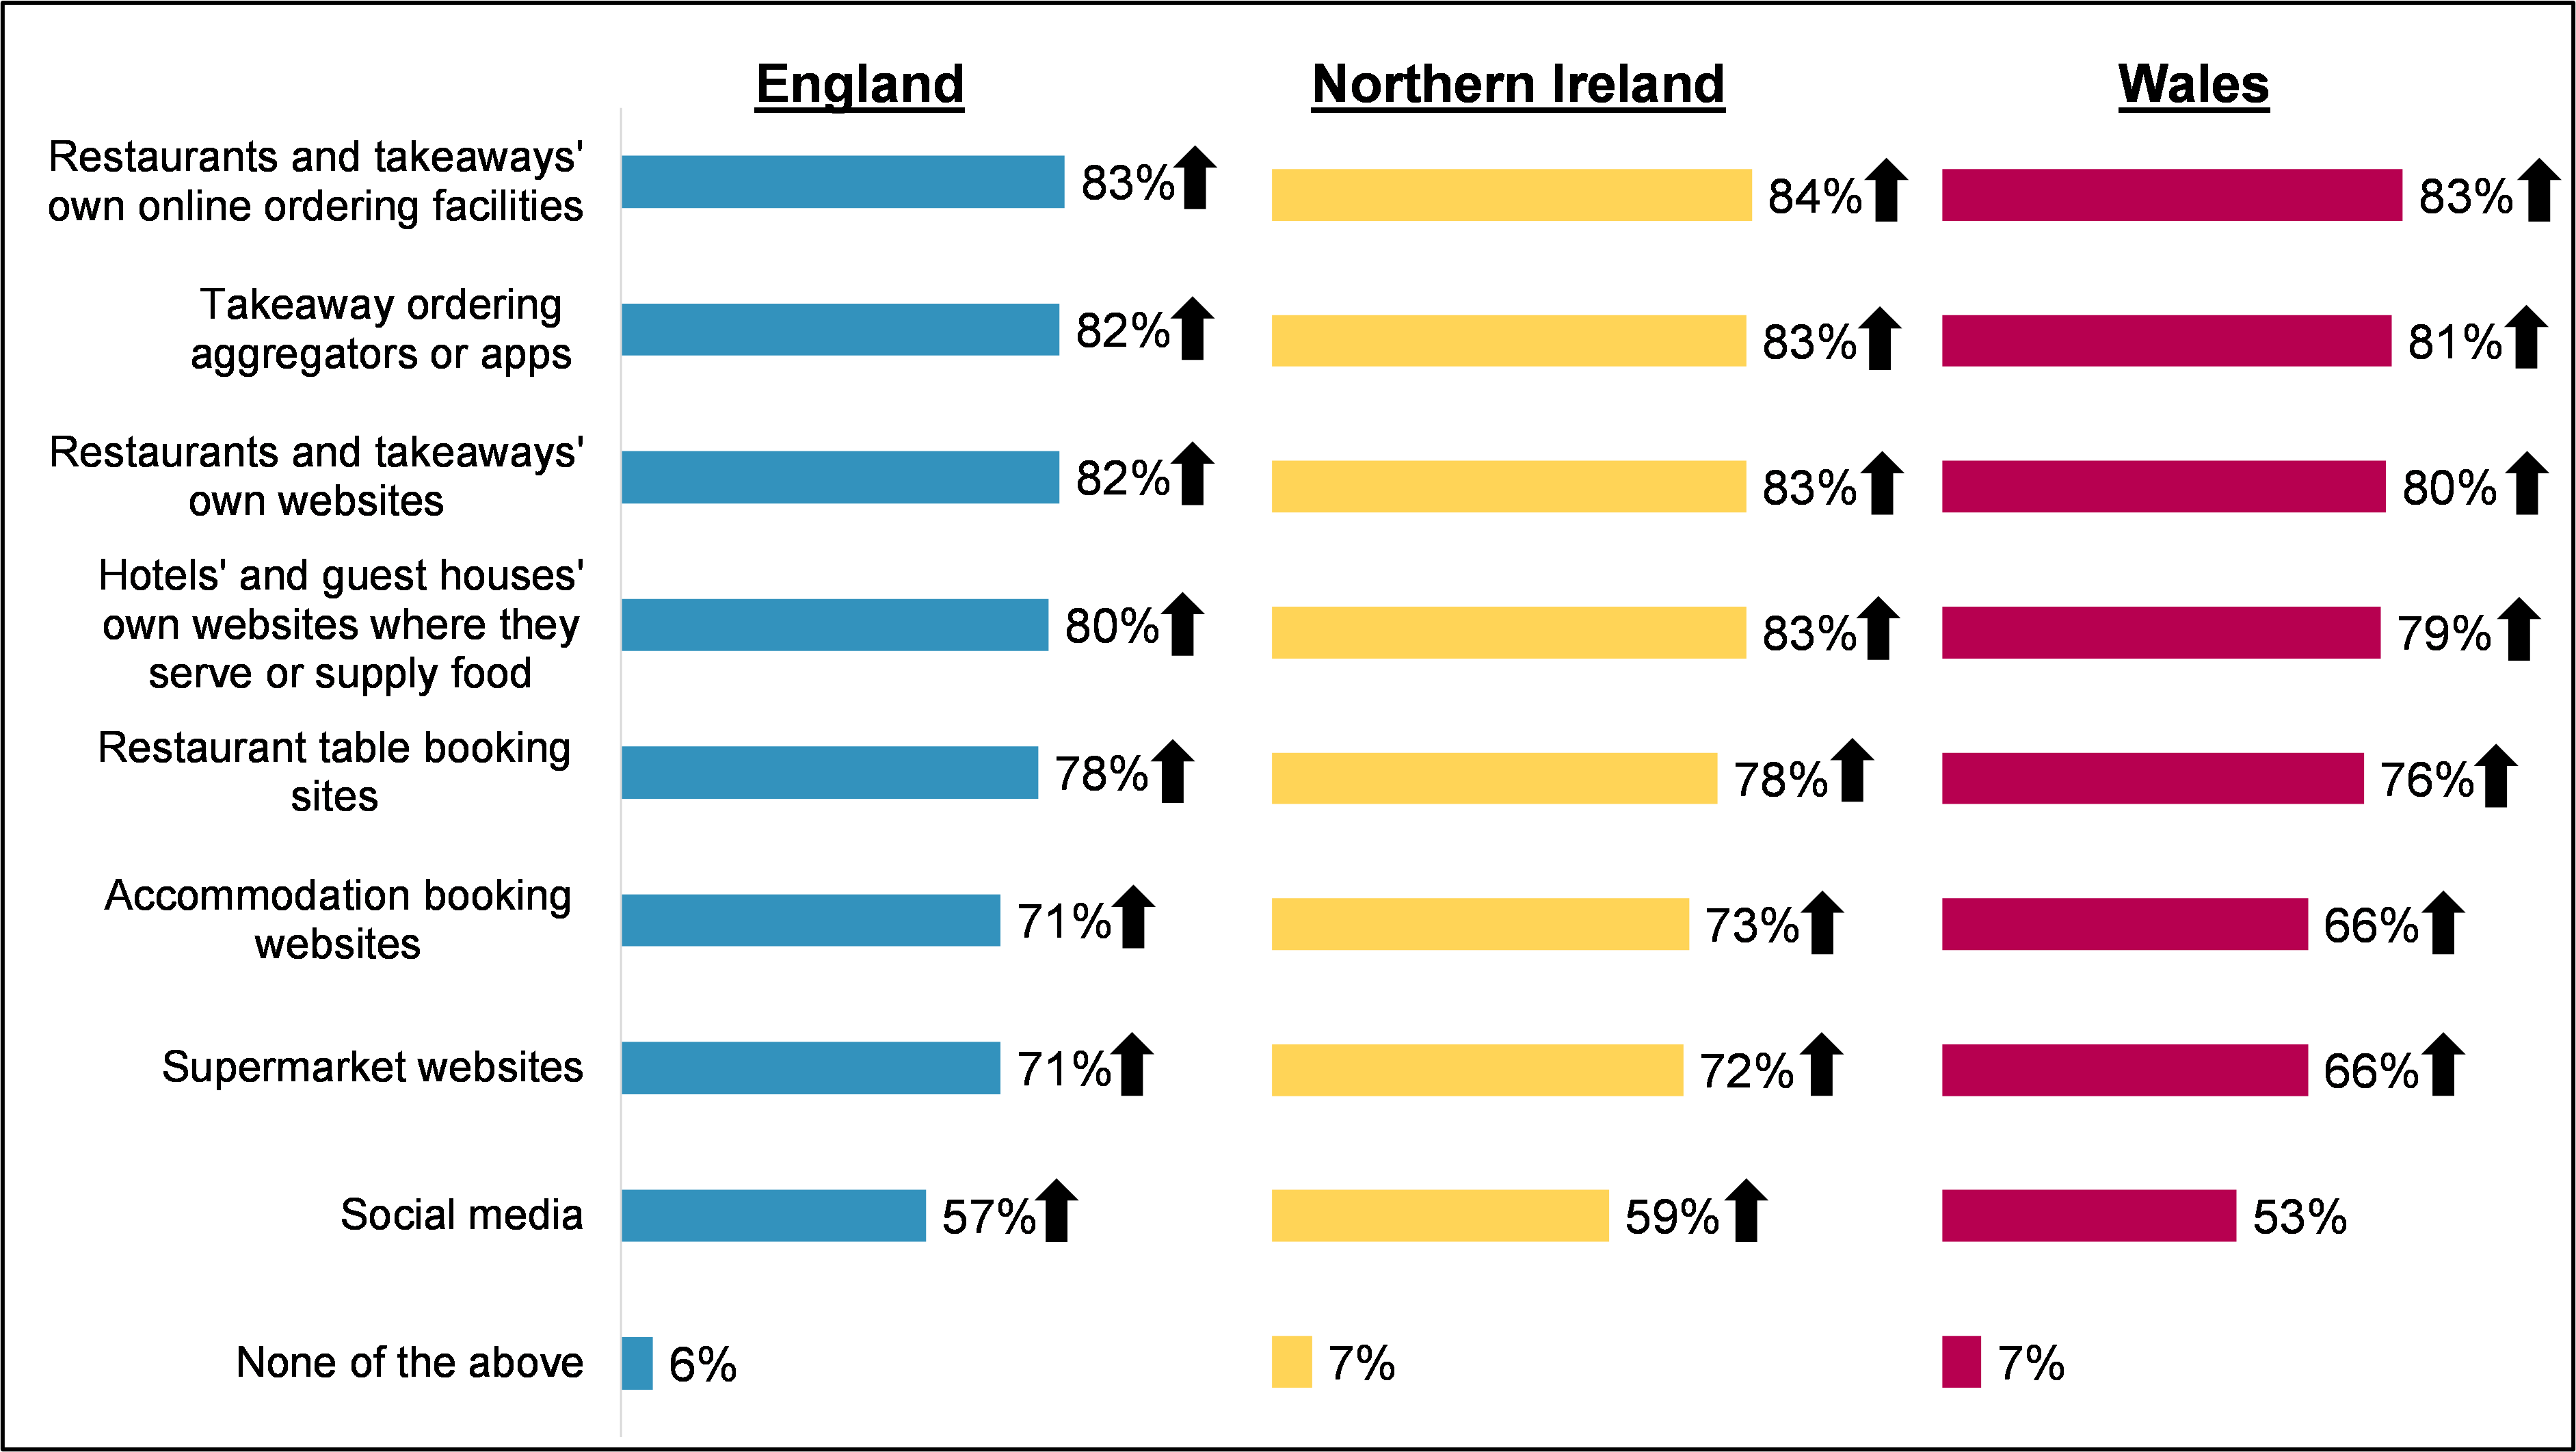
England: Restaurants and takeaways' own online ordering facilities 83%, Takeaway ordering aggregators or apps 82%, Restaurants and takeaways' own websites 82%, Hotels' and guest houses' own websites where they serve or supply food 80%, Restaurant table booking sites 78%, Accommodation booking websites 71%, Supermarket websites 71%, Social media 57%, None of the above 6%. Northern Ireland: Restaurants and takeaways' own online ordering facilities 84%, Takeaway ordering aggregators or apps 83%, Restaurants and takeaways' own websites 83%, Hotels' and guest houses' own websites where they serve or supply food 83%, Restaurant table booking sites 78%, Accommodation booking websites 73%, Supermarket websites 72%, Social media 59%, None of the above 7%. Wales: Restaurants and takeaways' own online ordering facilities 83%, Takeaway ordering aggregators or apps 81%, Restaurants and takeaways' own websites 80%, Hotels' and guest houses' own websites where they serve or supply food 79%, Restaurant table booking sites 76%, Accommodation booking websites 66%, Supermarket websites 66%, Social media 53%, None of the above 7%.
C13. Which, if any, of the following online facilities do you think should be required by law to display Food Hygiene Ratings? Base: FBOs that have FHRS (England: 465; Northern Ireland: 487; Wales: 478). ↑ Denotes a significant increase from 2021.
Businesses that supported mandatory online display typically also supported display at physical premises and considered an extension of existing regulations to online platforms as a logical progression. Some commented that mandatory online display would benefit customers by providing them with information to inform purchasing decisions, while others said that it would be beneficial to their business as it would promote their high standards. Some, while supportive of the concept, said that they were already displaying their rating on their online platforms and so did not think making it compulsory would affect them or their customers.
“I agree. If you’re going to have to have it physically on your front door then in the online world a business's website or online presence is like a virtual front door, so in the same way businesses should have to put it on their virtual front door.”
Takeaways and sandwich shops, England, FHRS rating of 5
“That wouldn't be a problem for us because we intend to maintain our five-star rating and we are proud to display that anywhere we can.”
Restaurants and catering, Wales, FHRS rating of 5
“It makes customers notice and be aware that we're a clean and tidy and maintain a high standard of cleanliness.”
Restaurants and catering, Northern Ireland, FHRS rating of 5
The minority of businesses that were not supportive of mandatory online display often had concerns about the cost and complexity of implementing this change to their websites, social media platforms and other online platforms. Others took issue with mandatory online display because of reservations about the efficacy and fairness of the FHRS.
“To be honest I wouldn't support that … administratively it’s quite costly to pay someone to update everything and I don't think it is viable in the current climate to expose further costs.”
Restaurants and catering, Northern Ireland, FHRS rating of 3
“I wouldn't like it. The reason being that the whole rating is an indicator of that day, not a long-term trend. By putting it there it can harm businesses. Whilst good for people with a good rating, that may lapse. Other places with a poor rating may step it up really quickly but this wouldn't be reflected if they don't go through the process of appealing straight away.”
Restaurants and catering, England, FHRS rating of 3
-
It should be noted that the survey sample did not include online only food businesses.
-
Online platforms businesses were probed with were: restaurants and takeaways' own online ordering facilities; takeaway ordering aggregators or apps; hotels' and guest houses' own websites where they serve or supply food; restaurants and takeaways' own websites; restaurant table booking sites; supermarket websites; accommodation booking websites; and social media.
Once businesses have been inspected by the local authority, they are sent a letter to notify them of their rating and suggest improvements if their rating is less than the top rating of 5 (very good). If a business is dissatisfied with their rating, they can exercise their right to appeal, right to reply or apply for a re-rating inspection. (footnote 1)
Recollection of inspection report letter
Over three-quarters of businesses in each country recalled receiving their inspection letter (Northern Ireland 86%, Wales 82%, England 78%). As shown in Figure 7.1 recall of the letter has varied over time but remained broadly consistent between 2021 and 2022 in each of the three countries.
Figure 7.1. Proportion of food businesses that recall receiving an inspection report letter
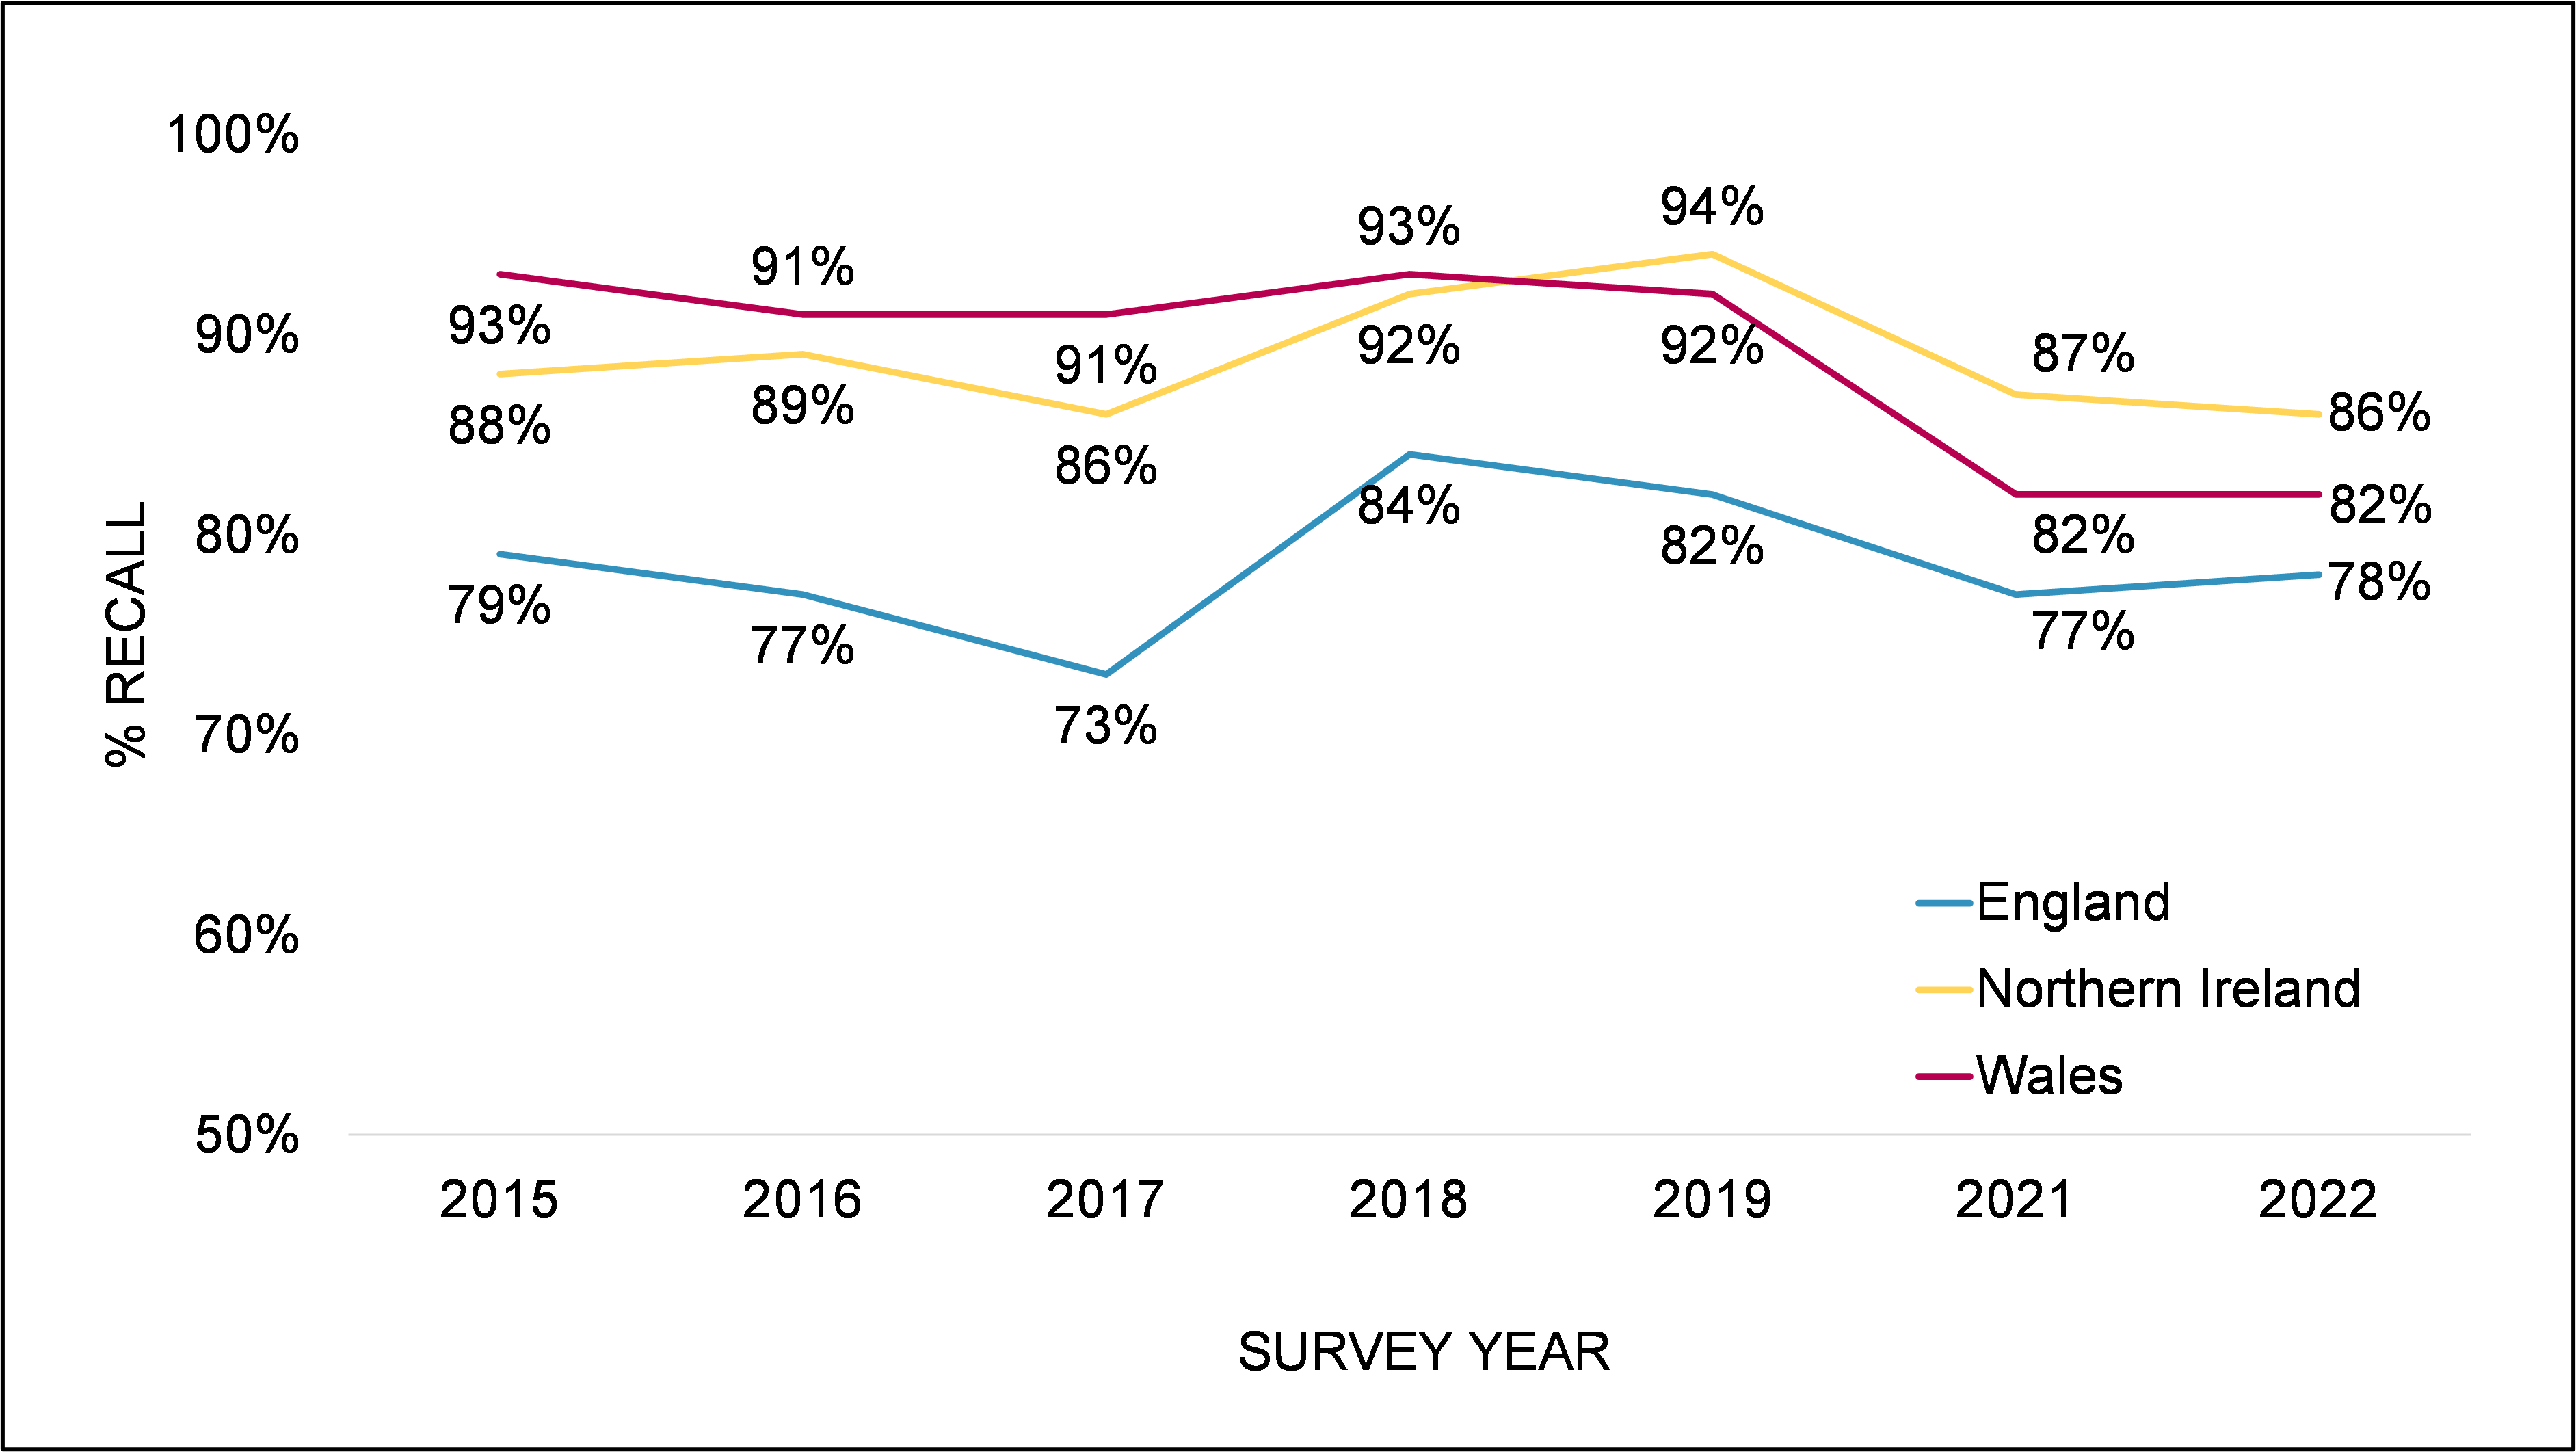
C1. Do you recall if your business received an inspection report letter from the local authority? Base: FBOs who have a food hygiene rating. England (2022: 465, 2021: 469, 2019: 473, 2018: 431, 2017: 442, 2016: 417, 2015: 430); Northern Ireland (487, 486, 490, 463, 467, 446, 440); Wales (478, 479, 494, 468, 475, 481, 474).
Of businesses that received a letter and had an FHRS rating of less than 5, most could recall if their letter told them what improvements they would need to make to achieve the highest food hygiene rating of 5 at their premises (England 80%; Northern Ireland 89%; Wales 84%), as shown in Figure 7.2 below. While there appeared to be a decline between 2021 and 2022 within England (from 89% to 80%), this difference was not statistically significant, owing to the relatively small sample size.
Figure 7.2 Recollection of letter instructing how to achieve a maximum rating
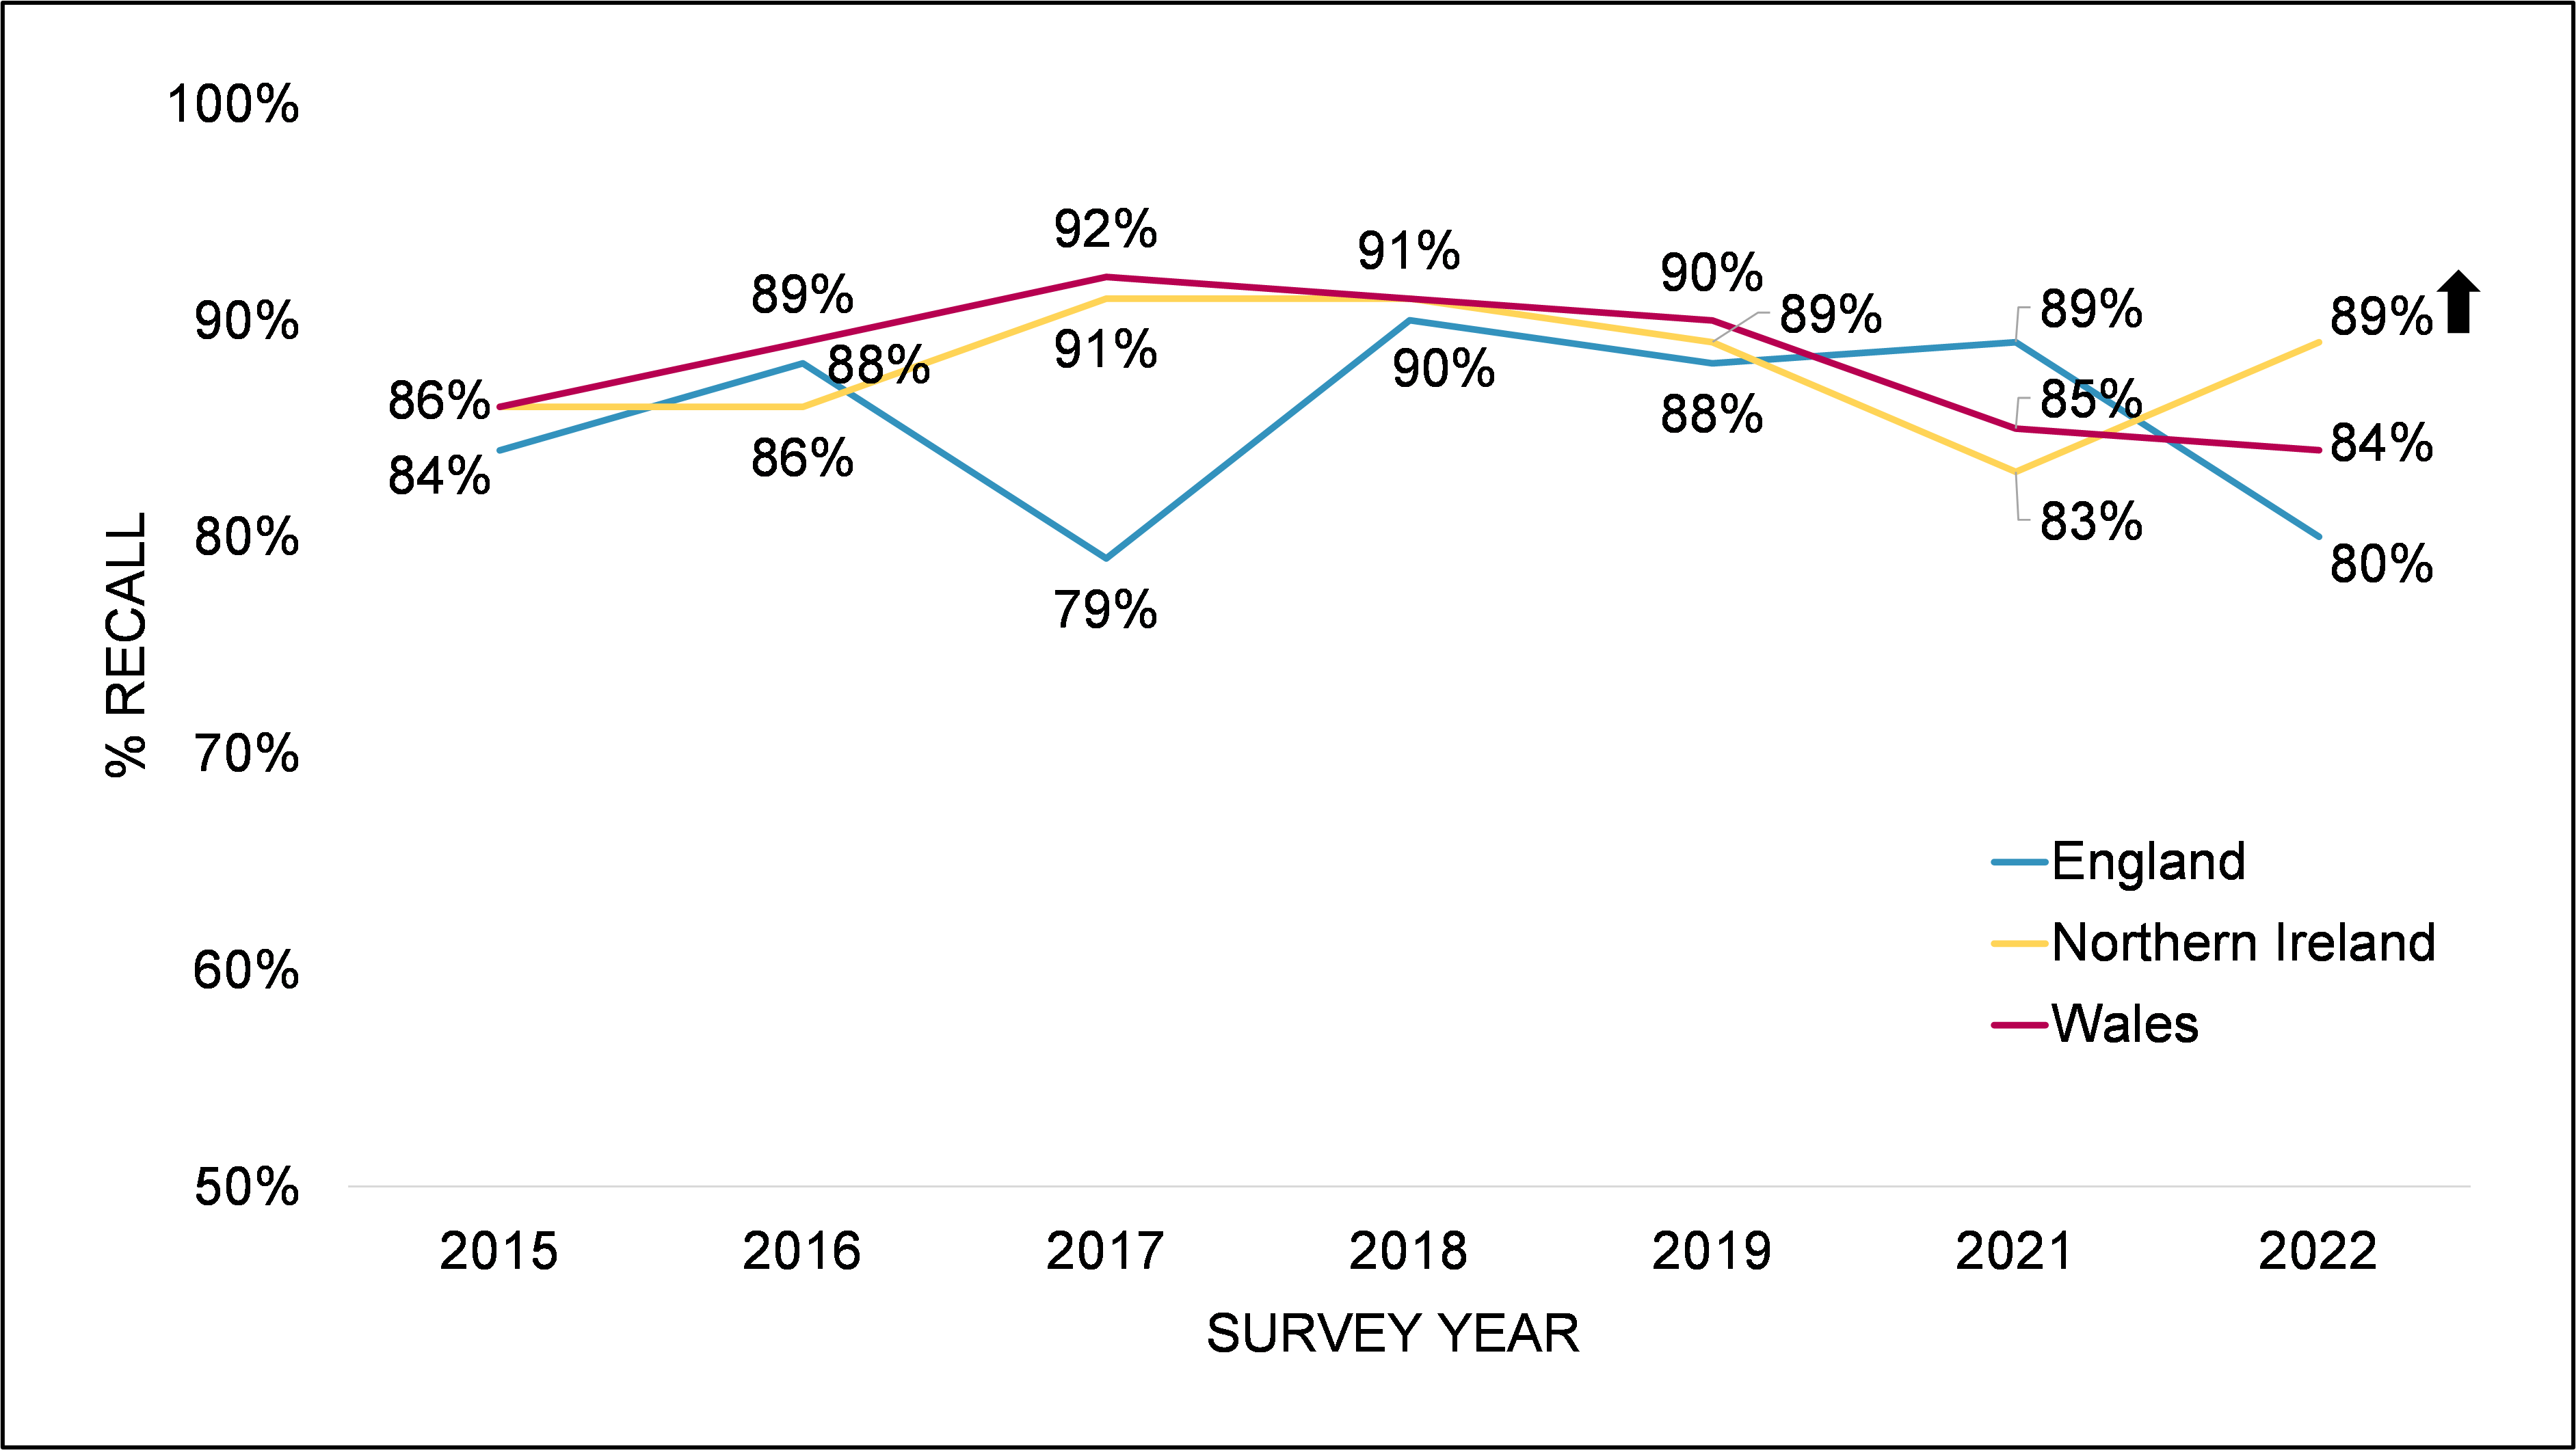
C2. Do you recall if your letter told you what improvements you would need to make to achieve the highest Food Hygiene Rating of 5 at your premises? Base: FBOs who received a letter and have a food hygiene rating of <5. England (2022: 82, 2021: 96, 2019: 151, 2018: 187, 2017: 140, 2016: 107, 2015: 117); Northern Ireland (77, 83, 165, 197,163, 138, 12383, 490, 463, 467, 446, 440); Wales (131, 127, 224, 225, 237, 184, 204).
Use of safeguards
Businesses were asked if they knew they could appeal, had a ‘right to reply’ or request a re-rating inspection if they were unhappy with their FHRS rating. In line with 2021, overall self-reported awareness was high, with at least three in four aware of each option in England (76% for appeal, 77% for ‘right to reply' and 79% for re-rating) and closer to nine in ten aware in Northern Ireland (87% for appeal, 87% for ‘right to reply’ and 87% for re-rating) and Wales (89% for appeal, 89% for ‘right to reply’ and 91% for re-rating) (see Figure 7.3).
In Northern Ireland, retail businesses were less likely than average to be aware that they could request a re-rating (82%, compared to 87%). In Wales, retail businesses were less likely than average to be aware they could request an appeal (83%, compared to 89%) as well as the ‘right to reply’ (84% compared to 89%).
Figure 7.3 Proportion aware of the right to a re-rating, appeal and the right to reply by country
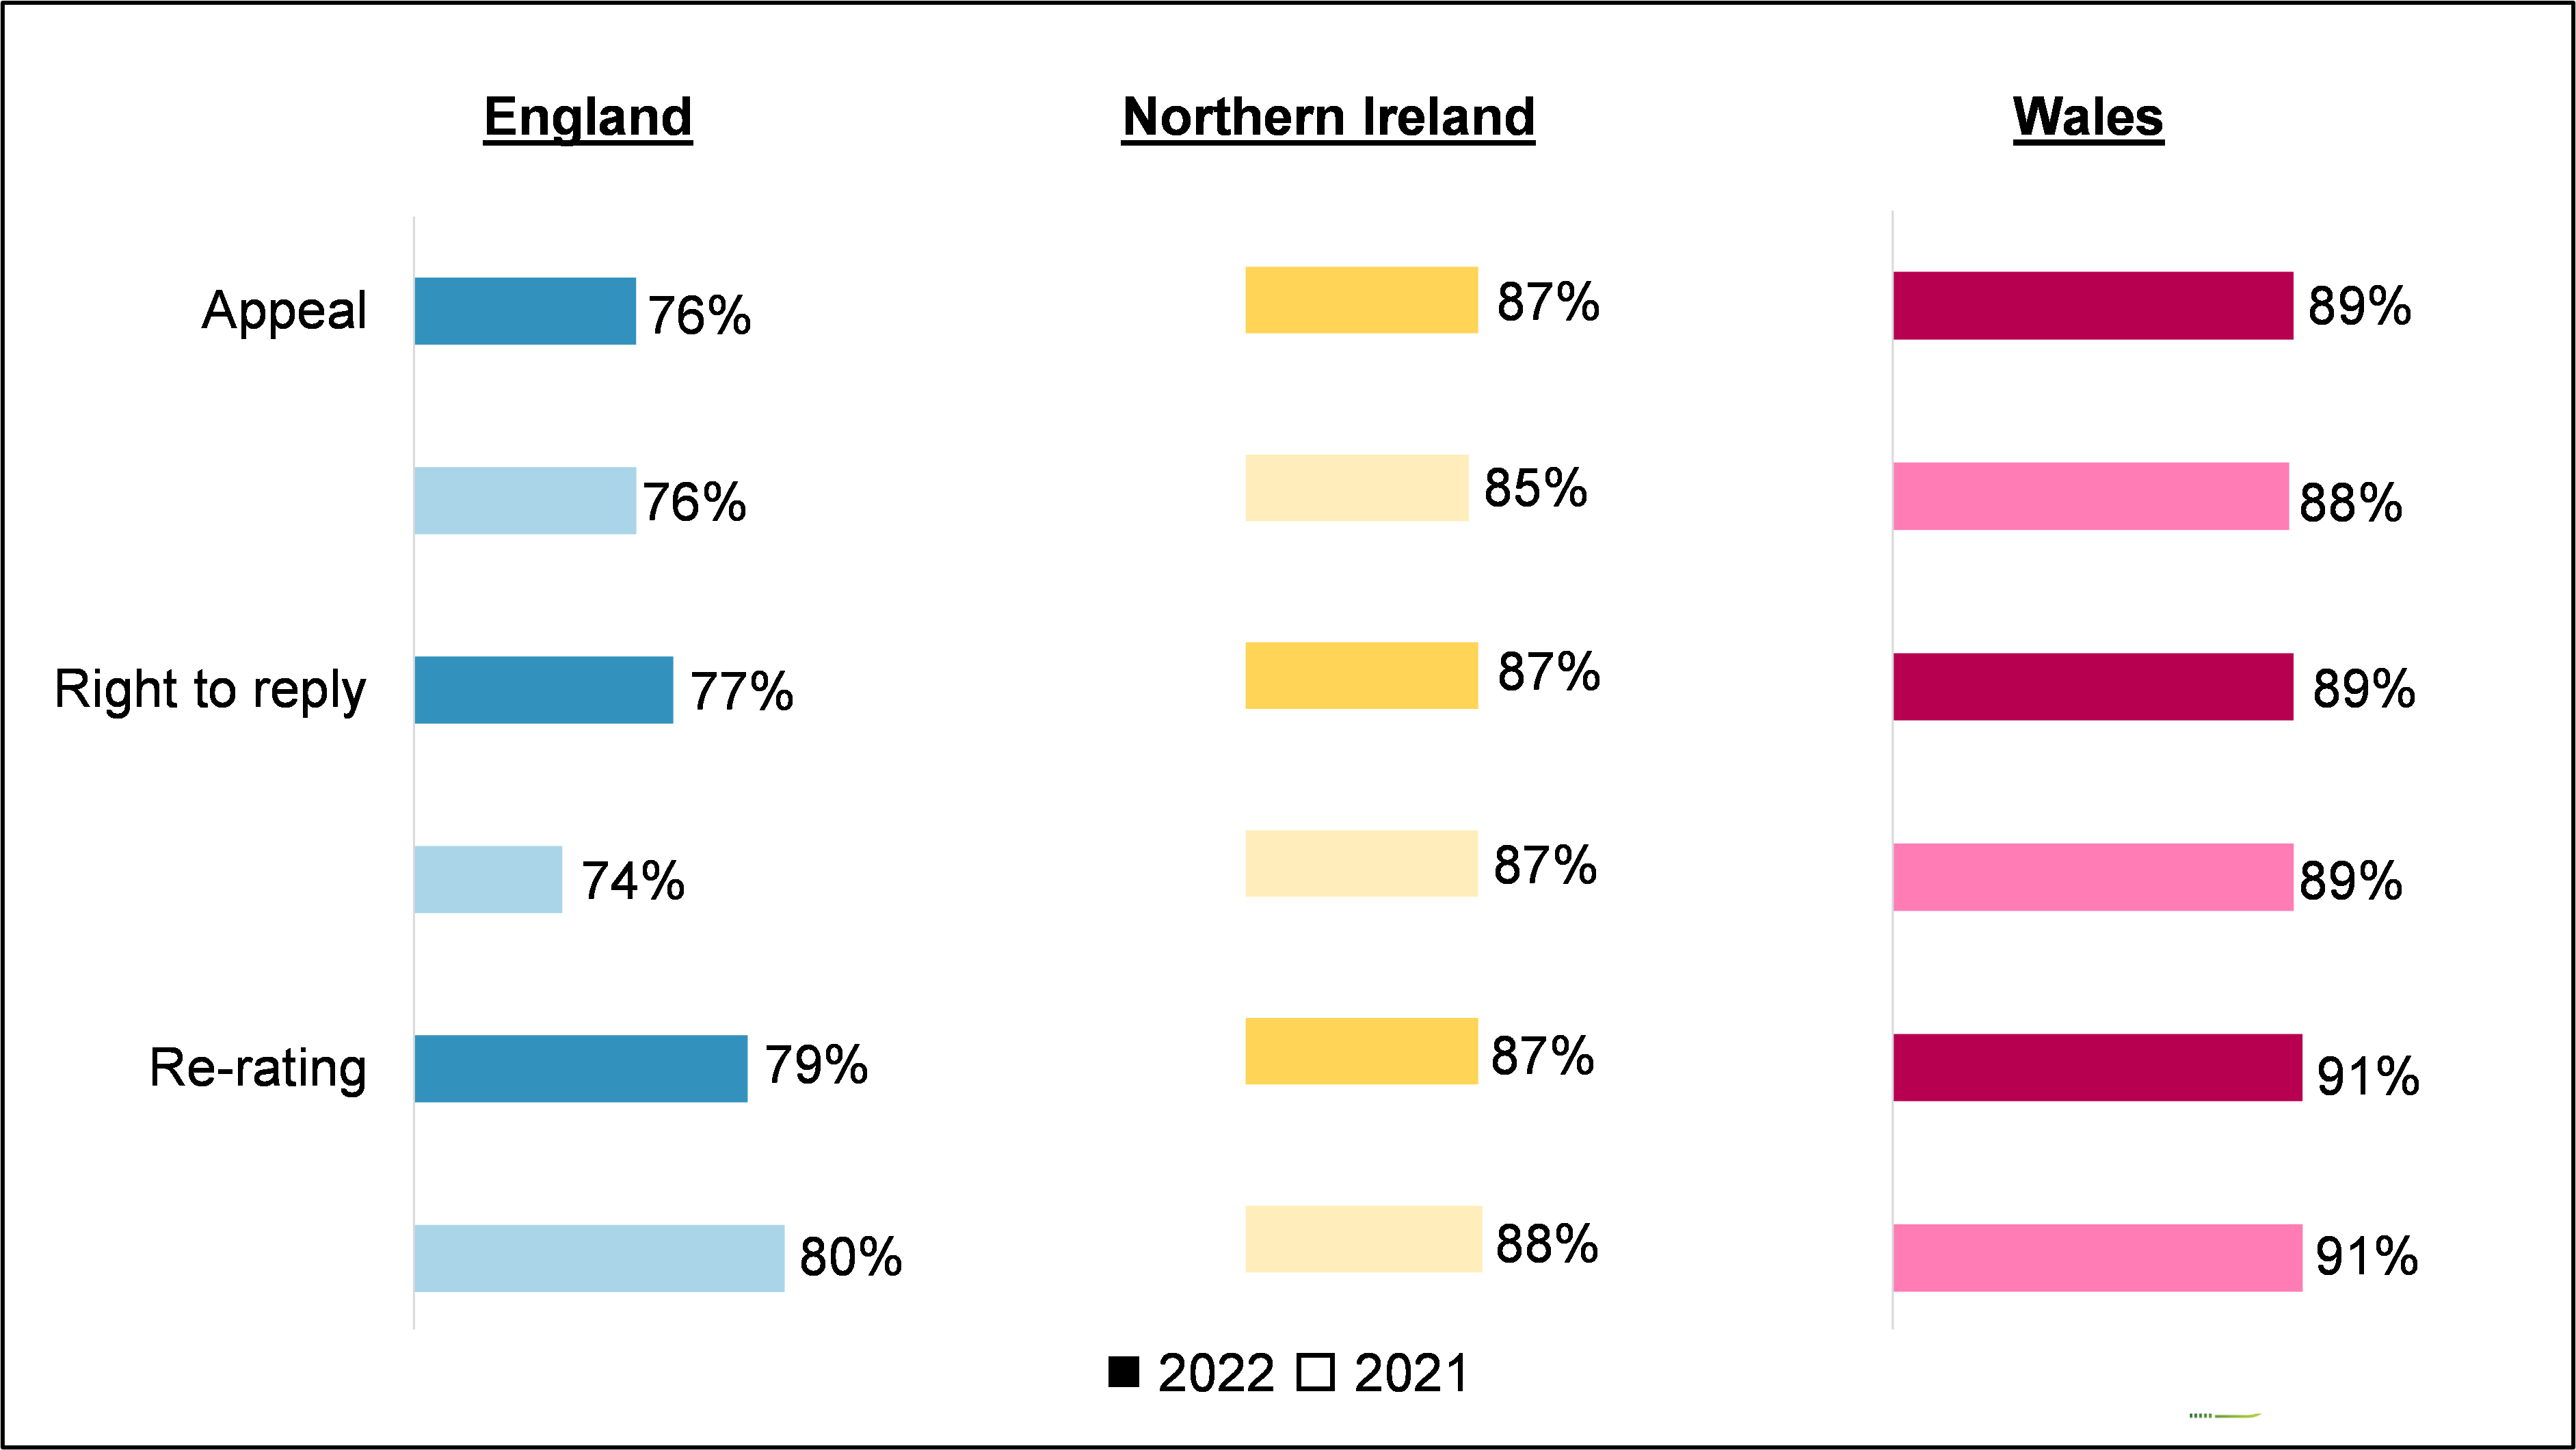
C3_1-3. Following an inspection, are you aware that if you are unhappy with your rating you can request...A re-rating? / An appeal? / A 'right to reply'? Base: FBOs who have a food hygiene rating in 2022: England (465); Northern Ireland (487); Wales (478). 2021: England (468); Northern Ireland (485); Wales (479).
Applying for a re-rating or exercising right to reply
All food businesses that reported being aware of the ‘re-rating’ and ‘right to reply’ options were asked if they had taken up either of these options. Despite high levels of awareness, few businesses reported that they had requested either a re-rating or exercised their right to reply. As shown in Table 7.1 only around 1 in 20 in each country reported that they had applied for a re-rating. Around 1 in 10 reported exercising their right to reply, suggestive of a slight increase since 2021, although this change was not statistically significant . (footnote 2)
Table 7.1 Proportion of food businesses that report applying for a re-rating
| Applied for re-rating | England | Northern Ireland | Wales |
|---|---|---|---|
| 2022 | 4% | 3% | 6% |
| 2021 | 5% | 4% | 5% |
C4. Has your establishment applied for a re-rating inspection from the local authority since your last inspection? Base: FBOs who have a food hygiene rating and aware of ability to apply for a re-rating. 2022: England (370); Northern Ireland (432); Wales (434). 2021: England (377); Northern Ireland (427); Wales (436).
Table 7.2 Proportion of food businesses that report exercising their right to reply
| Exercised right to reply | England | Northern Ireland | Wales |
|---|---|---|---|
| 2022 | 9% | 10% | 10% |
| 2021 | 7% | 7% | 7% |
C7. Has your establishment exercised its ‘right to reply’ by sending comments to the local authority about the most recent rating you have been given? Base: FBOs who have a food hygiene rating and aware that can exercise right to reply. 2022: England (345); Northern Ireland (424) Wales (423). 2021: England (348); Northern Ireland (424); Wales (425).
Experience of applying for a re-rating
Those that reported they were not satisfied with their food hygiene rating and did not apply for a ‘re-rating’ were asked why they did not apply for a re-rating. Sample sizes by each country were low for this question (England n= 21; Northern Ireland n= 18; Wales n= 38), but the combined results displayed in Figure 7.4 show that the most common reasons were that the fees were too high (26%), the business had not yet made all of the changes suggested (20%) or a lack of time (18%).
There were some differences in reasons given between 2021 and 2022, which may largely be due to the decreasing influence of the COVID-19 pandemic on food businesses. In 2021, the impact of the pandemic was mentioned by one in five (19%) but this was not mentioned in 2022 at all. There were also fewer businesses in 2022 saying they had other priorities than applying for re-rating (down to 1% from 16% in 2021). Instead, there were more businesses citing other common reasons for not applying in 2022 – feeling fees are too high (footnote 3), having a general lack of time or feeling the rating systems is unfair.
Figure 7.4 Reason for not applying for a re-rating (results for all countries combined)
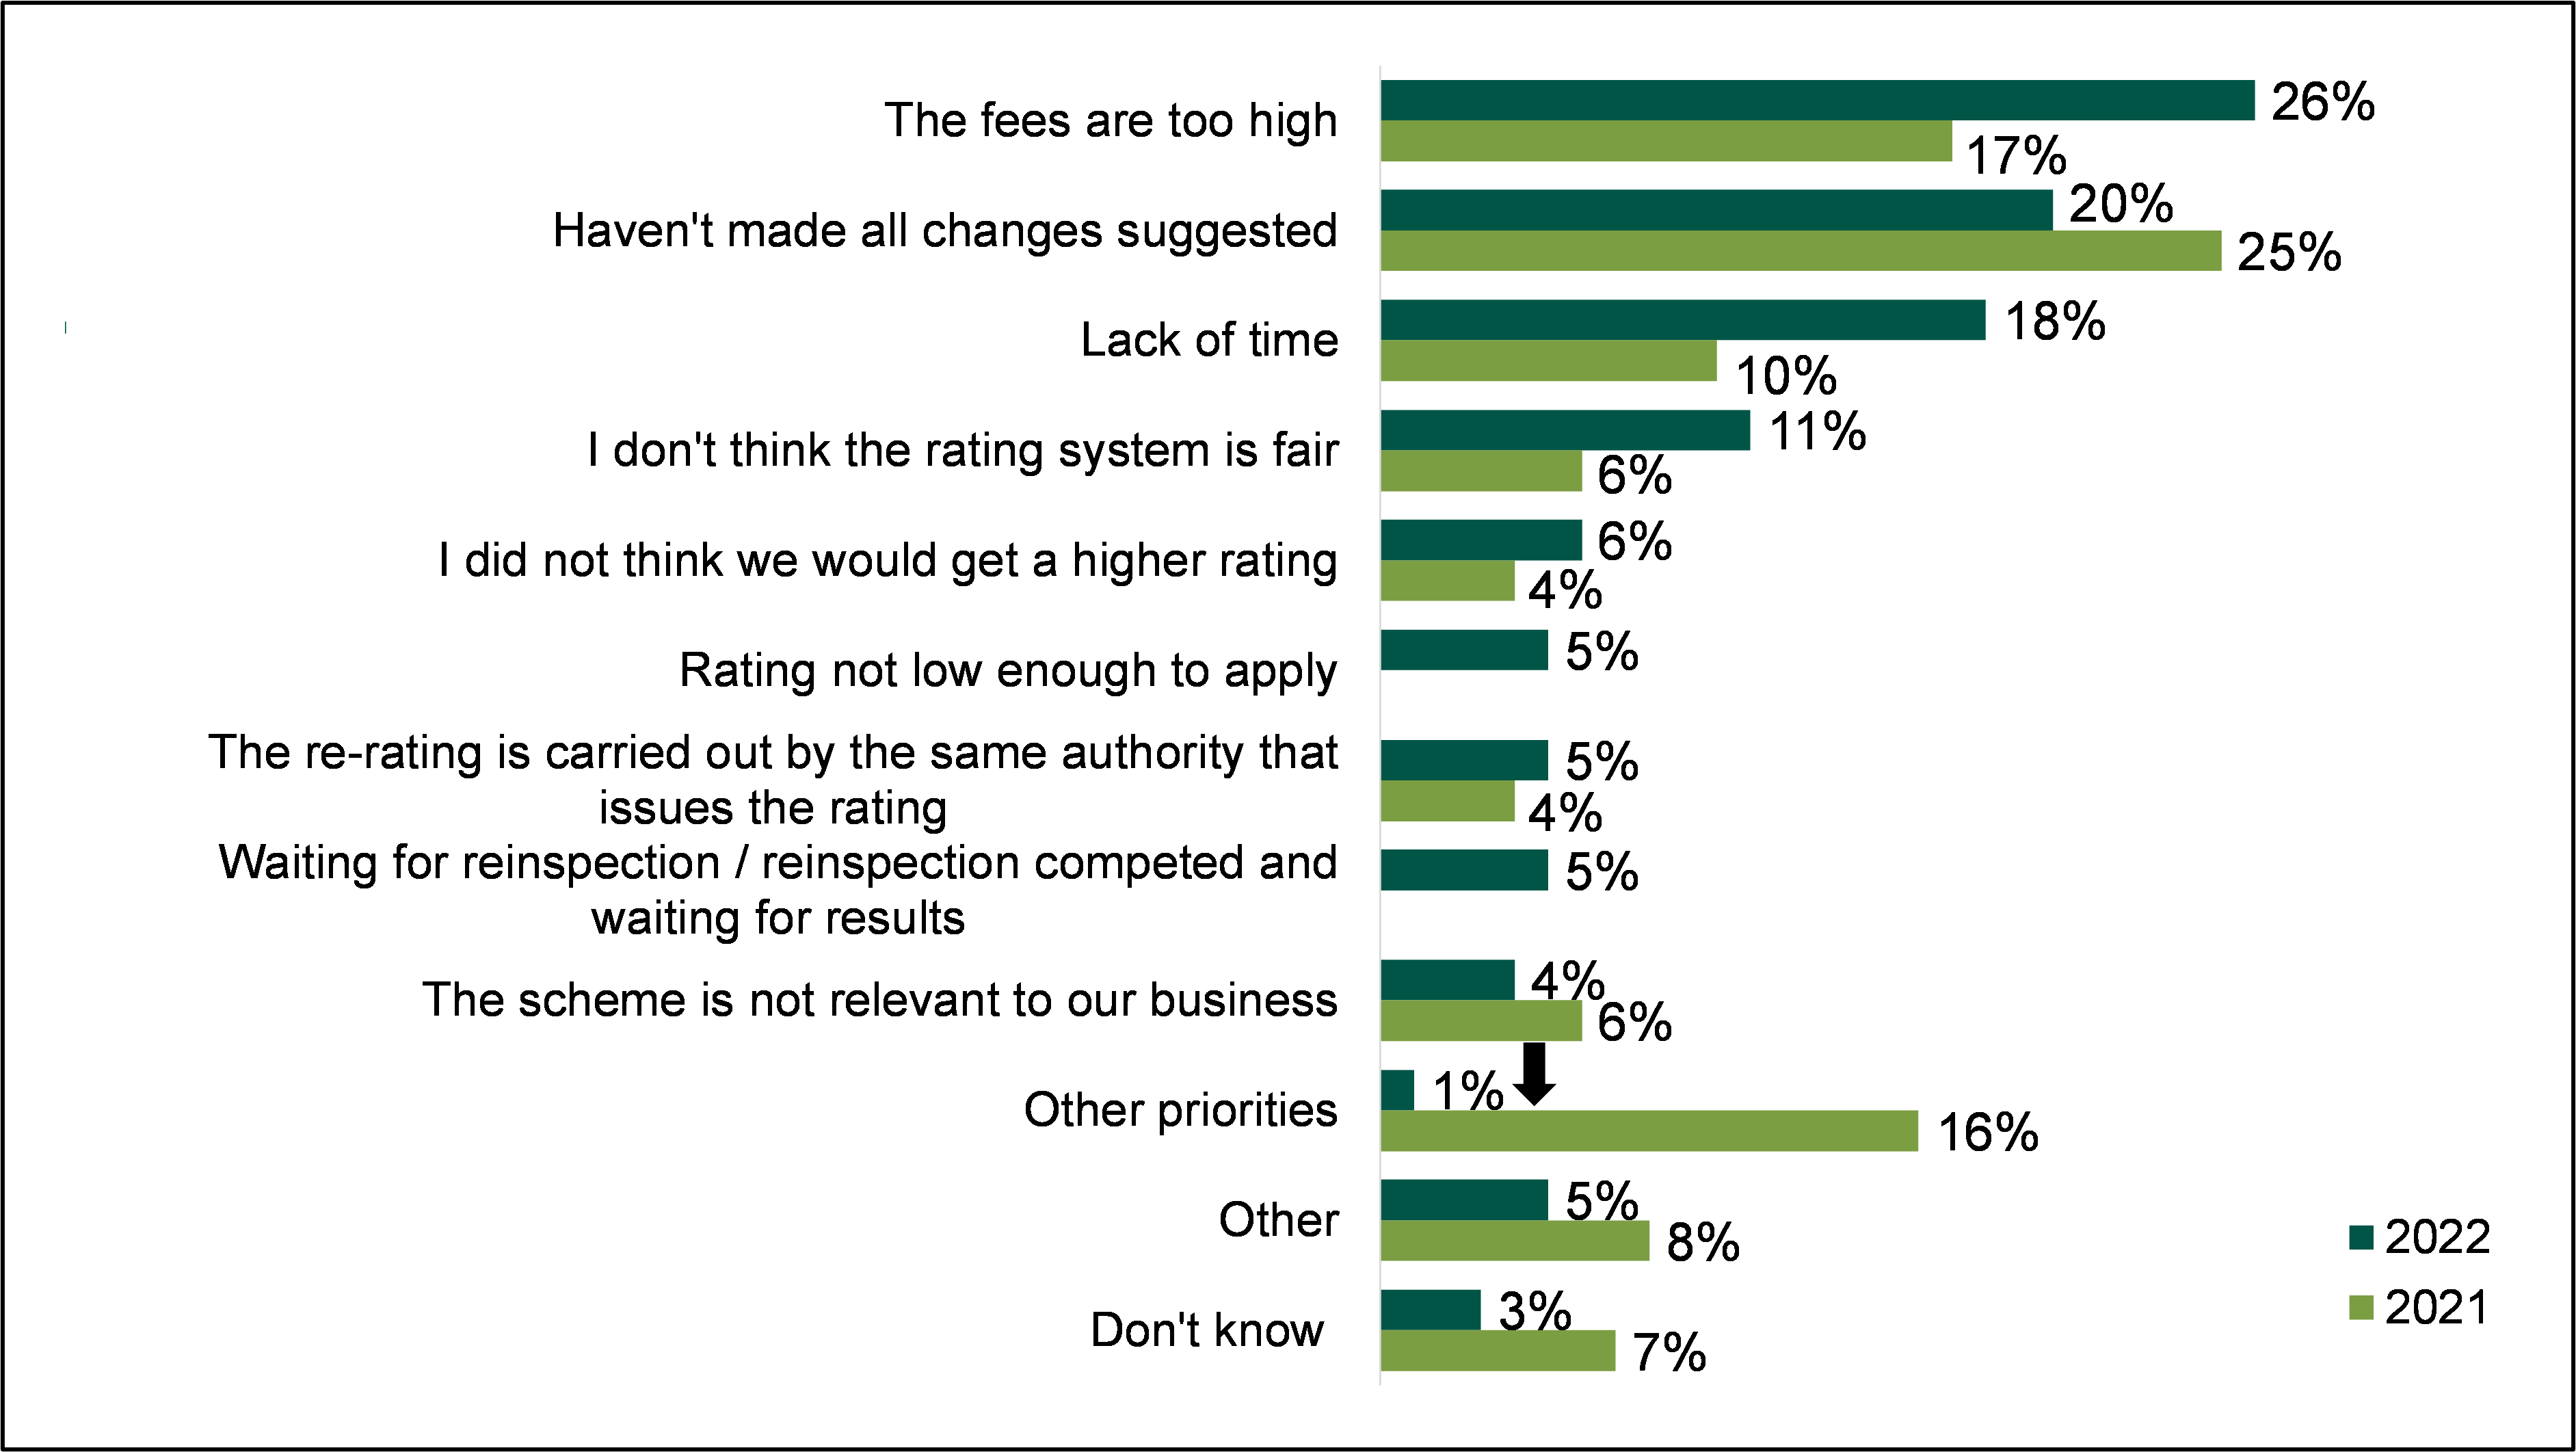
The fees are too high (2022 26%, 2021 17%), Haven't made all changes suggested (2022 20%, 2021 25%), Lack of time (2022 18%, 2021 10%), I don't think the rating system is fair (2022 11%, 2021 6%), I did not think we would get a higher rating (2022 6%, 2021 4%), Rating not low enough to apply (2022 5%), The re-rating is carried out by the same authority that issues the rating (2022 5%, 2021 4%), Waiting for reinspection / reinspection competed and waiting for results (2022 5%), The scheme is not relevant to our business (2022 4%, 2021 6%), Other priorities (2022 1%, 2021 16%), Other (2022 5%, 2021 8%), Don't know (2022 3%, 2021 7%)
C5. Why did you not apply for a re-rating? Base: All FBOs not satisfied with the food hygiene rating but did not apply for re-rating. All countries: 2022: 77 ; 2021: 91. ↑ /↓ Denotes a significant change from 2021.
As presented in Figure 7.5, more than half of those that applied for a re-rating reported being awarded a higher rating. This is a significant increase when compared to results in 2021 (56%, compared to 28%). The number of businesses still waiting for a new inspection or to hear back from their local authority remained similar to previous years (36% in 2021 and 37% in 2022).
Figure 7.5 Result of request a re-rating (results for all countries combined)
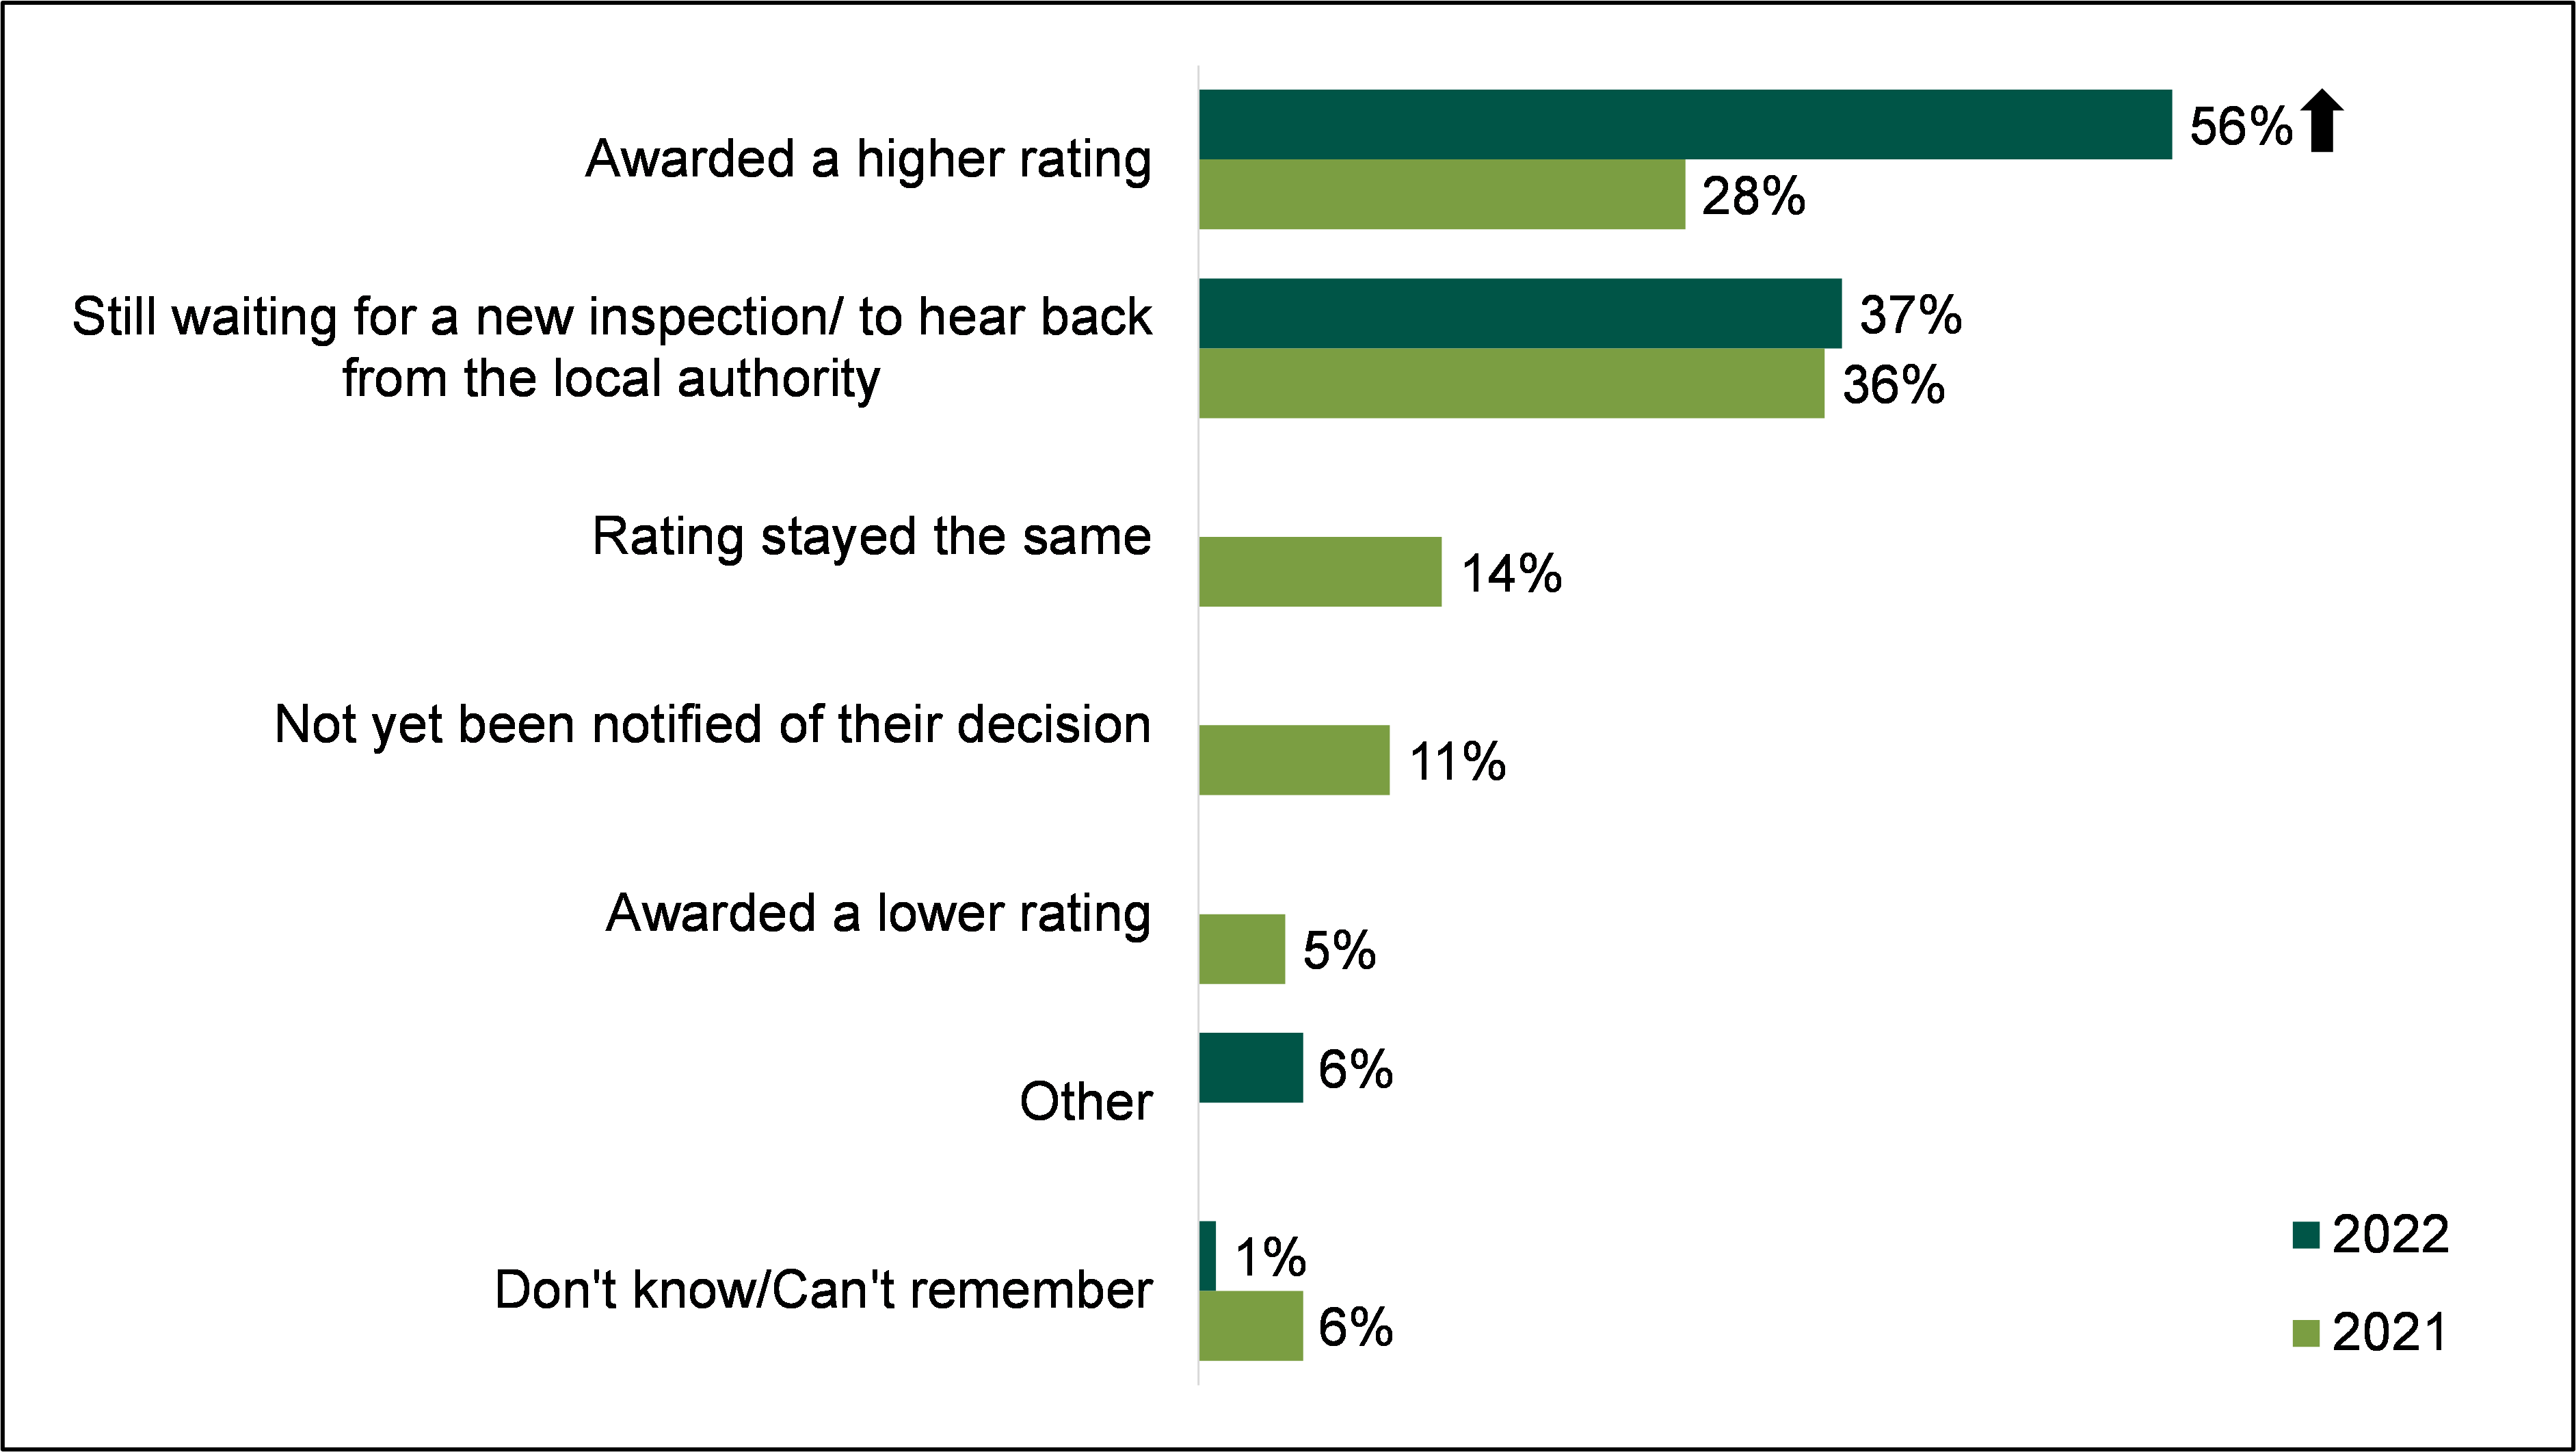
C6. And what was the result of this request for a re-rating? Base: All FBOs who applied for a for re-rating. All countries: 2022: 53; 2021: 60. ↑ /↓ Denotes a significant increase from 2021.
Exercising right to reply
Businesses that reported they were not satisfied with their food hygiene rating and chose not to exercise their ‘right to reply’ were asked why. Sample sizes by each country were low for this question (England n= 19; Northern Ireland n= 11; Wales n= 28), but the combined results displayed in Figure 7.6 show that making the changes required (27%) and other competing priorities (19%) were the primary reasons. There were also a fair proportion of businesses that accepted the rating (14%) or did not want to spend the time using their right to reply (13%). A further one in ten (10%) applied for a re-rating instead.
In 2021, the profile of reasons given was quite different as 12% of businesses cited the impact of the COVID-19 pandemic, which was not mentioned at all in 2022. There were also fewer businesses in 2022 that gave a ‘don’t know’ response and corresponding increases in many of the other response options.
Figure 7.6 Reason for not exercising right to reply (results for all countries combined)
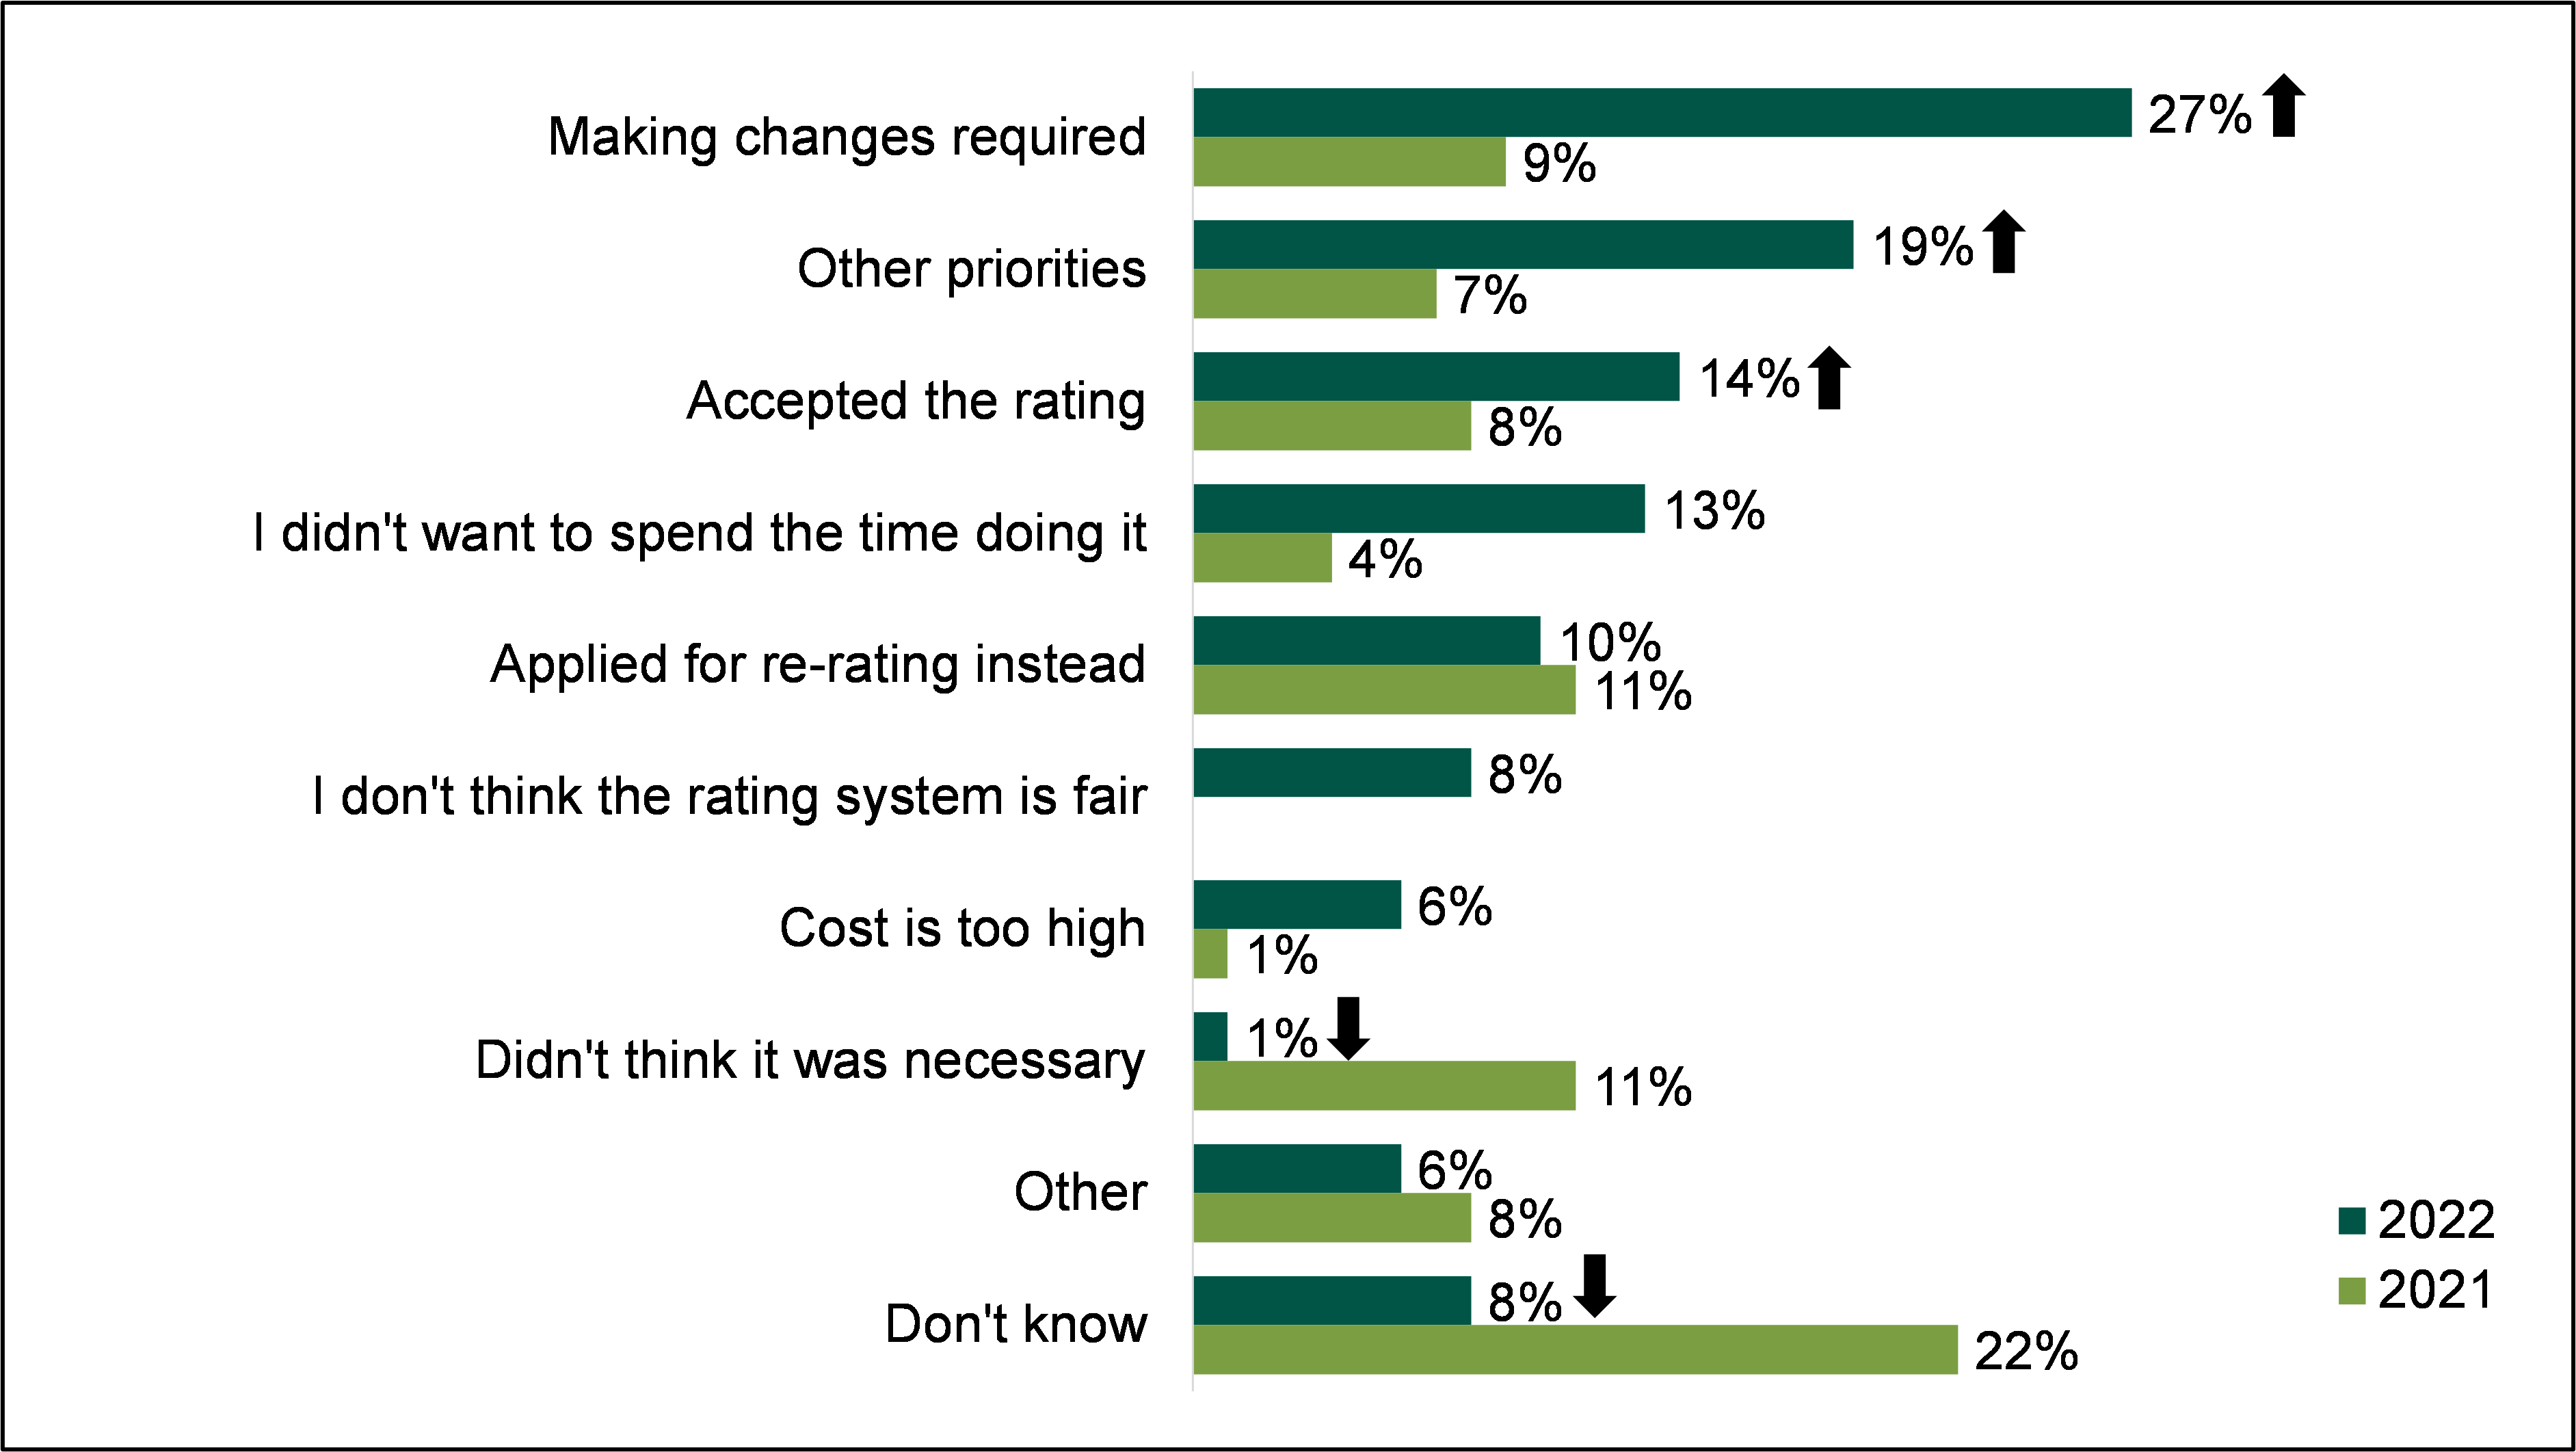
C8. Why did you not exercise your 'right to reply'? Base: All FBOs who were not satisfied with the food hygiene rating but did not exercise their right to reply. All countries: 2022: 58; 2021: 80. ↑ /↓ Denotes a significant change from 2021.
-
A ‘right to reply’ allows businesses to tell customers how their business has improved its hygiene standards or if there were unusual circumstances at the time of inspection. This response is published online, alongside the rating, by the local authority. Businesses can 'appeal' an FHRS rating if they think that the rating does not reflect the hygiene standards at the time of inspection. If a business makes the improvements to hygiene standards that food safety officers raised at their last inspection, businesses can request a ‘re-rating’ visit.
-
FSA data indicates that there-rating inspection request is more commonly used than the right to reply safeguard.
-
Some local authorities in England charge a fee to recover the costs of carrying out a revisit inspection requested by the business. In Wales and Northern Ireland all local authorities charge a fee to recover costs for the re-visit under their statutory schemes.
Specifically, it looks at changes made by businesses with a food hygiene rating of less than 5 in order to improve their rating at the next inspection and what kind of impact they feel the scheme has on their business and potential customers. It also explores actual and potential use of food hygiene ratings in promotion and advertising.
Business and customer perceptions of food hygiene ratings
Overall, most businesses reported being incentivised to maintain or improve their food hygiene rating and consider that the display of their rating has a range of positive impacts on customer perceptions of the business.
As presented in Figure 8.1, nearly all businesses in England, Northern Ireland and Wales agreed that they worked hard to maintain or improve their food hygiene rating (England 99%; Northern Ireland 97%; Wales 98%) and that displaying a food hygiene rating proved to consumers that the business takes food hygiene seriously (England 97%; Northern Ireland 96%; Wales 94%).
Figure 8.1 Perceptions of FHRS
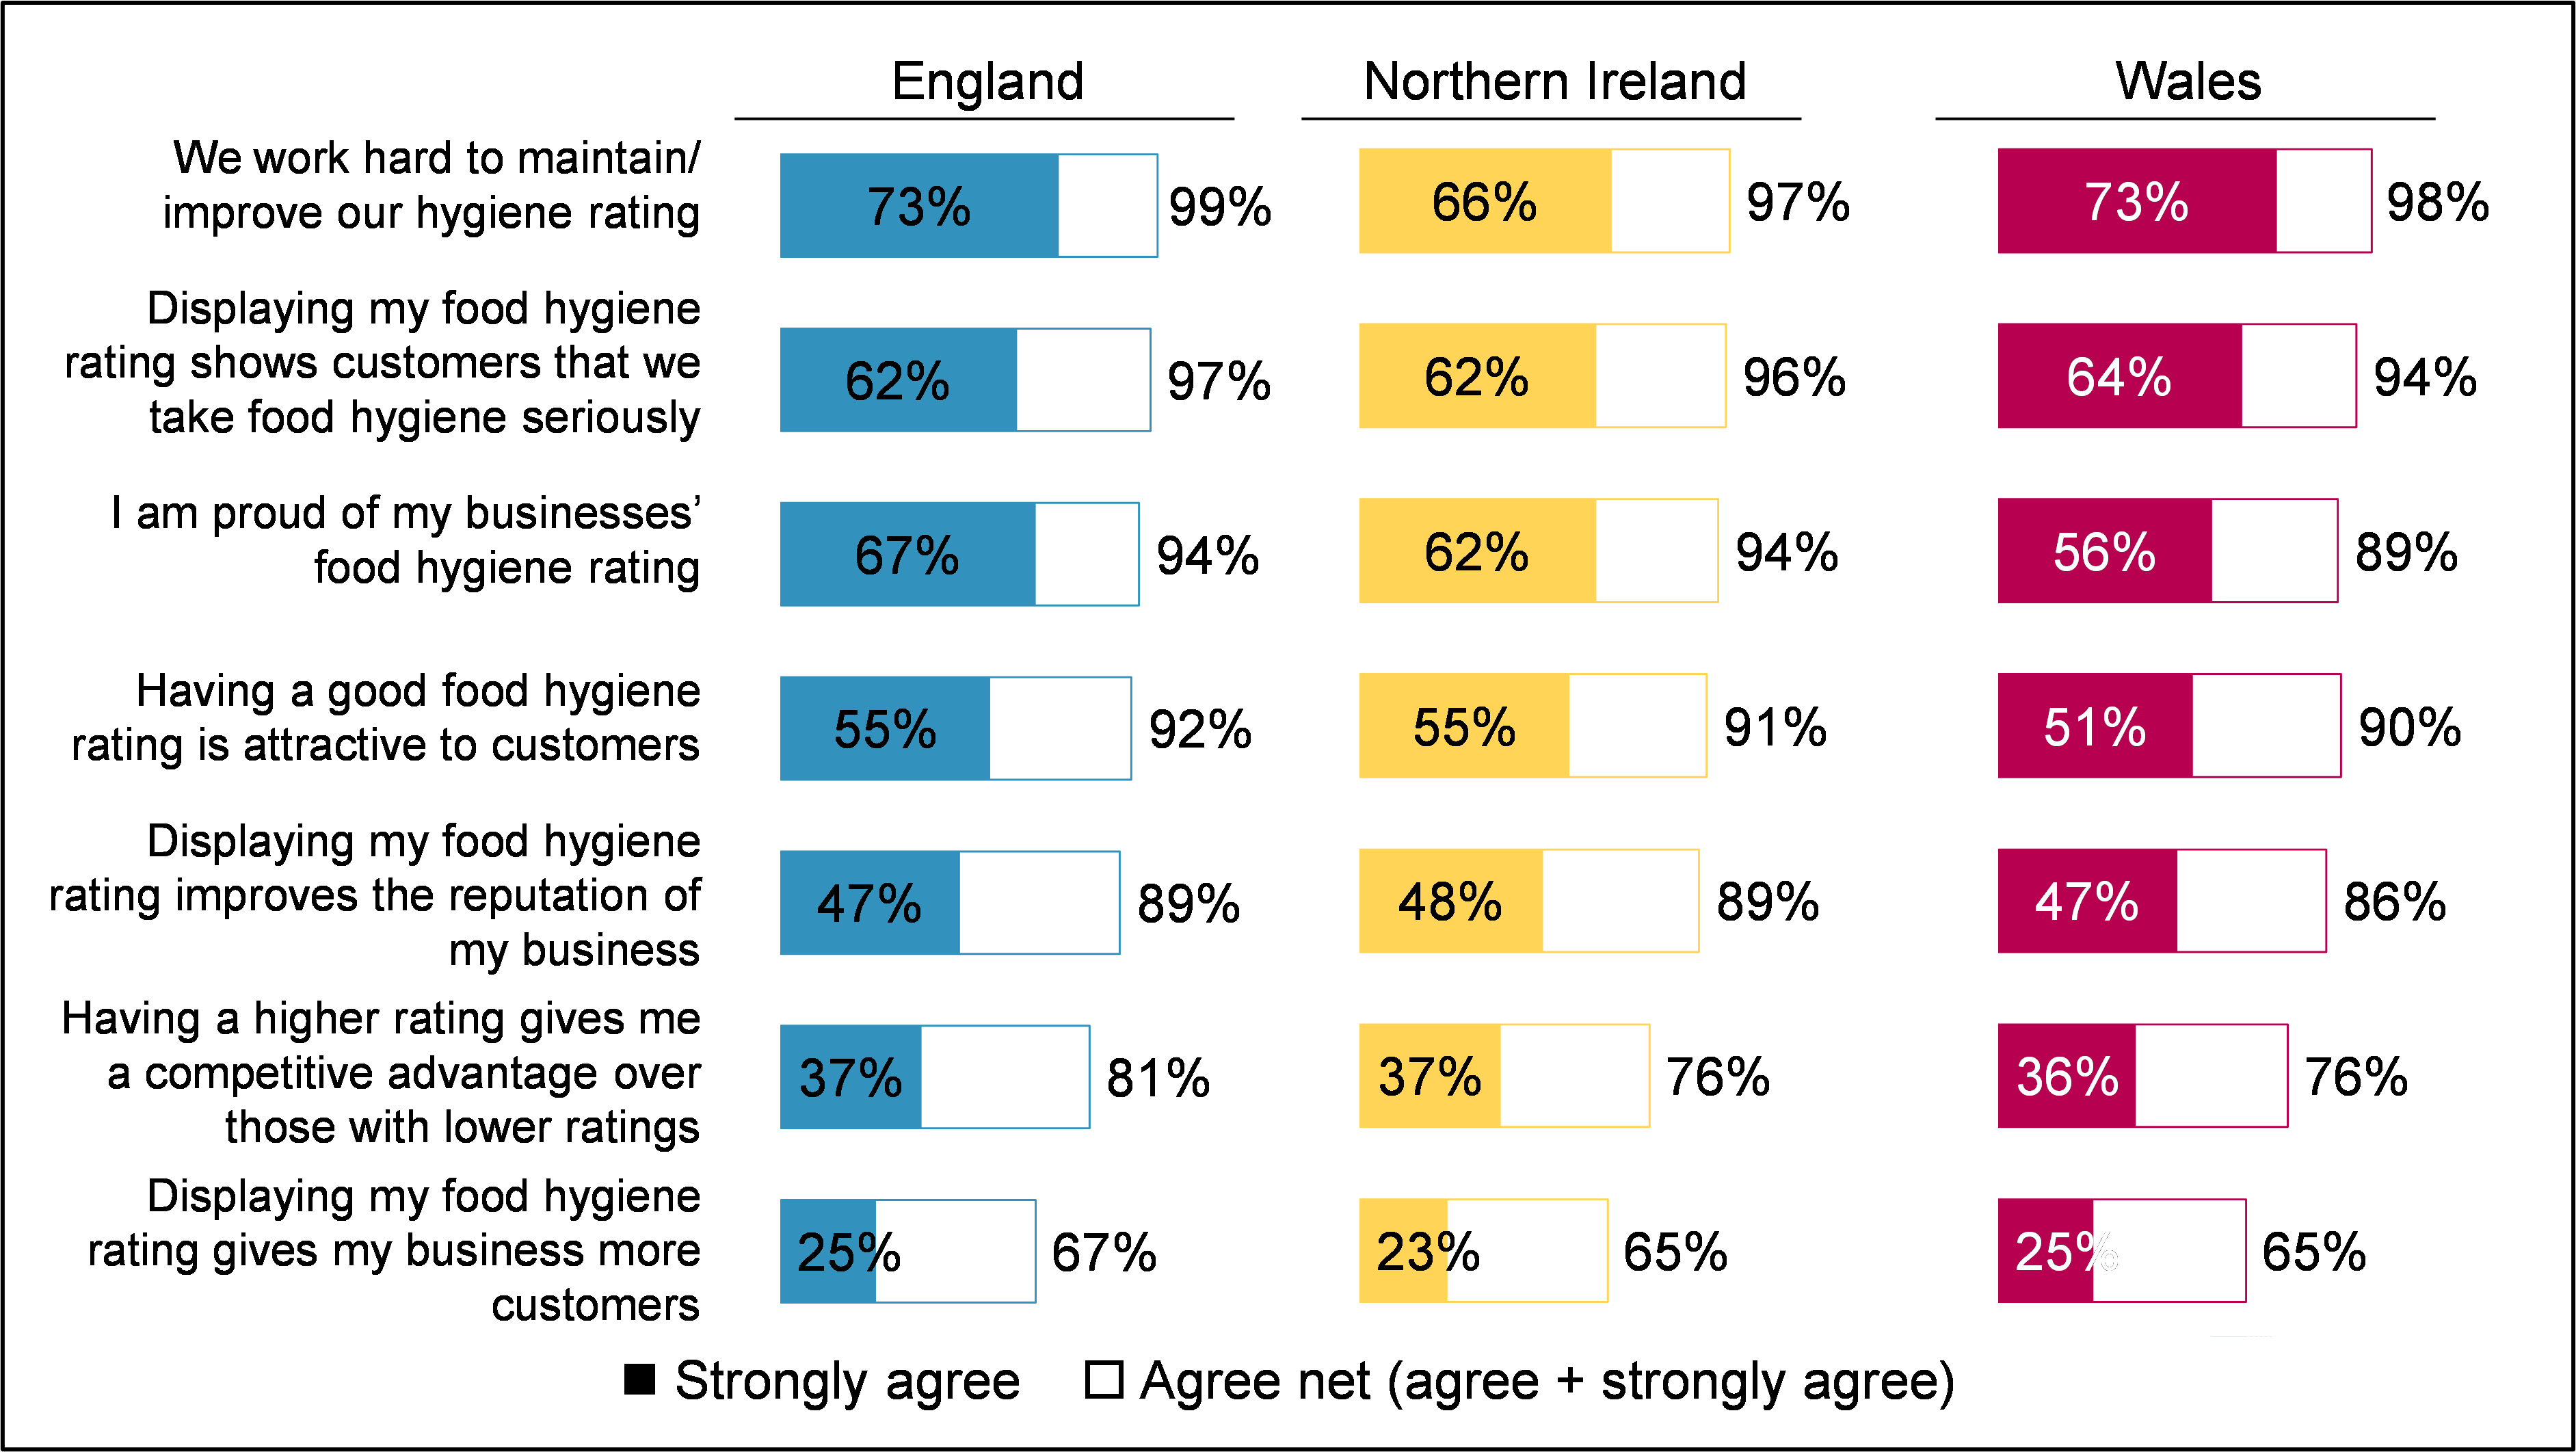
England: We work hard to maintain/improve our hygiene rating (Agree 73%, Strongly Agree 99%), Displaying my food hygiene rating shows customers that we take food hygiene seriously (Agree 62%, Strongly Agree 97%), I am proud of my businesses' food hygiene rating (Agree 67%, Strongly Agree 94%), Having a good food hygiene rating is attractive to customers (Agree 55%, Strongly Agree 92%), Displaying my food hygiene rating improves the reputation of my business (Agree 47%, Strongly Agree 89%), Having a higher rating gives me a competitive advantage over these with lower ratings (Agree 37%, Strongly Agree 81%), Displaying my food hygiene rating gives my business more customers (Agree 25%, Strongly Agree 67%). Northern Ireland: We work hard to maintain/improve our hygiene rating (Agree 66%, Strongly Agree 97%), Displaying my food hygiene rating shows customers that we take food hygiene seriously (Agree 62%, Strongly Agree 96%), I am proud of my businesses' food hygiene rating (Agree 62%, Strongly Agree 94%), Having a good food hygiene rating is attractive to customers (Agree 55%, Strongly Agree 91%), Displaying my food hygiene rating improves the reputation of my business (Agree 48%, Strongly Agree 89%), Having a higher rating gives me a competitive advantage over these with lower ratings (Agree 37%, Strongly Agree 76%), Displaying my food hygiene rating gives my business more customers (Agree 23%, Strongly Agree 65%). Wales: We work hard to maintain/improve our hygiene rating (Agree 73%, Strongly Agree 98%), Displaying my food hygiene rating shows customers that we take food hygiene seriously (Agree 64%, Strongly Agree 94%), I am proud of my businesses' food hygiene rating (Agree 56%, Strongly Agree 89%), Having a good food hygiene rating is attractive to customers (Agree 51%, Strongly Agree 90%), Displaying my food hygiene rating improves the reputation of my business (Agree 47%, Strongly Agree 86%), Having a higher rating gives me a competitive advantage over these with lower ratings (Agree 36%, Strongly Agree 76%), Displaying my food hygiene rating gives my business more customers (Agree 25%, Strongly Agree 65%).
B23. To what extent do you agree or disagree with the following statements about the Food Hygiene Rating scheme....? Base: FBOs with FHRS on display: England (407); Northern Ireland (477) Wales (467).
Furthermore, almost as many businesses stated that they were proud of their food hygiene rating (England 94%; Northern Ireland 94%; Wales 89%). Perhaps unsurprisingly, across all countries, those with a rating of 5 were more likely to be proud (England 98%; Northern Ireland 97%; Wales 96%). There were also differences by outlet type within both Northern Ireland and Wales. In Northern Ireland, restaurants and catering businesses were more likely to be proud of their rating (97%), while in Wales, accommodation and pubs, bars and nightclubs were less likely to be (83%).
Agreement was notably lower with regards to the impact the scheme has on levels of custom. There was widespread agreement that good food hygiene ratings were attractive to customers (England: 92%; Northern Ireland: 91%; Wales: 90%) and around two-thirds agreed that displaying a food hygiene rating resulted in more customers (England: 67%; Northern Ireland: 65%; Wales: 65%).
There was a similar ranking of different impacts seen in 2021.
Use of food hygiene ratings for promotion
Across each nation, less than one in five food businesses said they used their food hygiene rating to promote their business, for example through display in advertising or on menus (England: 14%; Northern Ireland: 11%; Wales: 9%).
In England, takeaways and sandwich shops stood out as more likely to use food hygiene ratings in promotional materials (27%), while retail businesses were less likely to (4%). Furthermore, English food businesses with a rating of 5 were more likely to use their rating in advertisements in England (16%). There were no significant differences by outlet type or rating in Northern Ireland or Wales.
Figure 8.2 presents the channels used by food businesses that use their food hygiene rating to advertise. The mix of channels used differed quite widely by country. In England and Northern Ireland, it was most common to advertise through take-away menus (England 31%; Northern Ireland 42%), while in Wales, free advertising and table menus were the more common channels (each used by 41% of businesses). The way this question was asked changed between 2021 and 2022, to separate out online and general forms of advertising, so comparisons over time are not possible.
Figure 8.2 Forms the Food Hygiene Rating is used for advertisement by country
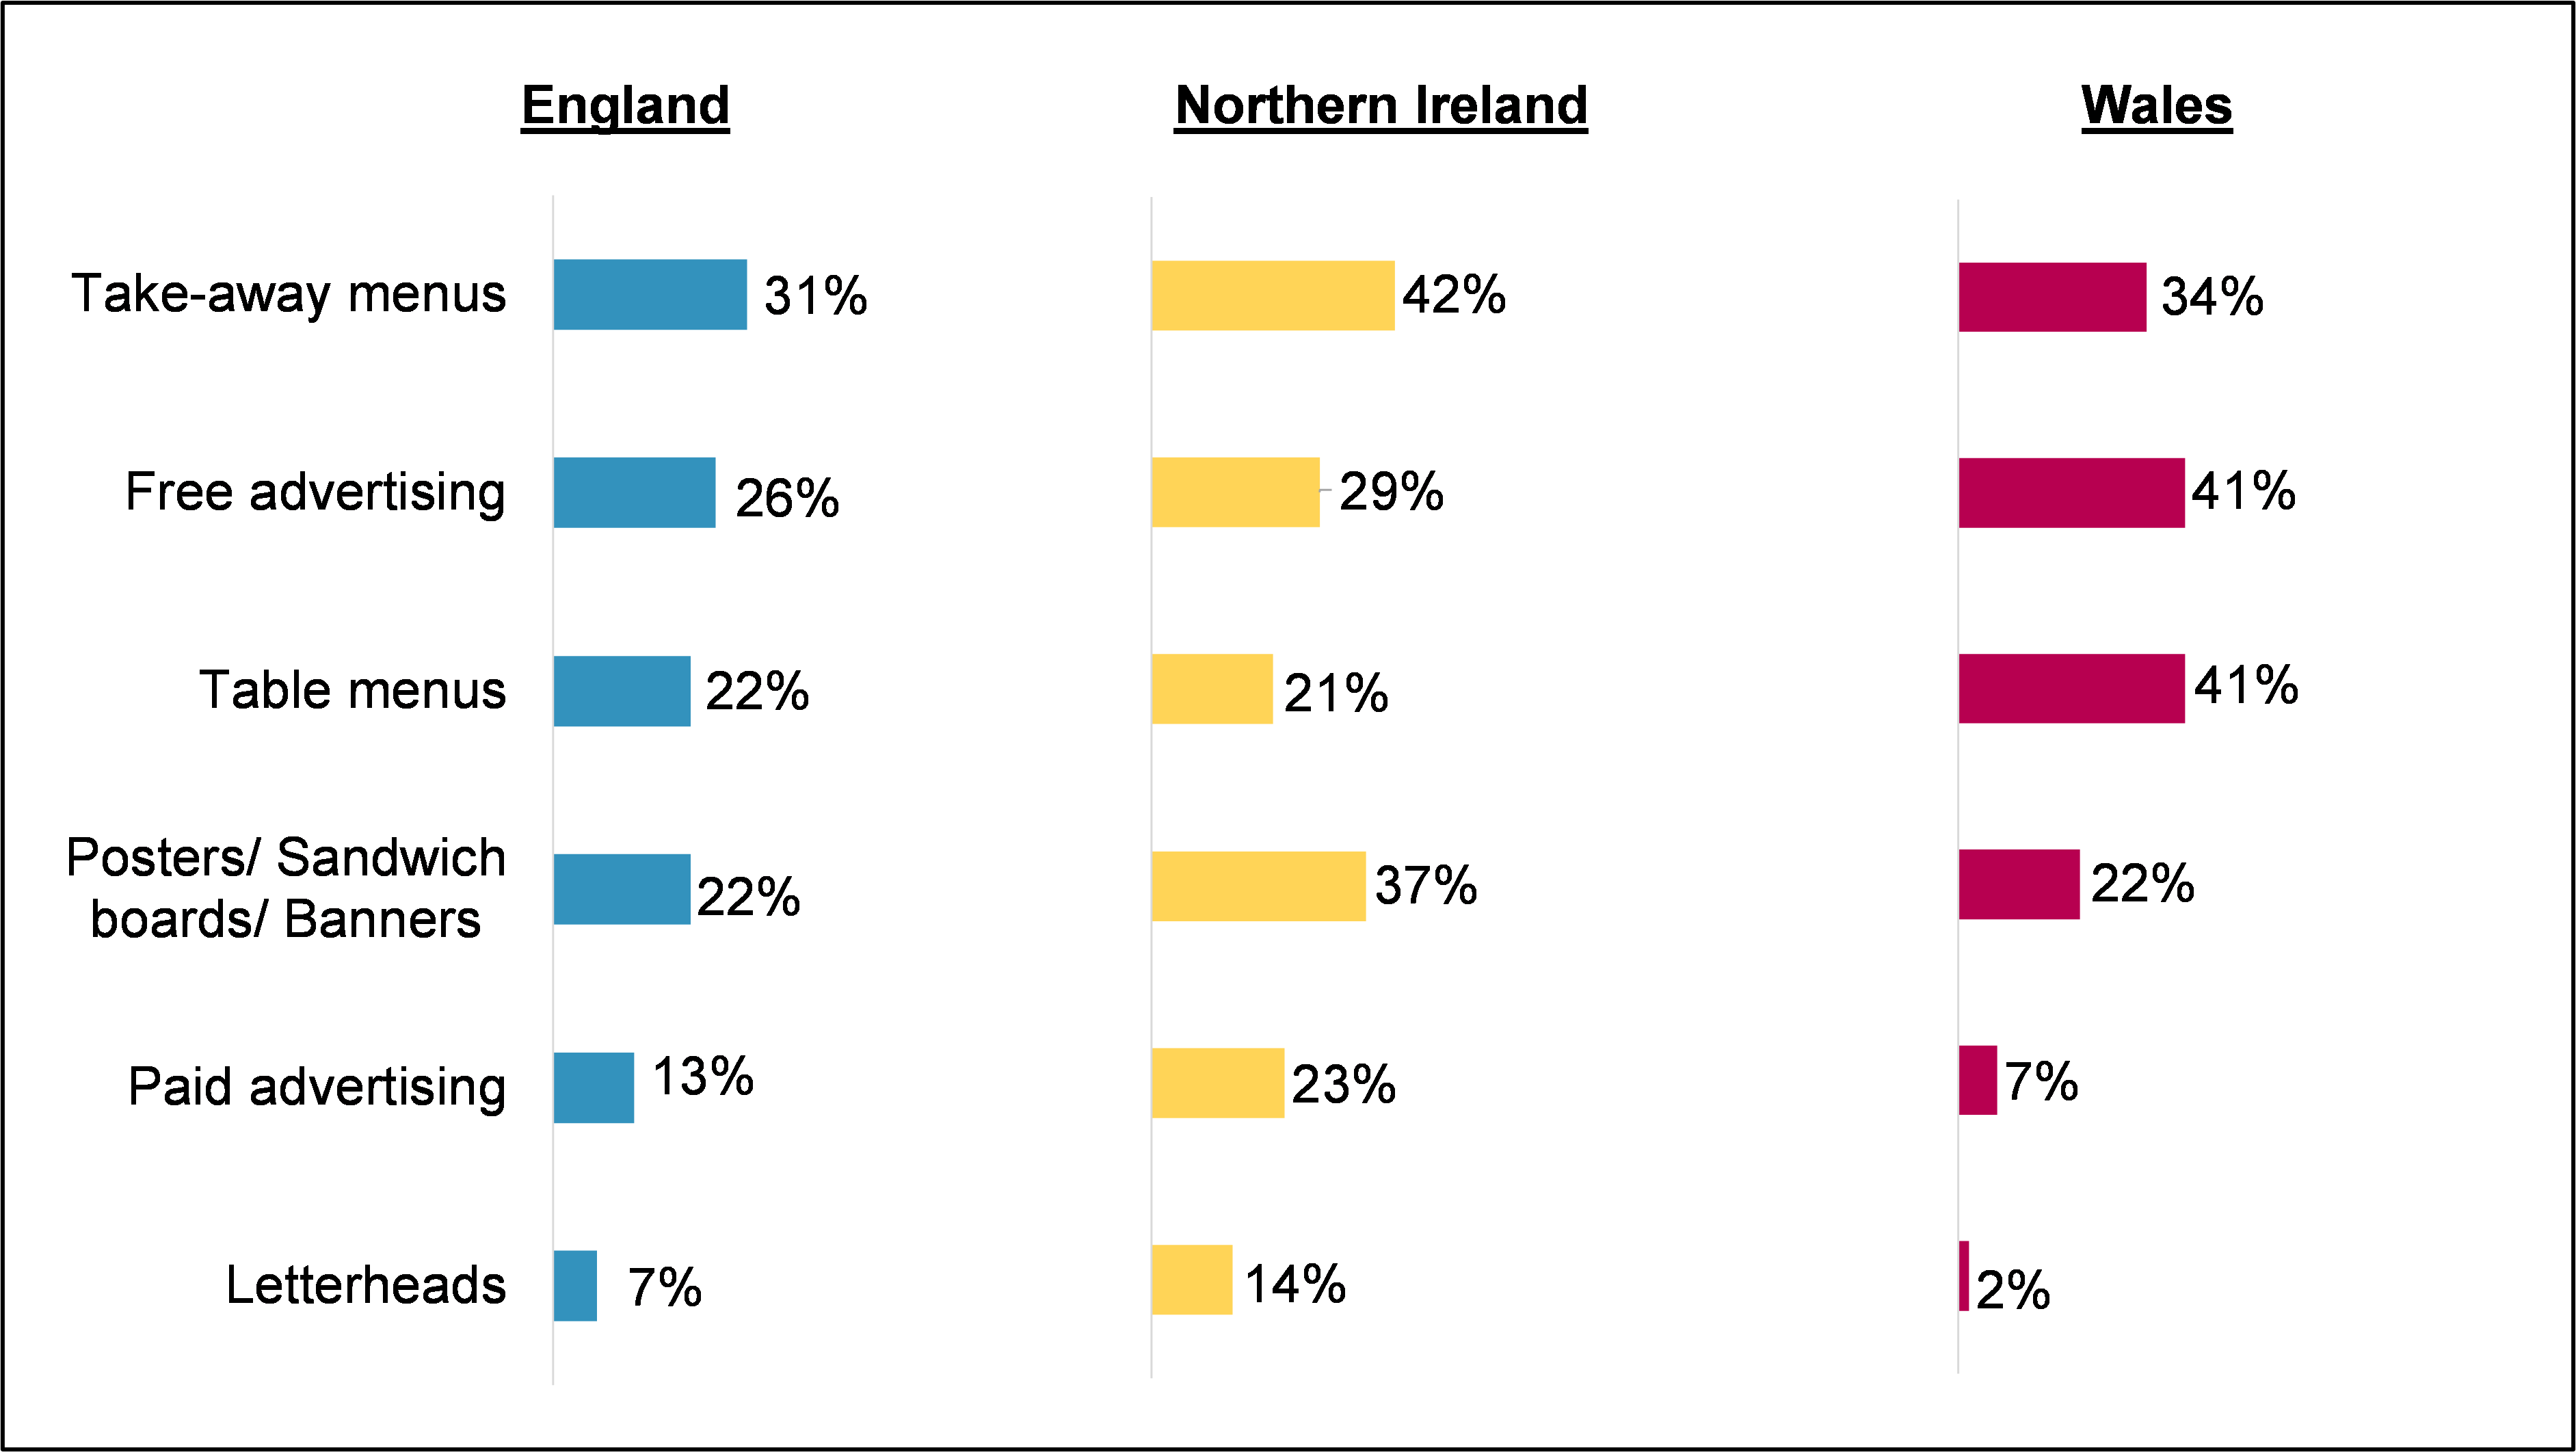
B18. Does your business currently use its Food Hygiene Rating in any of the following forms of advertisement? Base: FBOs who use their FHRS to advertise: England (58); Northern Ireland (51) Wales (44).
Changes made as a result of FHRS
Across all three nations, most food businesses that had received a food hygiene rating of 4 or less reported making changes to try to improve their rating (England: 83%; Northern Ireland: 85%; Wales: 82%)
As presented in Figure 8.3, the most common actions differed by country. In England, the most common action was undertaking repairs or improvements (25%), closely followed by cleaning the workplace or premises (24%). Whereas in Northern Ireland and Wales, the most common action was improving documentation or record keeping (Northern Ireland 38%; Wales 30%).
Figure 8.3 Changes made to improve food hygiene ratings
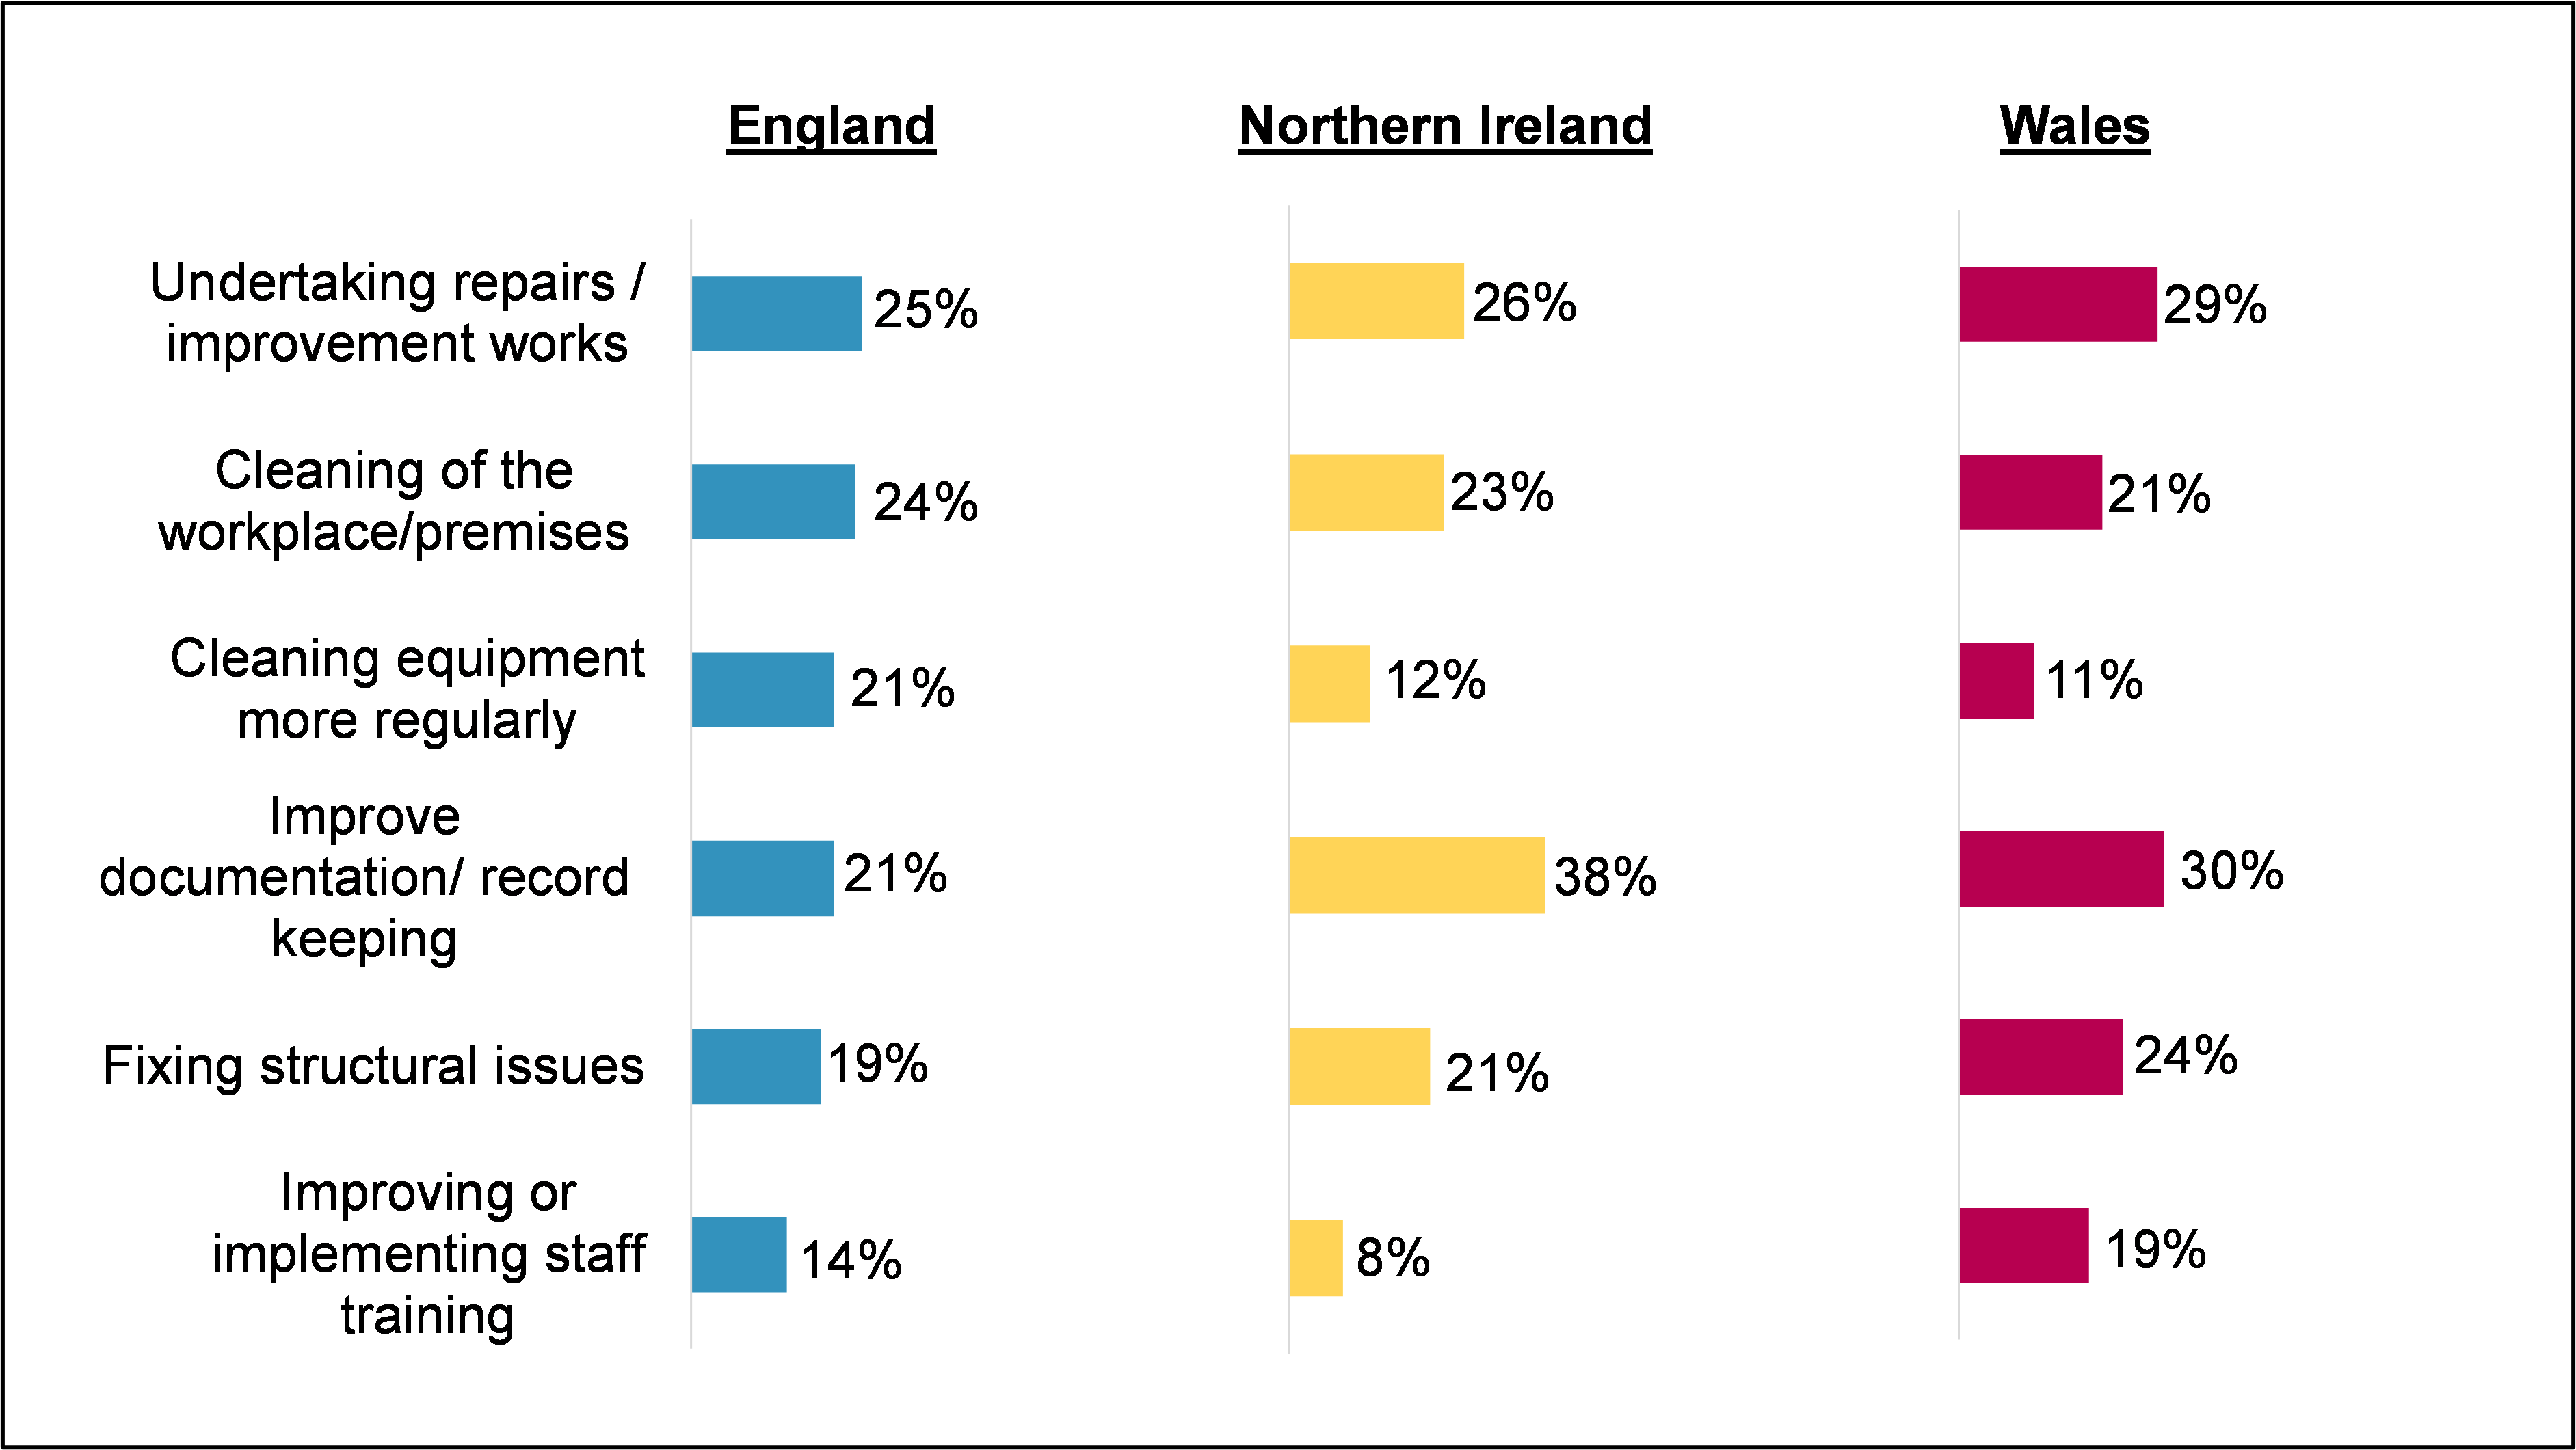
B9. What changes have you made at your premises in order to achieve a higher Food Hygiene Rating at your next inspection? Base: FBOs with a rating of less than 5 and made changes to improve their rating: England (89); Northern Ireland (75) Wales (133).
Some differences can be seen over time in the changes which businesses made to improve their food hygiene rating. There was an increase in the proportion of businesses citing improved documentation or record keeping in Northern Ireland (38%, up from 18% in 2021 and 17% in 2019).
A key finding from the research was that levels of compliance among businesses in Northern Ireland and Wales, in terms of displaying their food hygiene rating, had returned to pre-pandemic levels after a slight dip in 2021. Around nine in ten businesses in Northern Ireland (87%) and Wales (91%) were found to have their rating on display either inside or in a location visible from outside the premises (in 2021 comparable figures were 84% and 88% respectively). Compliance is therefore high in these countries where display is mandatory, although there are pockets of non-compliance, particularly among accommodation businesses, pubs, bars, and nightclubs in Northern Ireland (67% were found to have their rating displayed), and retail businesses in Wales (81%). Typically non-compliant businesses reported that there was nowhere suitable to display their rating. In England, around two-thirds (67%) of businesses were displaying a food hygiene rating, which was a continuation of an upward trend (55% displayed a sticker in 2017).
As found in previous years, most food businesses reported having heard of the FHRS (92% in each of England, Northern Ireland and Wales). Unlike previous years, that awareness was consistent across the three nations. Most were satisfied with their business’ food hygiene rating (in 2022: England 91%; Northern Ireland 95%; Wales 89%). Awareness that it is a legal requirement to display their food hygiene rating sticker at their premises in Northern Ireland and Wales was extremely high (95% and 96% respectively). Support for mandatory display was also high in England, with 82% of businesses believing it would be a good thing, broadly in line with 2021 (85%). There was also a strong consensus that the display of food hygiene ratings should become mandatory for at least some online platforms (England: 92%; Northern Ireland: 93%; Wales: 93%), although audit results showed that only a small minority currently used their website or Facebook Business Page to display their rating (13% in England, 6% in Northern Ireland and 8% in Wales).
More than three quarters of businesses in each country recalled receiving their inspection letter (Northern Ireland 86%, Wales 82%, England 78%). Overall awareness that they could request a re-rating, appeal and had the ‘right to reply’ was high, with at least three in four aware of each option in England and closer to nine in ten aware in Northern Ireland and Wales, all in line with 2021 results. Of businesses that applied for a re-rating, more than half reported being awarded a higher rating.
Among businesses who were not satisfied with their food hygiene rating but chose not to apply for a re-rating, the most common reasons given were that the fees were too high, that they lacked time to do so, or that they perceived the system was unfair. In contrast to 2021, the COVID-19 pandemic was not mentioned at all as a barrier. Businesses who were not satisfied with their food hygiene rating and did not exercise their ‘right to reply’ were also asked why and the most common reason was because they would need to make the changes required (27%).
In line with previous years, most businesses are incentivised to maintain or improve their food hygiene rating and consider that the display of their rating has a range of positive impacts on customer perceptions of the business. Nearly all food businesses agreed that they work hard to maintain or improve their food hygiene rating (England 99%; Northern Ireland 97%; Wales 98%). In line with 2021, most businesses stated that they were proud of their food hygiene rating and that good food hygiene ratings were attractive to customers.
Revision log
Published: 29 June 2023
Last updated: 5 July 2024