Research project
Surveillance Sampling Programme
This project sampled retail food products for the Food Standards Agency (FSA) to identify emerging food safety risks and increase the our intelligence on the food system.
1. Executive Summary
This project carried out targeted surveillance sampling of retail food products for the Food Standards Agency (FSA) to help identify emerging food safety risks and increase the FSA’s intelligence on the food system. The programme was delivered in partnership by the 3 Local Authority Official Food and Feed Laboratories (OLs) and the 2 private OLs in England and Wales.
Food samples(footnote) were purchased across England, Wales and Northern Ireland from large Food Business Operators (FBOs) such as national supermarkets, and smaller FBOs such as independent retailers, with approximately 10% of all samples purchased via internet sites.
A total of 1215 food samples from 28 different food commodity types were collected and tested. The foods were categorised as basket of foods, those frequently consumed, or surveillance, food types that would inform the FSA’s knowledge of risk. Some of the surveillance samples were tested for compliance and others were analysed to provide information to the FSA on the level of contaminants present, where there are92.50 no strict legal limits in order to inform the FSAs scientific knowledge and policy development. While both categories contributed to the objectives outlined above, results from the basket of food also contributed to the FSA and Food Standards Scotland (FSS) Annual Food Standards Report.
Foods can be deemed non-compliant to regulatory requirements for a variety of reasons, many of which do not pose concern for human health. Samples were recorded as non-compliant in the following circumstances:
- detection of undeclared allergens
- presence of contaminants, such as mycotoxins and heavy metals, above permitted levels
- adulteration or substitution of products such as basmati rice, meat, fish, cheese and herbs
- composition of food tested not accurately presented in the food label
- food labels not complying with The Food Information Regulations 2014 or industry guidance.
The FSA were informed immediately of any significant safety hazards, such as the presence of undeclared allergens, and reports for all non-compliant samples were provided to the FSA for appropriate follow up action to be taken.
Samples were analysed by Public Analysts who are scientists who examine food and feed to check its compliance with food and feed law. They reported 81% of the samples tested for compliance as satisfactory. The compliance rate for the basket of foods was 86% and for the surveillance samples 75%. Samples purchased from larger FBOs in this survey had a compliance rate of 96%. Food samples purchased from small FBOs were 75% compliant meaning that one in four were reported as unsatisfactory. Samples purchased online had a compliance rate of 76%.
As this was a targeted sampling programme results are not representative of food safety and standards in the UK. Foods and hazards were selected for inclusion based on their potential safety or food standards risks. In addition, a greater proportion of samples were taken from small FBOs than large FBOs as previous survey results [Surveillance Sampling, Surveillance Sampling Programme 201/22] found higher levels of non-compliant products in these businesses.
Undeclared allergens were detected in 16% of the 267 foods tested for the presence of allergens including over a third of prepacked products for direct sale (PPDS) tested. In addition, a fifth of bread products tested contained allergens not declared on the label. All the bread products containing undeclared allergens were also PPDS. All cases of undeclared allergens were reported immediately to the FSA who shared this information with relevant Local Authorities responsible for enforcement.
Authenticity testing was carried out on 437 samples including meat and meat products, herbs and spices, basmati rice, coffee, cheese and olive oil with 97% reported as authentic and two reported as inconclusive. The main commodities with authenticity issues identified were oregano with 13% of samples containing other leaf types and basmati rice with 10% of the basmati rice samples reported as having been adulterated with non-basmati rice varieties or in one instance having no approved basmati varieties at all.
A total of 89 herbs / spices were tested for compliance with contaminants regulations. Mycotoxins above regulatory limits were detected in 9% and this was mainly in nutmeg. None of the 59 samples tested for metals had levels above regulatory limits.
Compositional analysis was carried out on 689 samples and 58 were reported as unsatisfactory in this respect by the Public Analysts. The fat content of 27% of the 30 milks tested were outside the permitted limits. Composition checks on a total of 265 meat and meat products including pork sausages, chicken ready meals, minced beef, tinned meat and packaged sandwich meat showed 14% did not comply with requirements, low meat content being the most common reason. The water content of joints of meat was checked against the content declared on the label and 1 of the 50 samples was reported as unsatisfactory. Olive oils did not meet appropriate compositional characteristics in 11% of samples tested.
The Public Analysts reviewed 999 food labels for irregularities with regards to the analysis that was undertaken and unsatisfactory labelling was identified as the reason for failure for 7% of the samples.
The four commodities tested to provide data on contaminants present and their levels included edible insects for heavy metals, marine algae (seaweed) for heavy metals and iodine, vegetable crisps for acrylamide and cooking oils for presence of other oils. No significant heavy metals levels were detected in the insects but two kelp samples were highlighted as having notable levels of inorganic arsenic. Significant levels of iodine was detected in 55% of the marine algae samples. High levels of acrylamide were detected in 10% of the vegetable crisps tested and Public Analysts highlighted 9% of the cooking oils as potentially needing further investigation.
While the majority of samples tested as part of this targeted sampling programme met the legal requirements for the parameters checked, the project has highlighted some areas of risk. Ongoing market surveillance is essential to ensure food is safe and what it says it is and provide current intelligence. The continued collaborative working between the Public Analyst OLs themselves and between the OLs and the FSA is laying excellent foundations for the new Food Law Code of Practice for Food Standards which is heavily focussed on delivery of food standards work via an intelligence led approach.
2. Introduction
2.1 Project Aim
To carry out food surveillance sampling and analysis of specific food types across England, Wales and Northern Ireland to help identify emerging food safety risks and increase the Food Standards Agency’s intelligence on the food system.
2.2 Background
Targeted surveillance sampling contributes to the FSA’s aims through identifying and evaluating emerging food risks and monitoring that food is what it says it is. The results of surveillance sampling assist in narrowing down areas of risk to food from the wide range of intelligence received. Furthermore, the results contribute to work to monitor the food standards in the United Kingdom post EU exit. This programme builds upon the work carried out in the 2020/21 food sampling during Covid-19 programme and the subsequent 2021/22 retail surveillance sampling survey.
Using a co-ordinated approach with the 5 OLs in England and Wales a surveillance sampling programme was developed to purchase food samples from retailers in England, Wales and Northern Ireland.
2.3 Official Food and Feed Control Laboratories (OLs)
The FSA are the Central Competent Authority responsible for designating food and feed official laboratories in the UK according to the Multi-Annual National Control Plan, as required by the assimilated Official Feed and Food Control Regulations 2017/625. The FSA and FSS in Scotland, have the responsibility for ensuring the United Kingdom has sufficient laboratory capacity and capability to deliver official controls on feed and food safety and standards in order to protect public health. The Official Control Laboratories (OLs) are not owned or operated by the FSA.
There are currently 5 OLs in England and Wales:
- Hampshire Scientific Service
- Kent Scientific Services
- Lancashire County Scientific Services
- Minton Treharne and Davies Ltd
- Public Analyst Scientific Services
All OLs are accredited to ISO17025 by The United Kingdom Accreditation Service (UKAS) and employ suitably qualified staff including Public Analysts, Agricultural Analysts and Food Examiners for enforcement purposes.
3. Project outline
3.1 Purpose and Scope
Based on FSA and OL intelligence, a number of key sampling areas of interest were determined using a range of means to identify commodities for sampling including FSA surveillance tools, horizon scanning and policy and scientific expertise.
The samples were split into two categories:
3.1.1 Basket of foods
The basket of foods included commodities deemed to be frequently consumed via economics data and literature and targeted for surveillance due to known potential risks. The results of basket of foods samples contribute to the FSA/FSS Annual Food Standards Report.
The results of last year’s basket of food samples were reviewed and all product types were included in this year’s basket, with the exception of pasta which had not highlighted any issues in previous surveys. Additional commodities in this year’s basket included butter / margarine spreads, ground coffee, minced meat, plain low-fat yogurts and sausages.
3.1.2 Surveillance
This category included commodities for which surveillance is deemed useful to inform the FSA’s knowledge of risk based on intelligence and information on the global food market. Some of these commodities were analysed for compliance purposes and some for science and research purposes to build FSA intelligence and inform future policy.
The project aimed to provide representative surveillance across England, Wales and Northern Ireland. All samples were purchased by the OLs from businesses selling to the general public, either in store or online.
The samples were divided between the OLs for analysis according to the analytical capabilities of each laboratory. Each OL used analytical methods that are routinely employed for enforcement purposes and reported the samples against appropriate legislation for the food product, and the tests undertaken. Regulatory divergence since EU Exit was taken into consideration when interpreting results and accounted for the regulatory requirements of NI, as required by the Windsor Framework.
The Hampshire Scientific Service project team worked in partnership with the FSA throughout the project to respond to any emerging issues and allow the project scope to be reviewed as the wider food sampling landscape evolved.
3.2 Sampling Priorities
A total of 28 commodities were identified as sampling priorities with 15 commodities in the Basket of Foods. The Surveillance group had nine commodities which were analysed for compliance to legislation and four commodities sampled for science and research purposes in order to provide the FSA with information for risk assessments and policy decisions.
Full details for the commodities and the analysis undertaken are included in Tables 2 to 4 in the Appendix.
4. Method
4.1 Sampling
The informal purchasing of samples was carried out by OL staff who were provided with a shopping list and an area of the country in which to shop. In general, single samples were purchased unless the sample size or nature of the hazard being tested for required multiple samples to be purchased and a combined sample tested. All products were purchased at full cost from businesses selling to the public and the FBOs were not notified that samples were being taken for subsequent testing. The sampling plan focussed on the range of products identified for this project and did not target specific retailers or brands. Some samples were purchased via the internet to reflect the consumer migration to on-line shopping and provide national coverage.
4.1.1 Geographic Distribution
The sampling was undertaken by OL staff with each OL identifying areas of England, Wales and Northern Ireland where they could purchase samples. All samples were identified by postcode on a sampling map and areas of the country not covered by OL staff were targeted for on-line purchases where possible.
4.1.2 Retail Types
Samples were taken from a range of different size FBOs and online retailers. The project aim was to obtain approximately 35% of samples from large FBOs and 65% from smaller FBOs. Of these samples, the aim was to collect approximately 90% via physical purchases from retailers and 10% via online ordering.
Large retailers included mainstream supermarkets with national coverage or at least across multiple counties, or large food distributors. Samplers focussed on products from budget or own brand ranges where possible. Smaller retailers included FBOs smaller than this, such as independent retailers, farm stores, stores operating under franchise, and self-service wholesale stores.
4.1.3 Sample Size
The sample size for each commodity type was determined at the outset depending on the analysis that was being undertaken. Generally, only single food items were analysed but in some instances more than one sample with the same batch code were tested by the laboratories. In particular at least four samples of the same batch were purchased for nutmeg, oregano and turmeric to allow for analysis for mycotoxins which are not evenly distributed. It should be noted that as samples were taken for surveillance purposes as opposed to enforcement the number of samples taken was not always consistent with that prescribed in the relevant legislation, as this number of samples is challenging to take in a retail environment.
4.1.4 Duplication of Samples
Sampling was coordinated across all five OLs to minimise duplication. OLs were provided with a list of major supermarkets and national FBOs and were only allowed to sample from those specifically allocated to them.
A similar approach was taken with allocation of main brands for each sample type.
4.1.5 Sample Integrity
Sampling information was provided for each food commodity to ensure that sufficient amount of sample was obtained and that samples were of a suitable standard for testing. This included the appropriate conditions for transportation and storage so as to not adversely impact on the sample integrity or the quality of the final analytical result.
4.2 Analysis
Each OL was allocated samples according to their analytical capabilities and used the most appropriate method for each commodity / hazard analysed using accredited methods if available. All the surveillance samples in this project were analysed using procedures used for official control samples and the integrity of the samples was maintained at all times with comprehensive records to demonstrate chain of custody.
Raw data for all samples including any replicate analysis, positive and negative controls and quality control materials were recorded and all records kept for a period of at least 12 months.
The FSA were provided with a sample report including photographs of packaging and interpretation of the analytical results with regards to the relevant legislation for all unsatisfactory samples as well as complete project data for all samples.
In the event that a laboratory identified something that it considered to be a significant hazard to human health the FSA were informed immediately.
5. Results
5.1 A total of 1,215 samples were purchased across England, Wales and Northern Ireland of which 1028 were analysed by OLs for compliance against legislation. A further 187 were tested for science and research purposes.
Where regulatory divergence has occurred due to EU Exit, sample compliance was assessed against the legal requirements of the country in which the product was being sold.
Table 1: Numbers of Samples Purchased and Analysed
| Summary | Total |
|---|---|
| Total number of Products Sampled: | 1215 |
| Basket of Food Samples: | 592 |
| Surveillance Commodity Samples: | 623 |
Figure 1: Sample Distribution Map with Outcomes
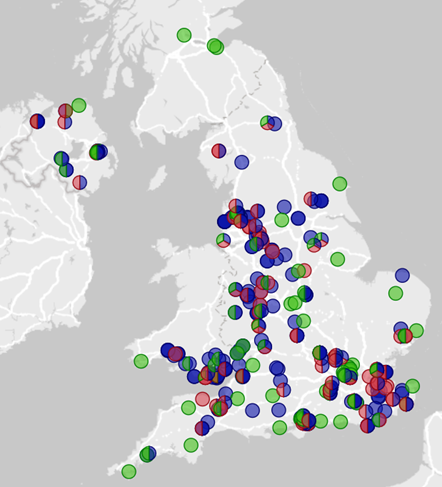
Figure 1: Sample Distribution Map with Outcomes shows the sampling distribution of all samples across England, Wales and Northern Ireland and indicates the samples that were compliant and noncompliant. There is a relatively even spread of samples with no hot spots for noncompliant results. A total of 955 samples were taken in England, 164 in Wales and 96 in Northern Ireland.
Figure 2: Summary of Basket of Foods Data
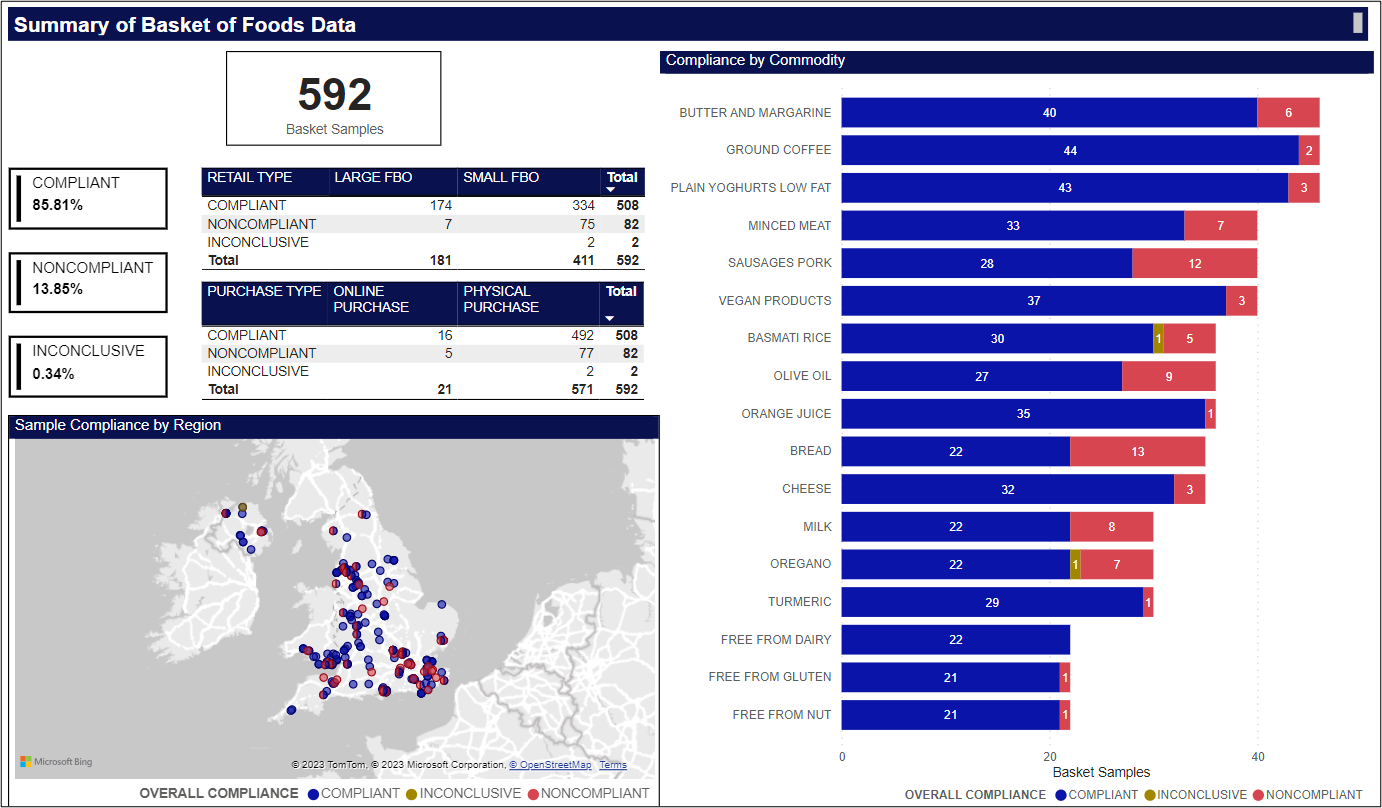
Figure 2: Summary of Basket of Foods Data shows that 592 basket of food samples were taken of which 508 samples were compliant, 82 were non-compliant and 2 samples returned inconclusive results.
The graphic includes:
- a distribution map showing the basket sampling coverage across England, Wales and Northern Ireland. There is a fairly even coverage across England, Wales and Northern Ireland, with some denser areas of sampling in the areas closest to the laboratories.
- a stacked bar chart of the different basket commodities showing the number of compliant and non-compliant samples for each type. For example, Butter and Margarine is shown to have 40 compliant and 6 non-compliant outcomes.
The full data is presented in table format (Table 5: Basket of Foods Sample Numbers and Compliance).
- a table listing the retail outlets and the total number of basket samples taken from each, broken down as the number of compliant, non-compliant and inconclusive results.
- for example, of the 592 samples 411 were taken from small food business organisations, of which 334 were compliant, and 181 were taken from large food business organisations, of which 174 were compliant.
The full data is presented in table format (Table 9: Basket of Foods Compliance by Retail Outlet Type)
- a second table shows the split of online and physical purchases. Of the total 592 basket samples, 21 were purchased online of which 16 were compliant, and 492 of the 571 physical purchases were also compliant.
Figure 3: Summary of Surveillance Data

Figure 3: Summary of Surveillance Commodities Data shows that 623 surveillance samples were taken. Of those tested for compliance 328 samples were compliant and 108 were non-compliant. A further 187 samples were taken for science and research purposes.
The graphic includes:
- a distribution map showing the surveillance sampling coverage across England, Wales and Northern Ireland. There is a fairly even coverage across England, Wales and Northern Ireland. No geographical areas were identified as having a higher frequency of sample non-compliance than others.
- a stacked bar chart of the different surveillance commodities showing the number of compliant and non-compliant samples for each type.
- for example, Chicken ready meals are shown to have 57 compliant and 12 non-compliant outcomes, and plant-based meat is shown to have 40 compliant and 6 non-compliant outcomes.
The full data is presented in table format (Table 6: Surveillance Commodities Sample Numbers and Compliance).
- a table listing the retail outlets and the total number of surveillance samples taken from each, broken down as the number of compliant, non-compliant and science and research results.
- for example, of the total 623 samples 462 were taken from small food business organisations, of which 152 were tested for science and research purposes and 207 were compliant.
The full data is presented in table format (Table 10: Surveillance Commodities Compliance by Retail Outlet Type)
- a second table shows the split of online and physical purchases. For example, of the total 623 surveillance samples, 104 were purchased online 88 of which were for science and research purposes, and of the 328 compliant samples 316 were physically purchased.
6. Discussion
6.1 Project Overview
The overall compliance rate for samples analysed in this project was 81% with 836 of the 1,028 samples tested for compliance purposes reported as compliant with regards to the analysis undertaken.
There were two samples reported as inconclusive. A basmati rice where the DNA extracted was not of a suitable quality for the testing to be completed and an oregano where a suitable reference sample was not available to confirm if this was typical of Iranian oregano.
The samples were purchased from a range of retail outlets with a view to representing the range of shopping habits.
- 72% samples were purchased from small FBOs
- 28% from large FBOs
- 10% as online purchases (from both small and large FBOs)
Samples purchased from large FBOs including supermarkets and wholesalers showed the highest level of compliance in this survey with 96% compliance. For smaller retailers, 25% of samples tested for compliance were reported as unsatisfactory by the Public Analysts. On-line purchases were mainly made from small FBOs and their compliance reflects this with 24% of internet purchases being reported as non-compliant.
The maps show there was a wide geographical spread of samples (Figure 2 and Figure 3), and no patterns of non-compliant hotspots were identified (Figure 1).
A total of 190 samples were reported as non-compliant and these were placed into the following categories:
- allergens
- authenticity
- contaminants
- composition
- labelling
In general, single food items (samples) were purchased for analysis as described in section 4.1.3. This should be taken into consideration when interpreting the results. Results for composition for example may not be representative of the whole batch of a product and non-compliances may require further assessment.
6.2 Basket of Foods
A total of 592 products from 15 frequently consumed commodity types were tested for compliance to appropriate legislation and the compliance rates ranged from 63% to 97%.
6.2.1 Bread products
Packaged bread products analysed for the presence of sesame and milk allergens not declared on the label or included in precautionary allergen labelling (PAL), had a compliance rate of 63% which was the lowest of the basket food commodities. Seven of the 35 samples (20%) had undeclared allergens present and all of these samples were pre-packed for direct sale.
Both sesame and milk allergens were detected in two samples, a granary loaf and an unsliced granary loaf with seeds, which were prepacked for direct sale and bore no-labelling. Milk protein was detected in four samples including a small brown loaf and brown stotties which did not declare milk on the label and a sliced white loaf and barm cakes which did not have any labelling.
A sample of bread rolls, with no labelling, tested negative for the presence of both milk and sesame protein however a single seed visually identified as sesame, was present on one roll prior to testing.
In addition to non-compliances being established for allergens in this commodity type, six bread samples were reported as non-compliant due to labelling issues. These included allergen ingredients not emphasised in the ingredients list, incorrect naming conventions used for additives and nutritional values not listed in the correct format or rounded as per the regulations.
6.2.2 Pork Sausages
Fresh and frozen pork sausages analysed for meat content to check compliance with Quantitative Ingredient Declaration (QUID) and meat species to check for any undeclared species presence had a compliance rate of 70% for the 40 samples tested.
The meat content of six of the samples purchased from small food businesses was below the declared value. In one sample from a small food business 13% ovine (sheep) DNA was detected in addition to porcine (pig), and the associated ingredients list did not declare the presence of ovine derived ingredients.
Labelling irregularities were identified in a further five samples. These included lack of QUID declaration, allergens not being highlighted in bold in the ingredients list, use of non-permitted colours and missing ingredients in the ingredients list.
6.2.3 Milk
The compliance rate for the 30 samples of milk tested for fat content was 73%.
The Drinking Milk (England) Regulations 2008 require that semi-skimmed milk must have a fat content of not less than 1.50% and not more than 1.80% and that standardised whole milk must have a fat content of not less than 3.50%. The fat content of three semi skimmed samples was greater than the 1.80% permitted by the regulations. A further five samples had fat content less than the permitted levels, four of these were whole milks and one was semi skimmed.
6.2.4 Oregano
Oregano samples were examined by microscopy for authenticity and analysed for the presence of aflatoxins, ochratoxin A and heavy metals. Aflatoxins and ochratoxin A are mycotoxins, a group of naturally occurring chemicals produced by certain moulds. They can cause a variety of adverse health effects. The compliance rate for the 30 samples was 73%.
Microscopic examination identified four samples which showed the presence of leaf other than oregano with three of these containing olive leaves in proportions varying from 10% to 25% of the sample. The fourth sample had sensory characteristics significantly different to those typically associated with oregano and microscopically had an excessive amount of foreign green leaf. The outcome of the examination of a further sample was inconclusive. The inconclusive sample was inconsistent with the reference sample of European oregano. However, the country of origin was Iran and it may be consistent with a plant species designated as oregano in Iran.
Microscopic examination also identified both insect fragments and a small piece of synthetic fibre in a sample that was deemed not to be of the substance demanded within the meaning of section 14 of the Food Safety Act 1990.
Heavy metals analysis highlighted one sample with a level of lead 5.68 mg/kg. There is no limit for lead in dried oregano in the Contaminants in Food (England) Regulations 2013, but this was highlighted as an excessive amount by the Public Analyst.
None of the oregano samples were non-compliant with regards to the levels of aflatoxins and ochratoxin A detected.
A labelling irregularity was identified in one sample which should have been named Dried Oregano.
6.2.5 Olive Oil
The authenticity and composition of 36 olive oil samples was tested for compliance with the Commission Delegated Regulation (EU) 2022/2104 which defines the characteristics to be fulfilled by oil described as olive oil. The overall compliance was 75% with four olive oils not meeting the compositional requirements and a further five samples having labelling irregularities.
Three extra virgin olive oil samples failed compositional tests as they only complied with 10 of the 11 defined characteristics tested. In two of these samples the specific extinction K232 exceeded the 2.50 maximum prescribed value and in the other the acidity exceeded the 0.80 maximum. The specific extinction figures are used as indicators of oxidation and generally the lower the value the purer and fresher the oil.
The fourth compositional non-compliant sample was a virgin olive oil and only six of the 11 characteristics tested complied with the requirements to be a virgin olive oil. The specific extinctions K232 and K268 and the variation of the specific extinction delta-K exceeded their respective 2.60, 0.25 and 0.01 maximum prescribed values and the fatty acids myristic and behenic exceeded their respective 0.03% and 0.20% maximum values.
The labelling issues identified included incorrect storage conditions, nutrition information not in the prescribed format, no business name and address of the importer and incorrect durability wording.
6.2.6 Minced Meat
Beef mince samples were analysed for fat levels, collagen to protein ratio and labelling compliance. Of the 40 samples analysed five were non-compliant for composition and two for labelling giving an overall compliance of 83%.
Regulation (EU) No 1169/2011, Annex VI as enforced by the Food Information Regulations 2014 prescribes the compositional and labelling criteria for minced meat. An extra lean steak mince sample contained 9.6% fat which is greater than the permitted level of 7% and three more extra lean mince samples had higher fat content than declared on the label although still lower than the permitted 7% level for lean mince. In addition, a beef mince sample had a 24% collagen to protein ratio which exceeded the permitted 15% for a product described as ‘beef mince’.
The labelling issues included insufficiently precise name of food and non-permitted colour included in list of ingredients.
6.2.7 Basmati Rice
The rice variety of Basmati rice samples was checked using the detection of PCR micro satellite markers to test the authenticity of the rice. The proportion of broken grains was also determined to check for substitution with poorer quality rice.
The compliance rate of the 36 basmati rice samples tested was 83%. Three samples failed authenticity tests. One of the samples contained no approved Basmati varieties and 100% non-Basmati rice varieties. A further two samples contained 18% and 20% non- Basmati varieties and exceeded the 7% requirement of the Code of Practice for Basmati Rice (July 2022). A further sample was reported as inconclusive due to only denatured DNA being extracted which meant that the tests could not be completed.
Two samples failed compositional checks due to the quantity of broken grains. The Code of Practice for Basmati Rice (July 2022) states that when the description of the product is “Basmati rice”, the non-Basmati rice content must not exceed 7% and that the amount of broken grains must be less than 10%.
6.2.8 Butter/Margarine Spread
Milk fat content was tested in 46 dairy based butter or margarine spreads and all of the analytical results were satisfactory, however six samples were deemed unsatisfactory for labelling giving an 87% compliance rate for this commodity type. Labelling non-conformities related to the name of the food or sales description not meeting the prescribed standard, allergens not being emphasised, and labelling not being in English and therefore not in a language easily understood by the consumers of the country where the food is marketed.
6.2.9 Cheese
A variety of 35 packaged cheeses were tested for authenticity of the milk product used, fat content and labelling, and the compliance rate was 91%. There were three non-compliant products, one for authenticity, one for composition and one for labelling.
In a "Bulgarian Sheep's milk cheese” both cow and sheep DNA were detected which is indicative of the presence of sheep and cow milk. The sample included "biological rennet" in the ingredients list however it has been assumed that this has not been derived from animal sources due to the statement "suitable for Vegetarians".
A sample described as ‘Mozzarella’ contained 42% less fat than the declared value and visually appeared drier in texture than a typical mozzarella.
A feta cheese label was not in English and when translated did not highlight milk as an allergen.
6.2.10 Vegan Products
A total of 40 vegan products, labelled as vegan and without any PAL (e.g. ‘may contain’) for milk, egg and peanut were tested for the presence of these allergens. There was a 92% compliance rate, with allergens detected in three samples of vegan ice-cream.
6.2.11 Plain Yogurts
Low fat plain yogurts were tested for fat content, milk protein, benzoic acid and sorbic acid and the compliance rate was 93%. Of the 46 samples tested two were noncompliant for composition and one for labelling.
The Nutrition and Health Claims (England) Regulations 2007 require that a claim that a food is fat-free may only be made where the product contains no more than 0.5 g of fat per 100 g or 100 ml. The amount of fat detected in one of the samples was 0.8 g/100g which was higher than the maximum permitted.
Under the 'dairy products' food category in Retained Regulation (EC) No 1333/2008, executed and enforced by the Food Additives, Flavourings, Enzymes and Extraction Solvents (England) Regulations 2013, the addition/use of sorbic acid in dehydrated milk (e.g. dried skimmed-milk powder) or cream is not permitted. However, sorbic acid is permitted up to a maximum level of 1000 mg/kg in unflavoured fermented milk products, heat treated after fermentation namely 'only curdled milk'. A natural Greek style plain low fat yogurt had 62 mg/kg sorbic acid. There was no indication of heat treatment on the label so no sorbic acid should have been detected.
The yogurt sample which was reported as unsatisfactory for labelling did not have the nutrition information or the durability date indication in the prescribed format.
6.2.12 Coffee
Ground and instant coffees that declared the bean type Robusta or Arabica were checked for authenticity and 96% of the 46 samples analysed were satisfactory.
The two unsatisfactory samples were both ground coffees which were described as Robusta when purchased online from small food business. The NMR profiles indicated that the samples were a mixture of Arabica and Robusta beans.
6.2.13 Free From Products
A total of 66 ‘Free From’ products were tested for the presence of the relevant allergen – nuts, milk or gluten. For each ‘free from’ claim 22 samples were analysed and there was an overall 97% compliance rate with only one sample having a gluten allergen detected and one labelling issue identified.
Retained Commission Implementing Regulation (EU) No 828/2014, executed and enforced by the Food Information Regulations 2014 permits a 'gluten-free' statement where the food as sold to the final consumer contains no more than 20 mg/kg of gluten. Analysis of a sample of gluten free sausages, purchased from a small food business, found a gluten level >80 mg/kg which is in excess of the 20 mg/kg permitted for a gluten free claim to be made.
A chocolate chip cookie sample was deemed non-compliant as the list of ingredients contained allergens. However, these were not emphasised as required by The Food information Regulations 2014 implementing Regulation (EU) No. 1169/2011.
6.2.14 Orange Juice
Orange juice samples were tested for the presence of unauthorised colours, composition – Brix, Sulphur Dioxide and labelling. The compliance rate was 97% and 36 orange juice samples were tested.
The Fruit Juices and Fruit Nectars (England) Regulations 2013 require that orange juice made from concentrate must have a Brix level of 11.2 or more determined as soluble solids by refractometer at 20°C. The Brix level of one of the samples was less than required by the Regulations.
6.2.15 Turmeric
Samples of turmeric were tested for heavy metals including nickel and chromium, aflatoxins, ochratoxin A and unauthorised colours. Only one of the 30 samples tested was reported as noncompliant giving a compliance rate of 97%.
Under assimilated Commission Regulation (EC) No 1881/2006, implemented by The Contaminants in Food (England) Regulations 2013, turmeric samples are permitted to contain a maximum of 5 µg/kg of aflatoxin B1 with a maximum of 10 µg/kg of total aflatoxin and a maximum of 15 µg/kg of ochratoxin A. The noncompliant sample level of aflatoxin B1 was 19.7 µg/kg (± 1.7 µg/kg) and the total aflatoxin was 38.1 µg/kg (± 2.9 µg/kg) which exceeded the maximum permitted levels, taking into account the correction for recovery and measurement uncertainties.
6.3 Surveillance Commodities
A total of 623 products from 13 commodity types were sampled for surveillance purposes with nine of the commodity types tested for compliance to appropriate legislation. The compliance rates for these nine commodities ranged from 43% to 96%.
6.3.1 Prepacked Products for Direct Sale
In total 47 prepacked products for direct sale were tested for two undeclared allergens as appropriate from the following list – peanut, walnut, hazelnut, cashew, milk, gluten, fish. Samplers did not purchase products where there was precautionary allergen advice e.g. notices in the shop or from the sales assistant and the allergens to be tested were determined by the Public Analyst according to the product type and labelling information.
The Food Information Regulations 2014 prescribe that foods prepacked for direct sale must be marked with a list of ingredients and a name of the food. Furthermore, any allergenic ingredient or processing agent listed in Annex II of Regulation (EU) No1169/2011 must be identified and emphasised in the list of ingredients.
The compliance rate for PPDS samples was 43% with 17 of the 47 samples having allergens present without the required labelling, rendering the samples unsafe within the meaning of The Food Safety and Hygiene (England) Regulations 2013 for reasons of being potentially injurious to health for those individuals who suffer an allergy to these allergens. Undeclared allergens found were – gluten, milk, egg, sesame, almond, soya and peanut. In eight of the samples two different undeclared allergens were present.
Undeclared gluten was detected in 10 samples including several types of bread, croissant, quiche, pizza, sausages, lasagne and a chicken and ham pie. Gluten was the most commonly found allergen.
Milk was present in seven of the foods including a cake selection, quiche, pizza, chicken tikka sandwich, ham sandwich, lasagne and a vegan pie.
Undeclared egg was found in two instances, a cake selection and tuna mayo pasta.
The allergen tests assigned to two sausage samples included sulphur dioxide as this is a common additive used in this product and both were found to be positive.
Sesame, almond, soya and peanut were each detected in one sample.
Many of these samples did not have labels but in addition to the 17 samples with undeclared allergens there were 10 samples reported as unsatisfactory due to labelling issues. These reasons for labelling failures included allergens, use by dates and ingredients lists not in the prescribed format, the name of the food not sufficiently precise to inform the customer as to its true nature, lack of appropriate storage instructions, spelling errors, shortening of ingredient names and poor legibility.
One sample used a generic PAL statement ‘made in an environment where other allergens may be present’. The given PAL did not detail specific allergens and could be considered to be misleading food information and unnecessarily limit consumer choice.
A gingerbread sample and an apple and blackberry crumble listed Southampton colours (artificial food colours that could cause increased hyperactivity in some children) in their ingredients lists and the label should have displayed the appropriate warning ‘may have an adverse effect on activity and attention in children’.
6.3.2 Packaged Sandwich Meat
A variety of packaged cooked sandwich meats were tested for meat speciation, meat content and added water. The 56 samples included 29 ham, 13 chicken, 7 beef, 6 turkey and 1 haslet. The compliance rate was 68% and 18 samples were reported as unsatisfactory.
One packaged sliced turkey sample was noncompliant with regards to authenticity. The sample contained chicken DNA which was not declared on the label. It was estimated that 5% of the DNA present was of chicken origin.
Of the samples analysed, 10 were noncompliant due to composition. The apparent meat content was below the declared value for nine ham samples, one turkey and one chicken. The deficiency ranged from 4% to 28.8%. Conversely, a beef sample declared a protein content of 2.4g per 100g and the sample was found to have a total protein content of 19.8g per 100g which represented an excess in protein to the extent of 725% of the declared value.
Labelling irregularities were identified in five samples, two turkey, one beef, one ham and one haslet. The issues highlighted included no QUID declaration, no list of ingredients, nutritional information not in the prescribed format, incorrect highlighting of allergens.
6.3.3 African Spices
African spice mixes and pastes such as harissa and ras el hanout were tested for the presence of undeclared peanut. Samplers avoided products that had peanut in the list of ingredients or a PAL for peanut. A range of 56 samples were analysed using ELISA and 73% were reported as compliant. In 15 samples the ELISA test indicated the presence of peanut protein and 10 were above the limit of quantification levels of the ELISA kits used. This meant that the exact amount of peanut protein present in these samples was not determined.
6.3.4 Tinned Meat
A total of 60 tinned meat or long-life meat products were analysed for meat species authenticity and meat content. The compliance rate was 73%.
One sample of tinned pork, not produced in the UK, was noncompliant as it contained an estimated 1-5% beef in addition to pork which was not declared on the label.
A total of six samples were non-compliant due to composition, five of these samples were not produced in the UK. Samples of luncheon meat, corned mutton and beef luncheon meat were labelled as containing mechanically recovered meat, heart or lung and did not comply with the following regulations:
- The Product Containing Meat etc (England) Regulations 2014 define meat as "the skeletal muscles of mammalian and bird species recognised as fit for human consumption with naturally included or adherent tissue but does not include mechanically separated meat.”
- The Food Safety and Hygiene (England) Regulations 2013 implement Retained legislation EU No 853/2004 and do not permit food business operators to use the cartilage of the larynx, the trachea and the extra-lobular bronchi in the preparation of meat products.
Samples were also unsatisfactory for composition as they failed to meet minimum meat content requirements. For example, a corned mutton sample failed to satisfy the minimum meat content requirement for mutton and contained more fat than the maximum permitted, and the beef luncheon meat did not meet the minimum meat content requirement of 62% prescribed for a product bearing the reserved description " beef luncheon meat” in The Products Containing Meat etc. (England) Regulations 2014. A 10% lower meat content than declared was reported in both a tinned ham and a tinned pork knuckle and a corned beef sample had greater than 25% excess fat than the declared value.
There were eight tinned meat samples reported as unsatisfactory for labelling due to allergens not being highlighted on the ingredients list and the name not clearly describing the nature of the product. A requirement of the Retained Regulation (EU) No 1169/2011 is that mandatory food information must appear in a language easily understood by the consumers of the country where it is marketed and four of these samples had labels not written in English.
6.3.5 Ground Nutmeg
Ground nutmeg samples were examined by microscopy for authenticity and analysed for the presence of aflatoxins and ochratoxin A by HPLC. The compliance rate for the 29 samples was 79%. All of the samples were satisfactory for authenticity but six samples had levels of contaminants which exceeded their maximum permitted levels, taking into account the correction for recovery and measurement uncertainties.
Under Commission Regulation (EC) No 1881/2006, implemented by The Contaminants in Food (England) Regulations 2013, nutmeg is permitted to contain a maximum of 5 µg/kg aflatoxin B1, 10 µg/kg total aflatoxin and 15 µg ochratoxin A.
There were four samples reported with high levels of B1 ranging from 8.3 µg/kg to 45.5 µg/kg and three of these were also reported as having high total aflatoxin levels ranging from 11.8 µg/kg to 60.1 µg/kg. In addition, two of these samples also breached the limits for ochratoxin A. In total four samples were reported as unsatisfactory for ochratoxin A and results ranged from 20.1 µg/kg to 152 µg/kg.
6.3.6 Chicken Ready Meals
A total of 69 fresh, frozen and tinned chicken ready meals containing pieces of chicken were checked for QUID by physical separation and weighing, and for meat species by DNA. All the samples were satisfactory with regards to meat speciation. However, eight samples were noncompliant due to composition issues and four samples were noncompliant due to labelling. The overall compliance rate for chicken meals was 83%.
The declared QUID was higher than the results obtained in the lab for six chicken curries and two chicken pastas. There is no legal lower tolerance set for QUID declarations however a lower tolerance of 10% is widely accepted as reasonable and is used by the Public Analysts.
One of the samples, a chicken teriyaki, included salmon in the ingredients list instead of chicken and the ingredients list of a chicken biryani declared the presence of a non-permitted colour. Other labelling issues included allergens not highlighted in the prescribed manner, and the quantity of chicken not declared.
6.3.7 Joints of Meat
A range of 50 fresh packaged joints of meat including beef, pork, lamb, gammon, turkey, ham and venison were analysed for added water. The compliance rate was 86% with one gammon joint containing 15% added water and six samples having labelling irregularities. These included the name of the food not indicating its true nature, missing or inaccurate QUID declarations and a prepacked pork shoulder joint that did not have a label.
6.3.8 Plant Based Meat
A range of 46 plant based meat substitutes such as burgers, sausages and meat pieces were tested to check the declared protein content and there was an 87% compliance rate.
Three samples were unsatisfactory due to composition as the protein content differed to that declared. One sample of vegetarian burgers was found to be 36% higher than the declared value which was outside the guidance tolerance of +20% (Guidance Document for Competent Authorities with regard to the setting of tolerances for nutrient values declared on a label, 2012). While two samples had a lower protein content than declared. These were plant based sausages with protein 4.5 g/100g lower than the declared value which was outside the guidance tolerance of 0.8 g/100g as a nutrition claim relating to protein was given on the food label and beef style steaks had a protein concentration 1.8 g/100g lower than the declared value. The nutrition information relating to protein content of these products was therefore not sufficiently accurate (Regulation (EU) No 1169/2011, article seven as enforced by the Food Information Regulations 2014).
There were three samples with labelling anomalies. A sample of shredded chicken and a sample of pork slices did not have the nutrition declaration in the prescribed format. In addition, a sample of nuggets had a nutrition claim "high in protein" and the nutrition information on the food label stated “protein 11.6g per 100g” which only provided 19% of the declared energy and it would need to provide at least 20% to justify the nutrition claim (Regulation (EC) No 1924/2006, Annex as enforced by the Nutrition and Health Claims (England) Regulations 2007).
6.3.9 Pesto
Pesto products without PAL were tested for the presence of undeclared peanut allergens and any that had tree nuts declared in the ingredient list were checked for authenticity of the nut species. Many of the pesto products on the market had PAL for peanut and as a result only 23 samples were purchased and there was a compliance rate of 96%.
The one non-compliant sample was a sun-dried tomato pesto which had plant material other than that declared on the label particularly with regards to wheat.
6.3.10 Samples for science and research purposes
Four commodities were sampled for science and research purposes in order to provide the FSA with information for risk assessments and policy decisions.
Edible insect samples were purchased from on-line suppliers and all 40 were satisfactory for the heavy metals tested.
A total of 45 marine algae and seaweed food / feed products purchased from on-line retailers were tested for heavy metals and iodine. High levels of inorganic arsenic were noted (30.7 mg/kg and 44.6 mg/kg) in two sea kelp samples. Iodine concentrations ranging from 10.7 mg/kg to 5820 mg/kg were noted in 25 of the samples.
A variety of cooking oils were screened for the presence of other oils and of the 56 samples tested five were highlighted by the Public Analyst as potentially needing further investigation.
Acrylamide was tested in a range of non-potato baked or fried crisps such as vegetable, hummus and lentil crisps. Of the 46 samples tested 5 were noted as having higher levels of acrylamide and these ranged from 886 µg/kg to 1960 µg/kg.
7. Conclusion
The fundamental mission of the FSA is food you can trust. Consumers need to have confidence that their food is safe and what it says it is.
This project undertook national surveillance sampling and determined the extent of compliance of a number of food commodities throughout England, Wales and Northern Ireland. Everyday foods that households buy regularly and largely had known potential risks were targeted in the basket of food. Of these 86% were found to be compliant with regards to the tests carried out. The surveillance group of samples included commodities for which surveillance is useful to inform the FSA’s knowledge of risk based on intelligence and information on the global food market. The overall compliance rate for all samples analysed in this project is 81%
7.1 Allergens
In the UK, an estimated two million people are living with a diagnosed food allergy, and 600,000 with Coeliac Disease and rely on products being correctly labelled so they can effectively manage risk by making safe and informed choices.
Undeclared allergens were found in 16% of the samples tested for allergens making one in six samples potentially injurious to health for those individuals with food hypersensitivity. Prepacked products for direct sale often had limited or no labelling and over a third of these samples had an undeclared allergen present and one in five bread samples also tested positive in this respect.
The ELISA kits used to screen for the presence of peanuts in food identified 27% of the African spices as potentially containing peanut protein. Further investigation of this complex food type would provide insight as to whether this is due to the nature of the product or the presence of the allergen.
7.2 Authenticity
Food authenticity is when food matches its description. Consumers need to be able to have trust in the food they buy and be confident that they can make informed choices based on diet, personal taste or cost. A total of 437 samples were tested for authenticity and only 3% were reported as not authentic.
Basmati rice sells at a higher price than other rice varieties and 3 out of 36 basmati rice samples were reported as either having been adulterated with non-basmati rice varieties or having no approved Basmati varieties at all.
In four instances oregano was found to have other types of leaves present and these were mainly olive leaves.
The other non-authentic products included a tinned meat, a packaged cooked meat and a sausage sample each with traces of a different species of meat detected, a sheep cheese that contained both cow and sheep DNA and 2 Robusta coffee samples that also contained Arabica coffee.
7.3 Contaminants
Chemical contaminants are substances such as mycotoxins, heavy metals and acrylamide that have not been intentionally added to food but may be present through environmental contamination or as a result of one of the stages of production. Levels of contaminants that may cause a risk to health need to be managed and the dietary exposure of consumers reduced.
Mycotoxins are naturally occurring toxic compounds that are produced by different types of fungi and can enter the food chain because of infection of crops such as spices. Out of the 89 nutmeg, turmeric and oregano samples tested for mycotoxins 9% were found to have levels above the regulatory limits and these were mainly ground nutmeg.
Heavy metals occur both naturally and because of human activity. Foods such as spices, insects and marine algae absorb heavy metals from the environment. This survey tested 59 herbs / spices for the presence of heavy metals and all were reported as satisfactory. Edible insects and marine algae were included in this project for science and research purposes. None of the edible insects were found to have notable levels of heavy metals. Raised levels of inorganic arsenic were noted in two of the 45 marine algae samples which were also tested for iodine and 55% were flagged as having significant levels of iodine detected.
7.4 Composition
As well as being authentic it is important that food matches its description so that the consumer can make informed choices. Composition was reported as unsatisfactory in 8% of the 689 samples tested with regards to meeting compositional requirements.
The fat content of 27% of the milk samples was outside permitted limits, both above and below.
There were five types of meat samples tested for composition including meat content and fat content and 13% of these were reported as unsatisfactory with low meat content being the most common reason. Plant based meat products tested also had two products with low protein content.
Olive oils tested did not meet the appropriate compositional characteristics in four instances.
Other food types had one or two compositional failures that would mean that the sample was not of a quality that would be expected by the consumer.
7.5 Labelling
All prepacked food requires a food label that displays certain mandatory information. All food is subject to general food labelling requirements and any labelling provided must be accurate and not misleading.
Labelling irregularities were identified by the Public Analysts in 7% of the samples that were otherwise deemed as satisfactory with regards to any analysis undertaken. A significant number of these related to allergen information not being in line with the BRC Guidance on Allergen Labelling. Standardisation of allergen labels is important to enable easy and consistent relaying of allergen information to sensitive individuals.
Other unsatisfactory labelling issues mainly related to technical aspects of labelling such as legibility and format.
7.6 Retail Outlet Types
Samples purchased from large FBOs including supermarkets and wholesalers showed the highest level of compliance in this survey with 96% compliance.
More than 70% of the samples were purchased from small retail outlets and the compliance rate for these was 75% meaning one in four were reported as unsatisfactory by Public Analysts.
On-line purchases were mainly made from small FBOs and their compliance reflects this with 24% of internet purchases being reported as non-compliant.
7.7 Project Conclusion
This project continues to highlight the importance of undertaking surveillance sampling in order to provide intelligence and evidence of the safety and authenticity of food. Ongoing surveillance of staple food commodities as well as surveillance of products based on intelligence is essential to ensure areas of risk are identified and food standards and safety are maintained.
8. Acknowledgments
Hampshire Scientific Service Project Managers Anne Scarrett and Sally Cooke would first like to thank the Food Standards Agency for the opportunity to undertake this project. In particular we would like to thank Isobel Feber (Senior Sampling Officer, Scientific sampling and Laboratory Policy Team (SSLP)) for her project management and guidance throughout, David Franklin (Team Leader, SSLP) and Fiona Binks (Sampling Officer, SSLP) for their support and assistance.
We would also like to thank the following individuals and the teams at the five Official Laboratories in England and Wales for their participation and support particularly in relation to their technical contributions, and all their efforts in sampling, analysis, and reporting:
Rachael New (Public Analyst), Heather Thomas (Team Leader - Physical Chemical Testing), Emily Kepner (Analyst-Programmer), Simon Merton (Analyst-Programmer), Hampshire Scientific Service.
Jonathon Griffin (Public Analyst), Sam Keller (Analytical Operations Manager), Carol Gibbons (Public Analyst), Mark Rolfe (Head of Kent Scientific Services), Karen Perry (Business Support Supervisor), Kent Scientific Services.
Bharathi Reddy (Public Analyst), Tracey Jardine (Service Manager), Amy Calderbank (Senior Scientific Officer), Lancashire County Scientific Services.
Alastair Low (Public Analyst), John Robinson (Head of Chemical Laboratories Division, Public Analyst), Susanne Brookes (Public Analyst), Minton Treharne and Davies Ltd.
Nigel Payne (Public Analyst), Emily Roberts (Laboratory Manager), Duncan Arthur (Public Analyst), Emma Downie (Public Analyst), Michelle Evans (Public Analyst), Mary Butts (Public Analyst), Donna Hanks (Public Analyst), Public Analyst Scientific Services.
10. References
- FSA and Food Standards Scotland (FSS) Annual Food Standards Report (gov.uk)
- The Food Information Regulations 2014 (legislation.gov.uk)
- Food Law Code of Practice for Food Standards
- Retail Surveillance Sampling Programme during Covid-19 pandemic - Executive Summary | Food Standards Agency
- Food Standards Agency Surveillance Sampling Programme 2021/22
- Multi-Annual National Control Plan for the United Kingdom (food.gov.uk)
- Official Feed and Food Control Regulations 2017/625
- Commission Notice on the application of the principle of quantitative ingredients declaration (QUID)
- The Drinking Milk (England) Regulations 2008 (legislation.gov.uk)
- Food Safety Act 1990 (legislation.gov.uk)
- The Contaminants in Food (England) Regulations 2013
- Commission Delegated Regulation (EU) 2022/2104: Publications Office (europa.eu)
- Regulation (EU) No 1169/2011 of the European Parliament and of the Council of 25 October 2011 (legislation.gov.uk)
- Code of Practice for Basmati Rice (riceassociation.org.uk) July 2022
- The Nutrition and Health Claims (England) Regulations 2007 (legislation.gov.uk)
- Regulation (EC) No 1333/2008 of the European Parliament and of the Council of 16 December 2008 on food additives (legislation.gov.uk)
- The Food Additives, Flavourings, Enzymes and Extraction Solvents (England) Regulations 2013 (legislation.gov.uk)
- Commission Implementing Regulation (EU) No 828/2014 of 30 July 2014 on the requirements for the provision of information to consumers on the absence or reduced presence of gluten in food (legislation.gov.uk)
- Regulation (EU) No 1169/2011 of the European Parliament and of the Council of 25 October 2011 on the provision of food information to consumers (legislation.gov.uk)
- The Fruit Juices and Fruit Nectars (England) Regulations 2013 (legislation.gov.uk)
- Commission Regulation (EC) No 1881/2006 of 19 December 2006 setting maximum levels for certain contaminants in foodstuffs (Text with EEA relevance) (legislation.gov.uk)
- The Food Safety and Hygiene (England) Regulations 2013 (legislation.gov.uk)
- The Products Containing Meat etc. (England) Regulations 2014 (legislation.gov.uk)
- Regulation (EC) No 853/2004 of the European Parliament and of the Council of 29 April 2004 laying down specific hygiene rules for food of animal origin (legislation.gov.uk)
- Guidance Document for Competent Authorities with regard to the setting of tolerances for nutrient values declared on a label, 2012
- labelling_nutrition-vitamins_minerals-guidance_tolerances_1212_en.pdf (europa.eu)
- Regulation (EC) No 1924/2006 (europa.eu)
- Food hypersensitivity | Food Standards Agency
- Packaging and labelling | Food Standards Agency
- British Retail Consortium Guidance on Allergen Labelling and the Requirements in Regulation 1169/2011, BRC-FDF-Allergen-Labelling.pdf (reading.ac.uk)
11. Appendix
Table 2: Basket of Food Commodities and Analysis
| Commodity | Hazard or area to be tested | Analysis to be undertaken |
|---|---|---|
| Basmati rice |
Authenticity Composition |
Basmati varieties by PCR micro satellite Proportion of broken grains by physical separation |
| Bread | Allergens | Milk by ELISA Sesame by ELISA Labelling check |
| Butter / margarine spread | Composition | Milk fat content Labelling check |
| Cheese |
Authenticity Composition |
Animal species DNA by PCR Fat, fat in dry matter, milk fat (butyric acid) |
| Ground Coffee | Authenticity | Robusta or Arabica beans by NMR profiling |
| ‘Free From’ Products | Allergens | Milk / Gluten / Peanut / Cashew / Hazelnut by ELISA Labelling check |
| Milk | Composition | Fat content Labelling check |
| Minced Meat | Composition | Water content Fat content Collagen content Labelling check |
| Olive oil | Authenticity | Extinction by solvent dissolution and UV, PV by fat extraction, solvent dissolution and titrimetry Fat profile by esterification and gas chromatography Labelling check |
| Orange Juice |
Composition Unauthorised Ingredient |
Sulphur dioxide, Brix Added colours Labelling check |
| Oregano |
Authenticity Contaminants |
Microscopy Aflatoxins / Ochratoxin A by HPLC Heavy metals (Arsenic, Cadmium, Lead and Mercury) by ICP or AAS |
| Plain yogurts advertised as being low fat | Composition | Fat content, milk protein requirements, benzoic acid, sorbic acid Labelling check |
| Sausages |
Composition Authenticity |
Meat content (Quantitative Ingredient Declaration (QUID)) Species DNA by PCR Labelling check |
| Turmeric |
Contaminants Unauthorised Ingredient |
Aflatoxins / Ochratoxin A by HPLC Heavy metals (Arsenic, Cadmium, Lead and Mercury) by ICP or AAS Nickel chromate (Nickel and chromium by ICP) Artificial colours |
| Vegan products (with a focus on desserts) | Allergens | Milk / Egg / Peanut by ELISA Labelling check |
Table 3: Surveillance Commodities and Analysis (Tested for Compliance)
| Commodity | Hazard or area to be tested | Analysis |
|---|---|---|
| African spice mixes/pastes | Allergens | Peanut by ELISA Labelling check |
| Chicken ready meals (fresh and frozen) |
Composition Authenticity |
Meat content (QUID) by physical separation and weighing Species DNA by PCR Labelling check |
| Ground nutmeg |
Authenticity Contamination |
Microscopy Aflatoxins / Ochratoxin A by HPLC |
| Joints of meat (packaged) | Composition |
Water content Labelling check |
| Packaged Cooked Sandwich Meat | Authenticity Composition |
Species DNA by PCR Added water Labelling check |
| Pesto | Allergens Composition |
Peanut by ELISA Nut species confirmation Labelling check |
| Plant-based meat | Composition |
Declared protein content Labelling check |
| Prepacked products for direct sale (specifically to monitor where undeclared allergens are present as an added ingredient) | Allergens | Undeclared peanut / walnut / hazelnut / cashew nut / milk / gluten / fish by ELISA Labelling check |
| Tinned/long-life meat products | Authenticity Composition |
Species DNA by PCR Meat content (QUID) Labelling check |
Table 4: Surveillance Commodities and Analysis (Science and Research)
| Commodity | Hazard or area to be tested | Analysis |
|---|---|---|
| Cooking Oil | Contaminants | Screen for other oils that would present safety risk e.g. paraffin oil |
| Edible Insects | Contaminants | Heavy metals (Arsenic, Cadmium, Lead and Mercury) by AAS |
| Marine algae and seaweed food products | Contaminants |
Heavy metals (Arsenic, Cadmium, Lead and Mercury) by AAS Iodine by ICP |
| Vegetable crisps/hummus crisps/lentil crisps | Contaminants | Acrylamide by GCMS |
Results Tables
Table 5: Basket of Foods Sample Numbers and Compliance
| Basket Commodity | Samples Collected | Compliant Samples | % Compliance |
|---|---|---|---|
| Basmati Rice | 36 | 30 | 83.33 |
| Bread | 35 | 22 | 62.86 |
| Butter / margarine spread | 46 | 40 | 86.96 |
| Cheese | 35 | 32 | 91.43 |
| Ground Coffee | 46 | 44 | 95.65 |
| ‘Free From’ Products | 66 | 64 | 96.97 |
| Milk | 30 | 22 | 73.33 |
| Minced Meat | 40 | 33 | 82.50 |
| Olive oil | 36 | 27 | 75.00 |
| Orange Juice | 36 | 35 | 97.22 |
| Oregano | 30 | 22 | 73.33 |
| Plain yogurts advertised as being low fat | 46 | 43 | 93.48 |
| Sausages | 40 | 28 | 70.00 |
| Turmeric | 30 | 29 | 96.67 |
| Vegan products (with a focus on desserts) | 40 | 37 | 92.5 |
| TOTAL | 592 | 508 | 85.81 |
Table 6: Surveillance Commodities Sample Numbers and Compliance (Excludes Science and Research Samples)
| Surveillance Commodity | Samples Collected | Compliant Samples | % Compliance |
|---|---|---|---|
| African spice mixes / pastes | 56 | 41 | 73.21 |
| Chicken ready meals (fresh and frozen) | 69 | 57 | 82.61 |
| Ground nutmeg | 29 | 23 | 79.31 |
| Joints of meat (packaged) | 50 | 43 | 86.00 |
| Packaged Cooked Sandwich Meat | 56 | 38 | 67.86 |
| Pesto | 23 | 22 | 95.65 |
| Plant-based meat | 46 | 40 | 86.96 |
| Prepacked products for direct sale | 47 | 20 | 42.55 |
| Tinned/long-life meat products | 60 | 44 | 73.33 |
| TOTAL | 436 | 328 | 75.23 |
Table 7: Basket of Foods Non-compliance Categories
| Noncompliance Categories | Samples Analysed | Noncompliant Samples in Category | % Noncompliant Samples |
|---|---|---|---|
| Allergen | 141 | 11 | 7.80 |
| Authenticity | 223 | 11 | 4.93 |
| Composition | 385 | 29 | 7.53 |
| Contaminant | 60 | 3 | 5.00 |
| Labelling | 592 | 28 | 4.73 |
| TOTAL | 592 | 82 | 13.85 |
Table 8 : Surveillance Commodities Non-compliance Categories (Excludes Science and Research Samples)
| Noncompliance Categories | Samples Collected | Noncompliant Samples in Category | % Noncompliant Samples |
|---|---|---|---|
| Allergen | 126 | 32 | 25.40 |
| Authenticity | 214 | 2 | 0.93 |
| Composition | 304 | 29 | 9.54 |
| Contaminant | 29 | 6 | 20.69 |
| Labelling | 407 | 39 | 9.34 |
| TOTAL | 436 | 108 | 24.77 |
Table 9: Basket of Foods Compliance by Retail Outlet Type
| Retail Outlet Type | No. of Samples | Compliant | % Compliance |
|---|---|---|---|
| Large Food Business Organisation | 181 | 174 | 96.13 |
| Small Food Business Organisation | 411 | 334 | 81.27 |
| Physical Purchase | 571 | 492 | 86.16 |
| Online Purchase | 21 | 16 | 76.19 |
| TOTAL | 592 | 508 | 85.81% |
Table 10: Surveillance Commodities Compliance by Retail Outlet Type (Excludes Science and Research Samples)
| Retail Outlet Type | Samples Collected | Compliant | % Compliance |
|---|---|---|---|
| Large Food Business Organisation | 126 | 121 | 96.03 |
| Small Food Business Organisation | 310 | 208 | 67.10 |
| Physical Purchase | 420 | 317 | 75.48 |
| Online Purchase | 16 | 12 | 75.00 |
| TOTAL | 436 | 328 | 75.24 |
Table 11: Surveillance Commodities Science and Research by Retail Outlet Type
| Retail Outlet Type | Samples Collected |
|---|---|
| Large Food Business Organisation | 35 |
| Small Food Business Organisation | 152 |
| Physical Purchase | 99 |
| Online Purchase | 88 |
| TOTAL | 187 |
Revision log
Published: 22 February 2024
Last updated: 1 March 2024