Survival of SARS-CoV-2 on the surfaces of food and food packaging materials
Survival of SARS-CoV-2 on food surfaces: Results
Survival of SARS-CoV-2 on food surfaces: Results.
6.1 Baseline Parameters – foods
We determined the baseline parameters of all food tests in this project. Results are summarised here and can be seen in full in Appendix 9.1.1. Foods tested were broccoli, pepper, apple, raspberry, brown bread crust, white bread crust, croissant, pain au chocolat, sliced ham, cheddar cheese, olive and food-relevant brine.
We have shown using uninoculated controls that vortexing with beads, swabbing and pulsification recovery methods do not interfere with the Vero E6 infection assay. recovery. The processing methods, and recommended antibiotics in the cell culture media to remove or inhibit potential microbial contaminants, had no effect on the Vero E6 cells.
We tested whether the food sample extracts affected the SARS-CoV-2 virus directly, by adding the extract to the virus, before incubating with Vero E6 cells. The results are summarised here and shown in full in Appendix 9.1.1. The data sets of samples were compared by one-way analysis of variance (ANOVA). There was no significant inactivation of SARS-CoV-2 for 10 of the 12 foods tested over the 1-hour contact period (p>0.05). However, we showed that food sample extracts recovered from olives and apples can partially inactivate SARS-CoV-2 within 60 minutes of exposure, suggesting that there are chemicals in apple and olive that are capable of inactivating SARS-CoV-2 virus. This was investigated further and will be discussed in section 6.3.2.1. When brine was added to the virus for 60 minutes and then incubated with Vero E6 cells for 60 minutes, the resulting monolayer was intact, but much thinner than with all other sample extracts.
We have determined recovery efficiency by looking at inoculated time - zero controls for each method, namely vortexing with beads, pulsification and swabbing. For 10/12 foods tested, there was at least one method that gave good recovery, marked in bold in Table 2. The method that gave good recovery was used in all subsequent testing.
For apple and olive there was poor recovery with all methods investigated, probably due to virus inactivation rather than poor recovery per-se.
Table 2 Summary of percentage recovery efficiencies of inoculated SARS-CoV-2 on foods after 1 hour contact using the different extraction methods.
| Food | Pulsification | Bead/Vortex | Swab |
|---|---|---|---|
| Infection Medium only | 90 | 95 | Not tested |
| Pepper | 93 | 20 | 20 |
| Broccoli | 10 | 2 | 35 |
| Apple | 0.92 | 3.3 | 5.7 |
| Raspberry | 0 | 1.6 | 38 |
| Croissant | 28 | 63 | 11 |
| White bread crust | 26 | 35 | 1.2 |
| Brown bread crust | 27 | 36 | 1.9 |
| Pain au chocolat | 19 | 35 | 4.6 |
| Sliced ham | 34 | 39 | 8.6 |
| Cheddar Cheese | 28 | 59 | 6.8 |
| Olive | 0 | 2.2 | 1.2 |
| Brine | Not tested | 20 | Not tested |
6.2 Baseline parameters – food packaging
We determined the baseline parameters of all food packaging tests in this project. The food packaging tested were: PET1 bottles; PET1 trays, aluminium cans and composite drinks cartons. Full results can be seen in 9.2.1 and are summarised here.
Vortexing with beads for virus recovery, was used for all food packaging at all time points. Samples were vortexed for 60 seconds in 10 ml Infection Medium containing glass beads (Warnes et al., 2015).
We have shown using uninoculated controls that both bead/vortexing and pulsification recovery methods, coupled with the recommended antibiotics in the cell culture media, remove or inhibit potential microbial contaminants, or chemical inhibitors, that could interfere with the Vero E6 infection assay.
The data sets of samples were compared by one-way analysis of variance (ANOVA). There was no significant inactivation of SARS-CoV-2 for any of the food packaging tested over the 1 hr contact period (p>0.05).
We determined recovery efficiency by looking at inoculated zero - time controls for the bead/vortexing method, in the presence or absence of mucin. For all food packaging tested, there was good virus recovery, as shown in Table 3 and Figure 2. There were no significant differences in the presence or absence of mucin (p>0.05).
Figure 2 Comparison of PFU data for SARS-CoV-2 recovery on food packaging in the presence or absence of mucin after 1 hours’ incubation with virus.

Table 3 Summary of percentage recovery efficiencies of inoculated SARS-CoV-2 (in presence or absence of mucin) on food packaging after 1 hour contact using the vortexing with beads method.
| Food Packaging | Beads/Vortex |
|---|---|
| PET1 bottle | 68 |
| PET1 bottle with added mucin | 65 |
| PET1 tray | 45 |
| Aluminium can | 60 |
| Aluminium can with added mucin | 54 |
| Composite drinks carton | 72 |
| Composite drinks carton with added mucin | 58 |
6.3 Time course of SARS-CoV-2 survival on food surfaces
6.3.1 Fresh vegetables
6.3.1.1 Broccoli
The results (triplicate tests) for broccoli incubated for up to 7 days with SARS-CoV-2 are shown in Figure 3 (in full in 9.1.2.1). The following code is used throughout: B (Broccoli). The results showed that broccoli remained intact after processing by swabbing and this was the best method for virus recovery. Artificially contaminated samples were incubated at ambient and chilled temperatures, as broccoli is displayed and stored in retail environments at room temperature (23°C) and in chill (6°C) conditions. However, it became difficult to incubate the tests for longer than 3 days at ambient temperature due the pronounced deterioration of the broccoli. Consequently, after completing 2 tests, further tests in ambient conditions were discontinued. It is unlikely that consumers would buy broccoli in such an advanced state of decomposition. The remaining 4 tests concentrated on chill temperature.
There was little difference in inactivation of virus in broccoli at any humidity tested. Furthermore, there was little difference of chill versus ambient temperature on virus inactivation. At ambient temperature and at chilled temperatures, at the contamination concentration used, SARS-CoV-2 reaches low levels, slightly above the LOD, within 1 day on broccoli. At 24 hours (day 1), there is more than 1-log10 reduction (i.e. >90% decrease) in virus levels in all test conditions. Levels of virus recovered subsequently remained low, with some fluctuations, until they were completely undetectable by day 5.
At 23°C, there was a significant difference (p<0.05) between PFU at day 0 and all subsequent time points for B1 and B2 (days 1, 2, 3, 4, 5, 6, 7). At 6°C, there was a significant difference (p<0.05) between PFU at day 0 and all subsequent time points for B3, B4, B5 and B6. There were no other statistical differences between any samples, at any RH, temperature or time point.
Figure 3 All PFU data for virus inactivation on broccoli shown as individual graphs.
The blue line () marks the limit of detection of 25 PFU/sample
6.3.1.2 Pepper
The results (triplicate tests) for pepper incubated for up to 7 days with SARS-CoV-2 are shown in Figure 4 (and in 9.1.2.2). The following code is used throughout: P (Pepper).
The results showed that pepper remained intact after processing by pulsification and this was the best method for virus recovery from pepper. Artificially contaminated samples were incubated at ambient (23°C) and chilled (6°C) temperatures, as peppers are displayed and stored in retail environments at room temperature and in chill conditions. However, it became difficult to incubate the tests for longer than 3 days at ambient temperature due to the pronounced deterioration of the peppers, caused by fungal growth. Consequently, after completing 2 tests, further tests in ambient conditions were discontinued. It is unlikely that consumers would buy peppers in such an advanced state of decomposition. The remaining 4 tests concentrated on chill temperature.
The results show that in chilled conditions, SARS-CoV-2 inactivates slowly, to undetectable levels at the LOD by 5 days on pepper. For pepper, this happens faster at low relative humidity of 20% (P6) compared to higher humidity. In ambient conditions, the inactivation happens at a faster rate, with levels reaching near the limit of detection by day 1 (P1).
At 23°C, there was a significant difference (p<0.05) between PFU at day 0 and all subsequent time points for P1 and P2 (days 1, 2, 3, 4, 5, 6, 7). At 6°C, there was a significant difference (p<0.05) between PFU at day 0 and all subsequent time points for P3, P4, P5 and P6 (days 1, 2, 3, 4, 5, 6, 7). There were no other statistical differences between the samples at any RH, temperature, or time point.
Figure 4 All PFU data for virus inactivation on pepper shown as individual graphs.
The blue line () marks the limit of detection of 25 PFU/sample
6.3.2 Fresh fruit
6.3.2.1 Apple
The results (triplicate tests) for apple incubated for up to 7 days with SARS-CoV-2 are shown in Figure 5 (and in 9.1.3.1). The following code is used throughout: A (apple).
The results showed that apple remained intact after processing by swabbing and this was the best method for virus recovery from apple. Apples cut into 3 cm x 3 cm pieces remained intact after processing by swabbing. Artificially contaminated samples were incubated at ambient (23°C) and chilled (6°C) temperatures, as apples are displayed and stored in retail environments at room temperature and in chill conditions.
Apple skin was shown to partially inactivate SARS-CoV-2 very quickly, with a low recovery efficiency of 4.6% from apple skin after 60 minutes incubation with SARS-CoV-2. After this rapid early inactivation, it took between 1 and 3 days for complete inactivation of SARS-CoV-2 on apple skin. This happened faster, at the higher temperature of 23˚C compared to the lower chill temperature of 6°C. The different humidity tested did not affect virus survival. In all tests on apple, we found virus was undetectable or levels were near the limit of detection by day 3 post-artificial contamination. We cannot determine if the decline in infectivity observed on apple skin is due to viral decay on the apple’s surface or a chemical from the apple skin inhibiting viral infectivity in Vero E6 cell culture. Further work, outside the scope of this study is needed to investigate this further.
At 23°C, there was a significant difference (p<0.05) between PFU at day 0 and all subsequent time points for A1, A2, and A3 (days 1, 2, 3, 4, 5, 6, 7). At 6°C, there was a significant difference (p<0.05) for A5 and A6 (days 1, 2, 3, 4, 5, 6, 7). There were no other statistical differences between the samples at any RH, temperature, or time point.
Figure 5 All PFU data for virus inactivation on apple shown as individual graphs.
The blue line () marks the limit of detection of 25 PFU/sample
6.3.2.2 Raspberry
The results (triplicate tests) for raspberry incubated for up to 7 days with SARS-CoV-2 are shown in in Figure 6 (and in 9.1.3.2). The following code is used throughout: R (Raspberry).
Results showed that swabbing was the best method for virus recovery from raspberry. Single whole raspberries remained intact after processing by swabbing. It should be noted that the intricate structure, with its irregular surface, may make recovery from raspberry variable, as the virus may get stuck in the small crevices, not being accessible to the swab. Artificially contaminated samples were incubated at ambient (23°C) and chilled (6°C) temperatures, as raspberries are displayed and stored in retail environments at room temperature and in chill conditions. Tests were extended for up to 7 days even though it became clear that fruit decay occurred much earlier. Raspberries, and other soft fruits, are often consumed within a few days of collection and would not be bought by the consumer if they were showing signs of spoilage.
It is clear from the results that it can take between 1 and 5 days to reach the LOD for SARS-CoV-2 on raspberry surfaces. For raspberry, only one ambient temperature was tested as the fruit very quickly showed signs of spoilage. We cannot, therefore, make a temperature comparison. It is clear, though, that at 6˚C the virus is sometimes did not reach the limit of detection until later in the time course, with SARS-CoV-2 being detected as late as 5 days at the lowest humidity tested (R6, 6°C, 20% RH).
At 23°C, there was a significant difference (p<0.05) between PFU at day 0 and all subsequent time points for R1 (days 1, 2, 3, 4, 5, 6, 7). At 6°C, there was a significant difference (p<0.05) between PFU at day 0 and all subsequent time points for R2, R3, R4, R5 and R6 (days 1, 2, 3, 4, 5, 6, 7). There were no other statistical differences between the samples at any RH, temperature, or time point.
Figure 6 All PFU data for virus inactivation on raspberry shown as individual graphs.
The blue line () marks the limit of detection of 25 PFU/sample
6.3.3 Baked products and pastries
6.3.3.1 White bread crust
The results (triplicate tests) for white bread crust incubated for up to 7 days with SARS-CoV-2 are shown in Figure 7 (and in 9.1.4.1). The following code is used throughout: Wb (White bread crust).
Results showed that vortexing with beads was the best method for virus recovery from white bread crust. Artificially contaminated samples were incubated at ambient (23°C) temperature only, as baked goods are displayed and stored in retail environments at room temperature and not in chill conditions. The first two experiments were extended for up to 7 days, but it became clear that virus inactivation and food decay occurred much earlier. We therefore curtailed the time course to 5 days for subsequent tests on white bread crust.
In all conditions tested and at the contamination concentration used, by day 1 there was a 1-log10 reduction (i.e. >90% decrease) in virus levels on white bread crusts. Depending upon the particular conditions tested, the virus levels declined to undetectable levels, with a greater than 2-log10 reduction over 4 days, i.e. >99% of virus reached the limit of detection within 4 days. The slowest inactivation of virus was at the lowest humidity tested (Wb4 23°C 20% RH). Virus levels remained at low, but detectable until day 4 when levels reached the limit of detection.
At 23°C, there was a significant difference (p<0.05) between PFU at day 0 and all subsequent time points for Wb1, Wb2, Wb3 and Wb4 (days 1, 2, 3, 4, 5, 6, 7). There were no other statistical differences between the samples at any RH, temperature, or time point.
Figure 7 All PFU data for virus inactivation on white bread crust shown as individual graphs.
The blue line () marks the limit of detection of 25 PFU/sample
6.3.3.2 Brown bread crust
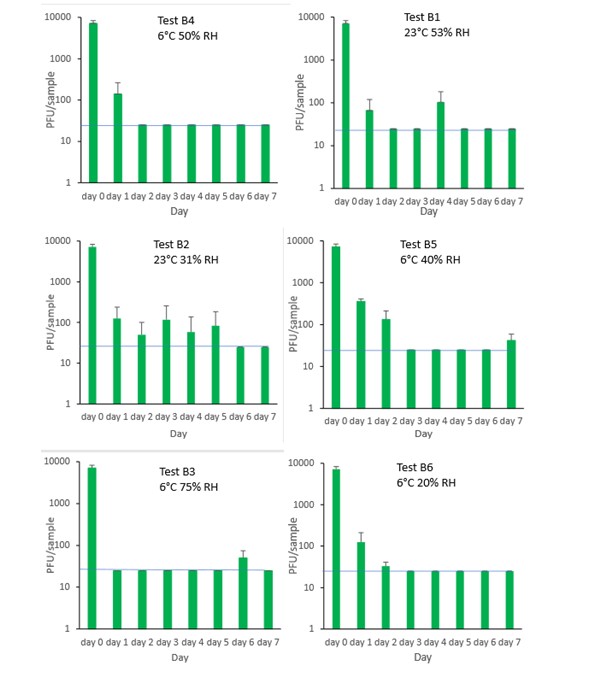
The results (triplicate tests) for brown bread crust incubated for up to 7 days with SARS-CoV-2 are shown in Figure 8 (and in 9.1.4.2). The following code is used throughout: Bb (Brown bread crust).
Results showed that vortexing with beads was the best method for virus recovery from brown bread crust. Artificially contaminated samples were incubated at ambient (23°C) temperature only, as baked goods are displayed and stored in retail environments at room temperature and not in chill conditions. The first two experiments were extended for up to 7 days, but it became clear that virus inactivation and food decay occurred much earlier. We therefore curtailed the time course to 5 days for subsequent tests on brown bread crust.
In all conditions tested and at the contamination concentration used, by day 1 there was a 1-log10 reduction (i.e. >90% decrease) in virus levels on brown bread crusts. Depending upon the particular condition tested, the virus levels declined to undetectable levels, with a greater than 2-log10 reduction over 4 days, i.e. >99% of virus reached the limit of detection within 4 days. The slowest inactivation of virus was at the lowest humidity tested (Bb4 23°C 20% RH). Virus levels remained at low, but detectable until day 4 when levels reached the limit of detection.
At 23°C, there was a significant difference (p<0.05) between PFU at day 0 and all subsequent time points for Bb2, Bb3 and Bb4 (days 1, 2, 3, 4, 5, 6, 7). There were no other statistical differences between the samples at any RH, temperature, or time point.
Figure 8 All PFU data for virus inactivation on brown bread crust shown as individual graphs.
The blue line () marks the limit of detection of 25 PFU/sample
6.3.3.3 Croissant
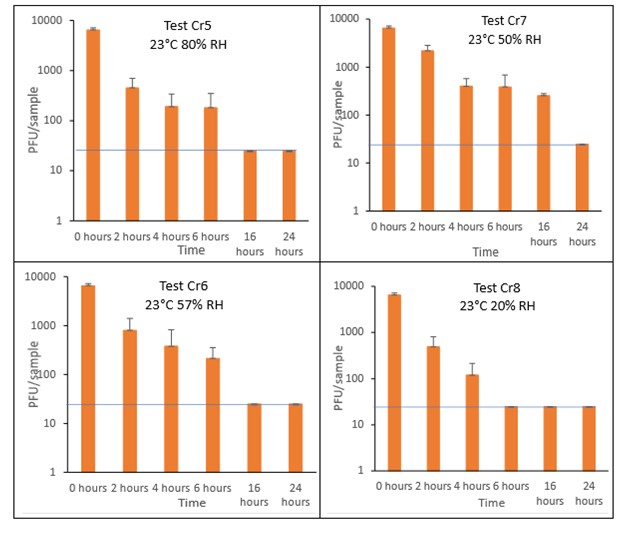
The results (triplicate tests) for croissant incubated for up to 7 days with SARS-CoV-2 are shown in Figure 9 and Figure 10 (and in 9.1.4.3). The following code is used throughout: Cr (croissant).
Results showed that vortexing with beads was the best method for virus recovery from croissant. Artificially contaminated samples were incubated at ambient (23°C) temperature only, as baked goods are displayed and stored in retail environments at room temperature and not in chill conditions. The first experiments were extended for up to 7 days, but it became clear that virus inactivation and food decay occurred much earlier. We therefore curtailed the time course to 5 days for the final test (Cr1) on croissant. At the end of the 7-day tests, it was clear that for croissant, inactivation occurred within 1 day. We therefore decided to narrow down the intervals in the first 24 hours to smaller intervals. We performed tests at 2, 4, 6 and 16 hours for croissant.
The virus inactivation happened quickly for croissants, with a greater than 2-log10 reduction (i.e. >99%) in virus levels by day 1. For shorter time intervals the results showed that levels of infectious SARS-CoV-2 decreased slowly over the first 6 hours and by 16 hours were at the limit of detection. The different humidity tested do not appear to make much difference to survival in this short time period.
At 23°C, in the 7-day time course, there was a significant difference (p<0.05) between PFU at day 0 and all subsequent time points for Cr1, Cr2, Cr3 and Cr4 (days 1, 2, 3, 4, 5, 6, 7). There were no other statistical differences between any samples, at any RH, at any time point. At 23°C, in the 24-hour time course, there was a significant difference (p<0.05) between PFU at day 0 and all subsequent time points for Cr5, Cr6, Cr7 and Cr8 (2, 4, 6, 16 and 24 hours). There were no other statistical differences between the samples at any RH, temperature, or time point.
Figure 9 All PFU data for virus inactivation for up to 7 days on croissant, shown as individual graphs.
The blue line () marks the limit of detection of 25 PFU/sample
Figure 10 All PFU data for virus inactivation for up to 24 hours on croissant, shown as individual graphs.
The blue line () marks the limit of detection of 25 PFU/sample
6.3.3.4 Pain au chocolat
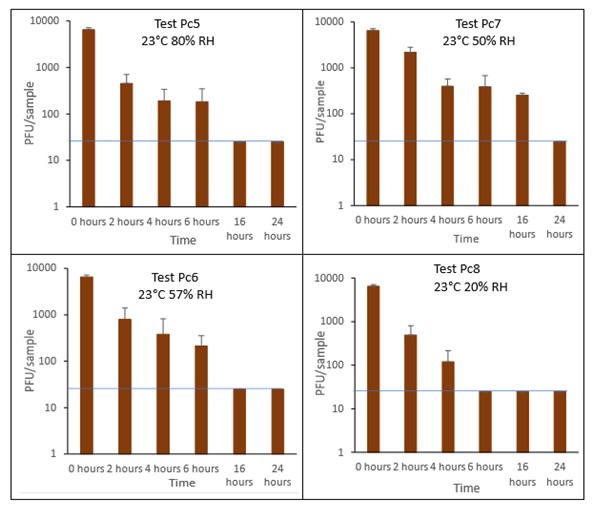
The results (triplicate tests) for pain au chocolat incubated for up to 7 days with SARS-CoV-2 are shown in Figure 11 and Figure 12 (and in 9.1.4.4). The following code is used throughout: Pc (Pain au chocolat).
Results showed that vortexing with beads was the best method for virus recovery from pain au chocolat. Artificially contaminated samples were incubated at ambient (23°C) temperature only, as baked goods are displayed and stored in retail environments at room temperature and not in chill conditions. The first two experiments were extended for up to 7 days, but it became clear that virus inactivation and food decay occurred much earlier. We therefore curtailed the time course to 5 days for subsequent tests on pain au chocolat. At the end of the 7-day tests, it was clear that for croissant, inactivation occurred within 1 day. We therefore decided to narrow down the intervals in the first 24 hours to smaller intervals: 2, 4, 6 and 16 hours for the pain au chocolat.
The virus inactivation happened quickly for pain au chocolat, with a greater than 2-log10 reduction (i.e. >99%) in virus levels by day 1. We therefore investigated shorter intervals and the results showed that levels of infectious SARS-CoV-2 decreased slowly over the first 6 hours and by 16 hours were at the limit of detection. The different humidity tested do not appear to make much difference to survival in this short time period.
At 23°C, in the 7-day time course, there was a significant difference (p<0.05) between PFU at day 0 and all subsequent time points for Pc2, Pc2, Pc3 and Pc4 (days 1, 2, 3, 4, 5, 6, 7). At 23°C, in the 24-hour time course, there was a significant difference (p<0.05) between PFU at time 0 and all subsequent time points for Pc5 and Pc8 (2, 4, 6, 16 and 24 hours). There were no other statistical differences between the samples at any RH, temperature, or time point.
Figure 11 All PFU data for virus inactivation for up to 7 days on pain au chocolat, shown as individual graphs.
The blue line () marks the limit of detection of 25 PFU/sample
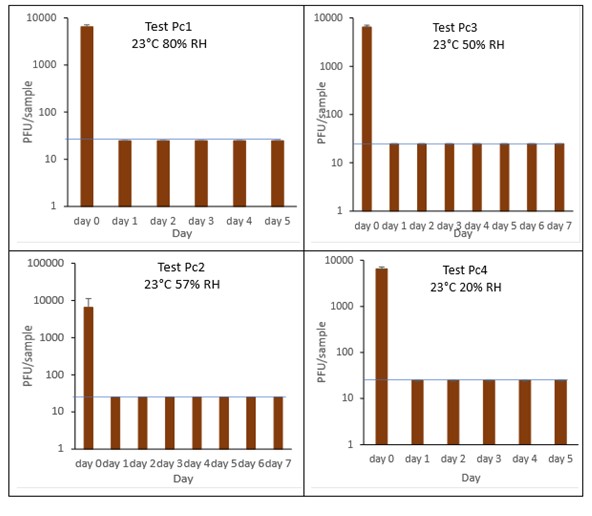
Figure 12 All PFU data for virus inactivation for up to 24 hours on pain au chocolat, shown as individual graphs.
The blue line () marks the limit of detection of 25 PFU/sample
6.3.4 Delicatessen items
6.3.4.1 Sliced ham
The results (triplicate tests) for sliced ham incubated for up to 7 days with SARS-CoV-2 are shown in Figure 13 (and in 9.1.5.1). The following code is used throughout: H (Ham).
The results showed that ham remained intact after vortexing with beads and this was the best method for virus recovery from ham. Artificially contaminated samples were incubated at chilled (6°C) temperatures, as ham is displayed and stored in retail environments in chill conditions. In all conditions tested and at the contamination concentration used, by day 1 there is about 0.5-log10 reduction (i.e. 70% decrease) in virus levels on sliced ham, depending upon the particular conditions tested. The virus levels remained relatively stable reaching a plateau over the testing period, with a maximum of about 1-log10 reduction by 7 days. There were only minor differences between all conditions tested.
At 6°C, there were no significant differences (p>0.05) between PFU at day 0 and day 1 for H1, H2, H3 and H4, under all test conditions. Similarly, under all test conditions, for H1, H2, H3 and H4, there were no significant differences (p>0.05) between PFU at day 1 and day 2; between PFU at day 2 and day 3; between PFU at day 3 and day 4; between PFU at day 4 and day 5; between PFU at day 5 and day 6 and between PFU at day 6 and day 7.
Figure 13 All PFU data for virus inactivation on ham shown as individual graphs.
The blue line () marks the limit of detection of 25 PFU/sample
6.3.4.2 Cheddar cheese
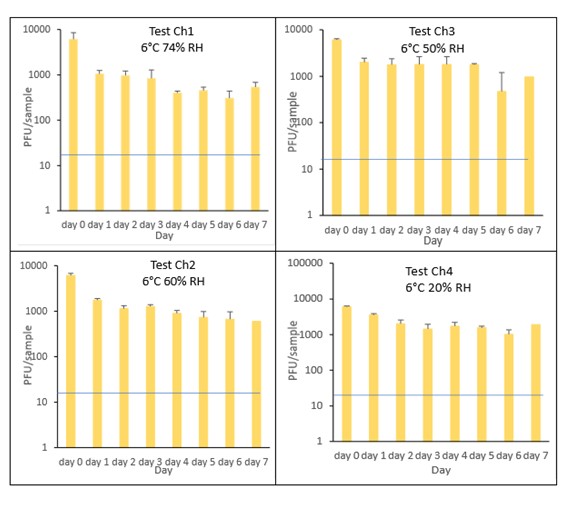
The results (triplicate tests) for cheddar cheese incubated for up to 7 days with SARS-CoV-2 are shown in Figure 14 (and in 9.1.5.2). The following code is used throughout: Ch (cheese).
The results showed that cheese remained intact after vortexing with beads and this was the best method for virus recovery. Artificially contaminated samples were incubated at chilled (6°C) temperatures, as cheese is displayed and stored in retail environments in chill conditions. In all conditions tested and at the contamination concentration used, by day 1 there was a maximum of 0.7-log10 reduction (i.e. 80% decrease) in virus levels on cheddar cheese, depending upon the particular conditions tested. The virus levels remained relatively stable reaching a plateau over the testing period, with a maximum of about 1-log10 reduction by 7 days. There were only minor differences between all conditions tested.
At 6°C, there were no significant differences (p>0.05) between PFU at day 0 and day 1 for Ch1, Ch2, Ch3 and Ch4, under all test conditions. Similarly, under all test conditions, for Ch1, Ch2, Ch3 and Ch4, there were no significant differences (p>0.05) between PFU at day 1 and day 2; between PFU at day 2 and day 3; between PFU at day 3 and day 4; between PFU at day 4 and day 5; between PFU at day 5 and day 6 and between PFU at day 6 and day 7.
Figure 14 All PFU data for virus inactivation on cheese shown as individual graphs.
The blue line () marks the limit of detection of 25 PFU/sample
6.3.4.3 Olive
The results (triplicate tests) for olive incubated for up to 2 days with SARS-CoV-2 are shown in Figure 15 (and in 9.1.5.3). The following code is used throughout: O (Olive).
The results showed that olives remained intact after processing by swabbing and this was the best method for virus recovery from olives, even though the recovery was very low (2.2%) after the 1 hour initial contact. Artificially contaminated samples were incubated at chilled (6°C) temperatures, as olives are displayed and stored in retail environments in chill conditions. From the results at the end of day 1, it was clear that for olive, inactivation occurred within a very short time period. We therefore decided to curtail the test at 1 day and narrow down the intervals in the first 60 minutes after artificially contaminating the olive with virus. We therefore did not run complete 7-day time course tests under different conditions for olive.
The results show there is more than 97% recovery (1.7-log10 reduction) of SARS-CoV-2 at 1 minute after artificial contamination and undetectable levels at the LOD at 24 hours. The data set of samples were compared by ordinary one-way analysis of variance (ANOVA). At 6°C, there was a significant difference (p<0.0001) between PFU at 0 minutes and all subsequent time points.
Figure 15 PFU data for virus inactivation on olive.
The blue line () marks the limit of detection of 25 PFU/sample

6.3.4.4 Brine
The results (triplicate tests) for brine incubated for up to 7 days with SARS-CoV-2 are shown in Figure 16 (and in 9.1.5.4). The following code is used throughout: BR (Brine).
Artificially contaminated brine samples were incubated at chill (6°C) temperature only, as deli items are displayed and stored in refrigerated conditions. For brine, being a liquid, processing was performed by vortexing. Three of the tests were extended to 7 days as standard. The final test on brine was stopped at 4 days rather than extending to 7 days, as there was no detectable virus at 4 days under all other conditions tested.
Recovery of active SARS-CoV-2 when added to brine, gradually decreased over time. As expected, the different relative humidity did not have an appreciable effect on viral infectivity. In all tests, there was less than a 1-log10 reduction after 1 day, with complete inactivation occurring by day 4 under all conditions tested. There was a significant difference (p<0.05) between PFU at day 0 and all subsequent time points (days 1, 2, 3, 4, 5, 6, 7). There were no other statistical differences between any samples, at any RH, at any time point.
Figure 16 All PFU data for virus inactivation on brine shown as individual graphs.
The blue line () marks the limit of detection of 25 PFU/sample
6.4 Time course of SARS-CoV-2 survival on food packaging materials
6.4.1 PET1 plastic bottles in the presence or absence of mucin
The results (triplicate tests) for PET1 bottles incubated for up to 7 days with SARS-CoV-2 are shown in Figure 17, Figure 18 and Figure 19 (and in 9.2.2.1 and 9.2.2.2). The following codes are used throughout: PB (PET1 bottle); and PBM (PET1 bottle with 0.1% w/v mucin added to the virus inoculum).
Vortexing with beads, was used for virus recovery from PET1 bottles. Artificially contaminated PET1 bottles were incubated at ambient (21°C) and chill (6°C) temperatures, as PET1 bottles are displayed and stored in refrigerated and ambient conditions. Under all conditions tested and at the contamination concentration used, at 21°C, the virus survives at 53% RH, with a 99% decrease not seen until day 3 on PET1 bottle. However, the virus is not as stable at 20% RH and 80% RH at 21°C, with rapid inactivation of >99% decrease in viral levels by day 1 after artificial contamination. Under chill conditions, at 6°C, the virus remains detectable over several days in all 3 relative humidity conditions tested. At day 1 there is less than 1-log10 reduction (i.e. <90% decrease) in virus levels. Depending upon conditions tested, the virus levels dropped slowly, with some fluctuations. The virus did not decline to undetectable levels, with a greater than 2-log10 reduction (i.e. >99% decrease), until at least day 5, with virus remaining detectable until day 6 in some conditions.
The effect of adding mucin was variable; in some conditions the virus reached the limit of detection more slowly with added mucin; in others it is inactivated more rapidly with mucin added. At ambient temperature there is complete inactivation of virus by day 3, both with and without mucin. When virus was added without mucin at 53% RH, there was a small reduction in infectious virus at day 1, gradually declining to undetectable levels by day 3. However, with mucin present in the viral inoculum, there was a faster decrease and complete inactivation occurred a day earlier at day 2. For virus at 20% and 80% RH in the presence of mucin, there was a significant decrease (p<0.05) in virus levels at day 1, with complete inactivation at day 2. In the absence of mucin, at these RH values, there is complete inactivation by day 1. By contrast, in chilled conditions, the time to complete inactivation is longer than at ambient temperatures. At 40% RH, complete inactivation is not seen until day 5 in the absence of mucin, whereas there is complete inactivation by day 2 if mucin is present. At 20% and 80% RH, the virus survival is very similar and is almost overlapping. In conclusion, there are some variations in virus survival if mucin is added to the SARS-CoV-2 inoculum, but the addition of mucin to the inoculum does not have any dramatic effect on virus survival on PET1 bottles.
There was a significant difference (p<0.05) between PFU at day 0 and all subsequent time points for PB1, PB3, PB4, PB5 and PB6. There was no significant difference between PB2 at day 0 and PB2 day 1. There was a significant difference (p<0.05) between PFU at day 1 and all subsequent time points for PB2. At 21°C, PB2, at day 1 had significantly higher levels (p<0.05) of virus remaining compared to both PB1 and PB3 at day 1. At all other time points the differences between PB1, PB2 and PB3 were not significant. At 6°C, there were no significant differences between PB4, PB5 and PB6 at any time point. There were no other statistical differences between the samples at any RH, temperature, or time point.
Figure 17 All PFU data for virus inactivation on PET1 bottles shown as individual graphs.
The blue line () marks the limit of detection of 25 PFU/sample
Figure 18 All PFU data for virus inactivation on PET1 bottles with mucin shown as individual graphs.
The blue line () marks the limit of detection of 25 PFU/sample
Figure 19 Comparison of PFU data for SARS-CoV-2 recovery on PET1 bottles in the presence or absence of mucin over time.
The blue line () marks the limit of detection of 25 PFU/sample
6.4.2 PET1 plastic trays
The results (triplicate tests) for PET1 trays incubated for up to 7 days with SARS-CoV-2 are shown in Figure 20 (and in 9.2.2.3). The following code is used throughout: PT (PET1 tray).
Vortexing with beads was used for virus recovery from PET1 trays. Artificially contaminated PET1 trays were incubated at ambient (21°C) and chill (6°C) temperatures, as PET1 trays are displayed and stored in refrigerated and ambient conditions. Under all conditions tested and at the contamination concentration used, at 21°C, the virus survives at 53% RH, with a 99% decrease not seen until day 5 for PET1 tray. However, the virus is not as stable at 20% RH and 80% RH at 21°C, with rapid inactivation of >99% decrease in viral levels by day 1 after artificial contamination. By contrast, under chill conditions at 6°C, the time to complete inactivation is longer. In all 3 RH conditions tested and at the contamination concentration used, the virus remains detectable over several days at 6°C. At day 1 there is less than 1-log10 reduction (i.e. <90% decrease) in virus levels. Depending upon the conditions tested, the virus levels dropped only slowly, with some fluctuations. The virus did not decline to undetectable levels, with a greater than 2-log10 reduction (i.e. >99% decrease), until at least day 5, with virus remaining detectable until day 6 in some conditions.
At 21°C, there was a significant difference (p<0.05) between PFU at day 0 and all subsequent time points for PT1 and PT3 (days 1, 2, 3, 4, 5, 6, 7). There was no significant difference between PT2, day 0 and PT2, day 1; nor between PT2, day 0 and PT2 day 2, nor between PT2, day 0 and PT2, day 3. There was no significant difference between PT4, day 0 and PT4 day 1. There was no significant difference between PT5, day 0 and PT5 day 1; nor between PT5, day 0 and PT5, day 2. There was no significant difference between PT6, day 0 and PT6 day 1; nor between PT6, day 0 and PT^, day 2. PT2 at day 1 had significantly higher levels (p<0.05) of virus remaining compared to both PT1 and PT 3 at day 1. At all other time points the differences between PT1, PT2 and PT3 were not significant (p>0.05).
At 6°C, PT4 at day 1, had significantly higher levels (p<0.05) of virus remaining compared to both PT5 and PT 6 at day 1. At all other time points the differences between PT4, PT5 and PT6 were not significant. PT4 at day 1, had significantly higher levels (p<0.05) of virus remaining compared to PT1. At all other time points the differences between PT4 and PT1 were not significant. PT6 at day 1, had significantly higher levels (p<0.05) of virus remaining compared to PT3. At all other time points the differences between PT6 and PT3 were not significant. At all-time points there was no significant differences between ambient and chilled at 53% RH and 40% RH (PT2 and PT5, respectively).
Figure 20 All PFU data for virus inactivation on PET1 trays shown as individual graphs.
The blue line () marks the limit of detection of 25 PFU/sample
6.4.3 Aluminium cans in the presence or absence of mucin
The results (triplicate tests) for aluminium cans incubated for up to 7 days with SARS-CoV-2 are shown in Figure 21, Figure 22, Figure 23 and Figure 24 (and in 9.2.2.4 and 9.2.2.5). The following codes are used throughout: AL (aluminium can); and ALM (aluminium can with 0.1% w/v mucin added to the virus inoculum).
Vortexing with beads, was used for virus recovery from aluminium cans. Artificially contaminated aluminium cans were incubated at ambient (21°C) and chill (6°C) temperatures, as aluminium cans are displayed and stored in refrigerated and ambient conditions. Under most conditions tested and at the contamination concentration used, by day 1 there is a more than 1-log10 reduction (i.e. >90% decrease) in virus levels on AL. Depending upon the condition tested, the virus levels decline rapidly to undetectable levels, with a greater than 2-log10 reduction over 4 days, i.e. >99% of virus reached the limit of detection within 4 days on AL. At 21°C >99% inactivation occurs within 1-2 days, depending on the relative humidity. There were, however, no significant differences between any of the RH tested, at days 2-7 at 21°C. At 6°C the virus survives for longer at all humidity tested, with a decrease of just 1-log10 until day 3, after which time the virus levels decrease to undetectable levels by day 4. However, there were no significant differences between any of the RH tested at days 2-7 at 6°C. There were no significant differences between any of the RH and temperatures tested, between days 2-7.
The addition of mucin to the SARS-CoV-2 inoculum was investigated for its effect on the duration of virus survival on aluminium cans (Figure 23). Under all conditions tested and at the contamination concentration used, the effect of adding mucin to the SARS-CoV-2 inoculum was variable. At 21°C, the virus survived for the same durations in the presence or absence of mucin, with virus inactivation occurring by day 1 for 53% and 20% RH and day 2 for 80% RH. There were, however, no significant differences between any of the RH tested, at days 2-7 at 21°C. Since virus levels reached the LOD quickly at 21°C and 53% RH, we also investigated whether the addition of mucin changed the rate of virus inactivation in the first 24 hours at 21°C and 53% RH. Figure 24 shows that there were no significant differences at any time point tested up to 24 hours, in the presence or absence of added mucin. At 6°C, there was longer virus survival under all RH tested, in the presence or absence of mucin. There were, however, no significant differences between any of the RH tested, at days 2-7 at 6°C. There were also no significant differences between any of the RH and temperatures tested, between days 2-7.
At all 3 RHs tested, the virus inactivation in the presence of mucin was slower than in the absence of mucin. At 20% and 50% RH, the rate of inactivation was slightly slower with mucin, but complete inactivation occurred by day 3. At 80% RH at 6°C, levels did not reach undetectable levels until day 4. There was more infectious virus remaining with mucin present, at all time-points until day 4. However, these differences were not significant (p>0.05).
At both 6°C and 21°C, there was a significant difference (p<0.05) between PFU at day 0 and all subsequent time points (days 1, 2, 3, 4, 5, 6, 7) for AL1, AL2, AL3, AL4, AL5 and AL6. There were no significant differences between any of the RH tested, at days 2-7 at 21°C. There were no significant differences between any of the RH tested at days 2-7 at 6°C. In the presence of mucin, there was a significant difference (p<0.05) between PFU at day 0 and all subsequent time points (days 1, 2, 3, 4, 5, 6, 7) for AL1M, AL2M, AL3M, AL4M, AL5M and AL6M. There were no significant differences between any of the RH tested, at days 2-7 at 21°C in the presence of mucin. There were no significant differences between any of the RH and temperatures tested, in the presence or absence of added mucin, between days 1-7. There were no significant differences between the samples in the presence or absence of mucin at early time points, 1-6 hours.
Figure 21 All PFU data for virus inactivation on aluminium cans shown as individual graphs.
The blue line marks the limit of detection of 25 PFU/sample
Figure 22 All PFU data for virus inactivation on aluminium cans with mucin shown as individual graphs.
The blue line marks the limit of detection of 25 PFU/sample
Figure 23 Comparison of PFU data for SARS-CoV-2 recovery on aluminium cans in the presence or absence of mucin over time.
The blue line marks the limit of detection of 25 PFU/sample
Figure 24 Comparison PFU data for SARS-CoV-2 inactivation on aluminium cans in the presence or absence of mucin over 24 hours at 21°C and 53% RH.
The blue line marks the limit of detection of 25 PFU/sample

Composite drinks cartons in the presence or absence of mucin
The results (triplicate tests) for composite drinks cartons incubated for up to 7 days with SARS-CoV-2 are shown in in Figure 25, Figure 26 and Figure 27 (and in 9.2.2.6 and 9.2.2.7). The following codes are used throughout: CC (composite drinks carton); and CCM (composite drinks carton with 0.1% w/v mucin added to the virus inoculum).
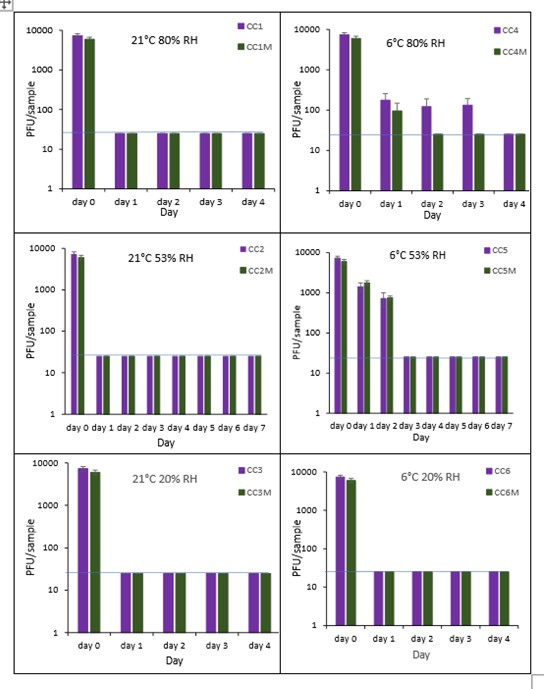
Vortexing with beads, was used for virus recovery from composite drinks cartons. Artificially contaminated composite drinks cartons were incubated at ambient (21°C) and chill (6°C) temperatures, as composite drinks cartons are displayed and stored in refrigerated and ambient conditions. Under most conditions tested and at the contamination concentration used, by day 1 there is a more than 1-log10 reduction (i.e. >90% decrease) in virus levels on composite drinks cartons. Depending upon the particular conditions tested, the virus levels decline rapidly to undetectable levels, with a greater than 2-log10 reduction over 4 days, i.e. >99% of virus is reached the limit of detection within 4 days on composite drinks cartons. At 21°C >99% inactivation occurs within 1-2 days, depending on the relative humidity. At a low temperature (6°C) the virus survives for longer at 53% and 80% RH, but not at 20% RH.
The addition of mucin to the SARS-CoV-2 inoculum was investigated for its effect on the duration of virus survival on composite drinks cartons. Under all conditions tested and at the contamination concentration used, the effect of adding mucin to the SARS-CoV-2 inoculum was variable.
At 21°C, at all RHs tested, 20%, 53% and 80% RH, the virus survived for the same durations in the presence or absence of mucin, with >99% decrease occurring by day 1 for 20%, 53% and 80% RH. Under chill conditions, at 6°C, there was longer virus survival at both 53% and 80% RH, in the presence or absence of mucin. At 6°C, 20% and 53% tested, the virus inactivation in the presence or absence of mucin occurred at a similar rate. At 80% RH, the rate of inactivation was slightly faster if mucin was present, with >99% virus inactivation occurring by day 2. However, at 80% RH at 6°C, there was not complete inactivation until day 4 without mucin.
In the presence of mucin, there was a significant difference (p<0.05) between PFU at day 0 and all subsequent time points (days 1, 2, 3, 4, 5, 6, 7) for CC1, CC2, CC3, CC4, CC5 and CC6. There were no significant differences between any of the RH tested, at days 2-7 at 21°C without added mucin. There were no significant differences between any of the RH tested at days 2-7 at 6°C with added mucin. In the presence of mucin, there was a significant difference (p<0.05) between PFU at day 0 and all subsequent time points (days 1, 2, 3, 4, 5, 6, 7) for CC1M, CC2M, CC3M, CC4M, CC5M and CC6M. There were no significant differences between any of the RH tested, at days 2-7 at 21°C with added mucin. There were no significant differences between any of the RH tested at days 2-7 at 6°C with added mucin. There were no other significant differences between any of the RH and temperatures tested, in the presence or absence of added mucin, between days 1-7.
Figure 25 All PFU data for virus inactivation on composite drinks cartons shown as individual graphs.
The blue line () marks the limit of detection of 25 PFU/sample
Figure 26 All PFU data for virus inactivation on composite drinks cartons with mucin shown as individual graphs.
The blue line () marks the limit of detection of 25 PFU/sample
Figure 27 Comparison of PFU data for SARS-CoV-2 recovery on composite drinks cartons in the presence or absence of mucin over time.
The blue line () marks the limit of detection of 25 PFU/sample