research page
The Cost of Food Crime Phase 2 - Executive Summary
The Cost of Food Crime (CoFC) model identifies and measures the economic and social cost of food crime.
As a result of the project, the following have been delivered to the Food Standards Agency (FSA):
- excel spreadsheet database containing extensive data capable of providing averages for each cost group over food types, food crime types, geographic areas, cost bearers and case type (minor/major crimes).
- initial set of multipliers to enable ‘hidden food fraud’ to be included in the calculation.
- initial estimate of the single figure ‘prevention costs’ included in the final cost of food crime.
- power BI Interface that allows final calculation and filtered calculations to be handled easily.
- Weibull curve graphics indicating the contribution to cost from each case; these are useful to indicate if a high proportion of cost is driven by particular types of cases.
Creating a novel and robust approach to data collection and analysis
The Cost of Food Crime (CoFC) model identifies and measures the economic and social cost of food crime. This includes the direct impact on victims of food fraud(footnote) and the criminal justice system, as well as the indirect impact on the economy from lost productivity, lost profits for competing firms, and non-financial impacts of pain, grief, and suffering (discussed in Section 2). The outputs from the model provide an estimate of the total annual cost to the UK of food fraud alongside average per case estimation that offers direct usefulness for policy analysis.
Overall, we found that the combination of the very high degree of awareness of food safety, quality and fraud among large UK businesses, local authorities and enforcement agencies, and the extensive use of objective diagnostic testing means that the sector has built resilience to fraud. However, small and medium sized businesses in the UK are more vulnerable, and there is a real impact on the economy from frauds that occur.
Building on the outputs from Phase 1, Cox et al. (2020), the CoFC model provides a ‘bottom up’ approach that aggregates individual cost category elements, following the framework outlined in Table 1 and illustrated in Figure 1.
Table 1 Cost of Food Crime elements
| Type of cost | Description of included costs |
|---|---|
| Victim costs | The losses suffered by crime victims, including the cost of illness and loss of property. |
| Justice System costs | The cost of investigation, legal and adjudication services, and corrections programs including incarceration. |
| Crime career costs | The opportunity costs associated with the criminal’s choice to engage in illegal rather than legal and productive activities. |
| Market costs | The loss of profits for genuine firms that arise from criminal food entering the supply chain. |
| Prevention costs | Costs of anti-food crime activities |
Whilst fraud and counterfeiting crimes have been investigated in existing research (see for example, McCollister et al., 2010 and Heeks et al., 2018), the CoFC model is the first using a bottom up approach to focus specifically on food fraud. Furthermore, in a novel development from existing crime cost estimations, this model incorporates the losses of profits for genuine firms that arise from facing criminal competition. This is further discussed in the Introduction and Methodology sections.
Three approaches were used to generate frequency and cost data for the CoFC: a review of relevant reports published in the public domain, interviews with regulatory enforcement agencies, and a victimisation survey:
- A web scraping programme identified reported cases from 1990 to 2021 in the UK by generating search terms and collecting Google search engine results. The outputs were reviewed manually for usable information within the CoFC model framework.
- A total of 24 participants were interviewed: 14 from regulatory / law enforcement agencies and 10 from the private sector. The interviews provided a rich insight into the prevalence of food fraud, the challenges in measuring the problem, and the costs of bringing offenders to justice. The data was fed into the CoFC model.
- The Food Business Organisation (FBO) Tracker survey of 700 small companies - a wide-ranging survey commissioned annually by the FSA, was co-opted to capture some victim experience data in food businesses with fewer than 50 employees. ‘Theft of food’ crimes were excluded from the analysis of survey results, finding that 3% of small businesses were victims of food fraud in the previous year.
Having determined from these sources that the observable food fraud rate is low, the attrition ratio based on the FSA’s officially recorded number of food fraud intelligence reports (610) and the number of reported prosecutions (16) in 2021 is as follows:
- Fraud reports / prosecution ratio: 610/16 = 38
Although the 610 recorded schemes provides a lower threshold estimate of the annual number of cases, An indicative upper threshold estimate was derived from the FBO Tracker survey, which found that just 1 in 5 business victims report incidents to the authorities:
- experience / reporting ratio = 5
- indicative upper threshold: 610x5 = 3,050 cases per year
This shows that the actual number of cases could be five times bigger than those that are reported.
The Headline Figures for the Cost of Food Crime to the UK
The total cost of food crime on the UK is estimated to be between £410 million and £1.96 billion per year. This is equivalent to between 0.07% and 0.33% of the UK food industry turnover each year (BEIS, 2021). The estimated value of fraudulent food and drink in the UK is between £296 million and £1.48 billion per year (discussed in Section 2.4 CoFC). The range in the estimated total cost of food crime represents the sensitivity to the volume of criminal activity, from crimes reported to estimates of total crimes (including unreported activity). Further research is required to develop the quality of data in order to narrow the range with confidence.
Notably, the prevention costs to businesses is excluded from the results presented in this report because it has not been possible to differentiate between quality control costs and crime prevention costs. Preventions costs to government are included in the total cost results but excluded from the average costs results as there is insufficient information for case-level estimation.
Once a food fraud has been committed (excludes prevention costs), each case is estimated to cost between £16 thousand and £151 thousand for small cases and between £423 thousand and £7.2 million for larger cases, depending on crime and food type (discussed in Section 2.2). In larger cases (approximately 13% of cases), the burden falls more sharply on business through the loss of property from purchasing criminalised goods. A larger share of the burden falls on government in smaller cases through justice costs.
Including prevention costs, the total burden of food crime on businesses is £268 million per year, larger than the burden to government (£84 million per year) and individuals (£58 million per year).
Key Limitations
The key limitations identified in the report are:
- The lower threshold estimate is based on the 610 food fraud intelligence reports recorded by the NFCU in 2021. It excludes unreported and undetected fraud as well as cases which are incorrectly labelled by businesses and the regulators as non-compliant when they are actually fraud.
- The upper threshold estimate addresses the dark figure based on the unreported level of victimisation of small food businesses. However, this figure may overestimate the number of fraud cases because the cases involve multiple victims.
- The cost of preventing fraud in the private sector is excluded due to the challenges in discriminating between quality/regulatory compliance costs and fraud prevention costs.
Figure 1: Cost of Food Crime model framework (text version)
(Embedded cost of illness model)
Victim costs:
- medical costs: GP, Helpline, Hospital
- individual expenses: Transport, Medication, Funeral
- lost earnings: Lost earnings due to sick absence
- absence from school: School absenteeism due to sickness
- disturbance costs: Administration cost to business for production disturbances
- illness or death: Willingness to pay to avoid illness or premature death
- loss of property: Market value of property lost due to purchase of fraudulent goods.
Justice costs:
- hours cost: Hours cost of authorities and Police working on cases.
- contractor costs: Storage and disposal of fraudulent goods.
- legal costs: Legal costs associated with prosecution.
- prison costs: Holding prisoners convicted of food crime.
- less fines paid: Less fines and costs paid by those prosecuted of food crime.
- crime career costs: Lost productivity: Due to being imprisoned rather than contributing to economy.
- market costs: Loss of profits: Genuine firms’ losses competing against fraudulent firms
- prevention costs: Anti-fraud activities: Cost to organisations attempting to prevent food crime

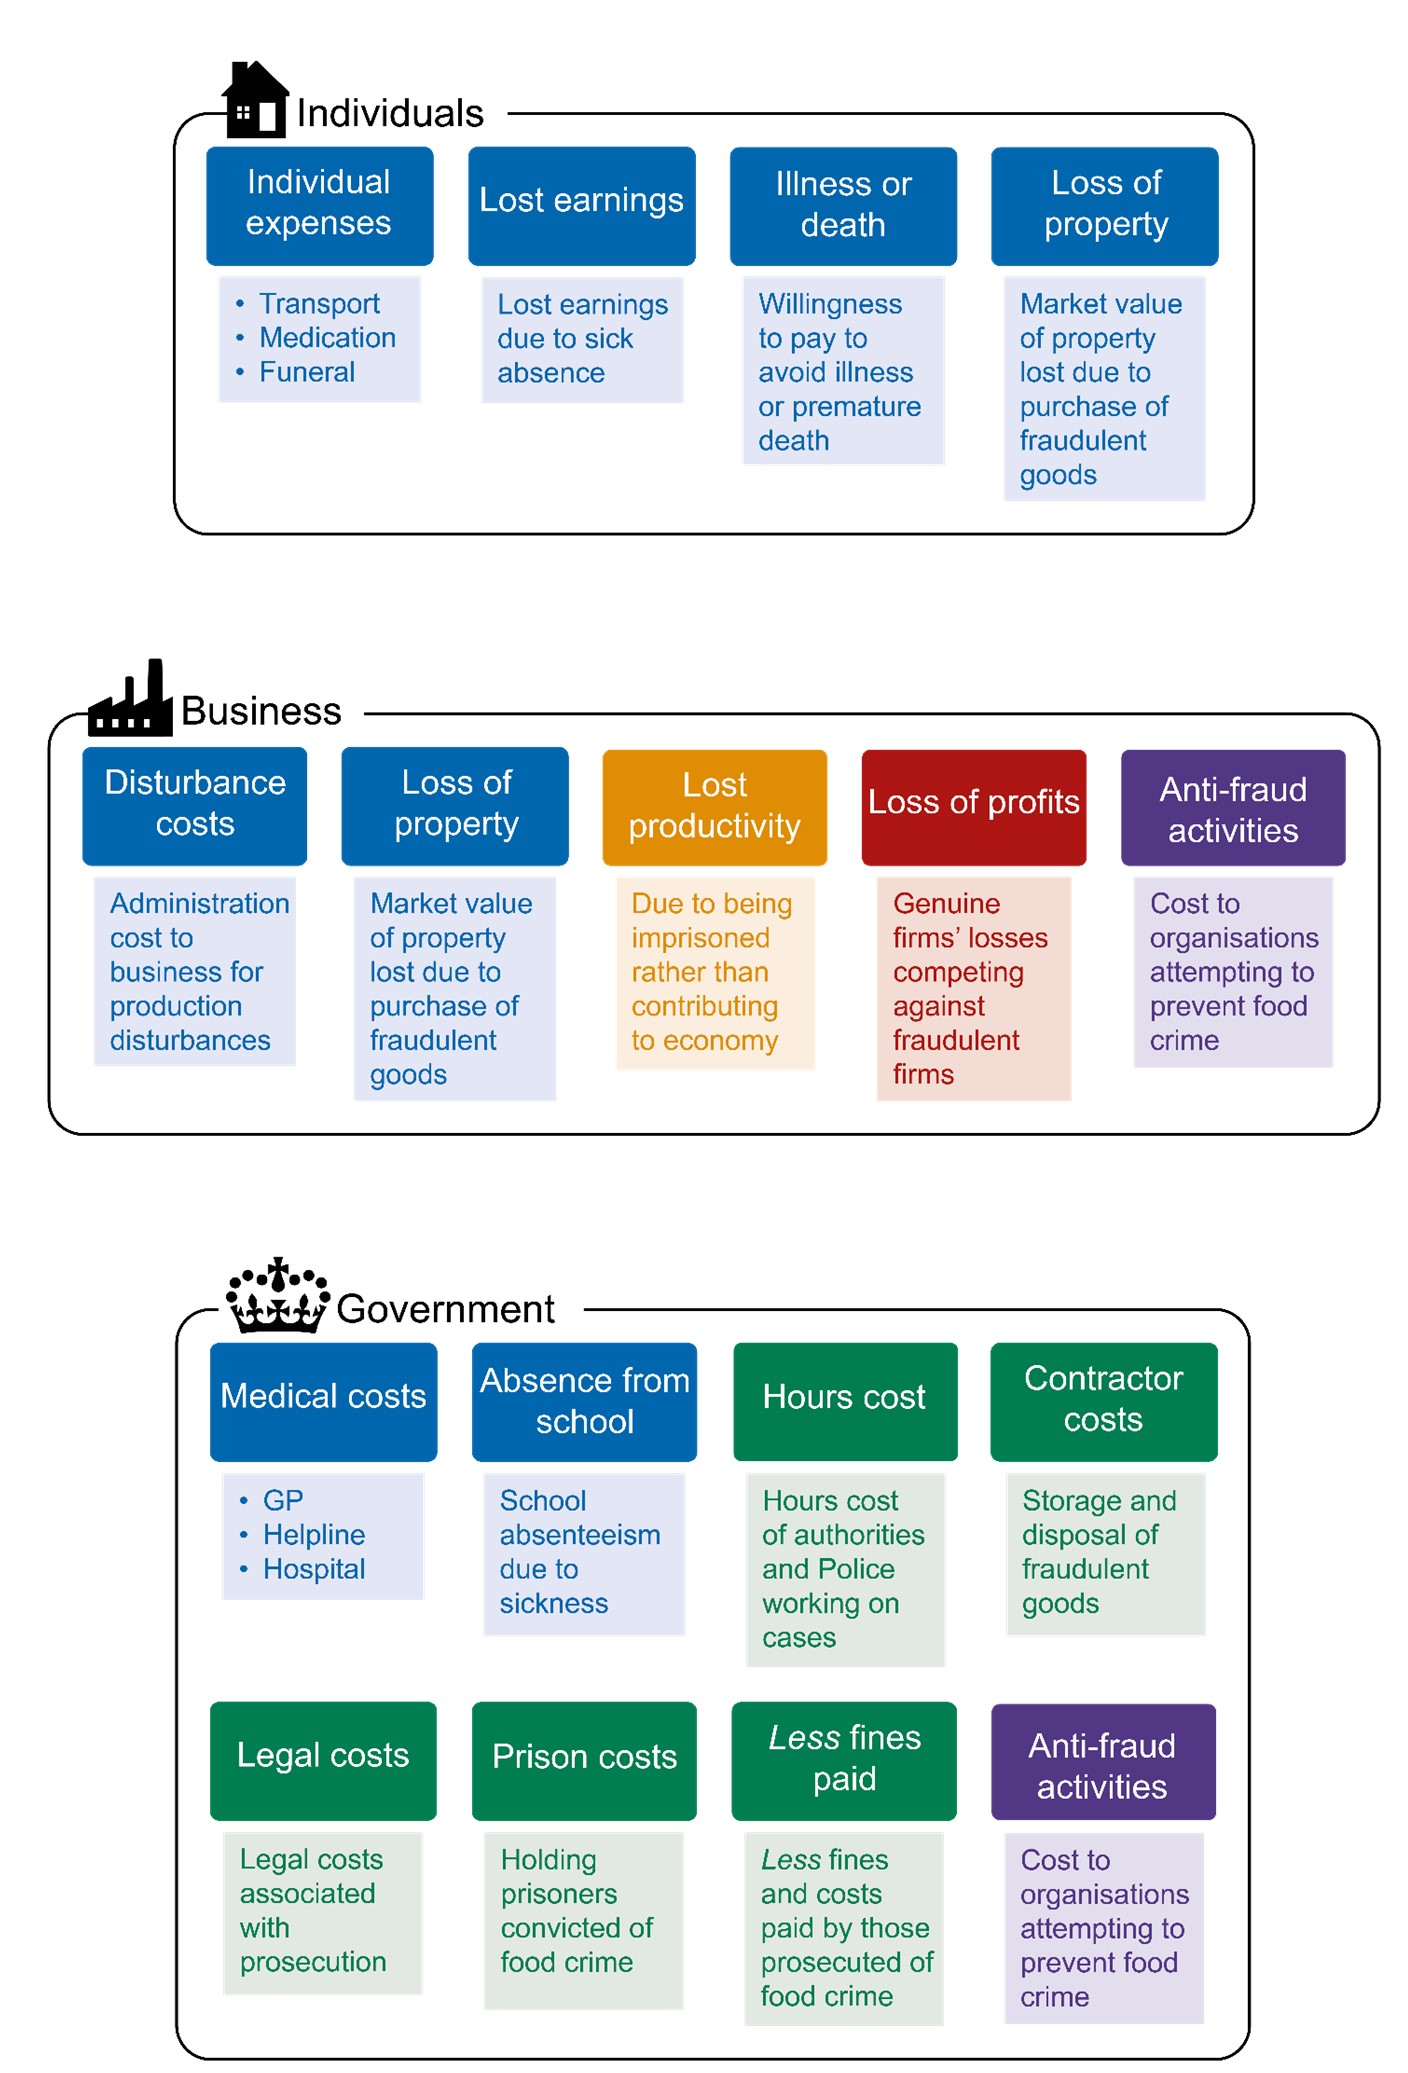
Figure 2: Cost components by affected group (text version)
Individuals
- individual expenses: Transport, Medical and Funeral
- lost earnings: Lost earnings due to sick absence.
- illness or death: Willingness to pay to avoid illness or premature death.
- loss of property: Market value of property lost due to purchase of fraudulent goods.
Business
- disturbance costs: Administration costs to business for production disturbances
- loss of property: Market value of property lost due to purchase of fraudulent goods.
- lost productivity: Due to being imprisoned rather than contributing to economy.
- loss of profits: Genuine firms’ losses competing against fraudulent firms.
- anti-fraud activities: Cost to organisations attempting to prevent food crime.
Government
- medical costs: GP, Helpline, Hospital
- absence from school: School absenteeism due to sickness.
- hours cost: Hours cost of authorities and Police working on cases.
- contractor costs: Storage and disposal of fraudulent goods.
- legal costs: Legal costs associated with prosecution.
- prison costs: Holding prisoners convicted of food crime.
- less fines paid: Less fines and costs paid by those prosecuted of food crime.
- anti-fraud activities: Cost to organisations attempting to prevent food crime.