Research project
Testing the impact of overt and covert ordering interventions on sustainable consumption choices: a randomised controlled trial
A report into whether specific choice architecture intervention in an online supermarket environment can shift consumer choices towards more sustainable options.
The production, transportation, storage, and waste of food products have a significant impact on the environment. The UK government’s National Food Strategy (Dimbleby, 2021), an independent review of England’s entire food system, recommends that multiple interventions are required for healthy and sustainable diets to create a long-term shift in our food culture. Online supermarkets constitute an increasingly large share of grocery shopping, 12.6% of grocery sales were made online in March 2022 compared with just 8.0% three years ago (McKevitt, 2022). Therefore, it is important to understand how interventions in online shopping environments affect consumer choices in relation to the sustainability of products.
We investigated whether a specific choice architecture intervention – displaying products in an ascending order of their carbon footprint – in an online supermarket environment can shift consumer choices towards more sustainable options compared to when products are randomly ordered. We also examined whether the effect of the ordering intervention differs when the ordering is overt, where information about the ordering is explicit, compared to when it is covert and participants are not told about the ordering.
We conducted a three-arm parallel-group randomised trial using a sample of 1842 online panel participants from England, Wales, and Northern Ireland, who had previously shopped online, representative of age, gender and ethnicity. Participants completed a shopping task for a meal for two, choosing one product from each of the six prespecified product categories in a simulated online supermarket environment. Six products were shown in a vertical list on each product category page. Products were randomly ordered for the control arm, whereas the products were ordered by carbon footprint in the covert and overt ordering arms. In addition, in the overt ordering arm, the following statement was displayed in a box at the top of each product page: “The products on this page have been ordered from the most environmentally sustainable to the least environmentally sustainable. This is to make it easier for you to choose a more sustainable product if you wish.”. Participants were randomly allocated to one of the three arms with equal probability. The primary outcome was whether one of the three most sustainable products was chosen in each product category. Participants were blinded to the objective of the trial and experimental conditions, other than their own, until the debrief at the end, and our analyst was blinded to the assignment of experimental arms during initial data analyses.
The key findings are as follows:
• Covert ordering did not affect consumer choices, because there was no effect of a product's position in the list on choice, contrary to evidence in the literature.
• Choices seemed to be mainly driven by prior preferences, suggesting preferences for grocery products might be too ingrained to be changed by subtle rearrangements of choice architecture like the ordering interventions.
• There was no significant difference between the effects of covert and overt ordering interventions.
• Only a small proportion of people correctly identified that the products were ordered by sustainability when the information was explicitly given, highlighting the difficulty of conveying information in the online shopping environment.
There was no effect of the covert ordering intervention on the probability of choosing more sustainable products versus less sustainable products, compared with the control arm (OR = 0.97, 95% CI 0.88-1.07, p-value = 0.533). Furthermore, our hypothesis that the effects of the covert ordering intervention and overt ordering intervention do not differ could not be rejected (p-value = 0.594). Contrary to our assumptions, analysis of the control condition showed that the positioning of products had no effect on choices, which may explain why re-ordering products also had no effect. In the overt condition, only 19.5% of people correctly answered that the products were ordered according to sustainability in a follow-up question, suggesting that they didn’t notice the statement.
The results suggest that preferences for grocery products might be too ingrained to be changed by subtle rearrangements of choice architecture like the ordering interventions. Choices seemed to be mainly driven by prior preferences over the options, rather than by their position on a list, and the majority of participants did not notice a statement about the sustainability ordering in the overt-ordering arm, despite it being pinned to the top of every page. Nevertheless, the results could be specific to the details of the trial design in this study; therefore, whilst we did not find a significant effect we cannot rule out the potential for ordering interventions to cause an effect. In particular, it would be worth determining how to get participants to pay more attention to the statement about the sustainability ordering and then investigating how people respond to it. As this is the first study looking at the effects of product ordering interventions based on the environmental impact in an online shopping environment, more research is needed to strengthen the evidence base and our understanding of whether, and in what context, such interventions could work.
The study was preregistered on Open Science Framework (https://osf.io/ehd2j) before trial launch and any data collection. The study was funded by the Food Standards Agency.
1.1 Background
The production, transportation, storage, and waste of food products have a significant impact on the environment. The food supply chain is estimated to generate around 13.7 billion metric tons of carbon dioxide; this accounts for approximately 26% of anthropogenic Greenhouse Gas emissions (Poore & Nemecek, 2018). The UK government’s National Food Strategy, an independent review of England’s entire food system, recommends that multiple interventions are required for healthy and sustainable diets to create a long-term shift in our food culture (Dimbleby, 2021). To reduce the environmental impact of the food supply chain, consumers need to be able to access a more sustainable diet. The environmental impact of food is also concerning for consumers. For example, 73% of 1,916 surveyed adults (aged 16-75, and living in England, Wales or Northern Ireland), in a study commissioned by the Food Standards Agency (FSA), reported that it is important for them to buy food that has a low environmental impact (Heard & Bogdan, 2021). However, only 49% of those consumers considered their personal diet to be environmentally sustainable. The discrepancy between consumers’ concern for the environmental impact of food and the reported sustainability of their personal diets indicates that there is a need for interventions that can help consumers to access more sustainable products.
Online supermarkets constitute an increasingly large share of grocery shopping. In December 2020, 59% of shoppers reported having used online shopping for food and groceries in the previous month, an increase on the 42% who claimed that in December 2019 (Maynard, 2021). This trend of increasing online shopping was already observed before the coronavirus pandemic: the proportion of people using a home delivery from a supermarket increased from 10% in 2012 to 17% in 2018 (Food Standards Agency, 2019). Recent data show that 12.6% of grocery sales were made online in March 2022 compared with just 8.0% three years ago (McKevitt, 2022). Further, the growth is forecast to continue, with the Institute of Grocery Distribution projecting that the market value of online food and grocery shopping will grow by approximately 21.4% in the next five years, from £22.2 billion in 2021 to £26.9 billion in 2026 (The Institute of Grocery Distribution, 2021). Therefore, it is important to understand how interventions in online shopping environments affect consumer choices in relation to the sustainability of products.
Changing the choice architecture, or the physical environment in which a decision is made, has been used to encourage healthier diets (Ensaff, 2021). It is also increasingly being applied to sustainable diets: evidence reported in a systematic review of interventions on encouraging sustainable diets indicates that physical (in-store and in-canteen) interventions that target automatic non-conscious processes are likely to be effective (Blackford, 2021). Critically, behaviours around purchasing and consumption of food may be habitual, so targeting those behaviours could involve changing the situation that triggers the habitual behaviour or inhibiting the habitual response (Riet et al., 2011).
One type of intervention that has been effective at promoting healthy consumption in physical food-purchasing environments is altering the positioning of items: a meta-analysis of 15 comparisons from 12 studies found that when food was placed further away there was a moderate reduction in its consumption (Standardized Mean Difference −0.60, 95% CI −0.84 to −0.36) (Hollands et al., 2019). In addition, evidence was found for an order effect regarding the positioning of options on physical menus: when healthier items were placed at the top of lists, they were more likely to be chosen (Dayan & Bar-Hillel, 2011; Mueller et al., 2020).
Ordering has also been used to help people make healthier choices when displaying products in digital environments. For instance, when food products in an experimental online supermarket were shown in ascending order of saturated fat content, the percentage of energy from saturated fat for the chosen food products decreased from a baseline of 25.7% to 20.7% (Koutoukidis et al., 2019). In addition to displaying products in an ascending order, changing products’ position on a grid has also been found to have an impact on product choice. For example, in a pre-post design field experiment investigating purchases made in electronic kiosks at McDonalds, moving Coca-Cola from top-left to bottom-middle and Coke Zero from top-middle to top-left, decreased sales of Coca-Cola and increased sales of Coke Zero, without changing overall sales (Schmidtke et al., 2019). It seems unlikely that there is a unified explanation of position effects across different types of tasks, but some causes that are likely to be common across tasks are that people choose positions that are more reachable and positions that are more salient, especially if the incentive structure directs them towards those positions (Bar-Hillel, 2015). In a digital environment, the item that is at the top of the list is most reachable and salient.
In contrast to healthy eating, there is a research gap on the effect of ordering food products by their environmental impact on consumer choices when shopping online. Nonetheless, evidence indicates that putting the most sustainable item at the top of a hard-copy menu is associated with an increase in sustainable food consumption in workplace canteens, hospitals, and educational settings (Langen et al., 2022). Consequently, it is of interest to investigate whether using product ordering can increase the choices of sustainable products in an online supermarket environment.
‘Ordering’ interventions are typically implemented without telling participants that the items have been ordered in a manner designed to influence their choices. They are a type of behavioural intervention or ‘nudge’, which aim to influence behaviour by re-designing the environment in which the choice is made (Thaler & Sunstein, 2009). One general criticism of nudges is that they are manipulative because people do not know that they are being nudged (Goodwin, 2012; Noggle, 2018; Oliver, 2013). Some researchers argued that this lack of transparency was essential for the success of nudges (Bovens, 2009). However, there is now a growing number of studies investigating the effect of disclosing to people that they are being nudged, which show that this claim is unlikely to be correct. A systematic review found that, in 14 papers with 87 tests, only two of the tests showed a negative effect of disclosure; the results of 52 of the tests indicated that there was no effect of being transparent about the nudge and 33 showed that disclosure boosted the effectiveness of nudges compared to nudges without disclosure (Bruns & Paunov, 2021). Further, being transparent about nudges can increase the feeling of autonomy of those being nudged (Wachner et al., 2020). In contrast, revealing nudges only after the event can lead to negative perceptions of the ‘choice architect’, who is doing the nudging (Michaelsen et al., 2021).
Studies on the effect of disclosure of nudges have mainly involved informing people that they are being given a default option (e.g., Bruns et al., 2018; Loewenstein et al., 2015; Paunov et al., 2020). Some studies of disclosure were designed to increase the choice of sustainable options (Bruns et al., 2018; Steffel et al., 2016). Two studies showed that disclosure does not decrease the effectiveness of nudges designed to promote healthy eating by making healthy items more accessible in a bricks-and-mortar environment (Cheung et al., 2019; Kroese et al., 2016). However, as far as we are aware, no studies investigated whether disclosure affects the effectiveness of nudges that use the ordering of items on a menu. This is particularly relevant for online shopping, where there is a default ordering, and where people may be given a choice of different ways to order the products, usually by price or popularity.
1.2 Causal Pathway
The existing literature suggests that showing products in ranked order of sustainability in an online supermarket environment is likely to increase sustainable purchasing when the ordering is ‘covert’, with no information about the ordering given to consumers. When the ordering intervention is ‘overt’, with consumers being told that the products have been displayed in order of sustainability, the causal pathway is thought to be more complicated. The effects of the intervention on the food system are thought to depend on whether various pre-requisites for implementing it exist and on the interaction of business and consumer behaviour. Figure 1 and Figure 2 describe how the covert ordering intervention and overt ordering intervention can work to achieve the expected outcomes. Components are coloured to indicate whether it is capacity, opportunity, motivation, or behaviour in the “COM-B” system (Michie et al., 2011).
Figure 1: Causal schema for covert ordering intervention

Figure 2: Causal scheme for overt ordering intervention

Both interventions work under the prerequisites that supermarkets have set up online supermarket websites/applications and consumers shop online for groceries. For supermarkets to implement the ordering interventions, firstly there need to be established measures of products’ environmental impact available for supermarkets to obtain and use, and there should be variation across products in terms of environmental impact. There need to be sufficient financial and human resources for supermarkets to carry out ordering the products, and supermarkets also need to be motivated to meet environmental targets while meeting consumer demand. For consumers to be exposed to the ordering interventions, they should not be led by the automatic process to simply stick to products they have bought or be driven by a strong preference to sort products according to a particular factor such as price which will immediately overwrite the default ordering. If these conditions are met, products with less negative environmental impact will be shown to the consumers in the top positions on the product pages. When the ordering is covert, automatic processes should lead consumers to look at products sequentially in the order they are displayed and stop at the first satisfactory product (satisficing) to save effort (Bar-Hillel, 2015; Caplin et al., 2011). Therefore, we expect that consumers will unconsciously choose products with less negative impact on environment as an outcome. If the products chosen are affordable and satisfactory to the consumers, then over time consumers will form habits to choose and consume type of products that are less harmful to the environment, and this demand shift will drive business to produce more products with less harm to the environment. Provided that the different product choices do not negatively affect supermarkets’ profits, supermarkets will keep using the ordering and update to reflect any changes (could be due to new products or reformulation of existing products), which will reinforce the demand shift. And the overall long-term outcome will be reduced negative environmental impact of grocery shopping.
When the ordering intervention is overt, for the consumers who do not notice the ordering statement, the same mechanism of covert ordering applies; otherwise, a different mechanism is at work. Revealing the ordering to consumers provides information about which products are more sustainable, making the notion of environmental impact more salient in the online supermarket environment and possibly also conveying a normative message that they ought to choose sustainable products. For overt ordering to have such effects, consumers need to notice and understand the product ordering; moreover, they need to trust that the ordering reflects the environmental impact correctly. When these conditions are met, if a consumer is not averse to receiving messages about what they ought to do, and their other considerations like price and taste do not outweigh their concern for environment, they will consciously choose products that have less negative impact on the environment as an outcome. In addition to long-term outcomes of habit formation and demand shift as discussed for covert ordering intervention, an overt ordering intervention may also increase consumers’ intention to shop sustainably and their knowledge of product sustainability over time, which adds an extra contribution to the ultimate aim of reducing negative impact on environment. Note that as the covert ordering intervention takes advantage of the automatic process of consumers, there is no capability component (as classified by COM-B) in its causal pathway; while when the ordering is overt, consumers engage in reflective processes instead, and the intervention works through increasing consumers’ psychological capabilities.
The randomised controlled trial in this study simplifies away from many of the considerations in real life as shown in Figure 1and Figure 2, and focuses on whether implementing the covert and overt ordering interventions can achieve the desired immediate outcomes as predicted by the theory in a simulated online supermarket environment. Crucially, for the covert ordering intervention to work in the simplified experimental environment, participants are expected to explore the product options in the order they are displayed and pay more attention to products higher up on the list. And for the overt ordering intervention, whether participants are averse to normative overtones about what they should buy, whether they notice, understand, and trust the ordering, and whether their environmental concern is high enough to outweigh other considerations, will all matter for the results.
1.3 Objectives
In this study, we investigated the effect of an ordering intervention on product choice using a randomised controlled trial. Specifically, we showed products in a vertical list with an ascending order of products’ carbon footprint (from lowest carbon footprint/most sustainable to highest footprint/least sustainable), and we examined the effect of this ordering on product choices in an online supermarket environment. In addition, we compared the effect of an ordering intervention that was covert, where no information about the ordering was given, to an ordering intervention that was overt, where a statement with information about the ordering was displayed.
We aimed to test the following two hypotheses.
Hypothesis 1: A covert ordering intervention can shift consumer choices in an online supermarket environment towards more sustainable options compared to when products are randomly ordered.
Hypothesis 2: Making an ordering intervention overt does not affect the choice of sustainable options compared to when the ordering intervention is covert.
2.1 Trial design
An online experiment was conducted with a three-arm between-subjects design. Participants were randomly assigned with equal probability to one of the three arms: control (random ordering), covert (sustainability) ordering, overt (sustainability) ordering. Participants were asked to shop for a meal for two, making six product choices (one product from each of the six product categories), in a simulated online supermarket environment, given a budget for shopping high enough to cover the cost of selecting the most expensive products on the list. The products were chosen from the range available in the online grocery store of a major retailer. To incentivise participants to choose their most preferred products and to ensure that they were price sensitive, as price is the most influential driver of shopping behaviour (Osman & Jenkins, 2021), participants were given the option to enter a prize draw where 10 randomly chosen participants would get a delivery of the items that they chose plus any change from the budget.
In the control (random ordering) arm, products in each product category were randomly ordered. The random order was generated by the computer program for each participant independently, and for each product category independently. In the covert ordering arm, products in each product category were listed in the order of most sustainable to least sustainable, but no information about this ordering was given to the participants. In the overt ordering arm, products in each product category were listed in the order of most sustainable to least sustainable, and a statement was shown in a box at the top of each product category page to reveal this ordering to participants (see Figure 4 and Figure 6). The statement said “The products on this page have been ordered from the most environmentally sustainable to the least environmentally sustainable. This is to make it easier for you to choose a more sustainable product if you wish.”. Other than these differences, the three experimental arms were the same (footnote 1).
The sustainability rank of products in each category was based on the data provided by the web browser extension Envirofy (Shakeri & McCallum, 2021). Envirofy calculates the carbon footprint of products by adding the CO2 emitted during production, transportation, and packaging of the product. The web browser extension gave the calculated CO2 for products in the online grocery store of a major retailer. We used it to generate an ordered product list from lowest to highest carbon footprint, which was implemented for the covert ordering and overt ordering experimental arms.
2.2 Participants and Randomisation
The target population for this trial was online grocery shoppers who are aged over 18 in England, Wales, and Northern Ireland (Scotland was excluded as it is not covered by the FSA). As no official statistics were available on the specific demographic breakdown of online grocery shoppers in the targeted areas, we used quotas plus screening questions to get a sample close to a representative sample of the target group. Firstly, demographic and geographical quotas (see Table 1) based on the population estimates for England, Wales and Northern Ireland were imposed. Secondly, potential participants were asked about their frequency of online grocery shopping as one of the qualification questions (along with demographic questions to implement quotas) and those who chose “never” to the question were excluded.
Participants were recruited through the online panel provider Lucid. Multiple quality checks were embedded in the experiment including checking for consistency of responses to equivalent questions, unusual or implausible answers to certain questions, completion time that was unreasonably short, or whether same response was given to a block of questions. Participants who failed the quality checks were removed from the final sample. The panel provider sent out new invites to potential participants in batches until the planned sample size was reached. Participants were paid the standard panel provider points for completing the experiment conditional on passing the quality checks.
Table 1. Sampling quotas
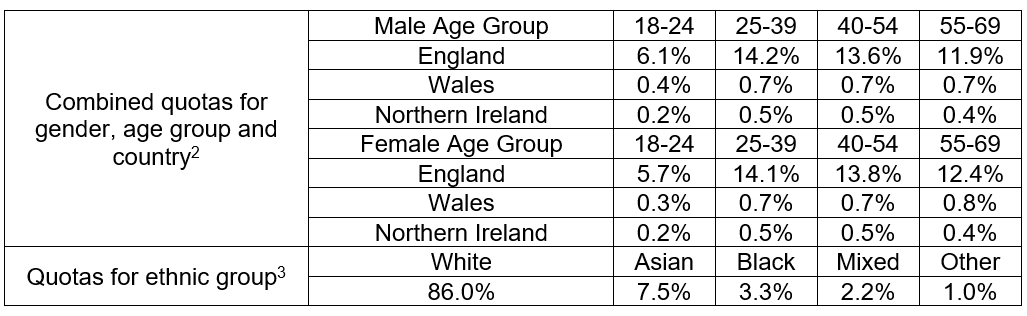
The quotas for age, gender and location come from ONS mid-2020 population estimates, the age, gender and location quotas are based on population aged 18-69 in England, Wales and Northern Ireland.
The quotas for ethnic group come from 2011 Census data and are based on population of all ages in England, Wales and Northern Ireland, as ethnic data for population aged 18-69 is not available.
Participants who passed the qualification stage were randomly allocated with equal probability to one of the three experimental arms. A simple randomization process was used as, with large sample sizes, the samples are usually very similar and balanced across experimental arms. A computer algorithm embedded in the experimental program was used to generate and implement the random allocation sequence to allocate participants recruited to experimental arms.
2.3 Procedure
The experiment involved a simulated online grocery shopping task where participants shopped for six food products for dinner for two in a simulated online supermarket environment. This task was chosen because it allowed a variety of product categories within a familiar and realistic shopping activity. Each participant was given a budget of £30 at the start of the experiment and was introduced to the task. The budget was set to be high enough that it was not possible to exceed the budget with any possible combination of product choices and participants were informed about this at the start. Participants were also informed that they could choose to enter a prize draw where 10 randomly chosen participants would get a delivery of the items that they chose plus any change from the budget. All products used in the experiment were chosen from the range available in the online grocery store of a major retailer; the picture, information and price associated with each product were obtained from the online grocery store as well.
There were six product categories: snack, soup, pizza, dessert, ice-cream, and tea, which were chosen to fit the shopping task. We were also subject to the constraints that there needed to be a range of products of comparable popularity and price, enough non-supermarket-own-label products in a product category, and the products within a category needed to have enough variation in terms of the carbon footprint data provided by Envirofy. Each product category was on a separate page. In the introduction screen, participants were informed about the six product categories and that they would be shown in random order. The product category pages looked like a generic online supermarket interface with products in a category listed in a single column as the main content of the page, which mimicked the way that they would look on a mobile device (footnote 2). An icon of the basket was shown with a number indicating the total price of the products in the basket, which was updated as the content of the basket changes. The layout of the six pages did not differ except for the product-related information. The order of the six pages was randomized for all participants independently. See Figure 3, Figure 4, Figure 5 and Figure 6 for screenshots of the simulated online supermarket.
Figure 3: Screenshot of a product category page in the simulated online supermarket for covert ordering arm, as it looked on a desktop

Figure 4: Screenshot of a product category page in the simulated online supermarket for overt ordering arm, as it looked on a desktop

Figure 5: Screenshot of a product category page in the simulated online supermarket for control (random ordering) arm, as it looked on a mobile phone

There were six products within each product category (See Appendix B for the lists of products). Products in each category were chosen based on the following procedure: 1) products were searched using the name of the product category as a keyword in a real online supermarket environment; 2) chosen products had to differ in terms of names and descriptions from each other but be of similar sizes/weights and enough for serving two people; 3) any supermarket own-label products were avoided to make the simulated online supermarket generic (footnote 3). A picture, a name with brief description (including size/weight), and a price was displayed for each product, as on a real online supermarket shopping page. There was a button to add the product to the basket, which would become a button to remove the product once a product was added. Only one product from each category could be added to the basket. Product choices could be changed while participants stayed on the page but could not be modified once they proceeded to the next page. Participants were informed about this on the introduction page and was reminded about this on each product category page.
Figure 6: Screenshot of a product category page in the simulated online supermarket for overt ordering arm, as it looked on a mobile phone

After participants completed the product choices for the six categories, they were shown the products they had chosen along with the remaining budget and were reminded about the possibility of entering the prize draw. Then they were asked to complete a questionnaire. The first question was a manipulation check, about their awareness of the intervention. Participants were asked, “In the task you just completed, how were the products on each screen ordered?” and given multiple choice from the following answers: by popularity, by price, by sustainability, by healthiness, randomly, don’t know. Then participants were asked about their environmental concern, attitudes towards nudges, normative attitudes towards shopping sustainably, whether they eat meat, and demographics (age, gender, education, income) were asked (see Appendix A for the questionnaire).
The experiment could be completed on a computer, mobile, or tablet, subject to participants’ preference. During the experiment, the computer program automatically recorded the type of the device participants used to complete the experiment, the time spent on each page, and any random order generated. The company DecTech was commissioned to script and administer the online experiment.
No personnel interacted directly with the participants during the trial period as it was an online experiment. Participants in the control (random ordering) and covert ordering arm were blinded to their treatment arm. Participants in the overt ordering arm knew about the intervention but did not know what the other treatment arms were. The experiment was designed to let the participants in the overt ordering arm know about the treatment, as the research question was whether knowing about the treatment changes the treatment effect. The study data was labelled by someone other than the person conducting data analysis without revealing how participants corresponded to the treatment arms, to ensure the analyst was blinded to the treatment assignments.
2.4 Outcomes
The primary outcome of the study was a binary variable indicating whether a more sustainable product was chosen or not at the product category level. It took a value of 1 if the chosen product was one of the three most sustainable products in the category according to the Envirofy ranking, and equalled 0 if the chosen product was one of the three least sustainable products. We decided to use a binary variable as the primary outcome variable instead of the ordinal variable because using an ordinal variable as the dependent variable would require an ordinal regression model and additional assumptions would have to be made, such as the proportional odds assumptions, which might not be met. There are also greater risks of non-convergence when estimating an ordinal regression model with complicated random effects structure. (However, note that we did run ordinal regression models, treating the outcome variable as ordinal, as part of our sensitivity analysis). A cut-off had to be selected to transform the ordinal variable to binary; without a strong reason to choose a particular cut-off, we chose the middle point. The chosen primary outcome represents the likelihood of choosing the three more sustainable products in a category, which is a meaningful result to show for the interventions, as we expected a general shift towards more sustainable products.
It is also possible to use the total carbon footprint of all the six chosen products in the basket as an outcome measure, as Koutoukidis et al. (2019) did. There are two main reasons we decided not to follow this approach: Firstly, this measure would be sensitive to the carbon footprint measures of certain products and certain categories. For example, if two desserts happen to have a very big gap in terms of their carbon footprint compared to the differences between other products, the entire outcome can be driven by the choices between these two desserts. Using outcomes based on the sustainability rank instead of the actual carbon footprint number can help with this issue, making the results more generalisable. This is especially important in the sustainability case, relative to healthiness, given the controversy over how environmental impact should be calculated, and we do not want the results to be very sensitive to the numbers given by the particular sustainability measure we have chosen. Secondly, using the total carbon footprint aggregates over the different product categories and would not allow us to generalise the results to other product categories. The advantage of having different/multiple product categories is that the outcome will not rely on a particular product category or the specific product categories chosen. We would be able to model how the outcome variables and the treatment effects vary across different product categories by including random effects, which enables us to estimate a treatment effect on the outcome variable generalisable to a randomly selected product category (which can be none of the six particular categories chosen in the experiment because we are using them as a “sample” of all possible product categories to estimate a distribution). When we aggregate over different product categories, the information given by the variability across different product categories is lost so we cannot model the variability across product categories and cannot estimate a treatment effect that can be generalised to a randomly selected product category.
There were three secondary outcomes which are alternative forms of the primary outcome, including a binary variable of whether the participant chose the most sustainable product and an ordinal outcome variable that indicates the rank of sustainability of the product chosen in each category. These were used for sensitivity checks, which are described in Appendix C.
2.5 Sample size
The target sample size was 1800 participants completing the whole experiment and passing the quality checks, with around 600 participants in each experimental arm. 2100 participants were targeted to complete the experiment to allow for up to 15% to be cleaned out due to failure of quality checks.
We chose our target sample size based on a power simulation, run using a logistic regression model with the primary outcome variable and random intercepts for participants and product categories, using the Bonferroni-corrected cut-off threshold p < 0.025 to determine whether the results were significantly different from those expected if the two null hypotheses were correct. We had a power of 0.999 to detect a difference of 8%, and a power of 0.843 to detect a difference of 5% assuming relatively low variability of individual and product category random effects (standard deviation being 0.693 and 0.203), between the covert ordering arm and control (random ordering) arm (which is in line with the range of effect sizes found in the literature). Details of power simulations, with the different scenarios considered, can be found in the OSF preregistration (https://osf.io/ehd2j).
2.6 Data Diagnostics
Participants who did not complete the whole experiment or failed the quality checks were excluded from the final sample for data analysis as described in the participants’ section. There was no other post-data collection exclusion of participants. There was no missing data for any of the variables used in the data analyses. Outliers are not a concern given the nature of the outcome variables.
2.7 Statistical Methods
The main model for testing the two hypotheses was a generalised linear mixed model with logistic link function given a binary primary outcome. The basic specification of the model is given in Appendix C. The statistical programming language R (R Core Team, 2021) and the development environment RStudio (RStudio Team, 2021) Version 2021.9.1.372 were used to perform the data analysis.
2.8 Ethics and Registration
Ethics approval was obtained for this trial from LSE Research ethics committee (Ref: 57054). This study and the data analysis plan were preregistered on Open Science Framework (https://osf.io/ehd2j) before trial launch and any data collection. The full trial protocol can also be accessed via the Open Science Framework preregistration.
-
Given six products in each category, there are 6*5*4*3*2*1=720 possible orderings for a product category, and the sustainability ordering will be 1 out of the 720 possibilities. Therefore, for the majority in the control (random ordering) arm, the ordering will be different from the treatment arms. We did not exclude ex ante the possibility of randomly generating an ordering that happens to be the same as the sustainability ordering in treatment arms for the control (random ordering) arm because we want the ordering in the control (random ordering) arm to be truly random, which gives us a clear interpretation of any effects found.
-
[1] Note that the layout of product lists varies across devices for real online supermarkets, usually with a single column vertical list layout like the one in this study for mobile phones, but a 4-column grid layout for wider screens. The study standardised the layout for all device types in order to get a clean effect of sustainability ordering and to maximise the power of the study given limited budget and sample size. If the layout were allowed to vary across device types, it would be difficult to interpret the results as it is not completely clear what the equivalent of top of the list position is for a grid layout, and device type would confound layout format. However, since the effect of the ordering intervention might differ depending on the layout and screen type, caution needs to be taken when generalizing the findings of this study.
-
We chose to include six products in each product category because this study focuses on ordering of products, namely the position effects, and six products should give enough variation in terms of position of products (see Bar-Hillel (2015), Dayan & Bar-Hillel (2011) and Schmidtke et al. (2019) for research studying position effects with similar number of products in a category). Products in different positions are predicted to be chosen with different probabilities based on the assumption that individuals pay more attention to certain positions on a page. This is different from the “above-the-fold” effect, which concerns the extra effort involved in scrolling down a page. Given a fixed budget, there is a trade-off between the number of products in each category and the number of categories. Increasing the number of product categories can help increase the power given a fixed sample size, while increasing the number in a category will not. Therefore, we settled with six products per category with six categories, given the budget available.
3.1 Recruitment
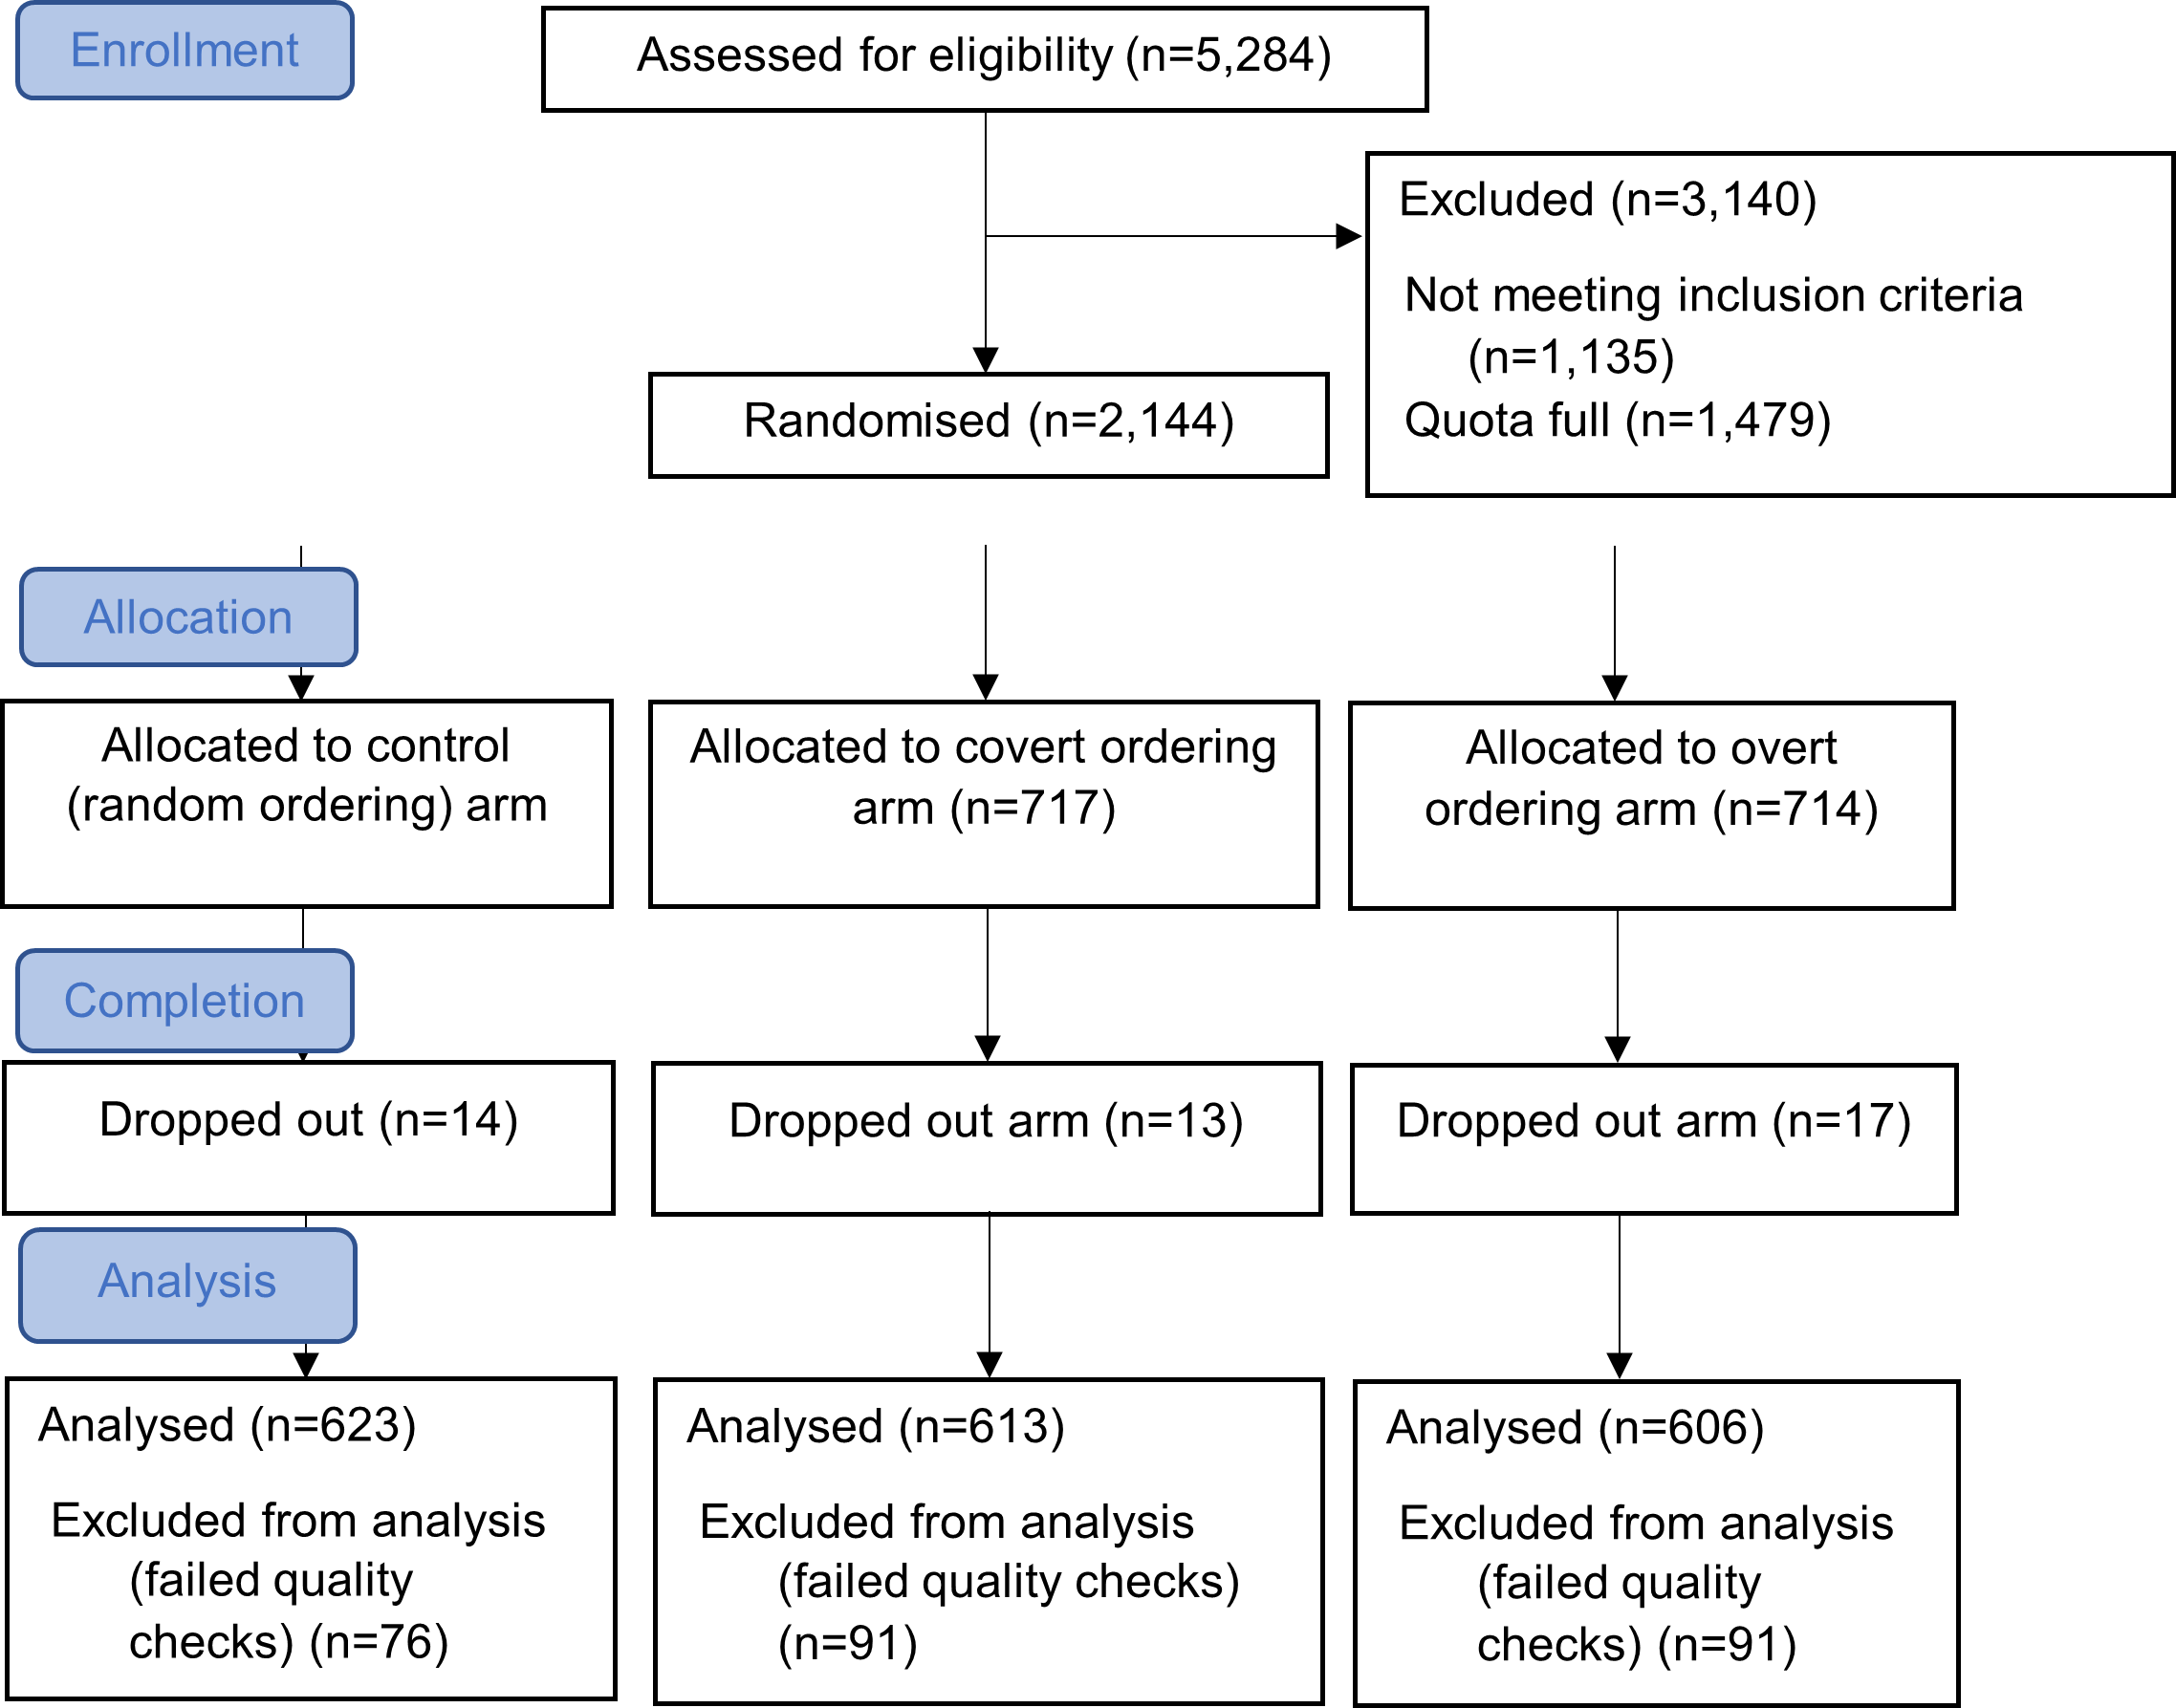
The online experiment was launched on the 9th of March 2022 and finished on the 21st of March 2022 A total of 5284 potential participants were assessed for eligibility; 2144 participants passed the qualification stage and started the experiment; 44 participants dropped out during the experiment; 258 participants completed the experiment but failed the quality checks, and were thus not included in the final sample; 1842 participants were included in the final sample with complete data used for statistical analyses. Figure 7 shows the participant flow. Baseline demographic characteristics for each arm can be found in Appendix Table 4. Responses to attitudinal questions for each arm can be found in Appendix Table 10.
Figure 7: Participant Flow
The modal frequency of online grocery shopping among participants was ‘at least weekly’ in all three arms, and 37.9% across the sample as a whole.
Participants on average spent 5.96 minutes on the experiment (SD = 5.62). Participants received the standard panel incentives for completing the experiment (which is confidential commercial information) and spent an average of £14.90 (SD = 1.48) on the shopping task, leaving average change of £15.10. 984 (53.4%) of participants chose to enter the prize draw. 1301 (70.6%) of participants accessed the experiment with their mobile phone, while 526 (28.6%) of participants used a desktop/laptop computer and 15 (0.8%) of participants used a tablet. The trial was conducted according to the trial protocol without deviation.
3.2 Main Results
Participants chose a more sustainable product 59.5% of the time in the random-ordering arm, 58.8% of the time in the covert ordering arm, and 59.6% of the time in the overt ordering arm, an average of 59.3% over the entire sample. Our optimal model showed that there was no statistically significant effect of the covert ordering intervention on the probability of choosing more sustainable products versus less sustainable products (OR = 0.97, 95% CI 0.88-1.07, p = 0.533). Furthermore, our hypothesis that the effects of the covert ordering intervention and overt ordering intervention do not differ could not be rejected (z-value = -0.533, p = 0.594). See Table 2 for results of the optimal model with optimal random effects structure and reduced set of covariates. Note that the variances of random effects (participant-related variance = 0.03, category-related variance = 0.04) were smaller than expected in the power simulations, but so was the effect size of the interventions. Specifically, we assumed that the effect size of the interventions would be 5% to 8%, but the actual effect size was much lower (point-based estimate, given our optimal model, for both intervention arms was less than 1%). The results were not sensitive to the inclusion of extra covariates.
There were demographic differences in sustainable choices. Older people were less likely to choose a more sustainable product (OR = 0.88, 95% CI 0.85 – 0.92, p < 0.001), as were people with higher education (OR = 0.91, 95% CI 0.83 – 0.99, p < 0.028), and higher household income (OR = 0.96, 95% CI 0.92 – 1.00, p < 0.031). Those who did not eat meat were more likely to choose a sustainable product (OR = 1.16, 95% CI 1.01 – 1.32, p < 0.033).
The models specified as sensitivity analyses with secondary outcomes all showed the same pattern of results (see Appendix C and Appendix D).
Table 2. Optimal model for primary outcome - more sustainable product chosen

Overt ordering and covert ordering are indicator variables of the experimental conditions, with the control random ordering as the reference level; the coefficients for Overt/Covert ordering show the difference between these conditions and Control random ordering.
3.3 Additional Analyses
There were also no effects of the intervention when we inspected for differences between different demographic groups or participants’ attitudes to sustainability. Putting interaction terms into the model for the primary outcome—allowing the terms for the intervention arms to interact with participants’ age, gender, higher education status, and their household income—found no statistically significant results. A model that contained interaction terms for the intervention arms and participants’ environmental concern and their reactance to nudges also found no statistically significant results.
Last, no differences were found between experimental arms in terms of participants’ normative attitudes towards buying sustainably. (See Figure 8 for the distribution of answers for each experimental arm.)
Figure 8: Histogram of normative attitudes towards shopping sustainably for each experimental arm

3.4 Exploratory Analyses
Since we did not find an effect of our interventions, we performed some exploratory analyses to try to explain why we did not find an effect (footnote 1).
We expected that the covert ordering would have an effect because automatic processes would lead consumers to choose positions that are more reachable and more salient. If this mechanism is at work, we would expect participants in the control (random ordering) and covert ordering arms to be more likely to select products that are positioned at the top of the vertical list. However, in the control (random ordering) arm, products in different positions on a page were chosen by participants with similar frequencies (see Figure 9), contradicting the assumption that people choose products in positions that are more reachable and more salient. Although in the covert and overt ordering arms, products in different positions were chosen by participants with different frequencies, the patterns varied across different product categories. Note that product positions in both the covert and overt ordering arms were determined by their sustainability ranking, meaning the same position represents the same product for these two arms. Thus, the similarity of patterns for a product category between these two arms could reflect the variance of preference for different products in a category shared by participants in both arms.
Figure 9: Frequency of choices by product position

None of the variables we manipulated or controlled for explained much of the variance in participants’ choices. To further explore what drives the purchasing decision, we ran a logistic regression model with product’s price, weight, and position to predict the characteristics that make a product more likely to be chosen in the random-ordering arm. (footnote 2)
Table 3. Factors affecting whether a product is chosen in control (random ordering) arm - more sustainable product chosen

* The reference level for position is Position 1; the coefficients for Positions 2-6 show the difference between these positions and Position 1.
Participants were more likely to select cheaper products (OR = 0.67, 95% CI 0.62 – 0.71, p < 0.001). Without the adjustment for multiple comparisons there was a statistically significant difference between position two and position one, as well as position two and position four (see Table 3 and Appendix Table 9). However, adjusting the p-value for multiple comparisons using Tukey’s correction (footnote 3), only the difference between position four and position two remained statistically significant, whereby the odds of choosing a product were lower when a product was in position 4 compared to position 2 (OR = 0.78, 95% CI 0.65 – 0.93, p < 0.001) (see Appendix Table 9 for the log odds estimates). However, the model accounted for 3.2% (conditional R2 = 0.032) of the variance in purchasing behaviour (pseudo-R2 value was calculated using the delta method, see Nakagawa et al., 2017), which suggests that product choices are affected largely by factors other than price, weight, and position that were not accounted for by our model. Looking more closely at the relationship between frequency of choices and the price rank of a product within its category (see Figure 10), products of the same price rank within a category were chosen with very different frequencies; while for product categories like pizza, the most expensive product was chosen most often, for other product categories like ice-cream, it was the cheapest product that was chosen most often. When we examined the probability of choosing a product and price variation in each product category, it became obvious that there were factors other than price that affected choices. For example, five snack products had the same price of £1.99 but two of them were chosen much more often; the most preferred pizza was the most expensive one in the category; and the two most expensive desserts were preferred to the two cheap desserts that were approximately half the price of the most expensive desserts.
Figure 10: Frequency of choices by price rank of product

We expected that the overt-ordering intervention would operate via participants noticing the ordering and consciously choosing products that are more sustainable; however, it seems that most participants did not notice. In our post-intervention questionnaire, only 19.5% of participants in the overt-ordering arm correctly answered that the products were listed in order of sustainability. The modal choice in all arms was the products were listed randomly. (See Figure 11 for the percentage of participants choosing each answer to this question for each experimental arm.) In overt ordering arm, participants who used a desktop were more likely to answer correctly that products were ordered by sustainability, with 34.2% answering correctly compared to 14.2% who used a mobile (OR = 0.32, 95% CI 0.21 – 0.49, p < 0.001) and 0.0% of those who used a tablet (see Appendix Table 11). In contrast there was no relationship between time spent on product choice pages and likelihood of choosing the correct option for the overt arm (OR = 1.00, 95% CI 1.00 – 1.00, p = 0.241).
Figure 11: Percentage of participants choosing each answer to the question about product ordering, split by experimental arm

We also did some exploratory analyses to probe possible influences on behaviour (all looking at interactions between the factors of interest and the three arms). We found no evidence that the interventions affected people differently depending on what device they were using (mobile vs tablet vs laptop); likewise, we found no evidence that interventions had a different effect depending on the total time spent on the product choice pages. Similarly, the way people thought that the products were ordered did not affect the interventions, for instance thinking that products were ordered by healthiness did not lead to different choices in the interventions than thinking that they were ordered by any of the other principles. However, when we look only at the participants in the overt arm, those who chose correctly that products were ordered by sustainability were more likely to choose a more sustainable product than participants in the overt arm who did not notice the sustainability ordering (OR = 1.24, 95% CI 1.04 – 1.49, p = 0.017) (footnote 4). Note that this was an exploratory analysis, so the result would need to be confirmed in further work.
-
The analyst was unblinded about the treatment assignment at this point as the pre-registered analysis had been completed and the extra analyses required knowledge of treatment assignment to help understand the results.
-
This analysis does not work for the covert and overt ordering arms because position was fixed for products and thus confounded with other product characteristics.
-
Multiple comparisons increase the likelihood of false positives (Type I error); therefore corrections are needed.
-
In the covert arm, those who chose products were ordered by sustainability were also more likely to choose a more sustainable product although not significantly (OR = 1.25, 95% CI 0.85-1.82, p = 0.252)
We found that listing the products in an online supermarket in order of sustainability did not have an effect on the proportion of sustainable choices, either when the ordering was covert or when it was accompanied by a statement informing participants about the product ordering. Participants chose a more sustainable product 59.5% of the time in the random-ordering arm, 58.8% of the time in the covert ordering arm, and 59.6% of the time in the overt-ordering arm. Nor did we find any effect of the interventions in sensitivity analyses on secondary measures, which included the selection of the most sustainable product in a category and the sustainability rank of chosen products. This may be because neither of the two mechanisms by which we surmised our interventions would work were operative. We expected that the covert ordering would work because there would be an effect of position, with participants choosing products that were higher in the lists because they were more reachable and salient. However, additional analyses suggested that, in the random-ordering arm, there was no effect of the position of a product on the product category page. We expected that overt ordering would operate via conscious decision-making processes. However, in the overt-ordering arm, only 19.5% of participants correctly identified that the products were ordered by sustainability in a post-task questionnaire, so it seems the majority did not notice the statement telling them about the ordering.
It is surprising that our covert ordering intervention did not have an effect, given results from other studies that carried out similar interventions. Our study was powered to detect a 5% difference (when there is relatively low variability of individual and product category random effects), which is the magnitude of the difference found by Koutoukidis et al (2019). Our study does differ from many of the few existing studies, which were based on behaviour in bricks-and-mortar environment using hard-copy menus when healthier items were placed at the top of lists (Dayan & Bar-Hillel, 2011; Mueller et al., 2020), including the one that ordered products by environmental impact (Langen et al., 2022). There are also differences in study design, for example we used a randomised controlled trial, whereas Schmidtke et al. (2019) used a pre-post design in actual kiosks. In comparison, participants in our study made product choices in a simplified online supermarket environment following a structured shopping task. This setting might make it easier for participants to explore and pay attention to all product options, compared to a noisier off-line environment or an online environment with more choices. However, it should also be noted that our modelling approach minimised Type-I errors and studies that used traditional approaches such as the Analysis of Variance have a higher risk of finding spurious effects (Jaeger, 2008). We used logistic mixed-effects models, which included separate error terms for participant and product category, allowing us to incorporate additional uncertainty in the estimates of intervention effects associated with variation between participants and categories. Models that do not take this variation into account are likely to underestimate the standard errors of coefficients, potentially leading to an overstatement of statistical significance.
Another possibility is that ordering interventions only have an effect in online interventions when there is the potential for a lot of scrolling, so people do not make it to the bottom of the list. In our experiment, the number of products that were shown on the screen without scrolling varied by device model and screen size, but it was designed so that four products were shown without scrolling on most devices and screens. As mentioned in Footnote 5, we conjecture ordering to have an effect based on position, which is different from scrolling, which relates more to the “above-the-fold” effect. If scrolling modified the effects, we would expect products displayed at the bottom two positions to be selected less as participants would need to scroll down to see them, however, there is no evidence of this in our data (see Table 3 and Figure 9). We cannot rule out the possibility that if there were more products and more scrolling was required to see products at the bottom of the list, then products further down the list might be chosen less. However, in that case, it is questionable whether ordering is still the relevant mechanism (when you think of ordering as being analogous to placing products at the top of the list on a physical menu). Instead, you might think it is more similar to interventions that decrease the availability of certain products or increase their costs, by making them harder to find.
As far as we know, ours is the first study to investigate ordering effects for sustainable products in online environments; the closest comparator study aims to promote the choice of healthier products. Koutoukidis et al. (2019) also used a simulated online supermarket environment. The task was slightly different, as participants were given a 10-item shopping list and could browse categories rather than going through a forced-journey; and it was entirely hypothetical, participants did not receive the products they chose. The primary outcome measure was the saturated fat content of the whole basket, which decreased by 5%. One of the secondary outcome measures showed that there was a 10% decrease in the percentage of products with less than 1.5% saturated fat per 100g in the basket, i.e. products that can be labelled as ‘low’ in saturated fat content according to Department of Health guidance (Department of Health and Social Care, 2016). So on average participants given an ordered list put more products that were low saturated fat in their baskets. Some products that are low in saturated fact are obviously labelled as low fat, for instance semi-skimmed milk or lighter butter (both of which were used in the experiment). Open-ended comments left at the end of the experiment suggested that participants wanted to buy healthier food and that they noticed that the healthier products were at the top of the ordering. This is potentially quite different from sustainable products, where it is not always obvious which product is more sustainable, especially within product categories, and where consumers often do not know what choices will reduce their carbon footprints (Kause et al., 2019). Further, when making food choices, health and nutrition are more important to consumers than sustainability (Fox et al., 2021; Ghvanidze et al., 2017; Grunert et al., 2014). So it is possible that re-ordering according to nutrition content is noticed by consumers and supports their reflective decision-making, in a manner that re-ordering according to sustainability did not.
Even in our overt ordering intervention, where we had a statement at the top of the product category telling participants about the ordering (see Figure 4 and Figure 6) , participants did not notice that products were listed in order of sustainability. Other researchers have also reported that many people did not notice their disclosure statements (see Wachner et al.(2020) for an online study and Kroese et al.(2016) for a field study). We had thought that putting the statement in a box at the top of the page would be salient, but participants may have focused on the product list itself. Our interface was simplified compared to an actual online supermarket, so in real-life shopping people might be even less likely to pay attention to information about sustainability rankings of products. However, in future studies, if time and budget allow, it would be good to pre-test disclosure messages to determine how best to display them.
Future research could also investigate how to make an environmental ordering more salient. One possibility would be to use pop-ups, which have been successful in prompting people to make healthier swaps (Bunten et al., 2021; Huang et al., 2006; Jansen et al., 2021; Koutoukidis et al., 2019); whereas see Forwood et al. (2015) for a swap experiment in simulated supermarket that was not successful. However, it should be noted that a trial using pop-ups in a real online supermarket, where students were given money to place an order and actually received their products, pop-ups for healthy choices did not increase the proportion of healthy purchases despite being powered to detect a difference of 1% (Stuber et al., 2022). More field research in real supermarket environments is required to establish the external validity of the effects of pop-ups on behaviour, but they at least seem to be noticed in simulated environments.
The trial in this study was designed to simulate an online supermarket environment in real life, and to be as close as possible to a real online supermarket. The experimental interface was designed to mimic the layout of existing major online supermarkets and all the products with their names, prices and pictures were taken from existing online supermarkets as well. A large sample from England, Wales and Northern Ireland representative of age, gender and ethnicity was recruited to complete the experiment, with real material incentives in terms of getting the chosen products and strict quality checks to ensure that final sample excluded participants who were likely to have not participated fully. Therefore, the absence of position effects and the large variation in preferences for different products should reflect to some extent consumer behaviour in real-life online grocery shopping environment. Even for products in a relatively narrow product category that were chosen to be comparable to each other, characteristics other than position and price play important roles in determining the purchasing decisions. Research has pointed out the importance of habits and tastes in food choices (Fox et al., 2021; Osman & Jenkins, 2021; Riet et al., 2011), and our results show that such habits and tastes might be too ingrained to be changed by subtle modification of situational cues.
We do not have data on popularity of the chosen products (the supermarket whose products we used did not provide that information), although the results did seem to suggest that consumer choices were driven strongly by preferences for specific products which is probably taste based. For example, in the soup category, the third product is among the most popular ones despite being expensive, while the fifth product which has the same brand as the third product is not popular. Selection of products in this experiment was subject to multiple restrictions mentioned in Section 2.3. In future studies, if time and budget allow, it would be desirable to run pre-tests to make sure the products are of closer popularity.
There are limitations to this study. Given the reported variance estimates in Table 2, our trial was able to detect an effect of 5%. It is possible that the effects of ordering interventions are smaller than 5% so cannot be detected by the current sample size. However, the point-based estimates of our optimal model did not suggest there are such effects. Secondly, it is possible that our results are specific to the products chosen, the product categories chosen, the number of products on each page, the measure of sustainability, and other details in terms of experimental design. We did try to choose products that were comparable to each other in terms of popularity and price, while still having variance in their carbon footprint.
Nevertheless, we cannot rule out the possibility that the findings are specific to the experimental design and more research using variations of the design is welcomed to generate more evidence on the effects of such interventions. Finally, despite our effort to simulate the online grocery shopping experience with high ecological validity and recruit a sample that is representative, the results still come from an online experiment completed by panellists, which potentially threatens the ability to generalise from our results to the real-life situation we are studying (external validity) and which could be better dealt with using a field trial.
It is worth pointing out that, as discussed in Section 1.2, the trial simplified many of the real-life considerations. In a real online supermarket, consumers can go straight to the lists of their favourite products or products they have bought before and choose from there, without being exposed at all to other products that might be more sustainable (Bunten et al., 2022). Consumers can also sort the products by price, popularity, or other factors that they care more about, which is likely to overwrite any default ordering that is intended to nudge consumer choices. Because our online shopping task did not have either of those features, we increased the chance that we would find an ordering effect compared to a real-life environment, and we still did not find an effect.
Many interventions around changing the choice architecture have been shown to be effective in encourage healthier and more sustainable diets. However, the particular interventions investigated in this study – ordering food products in a simulated online supermarket by their environmental impact covertly/overtly – were not found to generate the expected increase in consumers’ likelihood of choosing more sustainable products. Our results suggest there are ingrained preferences for different grocery products that largely determine purchasing choices, and the difficulty of conveying information effectively to consumers in the online grocery shopping environment. To our knowledge, this study is the first to explore the effects of ordering interventions by environmental impact in an online shopping environment. More research needs to be done to continue to fill the evidence gap, provide more solid answers to the research questions on the effectiveness of such interventions, and enrich our understanding of when changing choice architecture works.
- Bar-Hillel, M. (2015). Position Effects in Choice From Simultaneous Displays: A Conundrum Solved. Perspectives on Psychological Science, 10(4), 419–433. https://doi.org/10.1177/1745691615588092
- Bates, D., Kliegl, R., Vasishth, S., & Baayen, H. (2018). Parsimonious Mixed Models. ArXiv:1506.04967 [Stat]. http://arxiv.org/abs/1506.04967
- Blackford, B. (2021). Nudging interventions on sustainable food consumption: A systematic review. The Journal of Population and Sustainability, 5. https://doi.org/10.3197/jps.2021.5.2.17
- Bovens, L. (2009). The Ethics of Nudge. In T. Grüne-Yanoff & S. O. Hansson (Eds.), Preference Change: Approaches from Philosophy, Economics and Psychology (pp. 207–219). Springer Netherlands. https://doi.org/10.1007/978-90-481-2593-7_10
- Bruns, H., Kantorowicz-Reznichenko, E., Klement, K., Luistro Jonsson, M., & Rahali, B. (2018). Can nudges be transparent and yet effective? Journal of Economic Psychology, 65, 41–59. https://doi.org/10.1016/j.joep.2018.02.002
- Bruns, H., & Paunov, Y. (2021). Why Policymakers Should Be Transparent About the Behavioural Interventions They Use: A Systematic, Policy-Oriented Review (SSRN Scholarly Paper ID 3948978). Social Science Research Network. https://doi.org/10.2139/ssrn.3948978
- Bunten, A., Porter, L., Sanders, J. G., Sallis, A., Riches, S. P., Schaik, P. V., González-Iraizoz, M., Chadborn, T., & Forwood, S. (2021). A randomised experiment of health, cost and social norm message frames to encourage acceptance of swaps in a simulation online supermarket. PLOS ONE, 16(2), e0246455. https://doi.org/10.1371/journal.pone.0246455
- Bunten, A., Shute, B., Golding, S. E., Charlton, C., Porter, L., Willis, Z., Gold, N., Saei, A., Tempest, B., Sritharan, N., Arambepola, R., Yau, A., & Chadborn, T. (2022). Encouraging healthier grocery purchases online: A randomised controlled trial and lessons learned. Nutrition Bulletin, 0(0), 1–13. https://doi.org/10.1111/nbu.12552
- Cheung, T. T. L., Gillebaart, M., Kroese, F. M., Marchiori, D., Fennis, B. M., & De Ridder, D. T. D. (2019). Cueing healthier alternatives for take-away: A field experiment on the effects of (disclosing) three nudges on food choices. BMC Public Health, 19(1), 974. https://doi.org/10.1186/s12889-019-7323-y
- Dayan, E., & Bar-Hillel, M. (2011). Nudge to nobesity II: Menu positions influence food orders. Judgment and Decision Making, 6, 333–342. Department of Health and Social Care. (2016). Front of Pack nutrition labelling guidance. (gov.uk)
- Dimbleby, H. (2021). National Food Strategy: The Plan [Independent Review]. https://www.nationalfoodstrategy.org/wp-content/uploads/2021/07/National-Food-Strategy-The-Plan-1.pdf
- Ensaff, H. (2021). A nudge in the right direction: The role of food choice architecture in changing populations’ diets. Proceedings of the Nutrition Society, 80(2), 195–206. https://doi.org/10.1017/S0029665120007983
- Food Standards Agency. (2019). The Food and You Survey—Wave 5 (p. 96). Food Standards Agency. (gov.uk)
- Forwood, S. E., Ahern, A. L., Marteau, T. M., & Jebb, S. A. (2015). Offering within-category food swaps to reduce energy density of food purchases: A study using an experimental online supermarket. International Journal of Behavioral Nutrition and Physical Activity, 12(1), 85. https://doi.org/10.1186/s12966-015-0241-1
- Fox, E. L., Davis, C., Downs, S. M., McLaren, R., & Fanzo, J. (2021). A focused ethnographic study on the role of health and sustainability in food choice decisions. Appetite, 165, 105319. https://doi.org/10.1016/j.appet.2021.105319
- Ghvanidze, S., Velikova, N., Dodd, T., & Oldewage-Theron, W. (2017). A discrete choice experiment of the impact of consumers’ environmental values, ethical concerns, and health consciousness on food choices: A cross-cultural analysis. British Food Journal, 119(4), 863–881. https://doi.org/10.1108/BFJ-07-2016-0342
- Goodwin, T. (2012). Why We Should Reject ‘Nudge.’ Politics, 32(2), 85–92. https://doi.org/10.1111/j.1467-9256.2012.01430.x
- Grunert, K. G., Hieke, S., & Wills, J. (2014). Sustainability labels on food products: Consumer motivation, understanding and use. Food Policy, 44, 177–189. https://doi.org/10.1016/j.foodpol.2013.12.001
- Heard, H., & Bogdan, A. (2021). Healthy and sustainable diets consumer poll (p. 15). Food Standards Agency. (gov.uk)
- Hollands, G. J., Carter, P., Anwer, S., King, S. E., Jebb, S. A., Ogilvie, D., Shemilt, I., Higgins, J. P. T., & Marteau, T. M. (2019). Altering the availability or proximity of food, alcohol, and tobacco products to change their selection and consumption. Cochrane Database of Systematic Reviews, 9. https://doi.org/10.1002/14651858.CD012573.pub3
- Hong, S.-M., & Faedda, S. (1996). Refinement of the Hong Psychological Reactance Scale. Educational and Psychological Measurement, 56(1), 173–182. https://doi.org/10.1177/0013164496056001014
- Huang, A., Barzi, F., Huxley, R., Denyer, G., Rohrlach, B., Jayne, K., & Neal, B. (2006). The Effects on Saturated Fat Purchases of Providing Internet Shoppers with Purchase- Specific Dietary Advice: A Randomised Trial. PLOS Clinical Trials, 1(5), e22. https://doi.org/10.1371/journal.pctr.0010022
- Jaeger, T. F. (2008). Categorical data analysis: Away from ANOVAs (transformation or not) and towards logit mixed models. Journal of Memory and Language, 59(4), 434–446. https://doi.org/10.1016/j.jml.2007.11.007
- Jansen, L., van Kleef, E., & Van Loo, E. J. (2021). The use of food swaps to encourage healthier online food choices: A randomized controlled trial. International Journal of Behavioral Nutrition and Physical Activity, 18(1), 156. https://doi.org/10.1186/s12966-021-01222-8
- Kabacoff, R. (2011). R in action: Data analysis and graphics with R (2., corr. printing). Manning.
- Kause, A., Bruine de Bruin, W., Millward-Hopkins, J., & Olsson, H. (2019). Public perceptions of how to reduce carbon footprints of consumer food choices. Environmental Research Letters, 14(11), 114005. https://doi.org/10.1088/1748-9326/ab465d
- Koutoukidis, D. A., Jebb, S. A., Ordóñez-Mena, J. M., Noreik, M., Tsiountsioura, M., Kennedy, S., Payne-Riches, S., Aveyard, P., & Piernas, C. (2019). Prominent positioning and food swaps are effective interventions to reduce the saturated fat content of the shopping basket in an experimental online supermarket: A randomized controlled trial. International Journal of Behavioral Nutrition and Physical Activity, 16(1), 50. https://doi.org/10.1186/s12966-019-0810-9
- Kroese, F. M., Marchiori, D. R., & de Ridder, D. T. D. (2016). Nudging healthy food choices: A field experiment at the train station. Journal of Public Health, 38(2), e133–e137. https://doi.org/10.1093/pubmed/fdv096
- Langen, N., Ohlhausen, P., Steinmeier, F., Friedrich, S., Engelmann, T., Speck, M., Damerau, K., Bienge, K., Rohn, H., & Teitscheid, P. (2022). Nudges for more sustainable food choices in the out-of-home catering sector applied in real-world labs. Resources, Conservation and Recycling, 180, 106167. https://doi.org/10.1016/j.resconrec.2022.106167
- Loewenstein, G., Bryce, C., Hagmann, D., & Rajpal, S. (2015). Warning: You are about to be nudged. Behavioral Science & Policy, 1, 35–42.
- Matuschek, H., Kliegl, R., Vasishth, S., Baayen, H., & Bates, D. (2017). Balancing Type I error and power in linear mixed models. Journal of Memory and Language, 94, 305–315. https://doi.org/10.1016/j.jml.2017.01.001
- Maynard, N. (2021, March 29). How to help shoppers navigate healthier food choices online. https://www.igd.com/articles/article-viewer/t/how-to-help-shoppers-navi…
- McKevitt, F. (2022, March 29). Inflation starting to drive grocery behaviour as pandemic loosens hold on Brits. https://www.kantar.com/inspiration/inflation/2022-wp-inflation-starting…
- Michaelsen, P., Nyström, L., Luke, T. J., & Hedesström, M. (2021). Downstream consequences of disclosing defaults: Influences on perceptions of choice architects and subsequent behavior. Comprehensive Results in Social Psychology, 0(0), 1–24. https://doi.org/10.1080/23743603.2021.1983720
- Michie, S., van Stralen, M. M., & West, R. (2011). The behaviour change wheel: A new method for characterising and designing behaviour change interventions. Implementation Science, 6(1), 42. https://doi.org/10.1186/1748-5908-6-42
- Mueller, M., Shonkoff, E., Folta, S., Anzman-Frasca, S., & Economos, C. (2020). Orders of Healthier Adult Menu Items in a Full-Service Restaurant Chain with a Healthier Children’s Menu. Nutrients, 12. https://doi.org/10.3390/nu12113253
- Nakagawa, S., Johnson, P. C. D., & Schielzeth, H. (2017). The coefficient of determination R2 and intra-class correlation coefficient from generalized linear mixed-effects models revisited and expanded. Journal of The Royal Society Interface, 14(134), 20170213. https://doi.org/10.1098/rsif.2017.0213
- Noggle, R. (2018). Manipulation, salience, and nudges. Bioethics, 32(3), 164–170. https://doi.org/10.1111/bioe.12421
- Oliver, A. (2013). From Nudging to Budging: Using Behavioural Economics to Inform Public Sector Policy. Journal of Social Policy, 42(4), 685–700. https://doi.org/10.1017/S0047279413000299
- Osman, M., & Jenkins, S. (2021). Consumer responses to food labelling [Rapid evidence review]. The Food Standards Agency.
- Paunov, Y., Wänke, M., & Vogel, T. (2020). Combining defaults and transparency information to increase policy compliance. Social Psychology, 51(5), 354–359. https://doi.org/10.1027/1864-9335/a000419
- Poore J. & Nemecek T. (2018). Reducing food’s environmental impacts through producers and consumers. Science, 360(6392), 987–992. https://doi.org/10.1126/science.aaq0216
- R Core Team. (2021). R: A language and environment for statistical computing. R Foundation for Statistical Computing, Vienna, Austria. https://www.R-project.org/
- Riet, J. van’t, Sijtsema, S. J., Dagevos, H., & De Bruijn, G.-J. (2011). The importance of habits in eating behaviour. An overview and recommendations for future research. Appetite, 57(3), 585–596. https://doi.org/10.1016/j.appet.2011.07.010
- RStudio Team. (2021). RStudio: Integrated Development Environment for R. RStudio, PBC, Boston, MA. http://www.rstudio.com/
- Schmidtke, K. A., Watson, D. G., Roberts, P., & Vlaev, I. (2019). Menu positions influence soft drink selection at touchscreen kiosks. Psychology & Marketing, 36(10), 964–970. https://doi.org/10.1002/mar.21248
- Shakeri, G., & McCallum, C. H. (2021). Envirofy your Shop: Development of a Real-time Tool to Support Eco-friendly Food Purchases Online. Extended Abstracts of the 2021 CHI Conference on Human Factors in Computing Systems, 1–10. https://doi.org/10.1145/3411763.3451713
- Skinner, G. (2019). Climate change and the weather. Ipsos MORI. https://www.ipsos.com/en-uk/concern-about-climate-change-reaches-record…
- Steffel, M., Williams, E. F., & Pogacar, R. (2016). Ethically Deployed Defaults: Transparency and Consumer Protection through Disclosure and Preference Articulation. Journal of Marketing Research, 53(5), 865–880. https://doi.org/10.1509/jmr.14.0421
- Stuber, J. M., Lakerveld, J., Kievitsbosch, L. W., Mackenbach, J. D., & Beulens, J. W. J. (2022). Nudging customers towards healthier food and beverage purchases in a real-life online supermarket: A multi-arm randomized controlled trial. BMC Medicine, 20, 10. https://doi.org/10.1186/s12916-021-02205-z
- Thaler, R. H., & Sunstein, C. R. (2009). Nudge: Improving decisions about health, wealth, and happiness (Rev. and expanded ed). Penguin Books.
- The Institute of Grocery Distribution. (2021, July 1). UK retail food and grocery market growth to slow sharply in the short term, according to latest IGD market forecasts. https://www.igd.com/articles/article-viewer/t/uk-retail-food-and-grocer…
- Wachner, J., Adriaanse, M., & De Ridder, D. (2020). The influence of nudge transparency on the experience of autonomy. Comprehensive Results in Social Psychology, 0(0), 1–15. https://doi.org/10.1080/23743603.2020.1808782
- Wisdom, J., Downs, J. S., & Loewenstein, G. (2010). Promoting Healthy Choices: Information versus Convenience. American Economic Journal: Applied Economics, 2(2), 164–178. https://doi.org/10.1257/app.2.2.164
- Zhuo, S., Ratajczak, M., Gold, N., & Thornton, K. (2022, March 7). Does whether an ordering intervention is overt or covert affect sustainable consumption choices in online supermarkets: a randomised controlled trial. Retrieved from osf.io/ehd2j
MANIPULATIONAWARE
ASK ALL
SINGLE CODE
In the task you just completed, how were the products on each screen ordered?
1 By Popularity
2 By Price
3 By Sustainability
4 By Healthiness
5 Randomly
6 Don’t know
[scripter instructions: first five answers shown in random order]
ENVIROCONCERN (footnote 1)
ASKALL
SINGLE CODE
How concerned, if at all, are you about climate change, sometimes referred to as global warming?
1. Not at all concerned
2. Moderately unconcerned
3. Slightly unconcerned
4. Neither concerned nor unconcerned
5. Slightly concerned
6. Moderately concerned
7. Extremely concerned
[scripter instructions: none]
NUDGEATTITUDE (footnote 2)
ASKALL
SINGLE CODE
To what extent do you agree or disagree with the following statement:
Advice and recommendations usually induce me to do just the opposite.
1 Strongly disagree
2 Moderately disagree
3 Slightly disagree
4 Neither agree nor disagree
5 Slightly agree
6 Moderately agree
7 Strongly agree
[scripter instructions: none]
SUSTAINABLENORM
ASKALL
SINGLE CODE
How important is it to you to buy food that has a low environmental impact?
1 Not at all important
2 Moderately unimportant
3 Slightly unimportant
4 Neither important nor unimportant
5 Slightly important
6 Moderately important
7 Extremely important
[scripter instructions: none]
DMDIET
ASKALL
SINGLE CODE
Do you eat meat?
1 Yes
2 No
[scripter instructions: none]
DMGENDER
ASKALL
SINGLE CODE
What gender do you identify with?
1 Male
2 Female
3 I identify in a different way
-1 Prefer not to disclose
[scripter instructions: none]
DMAGE
ASK ALL
LIST (1900-2003)
In which year were you born?
[scripter instructions: none]
DMEDUCATION
ASKALL
SINGLE CODE
Which of these best describes the highest level of educational qualifications you have?
1. No qualifications
2. GCSEs or equivalent
3. A level or equivalent
4. Certificate of higher education or equivalent
5. Diploma of higher education or equivalent
6. Bachelor degree, graduate certificate or equivalent
7. Master’s degree, postgraduate certificate or equivalent
8. Doctorate or equivalent
[scripter instructions: none]
DMINCOME
ASKALL
SINGLE CODE
What is your household’s total income from all sources?
1 £0-10,000
2 £10,001-20,000
3 £20,001-30,000
4 £30,001-40,000
5 £40,001-50,000
6 £50,001-60,000
1 £60,001-70,000
2 £70,001-80,000
9 £80,001-90,000
10 £90,001-100,000
11 Above £100,000
[scripter instructions: none]
Snack
| Product | Price | CO2 |
|---|---|---|
| Jacobs Twiglets 150g | £ 2.00 | 0.14 |
| Sensations Thai Sweet Chilli 150g | £1.99 | 0.17 |
| Doritos Tangy Cheese Tortilla Chips 180g | £1.99 | 0.19 |
| Walkers Wotsits Giants Flamin' Hot Snacks 130g | £1.99 | 0.20 |
| Kettle Chips Sour Cream & Sweet Onion 150g | £1.99 | 0.24 |
| Jacob's Mini Cheddars Sticks Cheddar 150g | £1.99 | 0.40 |
Soup
| Product | Price | CO2 |
|---|---|---|
| Souplogie Garden Pea With Spinach 600g | £ 2.65 | -0.03 kg |
| New Covent Garden Soup Co Vegetable Soup 560g | £ 1.65 | 0.03 kg |
| Yorkshire Provender Roast Chicken & Vegetable Soup 600g | £ 2.75 | 0.06 kg |
| New Covent Garden Soup Co Mushroom Soup 560g | £ 1.65 | 0.15 kg |
| Yorkshire Provender Cauliflower Soup 600g | £ 2.75 | 0.29 kg |
| Cully&Sully Smoked Haddock & Salmon Chowder | £ 1.75 | 0.47 kg |
Pizza
| Product | Price | CO2 |
|---|---|---|
| Dr. Oetker Ristorante Pizza Funghi 365g | £2.50 | 0.15 |
| Chicago Town Tiger Crust Cheese Medley Pizza 305g | £2.75 | 0.17 |
| Dr. Oetker Ristorante Pizza Hawaii 355g | £2.50 | 0.23 |
| Dr. Oetker Ristorante Pizza Pepperoni Salame 320g | £2.50 | 0.37 |
| Goodfella's Stonebaked Thin Chicken 365g | £ 2.20 | 0.59 |
| Goodfella's Stonebaked Thin Cheese & Ham Pizza 351g | £ 2.20 | 0.67 |
Dessert
| Product | Price | CO2 |
|---|---|---|
| Gu Sticky Hot Toffee Puddings 2X85g | £ 3.30 | 0.11 |
| Nestle Rolo Dessert 2X70g | £ 1.50 | 0.12 |
| Cadbury Hot Chocolate Puddings 2X110g | £ 2.00 | 0.34 |
| Gu Lemon Cheesecake 2X90g | £ 3.30 | 0.50 |
| Bonne Maman Strawberry Mouse 2X70g | £ 1.70 | 0.94 |
| Rachel's Organic Divine Rice Twin Traditional 2X150g | £ 1.60 | 1.27 |
Ice-cream
| Product | Price | CO2 |
|---|---|---|
| Haagen-Dazs Vanilla Ice Cream 460ml | £4.50 | 0.12 |
| Cadbury Flake Ice Cream 480ml | £3.00 | 0.23 |
| Halo Top Chocolate Chip Cookie Dough Ice Cream 473ml | £5.25 | 0.28 |
| Magnum Double Salt Caramel Ice Cream Tub 440ml | £3.85 | 0.53 |
| Ben & Jerry's Cookie Dough Vanilla Ice Cream 465ml | £4.50 | 0.65 |
| Ben & Jerry's Minter Wonderland Mint Ice Cream 465ml | £4.50 | 0.70 |
Tea
| Product | Price | CO2 |
|---|---|---|
| Pukka Organic 3 Mint Tea 20's 32g | £ 2.80 | 0.00 |
| Twinings Camomile and Honey 20's 30g | £ 1.70 | 0.01 |
| Twinings Lemon and Ginger 20 Teabags 30g | £ 1.70 | 0.05 |
| Pukka Joy Organic Herbal Tea 20 Bags 34g | £ 2.80 | 0.07 |
| Twinings Jasmine Green Tea 20's 50g | £ 2.00 | 0.12 |
| Pukka Supreme Matcha 20 Teabags 30g | £ 2.80 | 0.65 |
The main model for testing the two hypotheses was a generalised linear mixed model with logistic link function given a binary primary outcome. A basic model specification is:
where:

is binary variable indicating whether a more sustainable product was chosen for participant i in product category j. The binary variable equals 1 if the rank of chosen product is 1, 2 or 3, and equals 0 if the rank of the chosen product is 4, 5 or 6.

is a binary variable indicating whether participant i was randomly allocated to the covert ordering arm.
equals 1 if participant i was randomly allocated to the covert ordering arm, and equals 0 if participant i was randomly allocated to the control (random ordering) arm or the overt ordering a
Similarly,

is a binary variable indicating whether participant i was randomly allocated to the overt ordering arm.
equals 1 if participant i was randomly allocated to the overt ordering arm, and equals 0 if participant i was randomly allocated to the control (random ordering) arm or the covert ordering arm.

and

represent the corresponding fixed effects of being in the covert ordering arm and the overt ordering arm on the primary outcome variable.

is the random effect of participant

where N is the number of participants.

is the random effect of product category

With the model specification, our hypotheses can be written as:
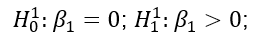
In addition to the basic specification above, there was a set of potential covariates that could be added as fixed effects to the model including average price difference between the three more sustainable products and three less sustainable products in a category, whether a participant eats meat, participants’ environmental concern, attitudes towards nudges, participants’ age, gender, education level, income group, and the order in which a product category appears in the six-page sequence (footnote 1). We examined the correlations between four continuous potential covariates: participants’ environmental concern, attitudes towards nudges, participants’ age, and household income. No strong correlations were found between these variables (highest pairwise correlation coefficients -0.17).
Then we ran a model with the basic specification (see Appendix Table 6) and all potential covariates, after which we computed the variance inflation factors (VIF) for all the covariates, and no covariate had a VIF statistic value larger than 4, indicating no multicollinearity issues (Kabacoff, 2011). However, the initial model was estimate with a warning message and a suggestion to rescale variables. Consequently, we mean centred and standardized all continuous covariates in subsequent models that we estimated. Estimation of the same model, with the basic specification outlined above, with rescaled covariates did not produce warnings. Then we ran backward selection for the remaining covariates using Likelihood Ratio Tests (LRTs) with α = 0.05, starting by removing covariates with the highest p-values. This process gave us the final set of covariates to include in any analysis with the primary outcome as the dependent variable. Participants’ attitudes towards nudges, environmental concern, serial position of product page, average price difference between more/less sustainable products, and participants’ gender were dropped. Whether a participant ate meat, had at least a bachelor’s degree, participants’ age and total household income were included as covariates in the optimal model. The LRT statistic was not significant between the model with all covariates and the optimal model with the reduced set of covariates.
A random individual effect (intercept) and a random product category effect (intercept) were assumed, and theoretically warranted, in the basic model specification. However, it was not clear whether the inclusion of additional random effects was justified by the data. Therefore, LRTs were conducted to compare the goodness-of-fit of models with different random effects structure (Bates et al., 2018; Matuschek et al., 2017). Following Bates et al. (2018), we started with the maximal model which included random intercepts and random slopes (random differences in the effects of two treatment arm variables) for participants and product categories and did not impose restrictions on the variance covariance components. We stopped at the additive model with random effects of participants and random effects of product categories (as in the basic model specification above). A simpler model was selected if the more complex model did not lead to significant improvement of goodness-of-fit (with p < 0.05 as the threshold) or led to non-convergence. As a sensitivity analysis, the model selection procedure was run with an alternative cutoff of p < 0.20 (Matuschek et al., 2017). The LRT test statistic indicated that the basic specification with the random intercepts of participants and random intercepts of product categories was preferred, regardless of whether a threshold of 0.05 or 0.20 for the LRT was used.
As a sensitivity analysis, we estimated the primary effects of interest using secondary outcomes, which were alternative forms of the primary outcome variable. The first alternative was a binary variable which equals 1 if the rank of the chosen product is 1 and equals 0 if the rank of the chosen product is not 1. This binary variable indicates whether the most sustainable product is chosen or not at the product category level. This allowed us to examine the results regarding a different choice of cut-off points. A logistic model was used as the dependent variable is still binary. We went through a similar procedure to select the set of covariates and random effects as that for the primary outcome. The covariate selection process resulted in the removal of gender, attitudes towards nudges, household income, price difference between most sustainable products and the rest (not when threshold was 0.2), and serial position of product page (not when threshold was 0.2), sequentially. The preferred random effect structure was the one with random intercepts for participants and product categories. Appendix Table 7 shows the results of our optimal model. Critically, the coefficient for neither covert ordering arm nor overt ordering arm was significant. Note that the coefficients for covariates did differ, in terms of the magnitude of the effect, compared to those of the optimal model using the primary outcome. Appendix Table 7 shows that participants who were older, with higher education degree, and stronger environmental concern, were more likely to choose the most sustainable product. Furthermore, as in the optimal model for the primary outcome, participants who do not eat meat were more likely to choose the most sustainable product using the first secondary outcome.
A second alternative consisted of using an ordinal outcome variable that indicates the rank of sustainability of the product chosen in each category (from 1 to 6 with 1 being the most sustainable and 6 being the least sustainable). An ordinal regression model was used as the outcome variable is ordinal, using the clmm2 function in R. The command only allowed one random effect, and the LRTs showed that the model with product categories random intercept was preferred to an alternative model with participant random intercept. LRTs also indicated that ordinal models that relaxed the proportional odds assumptions for both treatment variables were preferred. The backward covariate selection process resulted in the removal of education, attitudes towards nudges, average price difference between more/less sustainable products, serial position of product page, household income (not when threshold was 0.2) and gender, sequentially. Appendix Table 8 shows the results of the optimal model for this secondary outcome. Note that most coefficients for covert and overt ordering arms were not significant, with the exception of the probability of choosing the lowest ranked product. The coefficients for the selected covariates show that not eating meat, having higher environmental concern, and being younger were associated with choosing a product with a higher sustainability rank.
As an extra sensitivity analysis, we also estimated the main model with primary outcome without any covariates. We went through the same model selection process for random effect structure but without any covariates included. This analysis led to the same conclusions regarding the effects of the interventions (with the random intercepts model being selected as in the optimal model, as well).
We also ran the following additional analyses:
First, we explored if the effects of covert and overt sustainability ordering on sustainable consumption differed for different age/gender/socioeconomic groups. Participants’ age, gender, higher education status, and their income group were added to the main specification (with the same random effect structure and other covariates as used in the primary analysis) and interacted with the two treatment arm variables respectively. The estimated coefficients for the interaction terms indicated whether the effects differed between age/gender/socioeconomic groups (proxied by education and income group).
Second, we explored whether participants’ environmental concern and reactance to nudges moderated the effect of an overt sustainability ordering on the probability of choosing a more sustainable product. To explore these possible moderation effects, a measure of environmental concern/reactance to nudges, based on answers to corresponding questions in the questionnaire, was added to the main specification (with the selected random effect structure and covariates) and interacted with the treatment variable for overt ordering arm to estimate the effect of overt ordering for participants with different level of environmental concern/reactance to nudges.
We also explored whether participants engaged in any compensatory behaviour by looking at the order effect of the sequence of product categories. During the experiment, product categories were shown to participants in a randomized sequence and the realized sequence was recorded for each participant. Research has shown that when individuals are nudged to choose healthier food, they might engage in compensatory behaviour by consuming more unhealthier food in the categories that are not targeted (Wisdom et al., 2010). It is possible that while more sustainable products were selected at the beginning of the experiment, less sustainable products were consumed more towards the end of the experiment, especially for participants in the overt arm where they were made aware about the purpose of the intervention. To explore this, the number of the product page in the six-page sequence was added to the main specification as a continuous variable to interact with the two treatment arm variables. Negative interaction effect with the treatment variable for overt ordering arm was expected.
Finally, to further explore the mechanisms, we looked at outcomes from survey responses that measured participants’ normative attitudes towards buying sustainably. The overt statement and ordering intervention might convey the message to consumers that they should choose sustainable products, which would support and probably increase the effect of the ordering intervention. Therefore, analysis was conducted to explore whether an overt ordering intervention had a positive effect on this outcome. An ordinal regression was run with the survey response of normative attitudes towards buying sustainably being the outcome variable and a binary variable indicating whether a participant was in the overt treatment arm (1, yes; 0, no) being the predictor.
No significant results were found for these additional analyses.
-
The order in which a product category appears in the six-page sequence was treated as a continuous variable, but we checked whether inference varies when this variable was treated as categorical; whether a participant eats meat and gender were binary variables; education was transformed into a dichotomised variable based on whether a participant has at least bachelor’s degree or not; all the other potential covariates were treated as continuous variables.
Table 4. Baseline demographic characteristics
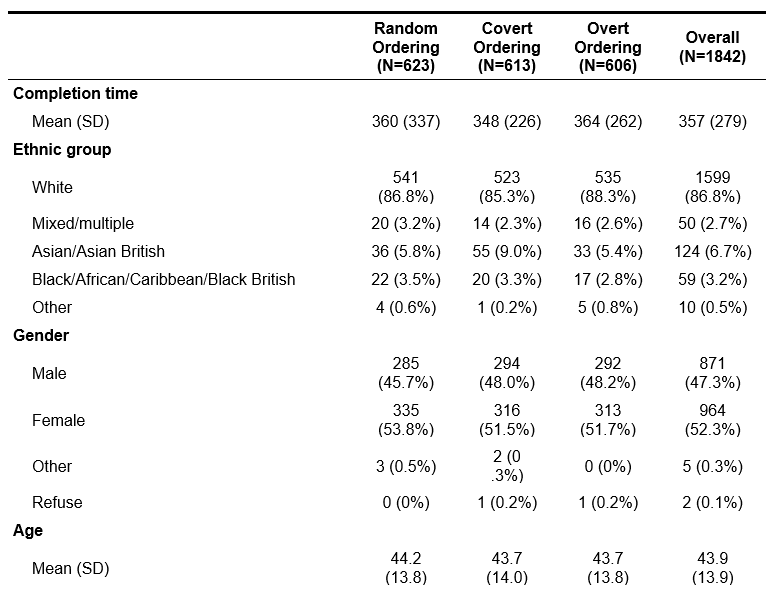
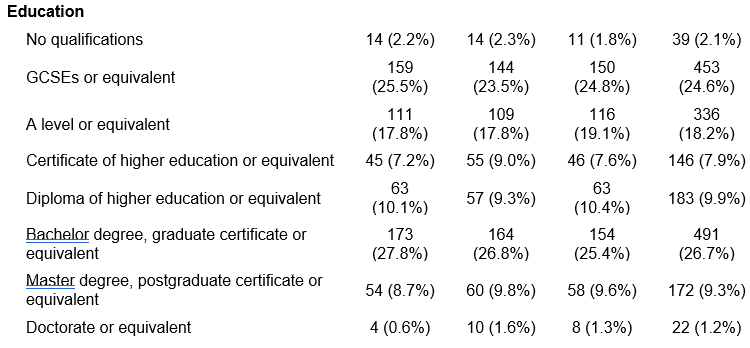
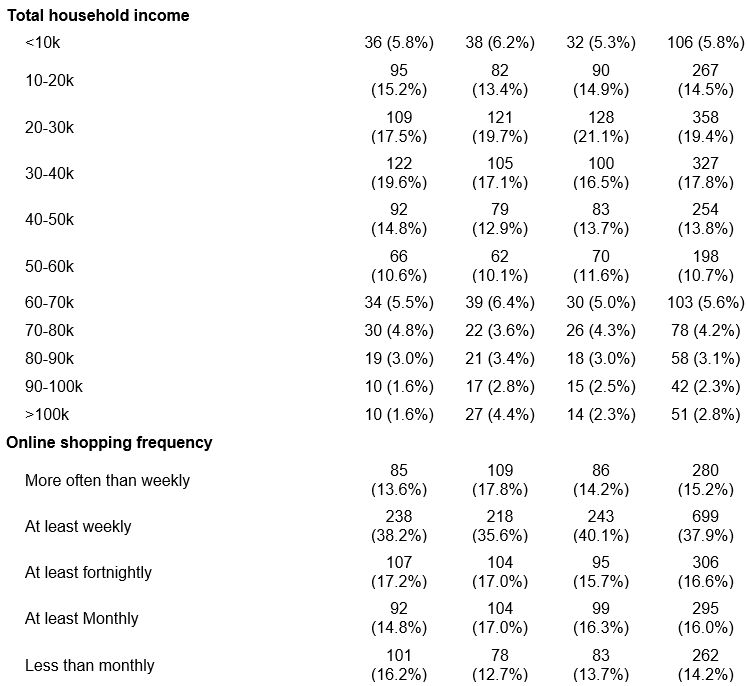
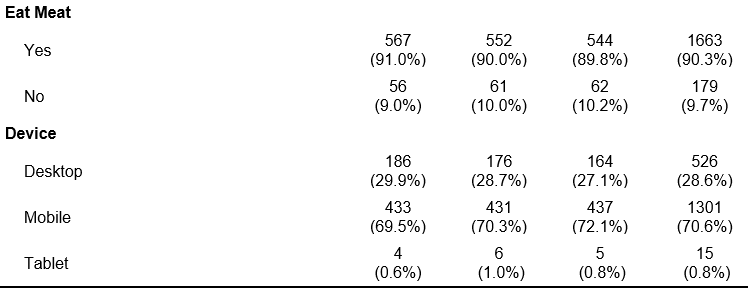
Table 5. Summary of secondary outcomes
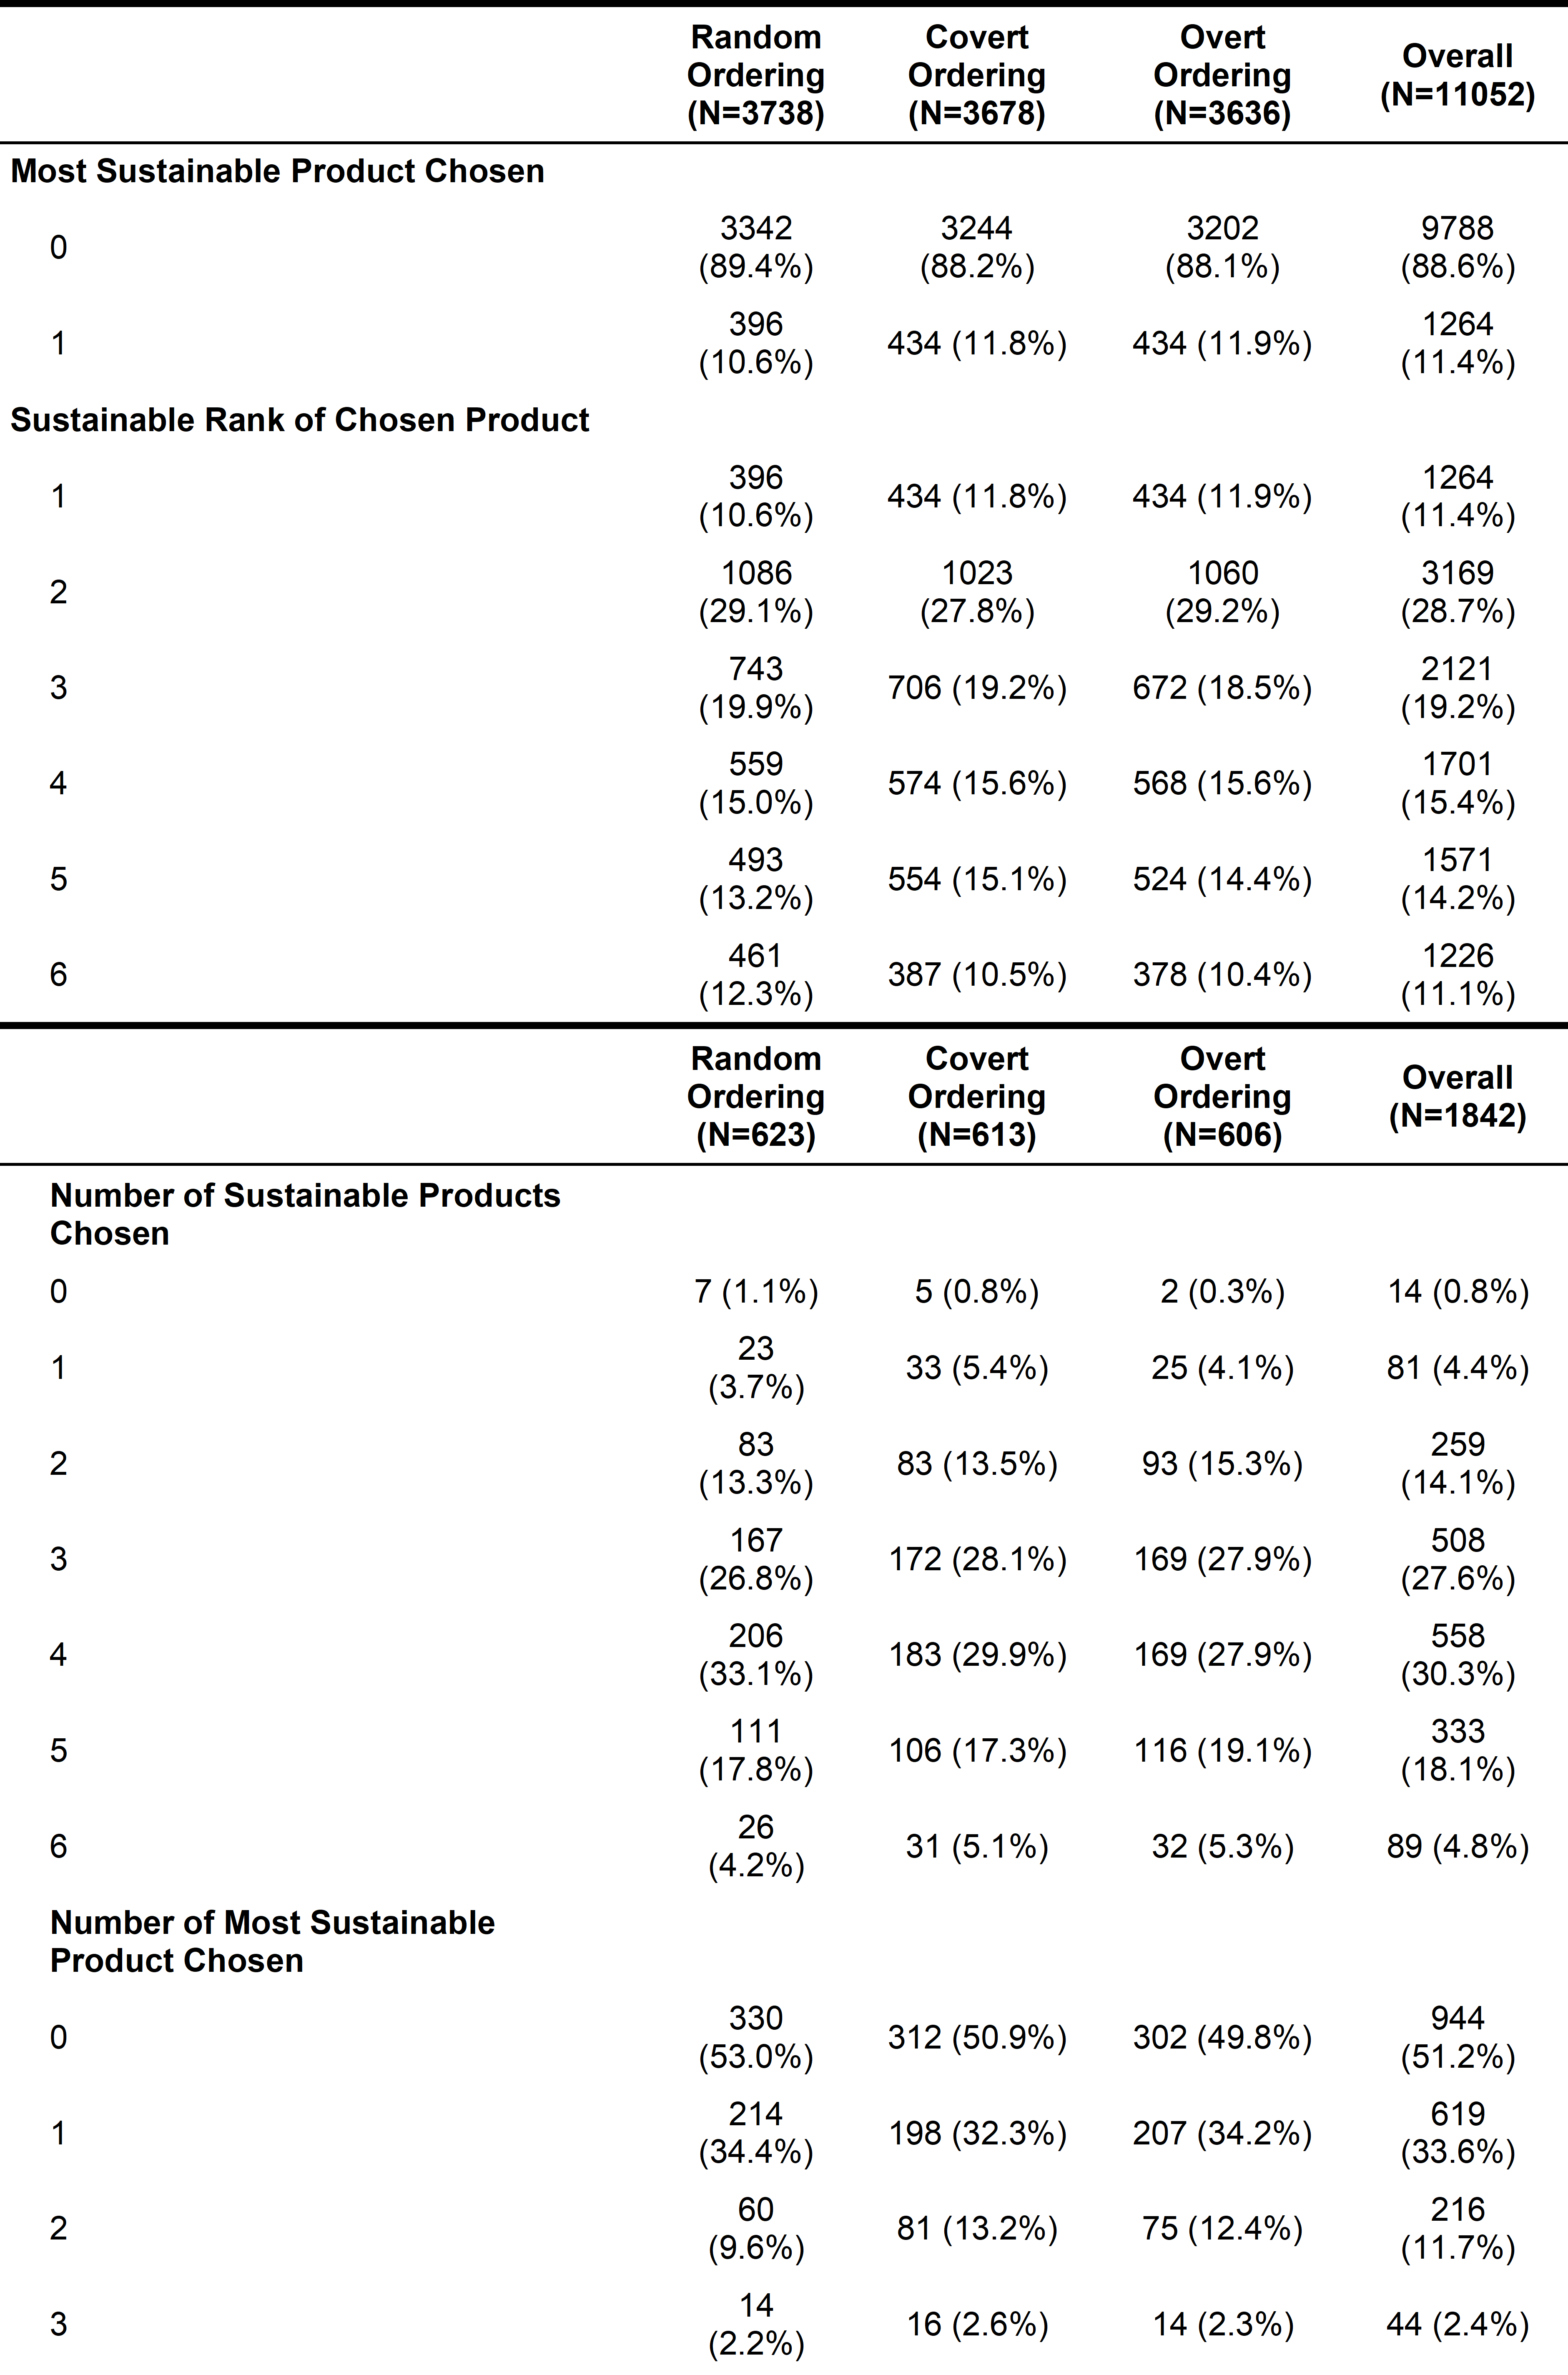
Table 6. Basic model with all potential covariates

Table 7. Optimal model for first secondary outcome

* Overt ordering and covert ordering are indicator variables of the experimental conditions, with the control random ordering as the reference level; the coefficients for Overt/Covert ordering show the difference between these conditions and Control random ordering.
Table 8. Optimal model for second secondary outcome

* The coefficients of intercepts show the differences in baseline odds ratios of choosing a product that has a sustainability rank of 2 versus 1, 3 versus 2, 4 versus 3, 5 versus 4, and 6 versus 5. Overt ordering and covert ordering are indicator variables of the experimental conditions, with the control random ordering as the reference level; the coefficients for Overt/Covert ordering show the difference between these conditions and Control random ordering.
Table 9. Multiple comparison of position effects with Tukey’s correction

| Comparison of Position Effects (footnote 1) | Estimate of Differences in Log Odds Ratios | Std. Error | z-value | p |
|---|---|---|---|---|
| 2 - 1 == 0 | 0.170 | 0.061 | 2.784 | 0.0599 |
| 3 - 1 == 0 | 0.001 | 0.063 | 0.018 | 1 |
| 4 - 1 == 0 | -0.084 | 0.064 | -1.318 | 0.7752 |
| 5 - 1 == 0 | 0.011 | 0.063 | 0.177 | 1 |
| 6 - 1 == 0 | 0.013 | 0.063 | 0.206 | 0.9999 |
| 3 - 2 == 0 | -0.169 | 0.061 | -2.765 | 0.0631 |
| 4 - 2 == 0 | -0.254 | 0.062 | -4.093 | <0.001 *** |
| 5 - 2 == 0 | -0.159 | 0.061 | -2.605 | 0.0959 |
| 6 - 2 == 0 | -0.157 | 0.061 | -2.576 | 0.103 |
| 4 - 3 == 0 | -0.085 | 0.064 | -1.334 | 0.7657 |
| 5 - 3 == 0 | 0.010 | 0.063 | 0.160 | 1 |
| 6 - 3 == 0 | 0.012 | 0.063 | 0.188 | 1 |
| 5 - 4 == 0 | 0.095 | 0.064 | 1.494 | 0.6684 |
| 6 - 4 == 0 | 0.097 | 0.063 | 1.522 | 0.6497 |
| 6 - 5 == 0 | 0.002 | 0.062 | 0.029 | 1 |
*Each row tests a null hypothesis that the probability of being chosen does not differ for the two positions, e.g. 2 - 1 == 0 tests the hypothesis that Position 2 does not differ from Position 1
Table 10. Responses to attitudinal questions in questionnaire
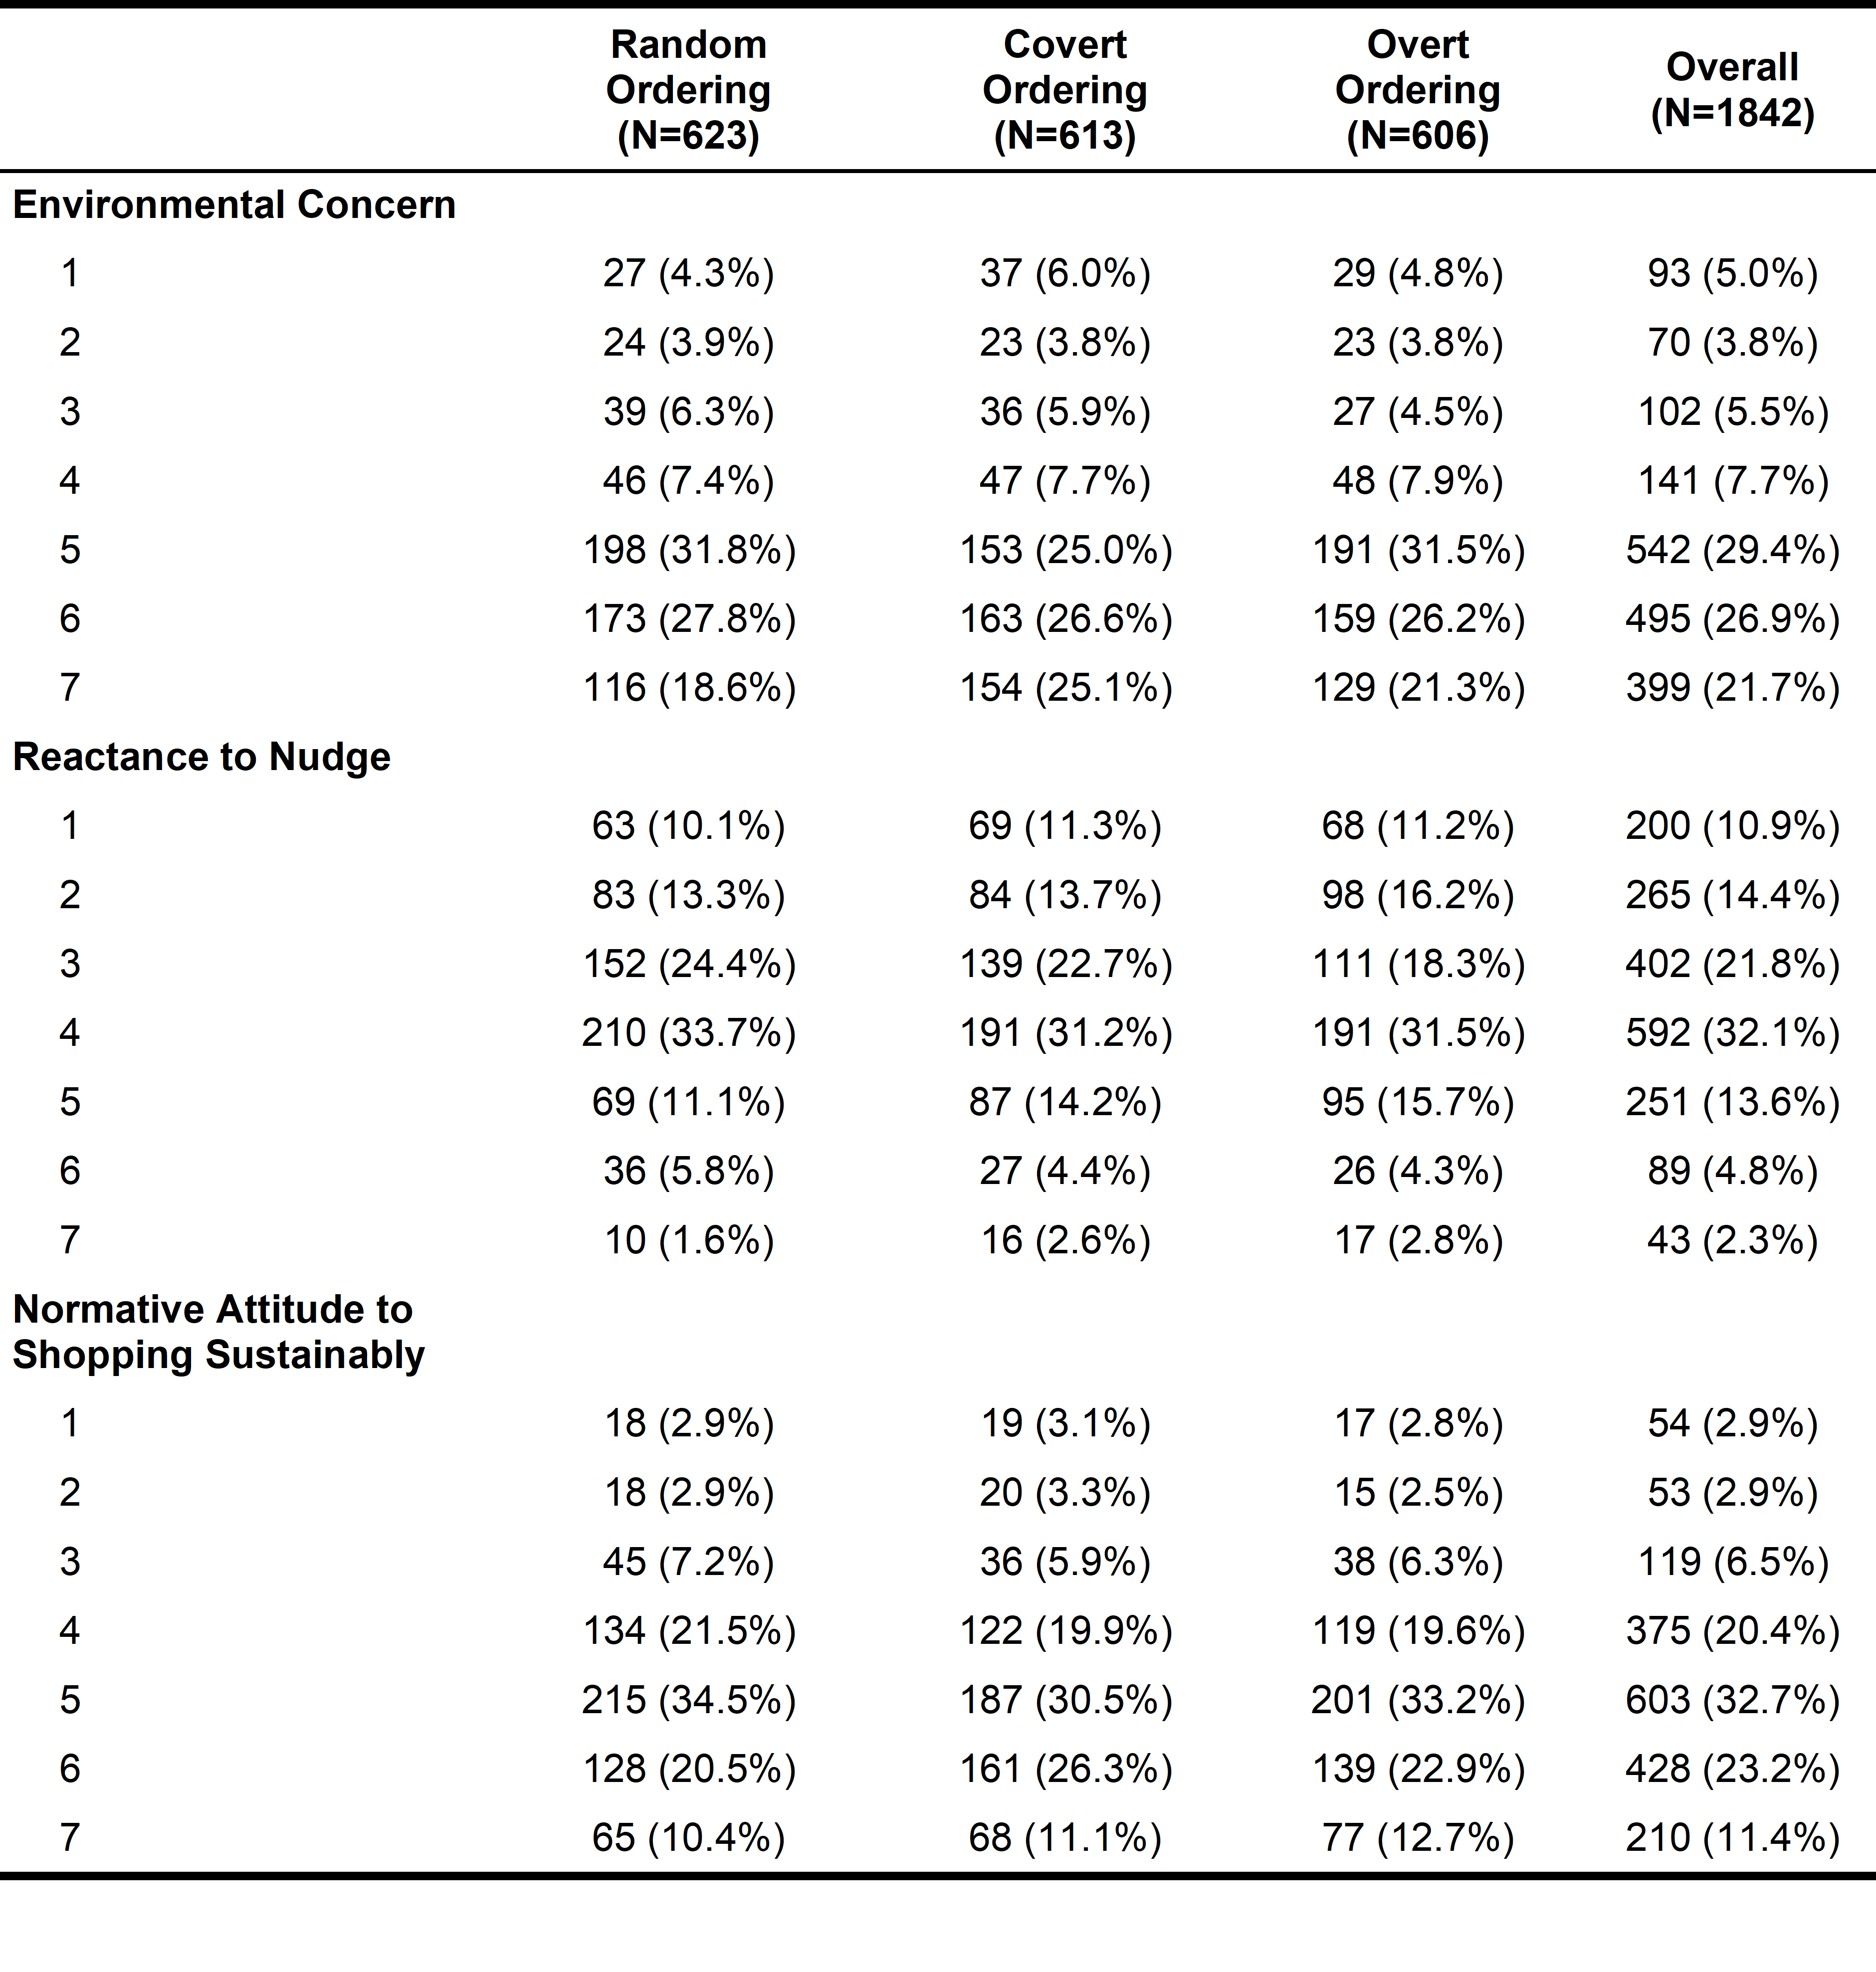
Table 11. Percentage of participants choosing each answer to the question about the product ordering in the overt arm, split by device

| Products ordered by/ Device | Desktop | Mobile | Tablet |
|---|---|---|---|
| Popularity | 22.6% | 20.4% | 20.0% |
| Price | 17.1% | 18.5% | 20.0% |
| Sustainability | 34.2% | 14.2% | 0.0% |
| Healthiness | 3.1% | 7.8% | 0.0% |
| Randomly | 15.9% | 30.2% | 60.0% |
| Don't know | 7.3% | 8.9% | 0.0% |