Research project
Food and You 2: Wave 9 Key Findings
Food and You 2 is a biannual official statistic survey commissioned by the Food Standards Agency. The survey measures consumers’ self-reported knowledge, attitudes and behaviours related to food safety and other food topics amongst adults in England, Wales, and Northern Ireland. Fieldwork for Food and You 2: Wave 9 was conducted between 24 April 2024 and 1 July 2024 . A total of 5,526 adults (aged 16 years or over) from 3,908 households across England, Wales, and Northern Ireland completed the survey.
Food and You 2 is a biannual ‘official statistic’ survey commissioned by the Food Standards Agency (FSA). The survey measures consumers’ self-reported knowledge, attitudes and behaviours related to food safety and other food issues amongst adults in England, Wales, and Northern Ireland.
Fieldwork for Food and You 2: Wave 9 was conducted between 24th April 2024 to 1st July 2024. A total of 5,526 adults (aged 16 years or over) from 3,908 households across England, Wales, and Northern Ireland completed the ‘push-to-web’ survey (see Annex A for more information about the methodology).
The modules presented in this report include ‘Food you can trust’, ‘Concerns about food’, ‘Food security’, ‘Food shopping and labelling’, ‘Online platforms’ and ‘Genetic technologies (footnote 1).
Food you can trust
Confidence in food safety and authenticity
- 89% of respondents reported that they were confident that the food they buy is
- safe to eat
- 81% of respondents were confident that the information on food labels is
- accurate
Confidence in the food supply chain
- 69% of respondents reported that they had confidence in the food supply chain
Awareness, trust and confidence in the FSA
- 91% of respondents had heard of the FSA
- 69% of respondents who had at least some knowledge of the FSA reported that they trusted the FSA to make sure ‘food is safe and what it says it is’
- 78% of respondents reported that they were confident that the FSA (or the government agency responsible for food safety) can be relied upon to protect the public from food-related risks; 76% were confident that the FSA takes appropriate action if a food-related risk is identified, and 70% were confident that the FSA is committed to communicating openly with the public about food related risks
Concerns about food
- 79% of respondents had no concerns about the food they eat, and 21% of respondents reported that they had a concern.
- respondents who reported having a concern about food were asked to briefly explain what they were concerned about. The most common concerns related to food production methods (35%), nutrition and health (26%), food safety and hygiene (23%) and the quality of food (22%)
- respondents were asked to indicate if they had concerns about several food related issues, from a list of options. The most common concerns were food prices (69%), the quality of food (57%), the amount of sugar in food (57%), and the amount of food packaging (55%)
Food security
- across England, Wales, and Northern Ireland, 79% of respondents were classified as food secure (65% high, 14% marginal) and 21% of respondents were classified as food insecure (10% low, 11% very low)
- 75% of respondents reported that they had made a change to their eating habits for financial reasons in the previous 12 months. The most common changes were eating out less (43%), eating at home more (42%), eating fewer takeaways (38%) and buying items on special offer more (39%)
- 4% of respondents reported that they had used a food bank or other emergency food provider in the last 12 months, and 94% of respondents reported that they had not
- 5% of respondents reported that they had used a social supermarket in the last 12 months and 79% of respondents reported that they had not
Food shopping and labelling
- 69% of respondents reported that they bought food from a large supermarket and 49% bought food from a mini supermarket about once a week or more often
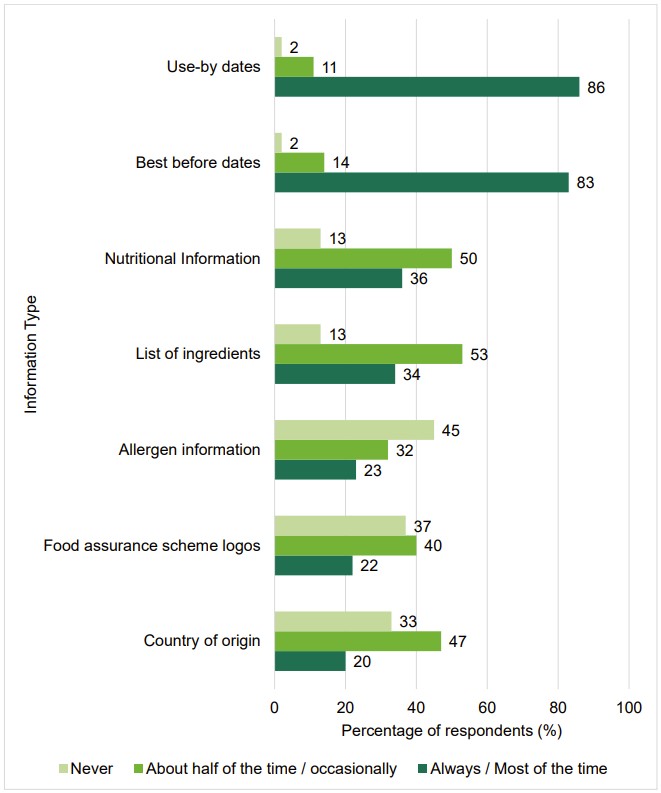
- most respondents reported that they ‘always’ or ‘most of the time’ check the use-by date (86%) or best before date (83%) when they bought food. Respondents reported that they check the list of ingredients (53%), nutritional information (50%), country of origin (47%) and food assurance scheme logos (40%) about half the time or occasionally
- 84% of respondents who consider the dietary requirements (allergy/intolerance) for themselves or someone else in the household when shopping for food, were confident that the information provided on food labelling allows them to identify foods that will cause a bad or unpleasant physical reaction
Online platforms
- 60% of respondents reported that they had ordered food or drink from websites of a restaurant, takeaway or café and 55% had ordered from an online ordering and delivery company (for example, Just Eat, Deliveroo, Uber Eats)
- 27% of respondents had ordered food and drink via an online marketplace (for example Amazon, Gumtree, Etsy). The platforms used least by respondents were food sharing apps (for example Olio, Too Good To Go) (17%) and social media platforms (for example, Facebook, Instagram, Nextdoor) (7%)
- 47% of respondents looked for the Food Hygiene Rating Scheme (FHRS) ratings, ‘always’ or ‘most of the time’, when ordering food and drink online
- when ordering food and drink online, 20% of respondents who have a food hypersensitivity always looked for information that would allow them to identify food that might cause them a bad or unpleasant reaction, and 40% of respondents looked for this information less often
Eating at home
Cleaning
- 70% of respondents reported that they always wash their hands before preparing or cooking food
- 92% of respondents reported that they always wash their hands immediately after handling raw meat, poultry, or fish
Chilling
- 59% of respondents who have a fridge correctly reported that their fridge temperature should be between 0-5 degrees Celsius
- of the respondents who monitor the temperature of their fridge, 48% reported that they check the temperature of their fridge at least once a week or more often
- 43% of respondents reported that they defrost meat or fish in the fridge and 42% reported that they leave the meat or fish at room temperature
Cooking
- 80% of respondents reported that they always cook food until it is steaming hot and cooked all the way through, and 20% reported that they do not always do this
- around two-thirds of respondents reported that they never eat duck (68%) or beef burgers (66%) when it is pink or has pink juices; but around a third reported that they do eat these at least occasionally
- 35% of respondents reported that they always follow packaging instructions when preparing frozen fruit and vegetables, whilst 15% reported never doing this
Avoiding cross-contamination
- 40% of respondents reported that they wash raw fish or seafood and 38% report washing raw chicken
Use-by dates
- around seven in ten respondents (67%) of respondents identified the use-by date as the information which shows that food is no longer safe to eat
- around six in ten respondents (62%) reported that they always check use-by dates before they cook or prepare food
Genetic technologies
- respondents reported greater awareness and knowledge of genetically modified (GM) food than gene-edited or genome-edited food (GE) and least knowledge of precision bred food. For example, 63% of respondents had never heard of precision bred food whereas 38% of respondents had never heard of GE food. 8% of respondents had never heard of GM food
First and foremost, our thanks go to all the respondents who gave up their time to take part in the survey.
We would like to thank the team at Ipsos who made a significant contribution to the project, particularly Kavita Deepchand, Kathryn Gallop, Stephen Finlay, Hannah Harding, Dr Patten Smith, Kelly Ward, Claire Bhaumik, Dr Ammeline Wang and Aamina Oughradar.
We would like to thank the FSA working group, Welsh Language Unit, and our FSA colleagues – Joanna Disson and Clifton Gay.
Finally, thank you to our external reviewer Professor George Gaskell.
Authors: Helen Heard, Alexandra Moore, Lucy Murray, Rachael Shillitoe, Robin Clifford, Matt Jenkins, Dr Daniel Mensah.
The Food Standards Agency: role, remit, and responsibilities
The Food Standards Agency (FSA) is a non-ministerial government department working
to protect public health and consumers’ wider interests in relation to food in England,
Wales, and Northern Ireland.
The FSA’s overarching mission is ‘food you can trust’. The FSA’s vision as set out in the 2022-2027 strategy is a food system in which:
- food is safe
- food is what it says it is
- food is healthier and more sustainable
Food and You 2 is designed to monitor the FSA’s progress against this mission and to
inform policy decisions by measuring on a regular basis consumers’ self-reported
knowledge, attitudes and behaviours related to food safety and other food issues in
England, Wales, and Northern Ireland (footnote 1).
Food and You 2: Wave 9
Food and You 2: Wave 9 data were collected between 24th April 2024 to 1st July 2024. A total of 5,526 adults (aged 16 years and over) from 3,908 households across England, Wales, and Northern Ireland completed the survey (an overall response rate of 25.8%).
Food and You 2: Wave 9 data were collected during a period where food price inflation remained relatively stable and the price of energy was falling, with rates of inflation for both food and energy prices significantly lower than the year before. This stabilisation of food price inflation and drop in energy prices followed a period of high inflation over the previous two years. Wave 9 data was also collected in the period immediately leading up to the UK General election (held on the 4th July 2024). These recent events may impact respondents personal outlook on the topics within this survey.
This report presents key findings from the Food and You 2: Wave 9 survey. Not all questions asked in the Wave 9 survey are included in the report. The full results are available in the accompanying data set and tables.
Interpreting the findings
To highlight the key differences between socio-demographic and other sub-groups, variations in responses are typically reported only where the absolute difference is 10 percentage points or larger and is statistically significant at the 5% level (p<0.05).
However, some differences between socio-demographic and other sub-groups are included where the difference is less than 10 percentage points, when the finding is notable or judged to be of interest. These differences are indicated with a double asterisk (**). A single asterisk indicates that the value is not reported as the size of the base size is below 100 and therefore may not be representative (*).
In some cases, it was not possible to include the data of all sub-groups, however such analyses are available in the full data set and tables. Key information is provided for each reported question in the footnotes, including:
- question wording (question) and response options (response)
- number of respondents presented with each question and description of the respondents who answered the question (Base= N)
- ‘please note:’ indicates important points to consider when interpreting the results
-
In Scotland, the non-ministerial office, Food Standards Scotland, is responsible for ensuring food is safe to eat, consumers know what they are eating and improving nutrition.
The FSA’s overarching mission is ‘food you can trust’. The FSA’s vision is a food system
in which:
- food is safe
- food is what it says it is
- food is healthier and more sustainable
Confidence in food safety and authenticity
Most respondents reported confidence (‘very confident’ or ‘fairly confident’) in food safety and authenticity. 89% of respondents reported that they were confident that the food they buy is safe to eat, and 81% of respondents were confident that the information on food labels is accurate (footnote 1).
Confidence in food safety varied between different categories of people in the following ways:
- annual household income: respondents with a higher income were more likely to be confident that the food they buy is safe to eat than those with a lower income, for example 96% of those earning more than £96,000, compared to 85% of those earning less than £19,000
- NS-SEC4 (footnote 2): respondents in managerial, administrative and professional occupations (91%) were more likely to be confident that the food they buy is safe to eat than those who were small employers and own account workers (81%)
- region (England) (footnote 3): respondents in East Midlands (94%) were more likely to be confident that the food they buy is safe to eat compared to those in London (83%) and the North-East (84%)
- food security (footnote 4): respondents who were more food secure were more likely to be confident that the food they buy is safe to eat compared to those who were less food secure (for example, 92% of those with high food security compared to 82% of those with very low food security)
- awareness of the food hygiene rating scheme (FHRS): respondents who had heard of the FHRS (and who knew a lot or a little about it) were more likely to be confident that the food they buy is safe to eat (91%), compared to those who had not heard of the scheme (65%)
Confidence in the accuracy of information on food labels varied between different categories of people in the following ways:
- annual household income: respondents with a higher income were more likely to be confident that the information on food labels is accurate than those with a lower income. For example, 87% of those earning £64,000 to £95,999 and 87% of those earning £32,000 to £63,999, compared to 75% of those earning less than £19,000
- NS-SEC: respondents in occupations (for example, 83% of those in intermediate occupations and 84% of those in managerial/administrative/professional occupations) were more likely to be confident that the information on food labels is accurate than those who were long term unemployed and/or had never worked (69%) or full-time students (72%)
- region (England): respondents in the South West (89%), South East (82%) and North West (83%) of England were more likely to be confident that the information on food labels is accurate than those in the West Midlands** (79%) and London (72%)
- food security: respondents who had high (86%) and marginal (82%) food security were more likely to report confidence in the accuracy of food labels than those with low (72%) or very low food security (67%)
- food hypersensitivities: those with a self-reported food allergy (91%) were more likely to report confidence in the accuracy of food labels than those with no food hypersensitivities (81%)
- responsibility for cooking: respondents who are responsible for cooking (82%) were more likely to report confidence in the accuracy of food labels than those who do not cook (67%)
- trust in the FSA: respondents who reported trust in the FSA (90%) were more likely to report confidence in the accuracy of food labels than those who do not trust the FSA (44%)
- awareness of the food hygiene rating scheme (FHRS): The majority of those who had heard of the FHRS and knew a lot or a little about it (83%) or who had heard of the FHRS but didn’t know much or anything about it (79%) were confident that food labels are accurate, compared to 49% of those who had not heard of the scheme
Confidence in the food supply chain
Around two-thirds of respondents (69%) reported that they had confidence (very
confident or fairly confident) in the food supply chain (footnote 5).
Confidence in the food supply chain varied between different categories of people in
the following ways:
- age group: respondents aged 45 years or over were more likely to report confidence in the food supply chain than those aged 34 years or younger (for example, 76% of those aged 75+, 72% of those aged 65-74, 75% of those aged 55-64 and 71% of those aged 45-54 were confident compared to 58% of those aged 16-24 and 63% of those aged 25-34)
- NS-SEC: respondents in occupations (for example, 78% of semi-routine/routine occupations, 72% of lower supervisory and technical occupations, 69% of managerial/administrative/professional occupations and 70% of intermediate occupations) were more likely to report confidence in the food supply chain than those who were full time students (55%)
- region (England): confidence in the food supply chain varied by region; with respondents in London less likely than all other regions (with the exception of Yorkshire and the Humberside) to feel confident in the food supply chain. For example, 58% of respondents in London were confident in the food supply chain compared to 75% of those in the South West, 73% in the West Midlands and 73% in the East Midlands
- food security: respondents with high food security (73%) were more likely to report confidence in the food supply chain than respondents with marginal (64%), low (63%) or very low (61%) food security
- awareness of the food hygiene rating scheme (FHRS): 70% of those who had heard of the FHRS and knew a lot or a little about it and 61% of those who had heard of the FHRS but didn’t know much or anything about it were confident in the food supply chain, compared to 47% of those who had not heard of the scheme
Awareness, trust and confidence in the FSA
Awareness of the FSA
Most respondents (91%) had heard of the FSA (footnote 6).
Awareness of the FSA varied between different categories of people in the following
ways:
- age group: older respondents were more likely to have heard of the FSA than younger respondents. For example, 97% of those aged 65-74 years had heard of the FSA, compared to 79% of those aged 16-24 years
- annual household income: respondents with an income over £19,000 were more likely to have heard of the FSA than those with an income of £19,000 or less. For example, 93% of those with an income over £96,000 and 94% of those with an income between £64,000 and £95,999 had heard of the FSA compared to 84% of those with an income of less than £19,000
- NS-SEC: respondents in most occupational groups (for example, 93% of those in intermediate occupations) were more likely to have heard of the FSA than full time students (77%) and those who were long-term unemployed or had never worked (76%)
- ethnic group: white respondents (94%) were more likely to have heard of the FSA compared to Asian or Asian British respondents (81%) (footnote 7)
- responsibility for food shopping: respondents who are responsible for food shopping (92%) were more likely to have heard of the FSA than those who never shop for food (79%)
- awareness of the food hygiene rating scheme (FHRS): 94% of those who had heard of the FHRS and knew a lot or a little about it and 87% of those who had heard of the FHRS but didn’t know much or anything about it had heard of the FSA, compared to 65% of those who had not heard of the scheme
Most respondents reported at least some knowledge of the FSA. 51% reported that they knew a little about the FSA and what it does, and 6% reported that they knew a lot about the FSA and what it does. Around a third of respondents (32%) reported that they had heard of the FSA but knew nothing about it, 5% had not heard of the FSA until being contacted to take part in the Food and You 2 survey, and 6% had never heard of the FSA (Figure 1) (footnote 8).
Figure 1. Knowledge about the Food Standards Agency (FSA)
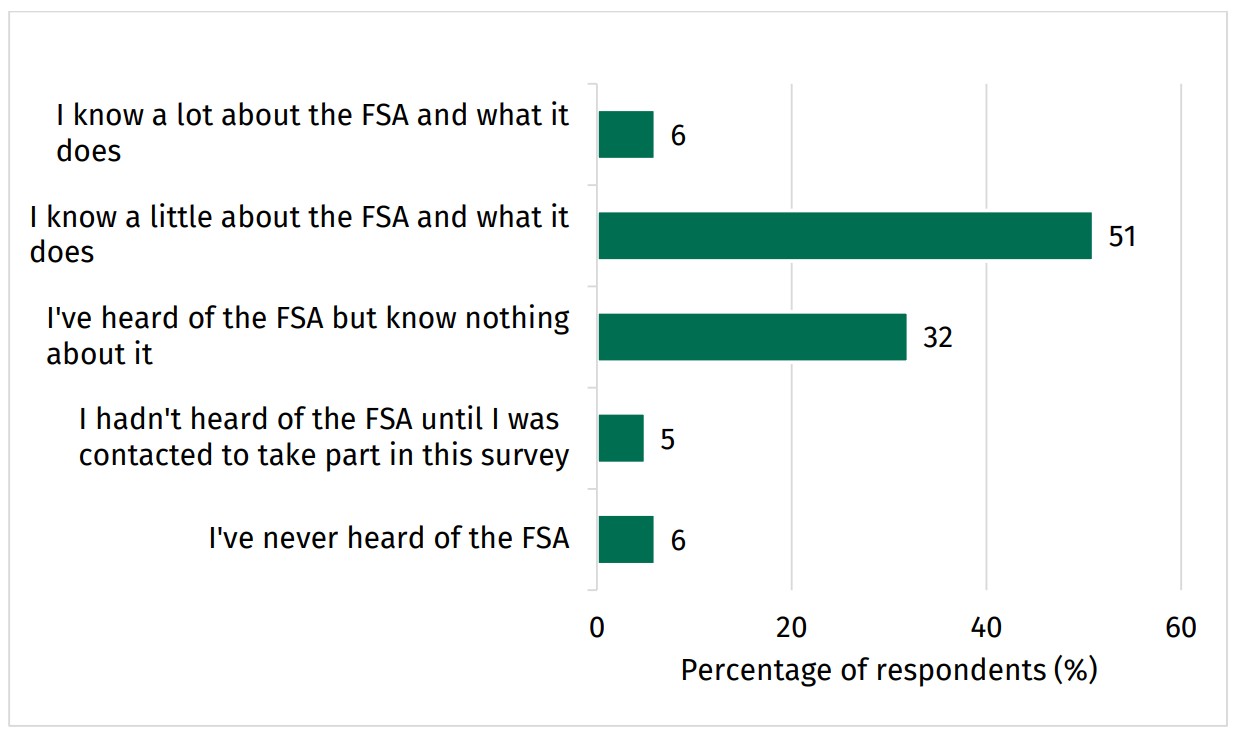
The bar chart shows the answers for questions about knowledge of the FSA. 6% of people responded: I know a lot about the FSA and what it does. 51% of people responded: I know a little about the FSA and what it does. 32% of people responded: I've heard of the FSA but know nothing about it. 5% of people responded: I hadn't heard of the FSA until I was contacted to take part in this survey. 6% of people responded: I have never heard of the FSA.
Knowledge of the FSA varied between different categories of people in the following ways (footnote 9):
- age group: respondents aged between 25 and 64 years (for example, 68% of those aged 55-64 years) were more likely to report knowledge of the FSA compared to younger respondents (e.g. 38% of those aged 16-24 years) or the oldest respondents (46% of those aged 75 years and over)
- annual household income: respondents with an income of over £19,000 were more likely to report knowledge of the FSA compared to those with an income of £19,000 or less (for example, 63% of those with an income between £32,000 and £63,999 compared to 51% of those with an income of less than £19,000)
- NS-SEC: respondents in most occupational groups (for example, 63% of those in managerial/administrative/professional occupations) were more likely to report knowledge of the FSA than full-time students (40%) and those who were long-term unemployed or had never worked (36%)
- country: Respondents in Wales (65%) were more likely to report knowledge of the FSA than respondents living in Northern Ireland (55%) and England (57%)
- region (England): Respondents in London (60%) and the North-West (61%) were more likely to report knowledge of the FSA than those in the East of England (50%)
- ethnic group: white respondents (59%) were more likely to report knowledge of the FSA compared to Asian or Asian British respondents (49%) (footnote 10)
- responsibility for cooking: respondents who are responsible for cooking (59%) were more likely to report knowledge of the FSA than those who do not cook (41%)
responsibility for food shopping: respondents who are responsible for food shopping (59%) were more likely to report knowledge of the FSA than those who never shop for food (37%)
awareness of the food hygiene rating scheme (FHRS): respondents who had heard of the FHRS and knew a lot or a little about it (71%) were more likely to report knowledge of the FSA than those who had heard of the FHRS but didn’t know much or anything about it (35%) and those who had not heard of the scheme (29%)
Trust in the FSA
Respondents who had at least some knowledge of the FSA were asked how much they trusted the FSA to do its job, that is to make sure food is safe and what it says it is. Most respondents (69%) reported that they trusted the FSA to do its job, 26% of respondents neither trust or distrust the FSA to do this, and 2% of respondents reported that they distrust the FSA to do this (footnote 11).
Trust in the FSA varied between different categories of people in the following ways:
- age group: those aged 25-34 (76%) were more likely to report that they trusted the FSA to do its job than those aged 35-44 (64%)
- household size: respondents who lived in larger households, of 5 or more people (81%), were more likely to report that they trusted the FSA to do its job than those who lived in households of 2 (68%) or 4 (67%)
Most respondents (78%) reported that they were confident that the FSA (or the government agency responsible for food safety) can be relied upon to protect the public from food-related risks (such as food poisoning or allergic reactions from food). Around three quarters (76%) of respondents were confident that the FSA takes appropriate action if a food-related risk is identified and 70% were confident that the FSA is committed to communicating openly with the public about food-related risks (footnote 12).
-
Question: How confident are you that… a) the food you buy is safe to eat. b) the information on food labels is accurate (for example, ingredients, nutritional information, country of origin). Responses: very confident, fairly confident, not very confident, not at all confident, it varies, don’t know. Base= 5,526, all respondents.
-
NS-SEC (The National Statistics Socio-economic classification) is a classification system which provides an indication of socio-economic position based on occupation and employment status.
-
Regional differences were only considered in England due to the low sample / base size in Wales and Northern Ireland.
-
Food security means access by all people at all times to enough food for an active, healthy life.
-
Question: How confident are you in the food supply chain? That is all the processes involved in bringing food to your table. Responses: very confident, fairly confident, not very confident, not at all confident, it varies, don’t know. Base= 5526, all respondents.
-
Question: Which of the following, if any, have you heard of? Please select all that apply. Response: Food Standards Agency (FSA), (England) Department for Environment, Food and Rural Affairs (DEFRA), (England) The Office for Health Improvement and Disparities, (England) Environment Agency, (England) UK Health Security Agency (UKHSA), (England and Wales) Health and Safety Executive (HSE), (Wales) Public Health Wales (PHW), (Wales) Natural Resources Wales, (NI) Public Health Agency (PHA), (NI) Department of Agriculture, Environment and Rural Affairs (DAERA), (NI) Health and Safety Executive Northern Ireland (HSENI), (NI) Safefood, None of these. Base= 3530, all online respondents. Please note: All consumers taking part in the survey had received an invitation to take part in the survey which mentioned the FSA. An absence of response indicates the organisation had not been heard of by the respondent or a non-response.
-
Please note: the figures of other ethnic groups are not reported due to low base / sample size.
-
Question: How much, if anything, do you know about the Food Standards Agency, also known as the FSA? Response: I know a lot about the FSA and what it does, I know a little about the FSA and what it does, I've heard of the FSA but know nothing about it, I hadn't heard of the FSA until I was contacted to take part in this survey, I've never heard of the FSA. Base= 5526, all respondents. Please note: All consumers taking part in the survey had received an invitation to take part in the survey which mentioned the FSA.
-
Comparisons are based on those who reported knowing a lot or a little about the FSA combined.
-
Please note: the figures of other ethnic groups are not reported due to low base / sample size.
-
Question: How much do you trust or distrust the Food Standards Agency to do its job? That is to make sure that food is safe and what it says it is. Responses: I trust it a lot, I trust it, I neither trust nor distrust it, I distrust it, I distrust it a lot, don’t know. Base= 3274, all respondents who know a lot or a little about the FSA and what it does. Please note: ‘I trust it a lot’ and ‘I trust it’ referred to as trust.
-
Question: How confident are you that the Food Standards Agency / the government agency responsible for food safety in England, Wales and Northern Ireland...a) Can be relied upon to protect the public from food-related risks (such as food poisoning or allergic reactions from food). b) Is committed to communicating openly with the public about food-related risks. c) Takes appropriate action if a food related risk is identified? Responses: very confident, fairly confident, not very confident, not at all confident, don’t know. Base= 5526, all respondents. Please note: ‘very confident’ and ‘fairly confident’ referred to as confident. Respondents with little or no knowledge of the FSA were asked about ‘the government agency responsible for food safety’, those with at least some knowledge of the FSA were asked about the FSA.
Common concerns
Respondents were asked to report whether they had any concerns about the food they eat. Most respondents (79%) had no concerns, and 21% of respondents reported that they had a concern (footnote 1).
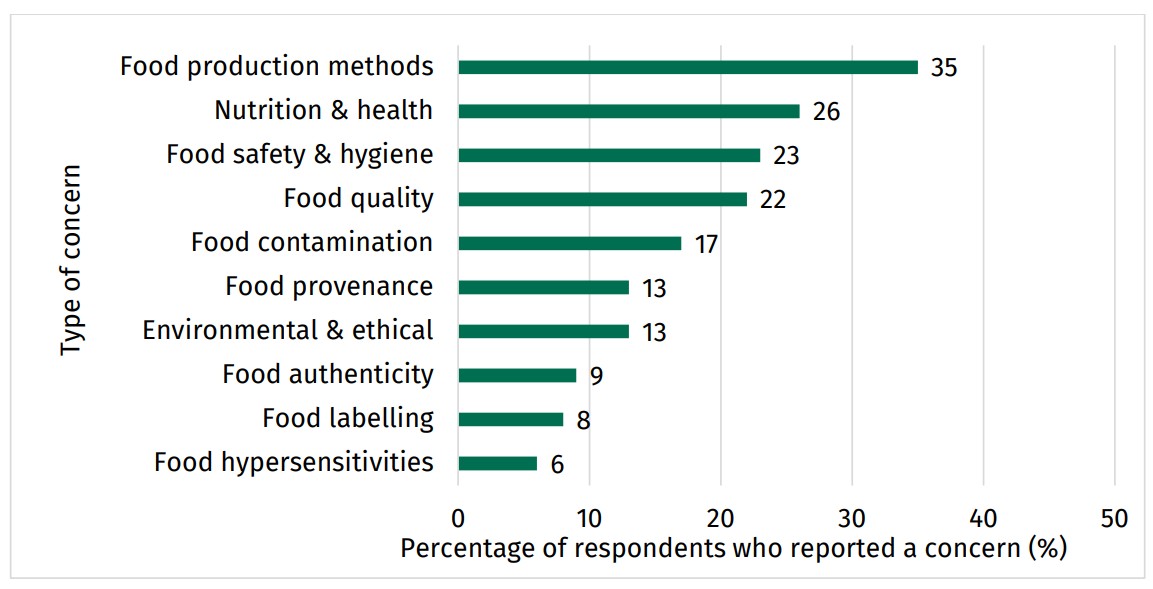
Respondents who reported having a concern were asked to briefly explain what their concerns were about the food they eat. The most common concerns related to food production methods (35%), nutrition and health (26%), concerns about food safety and hygiene (23%) and the quality of food (22%) (Figure 2) (footnote 2).
Figure 2. Most common spontaneously expressed food-related concerns (top 10)
Source: Food and You 2: Wave 9
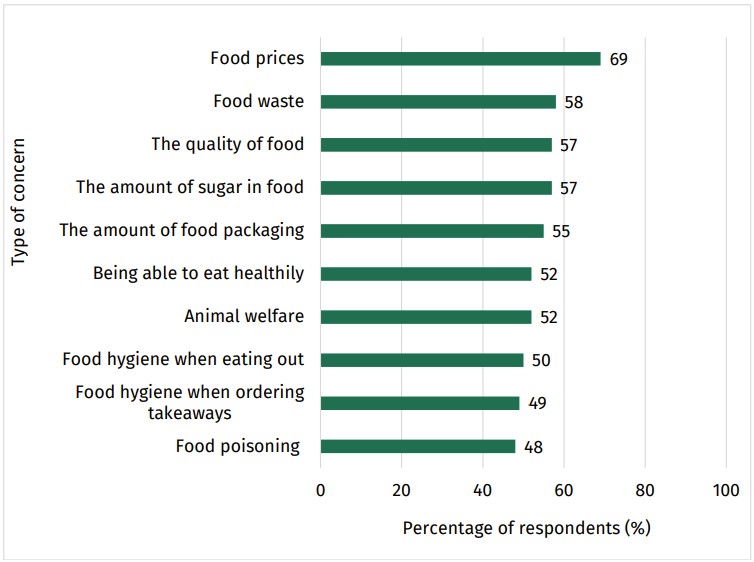
All online respondents were asked to indicate if they had concerns about several food related issues, from a list of options. The most prevalent concern was food prices (69%). Other common concerns were food waste (58%), the quality of food (57%), the amount of sugar in food (57%), and the amount of food packaging (55%) (Figure 3) (footnote 3).
Figure 3. Most common prompted food-related concerns (top 10)
Source: Food and You 2: Wave 9
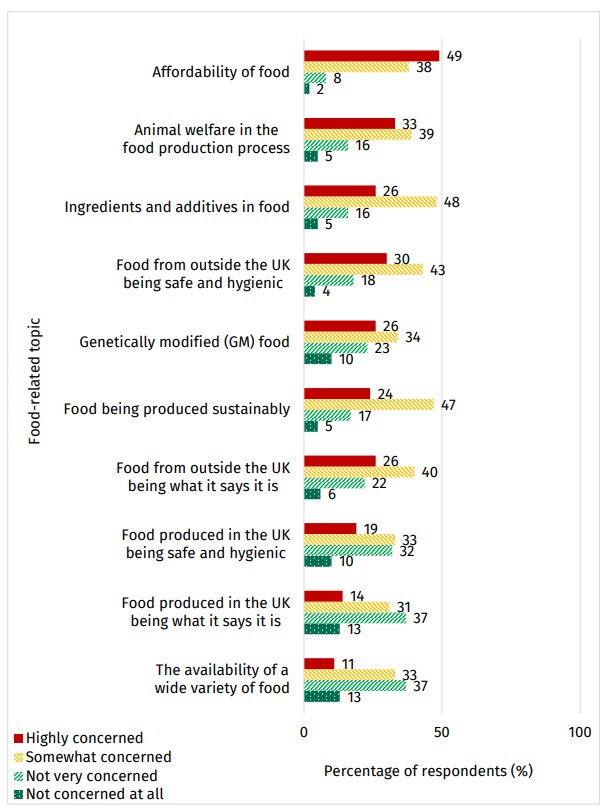
Respondents were asked to indicate the extent to which they were concerned about several specific food-related issues. Respondents were most likely to report being highly concerned about the affordability of food (49%). Other issues respondents were highly concerned about included animal welfare in the food production process (33%), and food from outside the UK being safe and hygienic (30%) (Figure 4) (footnote 4).
Figure 4. Level of concern about food-related topics
Source: Food and You 2: Wave 9
The reported level of concern about the affordability of food varied between different categories of people in the following ways:
- age group: respondents aged between 16 and 54 years were more likely to report that they were highly concerned about the affordability of food than those aged between 55 and 75 years. For example, 57% of those aged 16-24 were highly concerned compared to 34% of those aged 65-74
- presence of children under 16 in the household: Households with children present (58%) were more likely to report that they were highly concerned about the affordability of food than those without children (46%)
- annual household income: respondents with a lower income were more likely to report that they were highly concerned about the affordability of food compared to households with a higher income (for example, 58% of those with an income below £19,000 compared to 32% of those with an income of £96,000 or more)
- NS-SEC: those in most occupational groups (for example, 44% of those in lower supervisory and technical occupations) were more likely to report that they were highly concerned about the affordability of food than full-time students (62%)
- food security: respondents with very low (75%), low (66%) or marginal (65%) food security were more likely to report that they were highly concerned about the affordability of food than those with high food security (39%)
- long-term health condition: respondents with a long-term health condition (57%) were more likely to report that they were highly concerned about the affordability of food then those without a long-term health condition (46%)
- awareness of the food hygiene rating scheme (FHRS): Those who had heard of the FHRS and either knew a lot or a little about it (50%) or had heard of the FHRS but didn’t know much or anything about it (49%) were more likely to be concerned about the affordability of food, compared to those who had not heard of the scheme (33%)
-
Question: Do you have any concerns about the food you eat? Responses: Yes, No. Base = 5526, all respondents.
-
Question: What are your concerns about the food you eat? Responses: [Open text]. Base= 1100, all respondents with concerns about the food they eat. Please note: additional responses are available in the full data set and tables, responses were coded by Ipsos, see Technical Report for further details.
-
Question: Do you have concerns about any of the following? Responses: the amount of sugar in food, food waste, animal welfare, hormones, steroids or antibiotics in food, the amount of salt in food, the amount of fat in food, food poisoning, food hygiene when eating out, food hygiene when ordering takeaways, the use of pesticides, food fraud or crime, the use of additives (for example, preservatives and colouring), food prices, genetically modified (GM) foods, chemical contamination from the environment, food miles, the number of calories in food, food allergen information, cooking safely at home, the quality of food, the amount of food packaging, being able to eat healthily, none of these, don’t know. Base= 3530, all online respondents.
-
Question: Thinking about food in the UK [question wording variation in Northern Ireland: the UK and Ireland] today, how concerned, if at all, do you feel about each of the following topics? a) affordability of food b) food produced in [in England and Wales: the UK; [in Northern Ireland: the UK and Ireland] being safe and hygienic c) food from outside [in England and Wales: the UK; in Northern Ireland: the UK and Ireland] being safe and hygienic d) food produced in [in England and Wales: the UK; in Northern Ireland: the UK and Ireland] being what it says it is e) food from outside [in England and Wales: the UK; in Northern Ireland: the UK and Ireland] being what it says it is f) food being produced sustainably g) the availability of a wide variety of food h) animal welfare in the food production process i) ingredients and additives in food j) genetically modified (GM) food. Base = 3530, all online respondents. Please note: some question wording was modified for respondents in England, Wales and Northern Ireland.
Introduction
“Food security exists when all people, at all times, have physical and economic access to sufficient, safe and nutritious food that meets their dietary needs and food preferences for an active and healthy life.” World Food Summit, 1996.
Food and You 2 uses the 10-item U.S. Adult Food Security Survey Module developed by the United States Department of Agriculture (USDA) to measure consumers’ food security status.
Respondents are assigned to one of the following food security status categories:
- high: no reported indications of food-access problems or limitations
- marginal food security: one or two reported indications—typically of anxiety over food sufficiency or shortage of food in the house. Little or no indication of changes in diets or food intake
- low: reports of reduced quality, variety, or desirability of diet. Little or no indication of reduced food intake
- very low: reports of multiple indications of disrupted eating patterns and reduced food intake
Those with high or marginal food security are referred to as food secure. Those with low or very low food security are referred to as food insecure.
More information on how food security is measured and how classifications are assigned and defined can be found in Annex A and on the USDA Food Security website
Food security
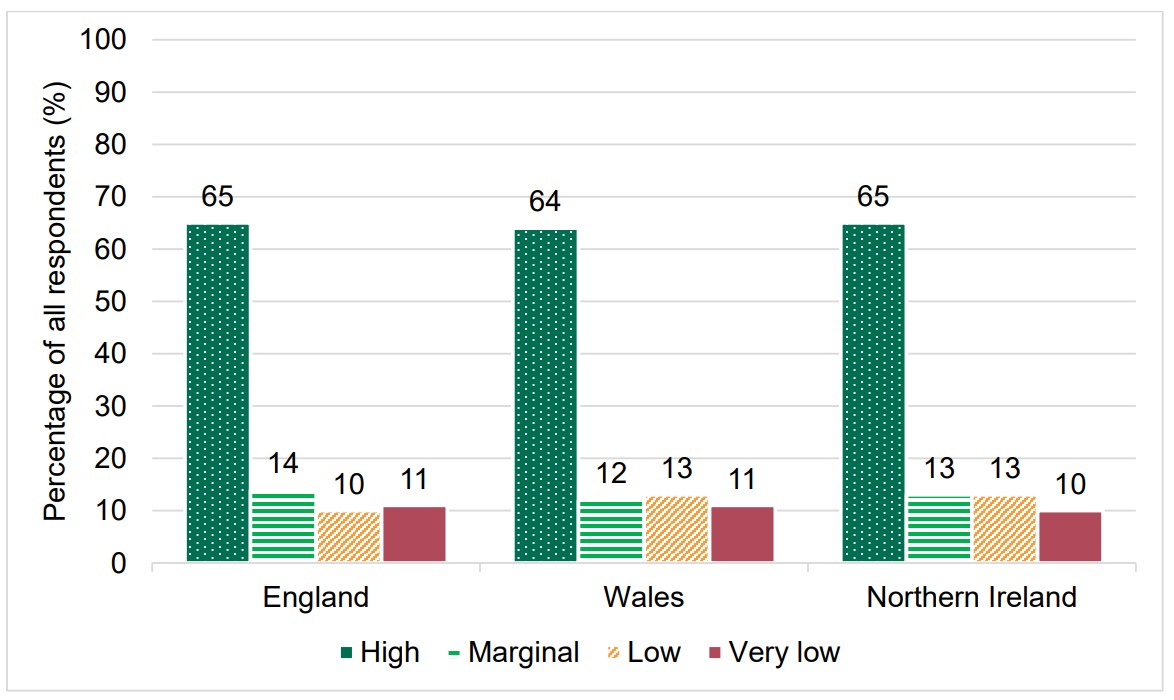
Across England, Wales, and Northern Ireland, 79% of respondents were classified as food secure (65% high, 14% marginal) and 21% of respondents were classified as food insecure (10% low, 11% very low) (footnote 1).
Around three-quarters of respondents were food secure (i.e. had high or marginal food security) in England (79%), Northern Ireland (77%), and Wales (75%). Approximately a quarter of respondents were food insecure (i.e. had low or very low food security) in England (21%), Northern Ireland (23%), and Wales (25%) (Figure 5).
Figure 5. Food security in England, Wales, and Northern Ireland
Source: Food and You 2: Wave 9
Experiences of food insecurity
Respondents were asked up to ten questions from the US Adult Food Security Survey Module (footnote 2), to determine their food security classification.
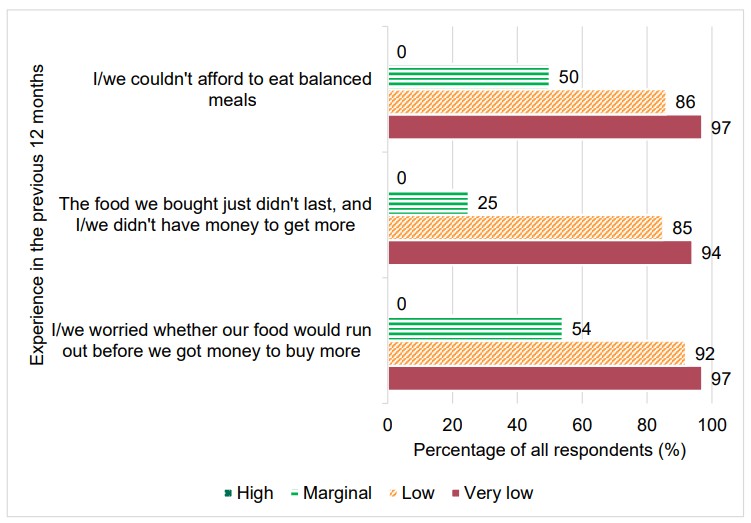
All respondents were asked the first three questions from the food security survey module. The first three questions asked respondents how often, if ever, they had experienced any of the following in the previous 12 months:
- I/we worried whether our food would run out before we got money to buy more
- the food that we bought just didn't last, and I/we didn't have money to get more
- I/we couldn't afford to eat balanced meals
In the previous 12 months, respondents who had very low (97%), or low (92%) food security were more likely (footnote 3) to have worried whether their food would run out before they had money to buy more, compared to those with marginal (54%) food security (footnote 4). Respondents who had very low (94%), or low (85%) food security were more likely to report that the food that they bought just didn't last, and they didn't have money to get more, compared to those with marginal (25%) food security (footnote 5). Respondents who had very low (97%), or low (86%) food security were more likely to report that they couldn’t afford balanced meals, compared to those with marginal (50%) food security (footnote 6). None of the respondents (0%) with high food security reported these experiences, because according to the USDA classification system those with high food security report ‘no indications of food access problems or limitations’ (Figure 6).
Figure 6. Experiences of food security by food security classification
How food security differs between socio-economic and demographic groups
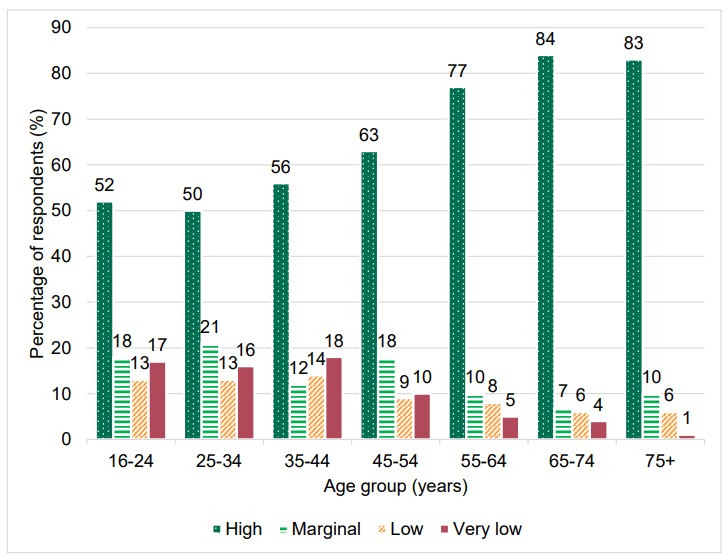
Food security varied by age group with older adults being more likely to report that they were food secure and less likely to report that they were food insecure than younger adults. For example, 30% of respondents aged 16-24 years were food insecure (13% low, 17% very low food security) compared to 7% of those aged 75 years and over (6% low, 1% very low food security) (Figure 7).
Figure 7. Food security by age group
Source: Food and You 2: Wave 9
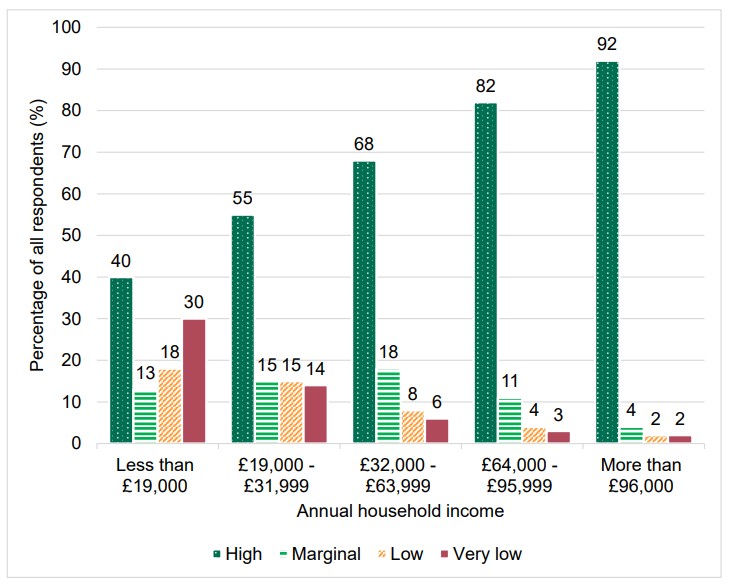
Food security was associated with household income. Respondents with a lower income were more likely to report being food insecure than those with a higher income. For example, 47% of those with an annual household income of less than £19,000 reported food insecurity (low 18%, very low 30%) compared to 7% of those with an income between £64,000 and £95,999 (low 4%, very low 3%) (Figure 8).
Figure 8. Food security by annual household income
Source: Food and You 2: Wave 9
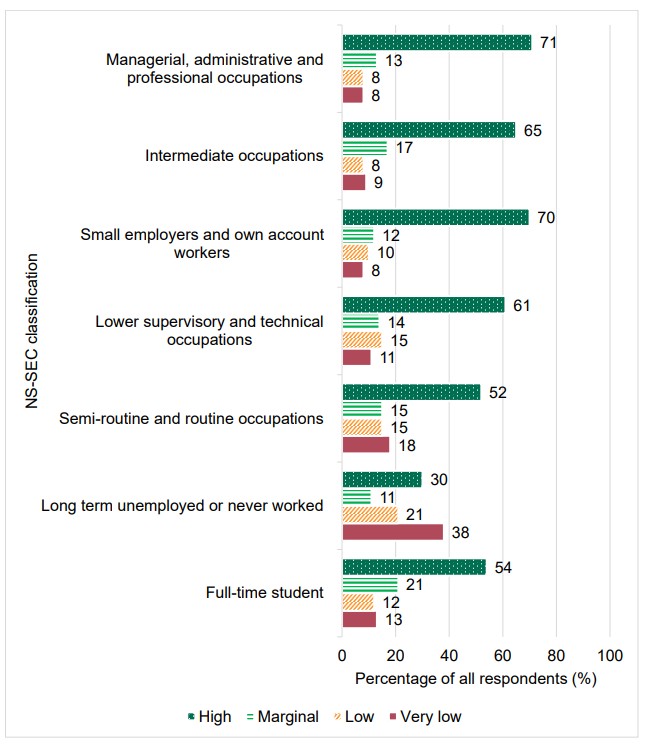
Respondents who were long term unemployed and/or had never worked (59%) were more likely to report that they were food insecure compared to all other occupational groups. Those who were full-time students (25%), lower supervisory and technical occupations (25%) and semi-routine and routine occupations (33%) were more likely to be food insecure than most other occupations groups (for example, 16% managerial, administrative and professional occupations and 18% of small employers and own account workers) (Figure 9) (footnote 7) **.
The reported level of food insecurity also varied between different categories of people in the following ways:
- household size: respondents who lived in larger households, for example, 4- person households (26%) or households of 5 or more (31%) were more likely to report that they were food insecure compared to smaller households, for example, 1-person (19%) or 2-person (15%) households**
- children under 16 in household: 31% of households with children under 16 years reported that they were food insecure compared to 16% of households without children under 16 years
- children under six in household: 35% of households with children under six years reported that they were food insecure compared to 19% of households without children under six years
- urban vs rural: 22% of respondents living in an urban area reported that they were food insecure compared to 15% of respondents living in a rural area**
- region (England) (footnote 8): levels of food insecurity varied by region in England. For example, respondents who live in the East Midlands (26%) and West-Midlands (24%) were more likely to be food insecure compared to those who live in the South West of England (16%)
- ethnic group: 25% of Asian or Asian British respondents reported that they were food insecure compared to 19% of white respondents ** (footnote 9)
- long term health condition: respondents with a long-term health condition (32%) were more likely to report being food insecure compared to those without a long-term health condition (16%)
Figure 9. Food security by socio-economic classification (NS-SEC)
Source: Food and You 2: Wave 9
Changes to food-related behaviours
Respondents were asked what changes, if any, they had made to their eating habits and food-related behaviours in the previous 12 months for financial reasons. Most respondents (75%) reported that they had made a change to their eating habits for financial reasons in the previous 12 months, with a quarter of respondents (25%) indicating that they had made no changes.
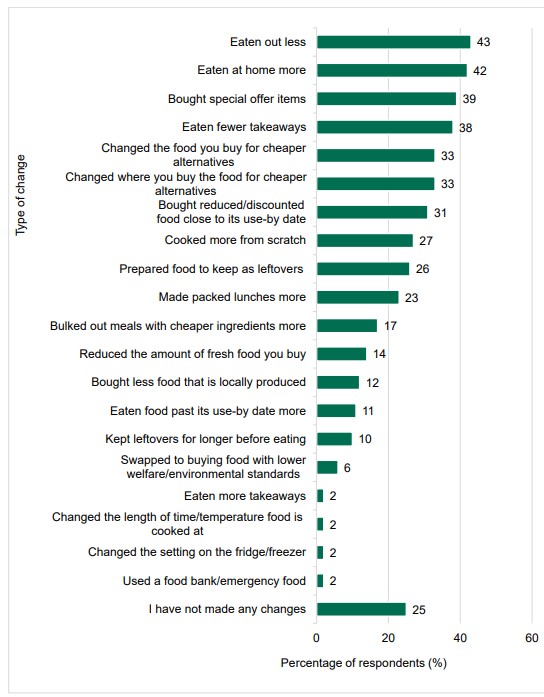
Common changes related to what and where respondents ate (43% ate out less, 42% ate at home more, 38% ate fewer takeaways), changes to shopping habits (39% bought items on special offer, 33% changed the food they buy to something cheaper, 33% changed where they buy food to somewhere cheaper, 31% bought reduced/discounted food) and changes to food preparation (26% prepared food that could be kept as leftovers/cooked in batches more, 27% cooked from scratch more, 23% made packed lunches more, 17% bulked out meals with cheaper ingredients). Some respondents reported an increase in risky food safety behaviours due to financial reasons (10% kept leftovers for longer before eating, 11% had eaten food past its use-by date more often, 2% had changed the time and temperature food is cooked at and 2% reported changing the setting on the fridge / freezer) (Figure 10) (footnote 10).
Figure 10. Changes in eating habits and food-related behaviours for financial reasons
Source: Food and You 2: Wave 9
Food bank use
Respondents were asked if they or anyone else in their household had received a free parcel of food from a food bank or other emergency food provider in the last 12 months. Most respondents (94%) reported that they had not used a food bank or other emergency food provider in the last 12 months, with 4% of respondents reporting that they had done so (footnote 11).
Respondents who had received a food parcel from a food bank or other provider were asked to indicate how often they had received this in the last 12 months. Of these respondents, 24% had received a food parcel on only one occasion in the last 12 months, 49% had received a food parcel on more than one occasion but less often than every month, and 7% had received a food parcel every month or more often (footnote 12).
Social supermarkets
Social supermarkets, food clubs and community pantries/larders allow people to buy food items at a heavily discounted price, or as part of membership. These are generally community organisations and may offer additional services such as referral services and volunteering opportunities. Some or all of the food is surplus from the food supply chain.
Awareness and use of social supermarkets
Respondents were asked if they or anyone else in their household had used a social supermarket in the last 12 months. One in 20 respondents (5%) reported that they had used a social supermarket in the last 12 months and 79% of respondents reported that they had not used a social supermarket in the last 12 months. Around one in ten respondents (14%) reported that they had not heard of social supermarkets (footnote 13).
The use of social supermarkets varied between different categories of people in the following ways:
- annual household income: respondents with an income of less than £19,000 (14%) were more likely to have used a social supermarket than those with a higher income (for example, 2% of those with an income of £32,000-£63,999)
- region (England) (footnote 14): levels of social supermarket use varied by region in England. For example, respondents who live in the North-East of England (11%) and the West Midlands (10%) were more likely to have used a social supermarket than those who live in the East Midlands (3%), the East of England (3%), the North West of England (4%), the South East of England (4%) and the South West of England (4%)**
- food security: respondents experiencing very low food security (19%) were more likely to have used a social supermarket than those with low (9%), marginal (7%) or high (2%) food security
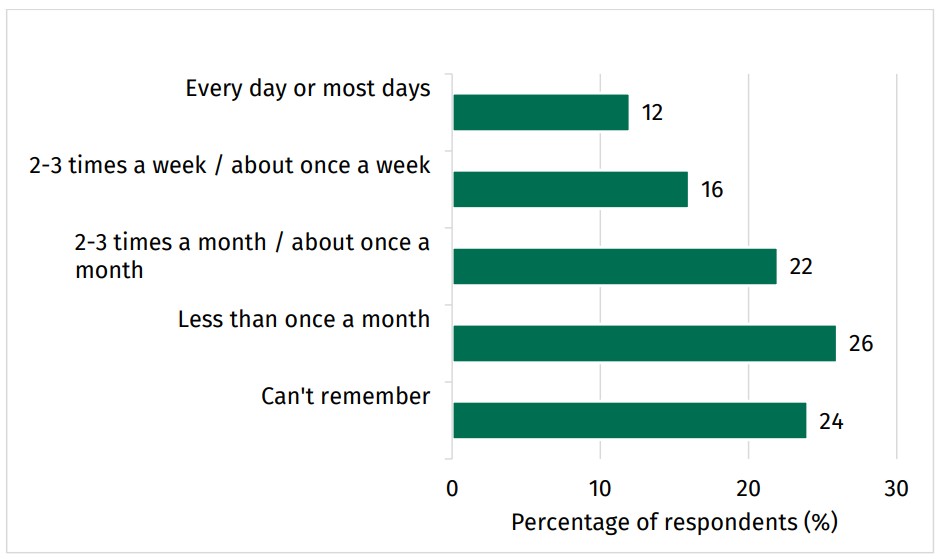
Respondents who had used a social supermarket were asked to indicate how often they had used this in the last 12 months. Of these respondents, 12% had used a social supermarket every day or most days, 16% had used a social supermarket 2-3 times a week or about once a week, 22% had used a social supermarket 2-3 times a month or about once a month, and 26% had used a social supermarket less than once a month. However, 24% of respondents who had used a social supermarket reported that they could not remember how often they had used a social supermarket in the last 12 months (Figure 11) (footnote 15).
Figure 11. Frequency of social supermarket use among social supermarket users
Source: Food and You 2: Wave 9
Supplementary school food clubs
Respondents with children aged 5-15 were also asked about any additional clubs their children may attend at school where they receive a meal. These include breakfast clubs, after-school clubs or lunch/activity clubs that only run during the school holidays (footnote 16). The majority of respondents (72%) reported that their children did not attend any supplementary club. A fifth of respondents (19%) reported that their children attended a breakfast club in the last 12 months, 8% attended an after-school club where they also received a meal, and 5% attended a lunch and activity club during the school holidays.
The reported uptake of these clubs varied between different categories of people in the following ways:
- children under six: households with children under six were more likely to have used an after-school club (22%) compared to households without children under six years where only 4% of households accessed these clubs
- annual household income: respondents with a higher income were less likely to report that the child(ren) attended a breakfast club compared to those with a lower income. For example, 11% of respondents with an income of more than £96,000 compared to 27% of those with an income of £19,000-£31,999
- country: 35% of respondents in Wales reported their child(ren) attend a breakfast club compared to 18% of those in England and 19% in Northern Ireland
- food security: those with low/very low food security (29%) were more likely to access breakfast clubs than those with marginal/high food security (14%)
-
Question/Responses: Derived variable, see USDA Food Security guidance and Technical Report. Base= 5526, all respondents. Please note: See Annex A for information about the classifications and definitions of food security levels.
-
See the USDA Food Security guidance for further information about the survey and classifications.
-
respondents who answered ’true’ or ’sometimes true’.
-
Question: Please say whether the statement below was often true, sometimes true or never true for you/people in your household in the last 12 months. I/we worried whether our food would run out before we got money to buy more. Responses: often true, sometimes true, never true, don’t know or prefer not to say, not stated. Base= 5526, all respondents.
-
Question: Please say whether the statement below was often true, sometimes true or never true for you/people in your household in the last 12 months. The food that we bought just didn't last, and I/we didn't have money to get more. Responses: often true, sometimes true, never true, don’t know or prefer not to say, not stated. Base= 5526, all respondents.
-
Question: Please say whether the statement below was true for you/your household in the last 12 months. I/we couldn't afford to eat balanced meals. Responses: often true, sometimes true, never true, don’t know or prefer not to say, not stated. Base= 5526, all respondents.
-
NS-SEC (The National Statistics Socio-economic classification) is a classification system which provides an indication of socio-economic position based on occupation and employment status.
-
Regional differences reported in England only due to the low sample / base size in Wales and Northern Ireland.
-
Please note: the figures of other ethnic groups are not reported due to low base / sample size.
-
Question: In the last 12 months, have you made any of these changes for financial reasons? Responses: eaten out less, eaten at home more, cooked at home more, eaten fewer takeaways, bought items on special offer more (for example, 3 for 2), prepared food to be kept as leftovers/cooked in batches more, changed where you buy food to somewhere cheaper, changed the food you buy to something cheaper, made packed lunches more, bought reduced/discounted food close to its use-by date more, eaten food past its use-by date more, kept leftovers for longer before eating, started using a food bank/emergency food provider, reduced the amount of fresh food you buy, swapped to buying food with lower welfare or environmental standards, bought less food that is locally produced, changed the length of time or temperature food is cooked at, changed the setting on the fridge or freezer, I have made another food-related change, I have not made any changes. Base= 3530, all online respondents
-
Question: In the last 12 months, have you, or anyone else in your household, received a free parcel of food from a food bank or other emergency food provider? Responses: Yes, No, Prefer not to say. Base= 5526, all respondents.
-
Question: How often in the past 12 months have you, or anyone else in your household, received a free food parcel from a food bank or other emergency food provider? Responses: Only once in the last year, Two or three times in the last year, Four to six times in the last year, More than six times but not every month, Every month or more often, Don't know, Prefer not to say. Base= 130, all online respondents where anyone in household has used a food bank or emergency food or received a free food parcel from a food bank or other emergency food provider in the last 12 months.
-
Question: In the last 12 months, have you, or anyone else in your household, used a social supermarket (also known as a food club/hub or community pantry)? Responses: Yes, No, Prefer not to say, I had not heard of a social supermarket, food club/hub or community pantry before today. Base= 4634, all online respondents and all responding to the version A postal questionnaire.
-
Regional differences were only considered in England due to the low sample / base size in Wales and Northern Ireland.
-
Question: How often in the last 12 months have you, or anyone else in your household, used a social supermarket (also known as a food club/hub or community pantry)? Responses: Every day, most days, 2-3 times a week, about once a week, about once a month, less than once a month, can’t remember. Base= 178, all online respondents and all responding to the version A postal questionnaire who have used a social supermarket in the last 12 month.
-
Question: Did any of the children in your household attend any of the following in the past 12 months? Responses: A breakfast club before school, an after-school club where they also received a meal (tea/dinner), a lunch and activity club that only ran during school holidays, none of these, don’t know. Base= 720, all online respondents who have child(ren) aged 5- 15 living in the household.
Introduction
The remit of food labelling is held by multiple bodies that differ between England, Wales and Northern Ireland.
The FSA is responsible for aspects of food labelling which relate to food safety and allergens in England, Wales and Northern Ireland. In addition, the FSA in Wales is responsible for food labelling related to food composition standards and country of origin. The FSA in Northern Ireland is responsible for food labelling related to food composition standards, country of origin and nutrition (footnote 1).
The Department for Environment, Food and Rural Affairs (Defra) plays a major role in food production and is responsible for aspects of food labelling such as composition and provenance.
This chapter provides an overview of food purchasing, what respondents look for when they are shopping, and confidence in allergen labelling. Defra co-funded questions in this chapter which relate to food provenance, sustainability, and animal welfare.
Where do respondents buy food from?
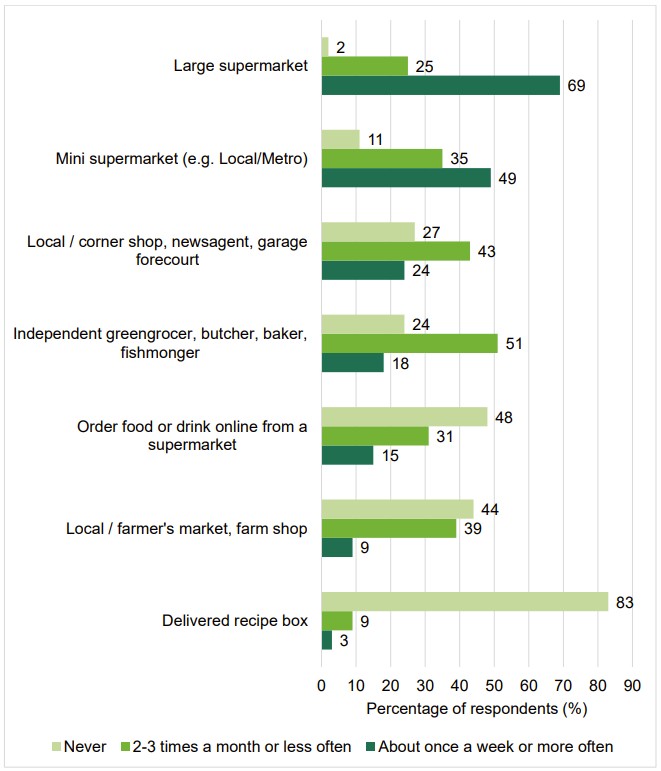
Respondents were asked to indicate where and how frequently they buy food (Figure 12) (footnote 2). Supermarkets were used most frequently by respondents with 69% of respondents buying food from a large supermarket about once a week or more often, and 49% buying food from a mini supermarket once a week or more often.
Independent shops (greengrocers, butchers, bakers, fishmongers), local/corner shops, newsagent or garage forecourt, and local/farmers’ markets or farm shops were used less frequently, with the majority of respondents buying food from these 2-3 times a month or less often (51%, 43% and 39% respectively).
Respondents were least likely to report using online supermarkets or recipe boxes with the majority of respondents reporting that they had never used these (48% and 83% respectively) (Figure 12).
Figure 12. Where respondents buy food from
Source: Food and You 2: Wave 9
What do respondents look for when buying food?
Respondents were asked to indicate what information they check when buying food (Figure 13) (footnote 3). Respondents were most likely to check use-by (86%) or best before dates (83%) with the majority of respondents doing this 'always' or 'most of the time' when they bought food. Around half of respondents reported checking the list of ingredients (53%), nutritional information (50%) and country of origin (47%) about half of the time or occasionally. Four in ten respondents (40%) reported checking food assurance logos about half of the time or occasionally.
Allergen information was least often checked by respondents, with 45% reporting they never checked this. However, respondents who have a food allergy only (50%)* or an intolerance only (48%) were more likely to check allergen information ‘always’ or ‘most of the time’ when food shopping compared to those without a food hypersensitivity (17%).
Figure 13. What information respondents look for when buying food
Source: Food and You 2: Wave 9
Respondents were asked what they consider to be most important when choosing which food to buy from a list of options (footnote 4). The most frequently selected attribute was price/value for money (58%), followed by quality (39%), freshness (30%), and use-by dates and/or how long it will keep for (26%). Around two in ten selected taste (21%) and healthiness (23%). Around one in ten selected ingredients (12%), chose what their household or children wanted (12%), selected farming methods (e.g. organic or free range) (9%) and convivence/how easy it is to prepare (9%).
When asked what information is used to judge the quality of food from a list of options, around half of respondents reported that they used freshness (51%), 44% used taste, and 43% used appearance to judge food quality (footnote 5). Fewer respondents reported that they used the ingredients (31%), price (28%), brand (25%), animal welfare (16%) and country of origin (12%) to judge food quality. Assurance schemes (10%), environmental impact (6%) and convenience (3%) were the least frequently reported sources of information to judge food quality.
Views on animal welfare, food and drink provenance and the environmental impact of food
Respondents were asked their views on animal welfare, food and drink provenance and the environmental impact of food (footnote 6). Most respondents reported that it was important for them to buy meat, eggs and dairy which are produced with high standards of animal welfare (85%) and to buy food which has a low environmental impact (76%). Whilst 68% thought it was important to buy food produced in Britain, only half of respondents (50%) thought it was important to buy drink produced in Britain.
Respondents were asked how frequently they check for information about the environmental impact and animal welfare of food when shopping (footnote 7). While almost four in ten respondents (38%) reported that they check for information about animal welfare when purchasing food ‘always’ or ‘most of the time’, only a quarter of respondents (24%) reported that they check for information about the environmental impact of food ‘always’ or ‘most of the time’.
Respondents were asked to indicate how often, where possible, they buy food which was produced in Britain, has animal welfare information or which had a low environmental impact. Around six in ten respondents (59%) often (‘always’ or ‘most of the time’) buy meat, eggs and dairy which has information on animal welfare, half (52%) often buy food produced in Britain, and 36% often buy food which has a low environmental impact (footnote 8). Respondents were asked to what extent they agree that different food products provide enough information on animal welfare, environmental impact and country of origin (footnote 9). Almost half of respondents (46%) thought that food products show enough information about their country of origin, around a third of respondents (35%) thought that meat, eggs, and dairy products show enough information about animal welfare, and two in ten (20%) thought food products show enough information about their environmental impact.
Respondents were asked to what extent they agree that different food products provide enough information on animal welfare, environmental impact and country of origin. Almost half of respondents (46%) thought that food products show enough information about their country of origin, around a third of respondents (35%) thought that meat, eggs, and dairy products show enough information about animal welfare, and two in ten (20%) thought food products show enough information about their environmental impact.
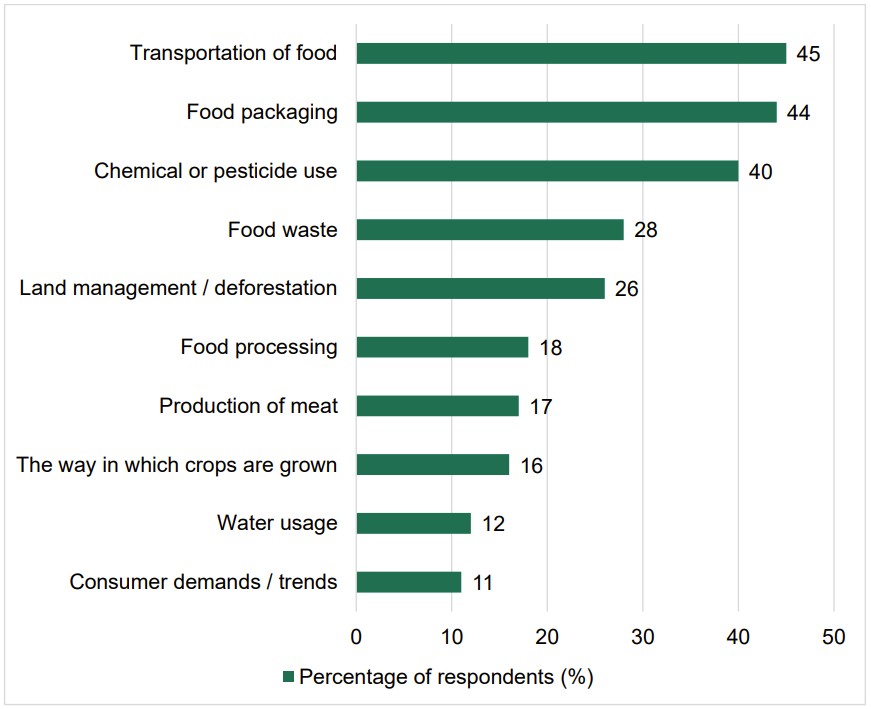
Respondents were asked, from a list of options, what they think contributes most to the environmental impact of food (Figure 14) (footnote 10). The factors thought to have most environmental impact were the transportation of food (45%) and food packaging (44%). The use of chemicals and pesticides (40%), food waste (28%) and land management and/or deforestation (26%) were also considered as contributors to the environmental impact of food.
Figure 14. Factors thought to contribute most to the environmental impact of food
Source: Food and You 2: Wave 9
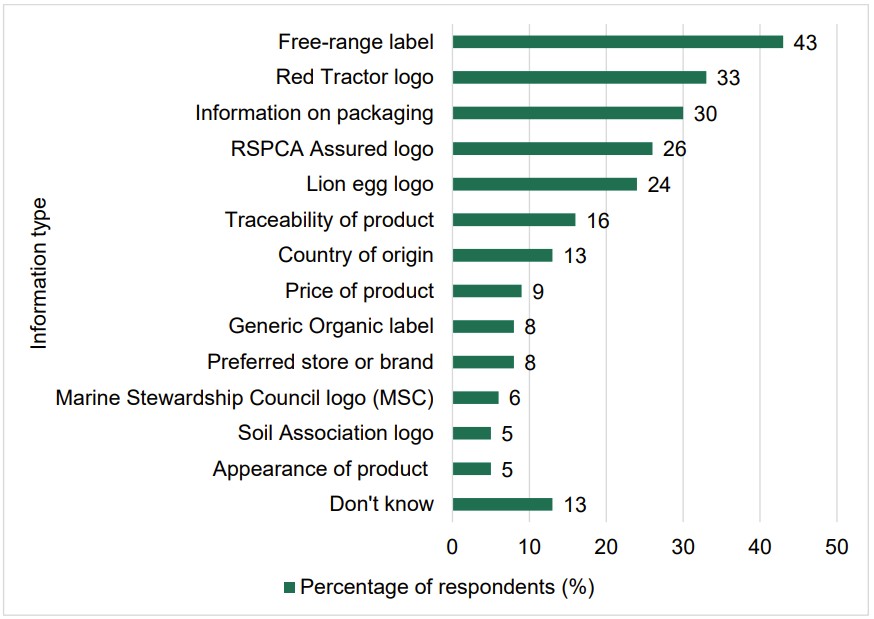
When respondents were asked, from a list of options, what would indicate whether a product containing meat, eggs or dairy had been produced with high standards of animal welfare, the most common indicator selected was a free-range label (43%) (Figure 15) (footnote 11). Other commonly selected indicators of animal welfare standards were the Red Tractor logo (33%), information on packaging (30%), the RSPCA Assured logo (26%) and the Lion Egg logo (24%). Around one in ten (13%) reported that they do not know what would indicate whether a product containing meat, eggs or dairy had been produced with high standards of animal welfare.
Figure 15. What would indicate high animal welfare standards of meat, eggs, and dairy products to respondents
Source: Food and You 2: Wave 9
Confidence in allergen labelling (footnote 12)
Food hypersensitivity is a term that refers to a bad or unpleasant physical reaction which occurs as a result of consuming a specific food. There are different types of food hypersensitivity including, food allergy, food intolerance and coeliac disease (footnote 13).
The FSA provides guidance for food businesses on providing allergen information to their customers. By law (footnote 14), food businesses in the UK must inform customers if they use any of the 14 most potent and prevalent allergens in the food and drink they provide (footnote 15).
The allergen labelling required differs depending on how food is being sold and the type of food being sold. If food is sold online, allergen information should be available to a customer before the purchase of the food is completed and when the food is delivered (footnote 16).
Respondents who go food shopping and consider the dietary requirements (allergy/intolerance) of themselves or someone else in the household when shopping were asked how confident they were that the information provided on food labelling allows them to identify foods that would cause a bad or unpleasant physical reaction (footnote 17). Of those, 84% stated that they were confident (very confident or fairly confident) in the information provided.
The same group of respondents (those who consider the dietary requirements of themselves/someone else in the household when shopping) were asked how confident they were in identifying foods that will cause a bad or unpleasant physical reaction when buying foods which are sold loose, such as at a bakery or deli-counter (footnote 18). Respondents who bought food loose were more confident in identifying these foods from supermarkets in-store (72%), from online supermarkets (62%), and when shopping at independent food shops (61%) compared to buying food from food markets or stalls (47%).
-
Nutrition standards and nutrition food labelling is the remit of the Department of Health and Social care in England and the Welsh Government in Wales.
-
Question: How often, if at all, do you…a) shop for food in store at a large supermarket b) shop for food in store at a mini supermarket (e.g., Local/ Metro). c) shop for food at independent greengrocers', butchers', bakers' or fishmongers'. d) shop for food at local/corner shops, newsagents' or garage forecourts. e) get a home delivery from a supermarket. f) shop for food at a local market, farmer's market or farm shop. g) get a recipe box delivered (e.g. Hello Fresh, Gousto). Responses: every day, most days, 2-3 times a week, about once a week, 2-3 times a month, about once a month, less than once a month, never, can’t remember, I don’t do any food shopping. Base= 3530, all online respondents.
-
Question: When shopping for food, how often, if at all, do you check…a) use-by dates. b) best before dates. c) list of ingredients. d) allergen information. e) nutritional information. f) country of origin. g) food assurance scheme logos. Responses: always, most of the time, about half the time, occasionally, never, don’t know. Base= 3304, all online respondents who ever do food shopping. Please note: allergy only base n=95*
-
Question: What is most important to you when you are choosing which foods to buy? Responses: price/value for money, quality, freshness, taste, appearance of food, healthiness, use-by date/how long it will keep for, country of origin, ingredients, that it is ethical or eco-friendly, farming methods for example, organic or free-range farming, how it is made or how it is produced, choice/availability/variety, buying what my household/ children want, trust in supplier, safety of product, convenience/how easy it is to cook or prepare, other, don’t know. Base= 5526, all respondents.
-
Question: What do you use to judge the quality of food? Responses: taste, appearance, country of origin, convenience, ingredients, animal welfare, freshness, assurance schemes, brand, price, environmental impact, other. Base= 5526, all respondents.
-
Question: How important is it to you…a) to buy food that was produced in Britain [if Northern Ireland: UK and Ireland] b) to buy drink that was produced in Britain [if Northern Ireland: UK and Ireland] c) to buy meat, eggs and dairy which are produced with high standards of animal welfare. d) to buy food which has a low environmental impact. Responses: very important, somewhat important, not very important, not at all important, don't know. Base= 5526, all respondents.
-
Question: When purchasing food, how often do you do the following…a) check for information on animal welfare. b) check for information on environmental impact. Responses: always, most of the time, about half the time, occasionally, never, don't know. Base=5157, all online respondents and those answering the England & Wales postal questionnaire.
-
Question: How often do you do the following, where possible? A) Buy food produced in Britain [If Northern Ireland: ‘the UK and Ireland’]? B) Buy meat, eggs and dairy which has information on animal welfare. C) Buy food which has a low environmental impact. Responses: Always, Most of the time, About half the time, Occasionally, Never, Don't know. Base= 5526, all respondents.
-
Question: To what extent do you agree or disagree with the following? a) meat, eggs and dairy products show enough information about animal welfare. b) food products show enough information about their environmental impact c) food products show enough information about their country of origin. Responses: strongly agree, agree, neither agree nor disagree, disagree, strongly disagree, don't know. Base= 4634, all online respondents and those answering the version A postal questionnaire.
-
Question: What do you think contributes to the environmental impact of food? Responses: food packaging, chemicals or pesticides, transportation of food, land management/deforestation, food waste, production of meat, the way in which crops are grown, food processing, consumer demand/trends, water usage, other, don’t know. Base= 5526, all respondents.
-
Question: What would indicate to you whether a product containing meat, eggs or dairy had been produced with high standards of animal welfare? Responses: freerange label, information on packaging, country of origin, traceability of product, preferred store or brand, appearance of product, price of product, generic organic label, Red Tractor logo, RSPCA assured logo, Lion egg logo, Soil Association logo, Marine Stewardship (MSC) logo, other certification/logo [open text], other [open text], don’t know. Base= 5526, all respondents.
-
Other questions on food hypersensitivities are reported in Chapter 5 (Online Platforms). Please note that not all questions are included in this report.
-
FSA Explains: Food hypersensitivities. Overview: Food Allergy, NHS. Food Intolerance, NHS. Overview: Coeliac disease, NHS.
-
42 Regulation (EU) No 1169/2011 of the European Parliament and of the Council of 25 October 2011.
-
Allergens: celery, cereals containing gluten (such as barley and oats), crustaceans (such as prawns, crabs and lobsters), eggs, fish, lupin, milk, molluscs (such as mussels and oysters), mustard, peanuts, sesame, soybeans, sulphur dioxide and sulphites and tree nuts (such as almonds, hazelnuts, walnuts, brazil nuts, cashews, pecans, pistachios and macadamia nuts).
-
Question: How confident are you that the information provided on food labels allows you to identify foods that will cause you, or another member of your household, a bad or unpleasant physical reaction? Responses: very confident, fairly confident, not very confident, not at all confident, it varies from place to place, don't know. Base= 2072, all online respondents and those answering version A of the postal questionnaire who consider the dietary requirements (allergy or intolerance) of themselves/someone else in the household when shopping.
-
Question: When buying food that is sold loose (e.g. at a bakery or deli counter), how confident are you that you can identify foods that will cause you or another member of your household a bad or unpleasant physical reaction? Consider food sold loose from the following sources…a) supermarkets in store. b) supermarkets online. c) independent food shops. d) food markets/stalls. Responses: very confident, fairly confident, not very confident, not at all confident, it varies from place to place, don't know. Base a=1552, b=1164, c=1368, d=1354, all online respondents who consider the dietary requirements (allergy or intolerance) of themselves/someone else in the household when shopping, excluding `I don't buy food from here'/`I don't buy food sold loose'.
Introduction
An online food platform is a technology business that facilitates the exchange of food between vendor(s) and consumer(s). Any business selling food online, including food delivery businesses (footnote 1), must be registered as a food business. The FSA provides guidance for food businesses, which use online platforms (footnote 2). A food safety officer from the local authority will inspect a business to check that it follows food hygiene law so that the food is safe to eat.
Food and You 2 asks respondents about their use and experiences with different types of food-related online platforms. A range of online platforms were asked about including food business and delivery websites, food sharing apps and social media marketplaces.
This chapter provides an overview of respondents’ use of online platforms, including how frequently people use online platforms to buy food or drink, and the types of food and drink people order. It also provides information on people’s awareness and use of food hygiene ratings and allergen information on online platforms.
Which online platforms are used to order food or drink online?
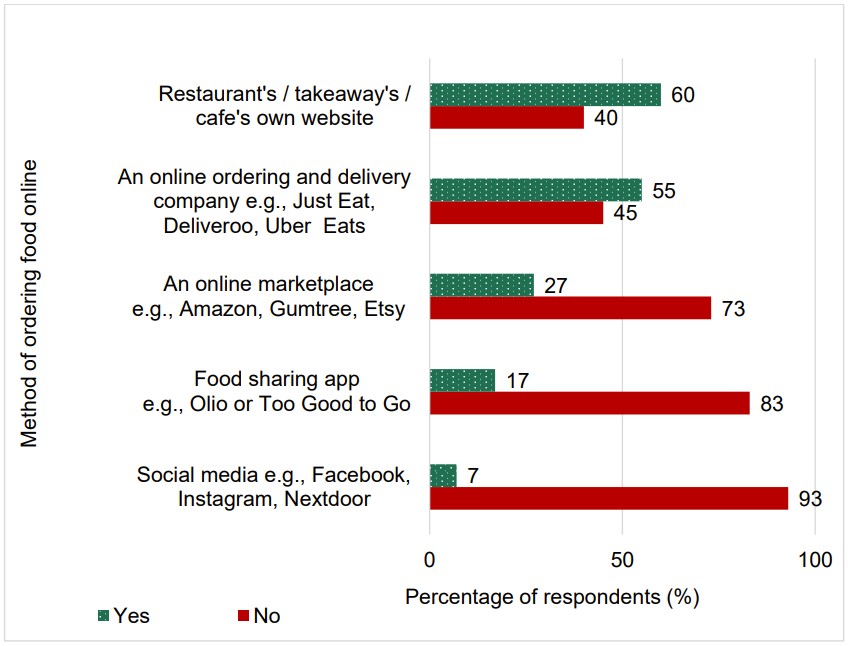
Respondents were asked to indicate if they had ever ordered food or drink online from a number of different platforms. Six in ten respondents (60%) reported that they had ordered food or drink from the websites of a restaurant, takeaway or café and just over half of respondents had ordered from an online ordering and delivery company (for example, Just Eat, Deliveroo, Uber Eats) (55%). Around three in ten respondents (27%) had ordered via an online marketplace (for example Amazon, Gumtree, Etsy). The platforms used least by respondents were food sharing apps (for example Olio, Too Good To Go) (17%) and social media platforms (for example, Facebook, Instagram, Nextdoor) (7%) (Figure 16) (footnote 3).
Use of online marketplaces (for example Amazon, Gumtree, Etsy) to order food or drink varied between different categories of people in the following ways:
- age group: younger adults were more likely to have ordered food or drink from an online marketplace compared to older adults. For example, 33% of those aged 16- 24 years had ordered food or drink from an online marketplace compared to those aged 65-74 years (13%) and those aged 75 and above (7%)
- household size: respondents who lived in larger households were more likely to have ordered food or drink from an online marketplace than those living in smaller households. For example, 16% of those living in 1-person households had ordered food or drink from an online marketplace compared to 34% of those in households of 4-persons and 34% of those in households of 5-person or more
- children under 16 years in the household: 34% of those with children under 16 years in the household had ordered food or drink from an online marketplace compared to 24% of those without children under 16 years
- children under six years in the household: 35% of those with children under six years in the household had ordered food or drink from an online marketplace compared to 26% of those without children under six years
- annual household income: respondents with incomes less than £19,000 (33%) were more likely to have ordered food or drink from an online marketplace than households with incomes between £32,000-£63,999 (25%)
- food security: respondents with low (40%) or very low (38%) food security were more likely to have ordered food or drink from an online marketplace than those with marginal (27%), or high (23%) food security
- responsibility for food shopping: those who shop for food (28%) were more likely to have ordered food or drink from an online marketplace than those who never shop (15%)
Use of social media (for example, Facebook, Instagram, Nextdoor) to order food or drink varied between different categories of people in the following ways:
- age group: adults under 45 years were more likely to have ordered food or drink from social media than older adults. For example, 15% of those aged 25-34 years and 12% of those aged 35-44 years had ordered food or drink from social media compared to 2% of those aged 75 years or over
- food security: those who were less food secure were more likely to have ordered food or drink from social media. For example, 20% of those with very low food security had ordered food or drink from social media compared to 4% of those with high food security
Use of food sharing apps (for example Olio, Too Good To Go) to order food or drink varied between different categories of people in the following ways:
- age group: younger adults were more likely to have ordered food or drink from a food sharing app than older adults. For example, 27% of adults aged 16-24 years had ordered food or drink from a food sharing app compared to 6% of those aged 75 years or over
- household size: respondents who lived in larger households were more likely to have ordered food or drink from a food sharing app than those who lived in smaller households. For example, 32% of those who lived in households of 5- persons or more had ordered food or drink from a food sharing app compared to 9% of those in 1-person households
- NS-SEC: respondents who were long term unemployed and/or had never worked (27%) were more likely to have ordered food or drink from a food sharing app than those in occupations (for example, 12% intermediate occupations and 10% lower supervisory and technical occupations)
- food security: those who had marginal (20%), low (23%) or very low (27%) food security were more likely to have ordered food or drink from a food sharing app than those with high food security (13%)
Figure 16. Where respondents order food and drink online
Source: Food and You 2: Wave 9.
What do individuals order online from a restaurant, take-away or café’s own website?
Respondents who ordered food or drink from a restaurant, take-away or café’s own website were most likely to order prepared cooked meals or snacks (90%), baked goods and desserts (19%) and milkshakes/ice creams (14%) (footnote 4). Similarly, those who ordered food or drink from an online ordering and delivery company were most likely to order prepared cooked meals or snacks (93%), baked goods and desserts (19%) and milkshakes/ice creams (19%) (footnote 5).
How often do respondents order food or drink through online platforms?
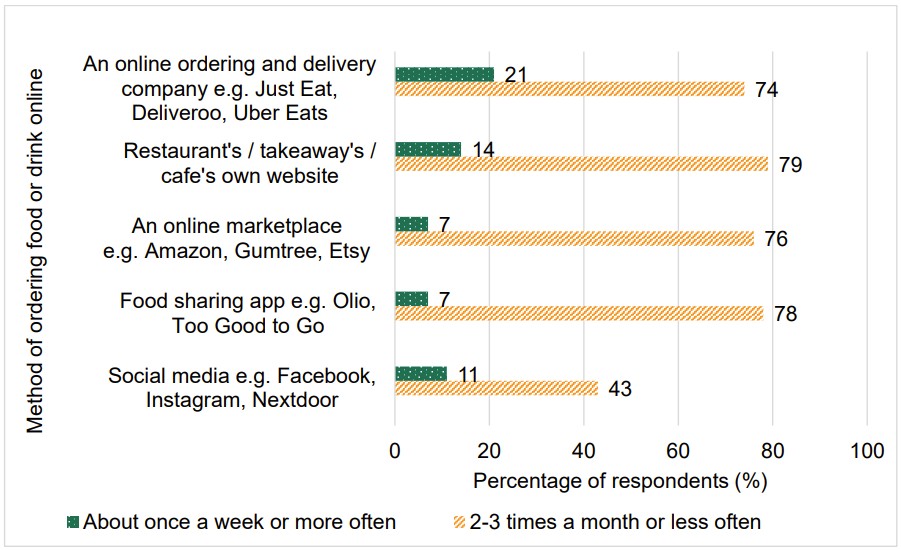
Respondents who had ordered food or drink from a range of online platforms were asked how frequently they ordered food or drink from that platform. Most respondents ordered food or drink from each type of online platform 2-3 times a month or less often, with a minority using these types of platforms about once a week or more often. For example, a fifth (21%) of respondents ordered food or drink from an online ordering and delivery company (for example, Just Eat, Deliveroo, Uber Eats) about once a week or more often, whilst 74% of respondents did this 2-3 times a month or less often. Nearly half (46%) of respondents reported that they couldn’t remember how often they ordered food or drink from a social media platform (e.g., Facebook, Instagram, Nextdoor) (Figure 17) (footnote 6).
Figure 17. How often respondents order food or drink from different online platforms
Source: Food and You 2: Wave 9
Use of FHRS on online platforms The Food Hygiene Rating Scheme (FHRS) helps people make informed choices about where to eat out or shop for food by giving clear information about the businesses’ hygiene standards. Businesses are given a rating from 0 to 5. A rating of 5 indicates that hygiene standards are very good and a rating of 0 indicates that urgent improvement is required. The FSA runs the scheme in partnership with local authorities in England, Wales, and Northern Ireland.
Respondents who had ordered food or drink through an online platform and had heard of the FHRS were asked how often they look for FHRS ratings when ordering food and drink online. Almost half of respondents (47%) ‘always’ or ‘most of the time’ looked for the FHRS ratings, 30% of respondents did this about half of the time or occasionally, and 21% of respondents never looked for the FHRS rating when ordering food and drink online (footnote 7).
Respondents who reported looking for FHRS ratings when ordering food or drink online were asked how often the ratings were easy to find. Half of respondents (50%) reported that the ratings were ‘always’ or ‘most of the time’ easy to find, 38% reported that the ratings were easy to find about half the time or occasionally, and 4% reported that the ratings were never easy to find (footnote 8).
Hypersensitivities and use of online platforms
Respondents who have a food hypersensitivity, and/or live with someone who has a food hypersensitivity, were asked how often they look for information which allows them to identify food that may cause a bad or unpleasant reaction when ordering food or drink online. Of those, a fifth (20%) reported that they always look for information that would allow them to identify food that might cause them a bad or unpleasant reaction, and 40% of respondents look for this information less often (i.e., ‘most of the time’, ‘about half of the time’, ‘occasionally’). However, 36% reported that they never look for information that would allow them to identify food that might cause a bad or unpleasant reaction when ordering food or drink online (footnote 9).
Of those respondents who look for information online that allows them to avoid food that may cause a bad or unpleasant physical reaction, half (48%) reported that this was always or most of the time easy to find whilst 30% reported that this information was occasionally or never easy to find (footnote 10). Of those who find allergen information when looking for this online, six in ten (60%) reported that this information was always or most of the time easy to understand (footnote 11).
-
Advice to businesses selling food online, FSA. Regulation (EC) no 178/2002 of the European parliament and of the council of 28 January 2002.
-
Distance selling, mail order and delivery, FSA. Food safety for food delivery, FSA.
-
Question: Have you ever ordered food or drink online through...? a) a restaurant's, cafe's or takeaway's own website. b) an online ordering and delivery company e.g. Just Eat, Deliveroo or Uber Eats, etc. c) an online marketplace, e.g. Amazon, Gumtree, Etsy, etc. d) social media, e.g. Facebook, Instagram, Nextdoor, etc. e) a food sharing app, e.g. Olio or Too Good To Go, etc. Responses: yes, no. Base= 3530, all online respondents.
-
Question: In the last 12 months, what food or drink have you ordered online directly through a restaurant’s, café’s or takeaway’s own website? Responses: prepared cooked meals or snacks, baked goods and desserts, such as cheesecakes, cakes, biscuits, breads etc or dough/mixes to make these, milkshakes / ice creams, protein shakes, fresh fruit or vegetables (uncooked), dairy products, such as milk, cheese, yoghurt, butter etc, alcoholic drinks, such as beer, wine, spirits, cocktails, non-alcoholic drinks, other (please specify). Base 1,879, all online respondents who have ever ordered food or drink online through this platform/website, excluding those who cannot remember what they purchased.
-
Question: In the last 12 months, what food or drink have you ordered online through an online ordering and delivery company (e.g., Just Eat, Deliveroo or Uber Eats etc.?) Responses: prepared cooked meals or snacks, baked goods and desserts, such as cheesecakes, cakes, biscuits, breads etc or dough/mixes to make these, milkshakes/ ice creams, protein shakes, fresh fruit or vegetables (uncooked), dairy products, such as milk, cheese, yoghurt, butter etc, sweets and chocolates, alcoholic drinks, such as beer, wine, spirits, cocktails, non-alcoholic drinks, other (please specify). Base 1603, all online respondents who have ever ordered food or drink online through this platform/website, excluding those who cannot remember what they purchased.
-
Question: How often do you order food or drink online...? A) a restaurant's, cafe's or takeaway's own website. b) an online ordering and delivery company e.g. Just Eat, Deliveroo or Uber Eats, etc. C) an online marketplace, e.g. Amazon, Gumtree, Etsy, etc. d) social media, e.g. Facebook, Instagram, Nextdoor, etc. e) a food sharing app, e.g. Olio or Too Good to Go, etc. Responses: every day, most days, 2-3 times a week, about once a week, 2-3 times a month, about once a month, less than once a month, never, can’t remember. Base A= 2006, B= 1682, C= 920, D= 223, E= 487, all online respondents.
-
Question: When you order food and drink online, how often do you look for Food Hygiene Rating Scheme (FHRS) ratings? Responses: always, most of the time, about half of the time, occasionally, never, don’t know. Base= 2317, all online respondents who have ordered food and drink online and have heard of the Food Hygiene Rating Scheme (FHRS).
-
Question: When you look for FHRS ratings when ordering food and drink online, how often are they easy to find? Responses: always, most of the time, about half of the time, occasionally, never, don’t know. Base= 1796, all online respondents who look for Food Hygiene Rating Scheme ratings when ordering food or drink online.
-
Question: When you order food and drink online, how often do you look for information that allows you to identify food that might cause you or another member of your household a bad or unpleasant physical reaction? Responses: always, most of the time, about half of the time, occasionally, never, don’t know, I don’t order food and drink online. Base= 2101, all online respondents who have ordered food or drink online and who suffer from a bad or unpleasant physical reaction after consuming certain foods or avoid certain foods because of the bad or unpleasant physical reaction they might cause, and/or live with at least one other adult or child in their household.
-
Question: When ordering food and drink online and you look for information that allows you to identify food that might cause you or another member of your household a bad or unpleasant physical reaction, how often, if at all, is this information easy to find? Responses: always, most of the time, about half of the time, occasionally, never, don’t know. Base= 1255, all online respondents who have ordered food or drink online, look for allergen information when ordering food or drink online, and who suffer from a bad or unpleasant physical reaction after consuming certain foods or avoid certain foods because of the bad or unpleasant physical reaction they might cause, and/or live with at least one other adult or child in their household.
-
Question: When ordering food and drink online and you find information that allows you to identify food that might cause you or another member of your household, a bad or unpleasant physical reaction, how often, if at all, is this information easy to understand? Responses: always, most of the time, about half of the time, occasionally, never, don’t know. Base= 1134, all online respondents who have ordered food or drink online, look for allergen information when ordering food or drink online, find allergen information when ordering food or drink online, and who suffer from a bad or unpleasant physical reaction after consuming certain foods or avoid certain foods because of the bad or unpleasant physical reaction they might cause, and/or live with at least one other adult or child in their household.
Introduction
The FSA is responsible for protecting the public from foodborne diseases. This involves working with farmers, food producers and processors, and the retail and hospitality sectors to ensure that the food people buy is safe. The FSA gives practical guidance and recommendations to consumers on food safety and hygiene in the home.
The Food and You 2 survey asks respondents about their food-related behaviours in the home, including whether specific foods are eaten, and knowledge and reported behaviour in relation to five important aspects of food safety: cleaning, cooking, chilling, avoiding cross-contamination and use-by dates. Food and You 2 also asks respondents about the frequency they prepare or consume certain types of food.
Two versions of the ‘Eating at home’ module have been created; a ‘core’ module which includes a limited number of key questions which are fielded annually, and a ‘deep dive’ module which includes additional questions and is fielded every 2 years. This chapter reports on the deep dive ‘Eating at home’ module (footnote 1).
This chapter provides an overview of respondents’ knowledge and reported behaviours relating to food safety and other food-related behaviours.
Cleaning
Handwashing in the home
The FSA recommends that everyone should wash their hands before they prepare, cook or eat food, after handling raw food and before preparing ready-to-eat food.
Whilst most respondents (70%) reported that they always wash their hands before preparing or cooking food, 29% reported that they do this most of the time or less often, and 1% reported never doing this (footnote 2).
Most respondents (92%) reported that they always wash their hands immediately after handling raw meat, poultry, or fish, 8% reported that they do this most of the time or less often (footnote 3).
Just under half of respondents (47%) reported that they always wash their hands before eating, 50% reported doing this most of the time or less often, and 2% reported never washing their hands before eating.
Handwashing when eating out
Respondents were asked, how often, if at all, they washed their hands or used hand sanitising gel or wipes before eating outside of their home. Around a third of respondents (31%) reported that they always washed their hands, used hand sanitising gel or wipes when they ate outside of their home, 59% did this most of the time or less often and 9% never did this (footnote 4).
Chilling
The FSA provides guidance on how to chill food properly to help stop harmful bacteria growing.
If and how respondents check refrigerator (fridge) temperature
When asked what temperature the inside of a fridge should be, 59% of respondents who have a fridge, reported that it should be between 0-5 degrees Celsius, as recommended by the FSA. A fifth of respondents (20%) reported that the temperature should be above 5 degrees, 3% reported that the temperature should be below 0 degrees, and 17% of respondents did not know what temperature the inside of their fridge should be (footnote 5).
Over half of respondents (57%) who have a fridge reported that they monitored the temperature or relied on an alarm to alert them to a temperature that is too warm or too cold (footnote 6). Of the respondents who monitor the temperature of their fridge, around half (48%) reported that they check the temperature of their fridge at least once a week or more often, as recommended, while 2% reported that they never check or check less often than once a year (footnote 7). Amongst those who check, most respondents checked the temperature of their fridge using a thermometer, the settings/gauge or built in display (86%), however 12% checked for ice/condensation or felt the food inside to check if it’s cold (footnote 8).
Defrosting
The FSA recommends that food is defrosted in the fridge, or, if this is not possible to use a microwave on the defrost setting. The FSA advises consumers not to defrost foods at room temperature.
Respondents were asked which method they typically use to defrost meat and fish. Around four in ten respondents (43%) reported that they defrost meat or fish in the fridge and 6% reported that they use a microwave. Around four in ten (42%) reported that they leave the meat or fish at room temperature and 6% leave the meat or fish in water (footnote 9).
Cooking
The FSA recommends that cooking food at the right temperature and for the correct length of time will ensure that any harmful bacteria are killed. When cooking pork, poultry, and minced meat products the FSA recommends that the meat is steaming hot and cooked all the way through, that none of the meat is pink and that any juices run clear.
Most respondents (80%) reported that they always cook food until it is steaming hot and cooked all the way through, however 20% reported that they do not always do this (footnote 10).
Respondents were asked to indicate how often they eat different types of meat when the meat is pink or has pink juices. Around nine in ten respondents reported that they never eat sausages (94%), chicken or turkey (92%), or whole cuts of pork or pork chops (91%) when it is pink or has pink juices. Around two-thirds of respondents reported that they never eat duck (68%) or beef burgers (66%) when it is pink or has pink juices; but around a third reported that they do eat these at least occasionally (29% of those eating duck, and 33% of those eating beef or beef burgers). Around two-thirds of respondents (65%) reported eating red meat when it is pink or has pink juices at least occasionally (Figure 18) (footnote 11).
Figure 18. How often respondents eat different types of meat when it is pink or has pink juices
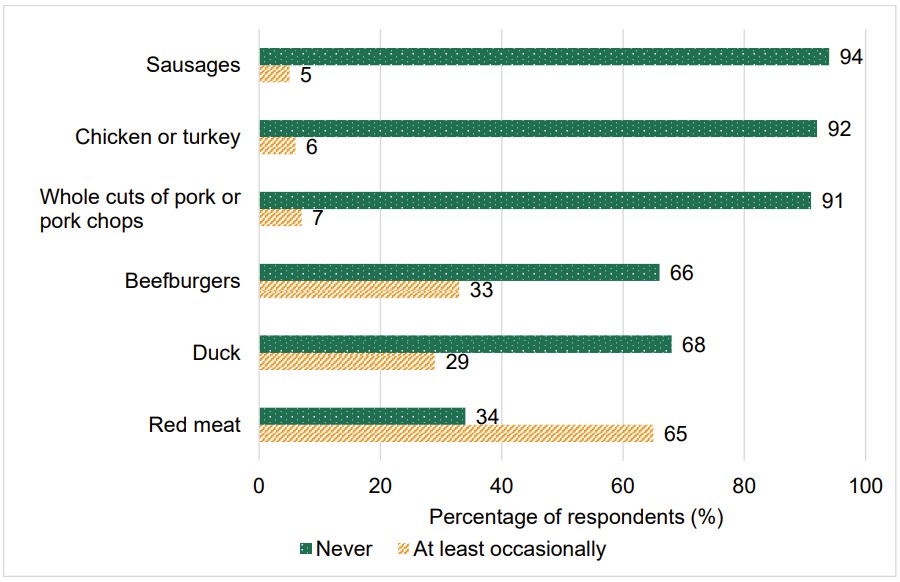
Source: Food and You 2: Wave 9
Respondents were asked how often, if at all, they consume raw oysters or raw (unpasteurised) milk. Most respondents reported that they never eat raw oysters (85%) or unpasteurised/raw milk (89%) (footnote 12).
Respondents were asked how often they follow packaging instructions when preparing frozen fruit and vegetables. Around a third (35%) reported that they always follow packaging instructions, 24% reported doing this most of the time and 15% reported that they never do this (footnote 13).
Reheating
Respondents were asked to indicate how they check food is ready to eat when they reheat it. The most common method was to check the middle is hot (54%), and the least common methods were to put a hand over the food or touch the food (17%) or use a thermometer or probe (12%) (Figure 19) (footnote 14).
Figure 19. How respondents check whether reheated food is ready to eat
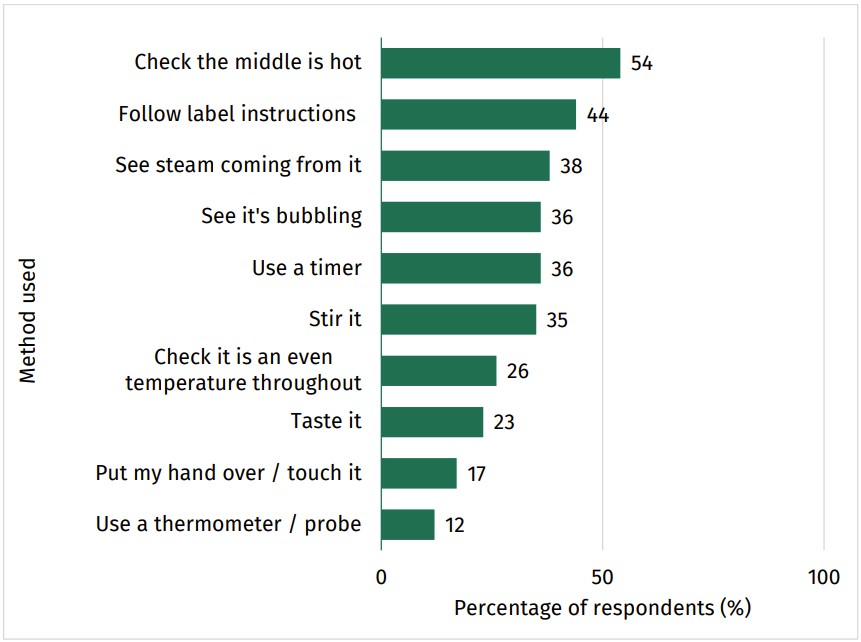
Source: Food and You 2: Wave 9
The FSA recommends that food is only reheated once. When respondents were asked how many times they would reheat food, the majority reported that they would only reheat food once (83%), 10% would reheat food twice, and 3% would reheat food more than twice (footnote 15).
Leftovers
FSA advice is to cool and store leftovers in the fridge within 2 hours of cooking. Leftovers should be eaten within 48 hours, or frozen.
Respondents were asked what they do with leftovers following a meal. The majority of those who reported having leftovers (71%) stated that they would put them in the fridge, and 9% stored them in the freezer. A minority reported leaving them at room temperature to eat the same day (2%), or the next day (3%) (Figure 20) (footnote 16).
Figure 20. What respondents do with leftovers following a meal
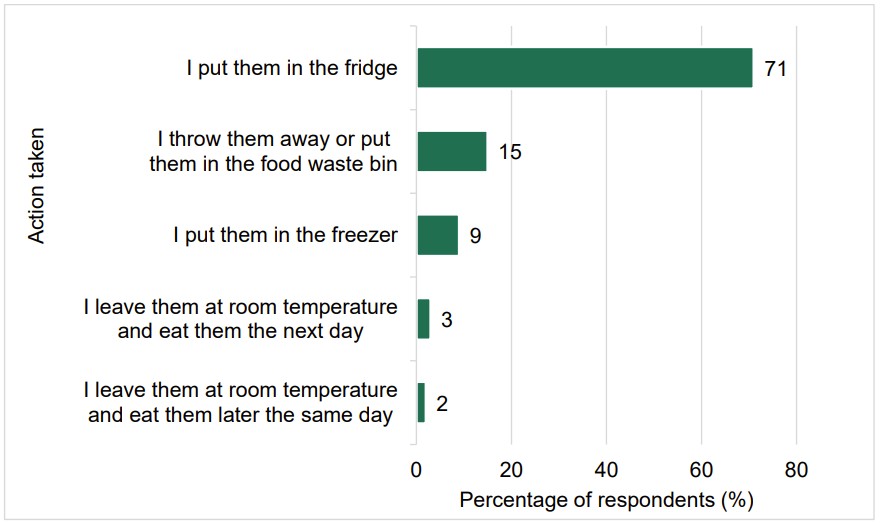
Source: Food and You 2: Wave 9
Respondents who reported that they put leftovers in the fridge or freezer were asked to indicate how soon after cooking they would typically put leftovers into the fridge or freezer. Most respondents reported that they typically placed leftovers in the fridge or freezer within one hour (34%) or one to two hours of cooking (43%). Around a fifth of respondents (18%) put leftovers in the fridge or freezer after more than two hours, and 5% would put leftovers in the fridge or freezer straight away (footnote 17).
Respondents were asked the latest that they would consume leftovers that had been stored in the fridge. Two-thirds of respondents (66%) reported that they would eat leftovers within 2 days, 25% of respondents reported that they would eat leftovers within 3-5 days and 2% would eat leftovers more than 5 days later (footnote 18).
Avoiding cross-contamination
The FSA provides guidelines on how to avoid cross-contamination. The FSA recommends that people do not wash raw meat, fish or poultry. Washing raw meat, fish and poultry can splash harmful bacteria onto hands, work surfaces, ready-to-eat foods and cooking equipment.
Around four in ten respondents reported that they wash raw fish or seafood (40%) or raw chicken (38%) at least occasionally. Around three in ten (28%) reported that they wash raw lamb, beef or pork at least occasionally, and a quarter of respondents (25%) reported that they wash raw duck, goose or turkey at least occasionally (Figure 21) (footnote 19).
Figure 21. How often respondents wash different types of raw meat or fish
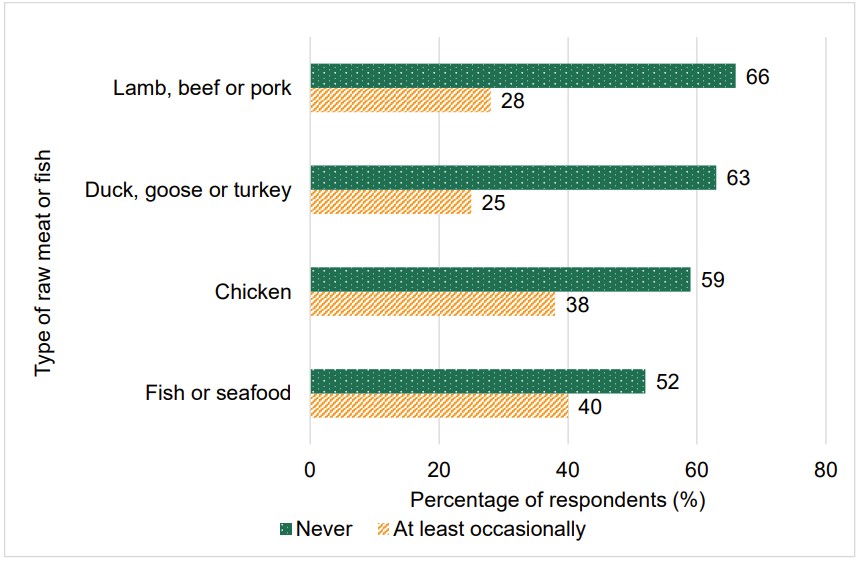
Source: Food and You 2: Wave 9
Chopping board use
Respondents were asked how they use chopping boards when they prepare raw meat and other foods. Around half of respondents (54%) reported that they use different chopping boards for raw meat and other foods and 35% of respondents reported that they wash the chopping board between preparing raw meat and other foods. Fewer respondents reported using the same chopping board (without washing) (8%) or turning the chopping board over between preparing raw meat and other foods (3%) (footnote 20).
Respondents who use the same chopping board to prepare raw meat and other foods were asked in which order they prepare the foods. Over a half of respondents (55%) reported that they prepare other foods before raw meat. Around a quarter of respondents (23%) reported that they prepare raw meat before other foods and 21% of respondents reported that they don’t think about the order in which they prepare foods (footnote 21).
How and where respondents store raw meat and poultry in the fridge
The FSA recommends that refrigerated raw meat and poultry are kept covered, separately from ready-to-eat foods and stored at the bottom of the fridge to avoid cross-contamination.
Respondents were asked to indicate, from a range of responses, how they store raw meat and poultry in the fridge. Respondents were most likely to report storing raw meat and poultry in its original packaging (63%) or away from cooked foods (43%). Around a third of respondents reported storing raw meat and poultry in a sealed container (33%) and covered raw meat and poultry with film/foil (29%), with 13% keeping the product on a plate (footnote 22).
Most respondents (60%) reported only storing raw meat and poultry at the bottom of the fridge, as recommended by the FSA. However, 24% of respondents reported storing raw meat and poultry wherever there is space in the fridge, 11% reported storing raw meat and poultry in the middle of the fridge, and 6% at the top of the fridge (footnote 23).
Using separate shopping bags
Around a fifth of respondents (22%) reported always using a separate shopping bag for raw meat, fish or shellfish (away from other food items) as recommended by the FSA. However, a larger proportion (27%) reported that they never do this (footnote 24).
Use-by and best before dates
Respondents were asked about their understanding of the different types of date labels and instructions on food packaging, as storing food for too long or at the wrong temperature can cause food poisoning. Use-by dates relate to food safety. Best before (BBE) dates relate to food quality.
Respondents were asked to indicate which date shows that food is no longer safe to eat. Around two-thirds of respondents (67%) correctly identified the use-by date as the information which shows that food is no longer safe to eat. However, 9% of respondents identified the best before date as the date which shows food is no longer safe to eat (footnote 25).
Around six in ten respondents (62%) reported that they always check use-by dates before they cook or prepare food, 34% reported checking use-by dates most of the time or less often, and 2% reported never checking use-by dates (footnote 26).
Respondents who eat particular foods were asked when, if at all, is the latest that they would eat the type of food after the use-by date. Most respondents reported that they would not eat shellfish (74%), or other fish (64%) past the use-by date. Around half of respondents would not eat raw meat (53%) or smoked fish (51%) past the use-by date. Bagged salad (72%) and cheese (70%) were the foods respondents were most likely to report eating at any point after the use-by date. Around six in ten respondents would eat yoghurt (63%), milk (60%), or cooked meats (58%) at any point after the use-by date (Figure 22) (footnote 27).
Figure 22. How long after the use-by date respondents would consume different foods
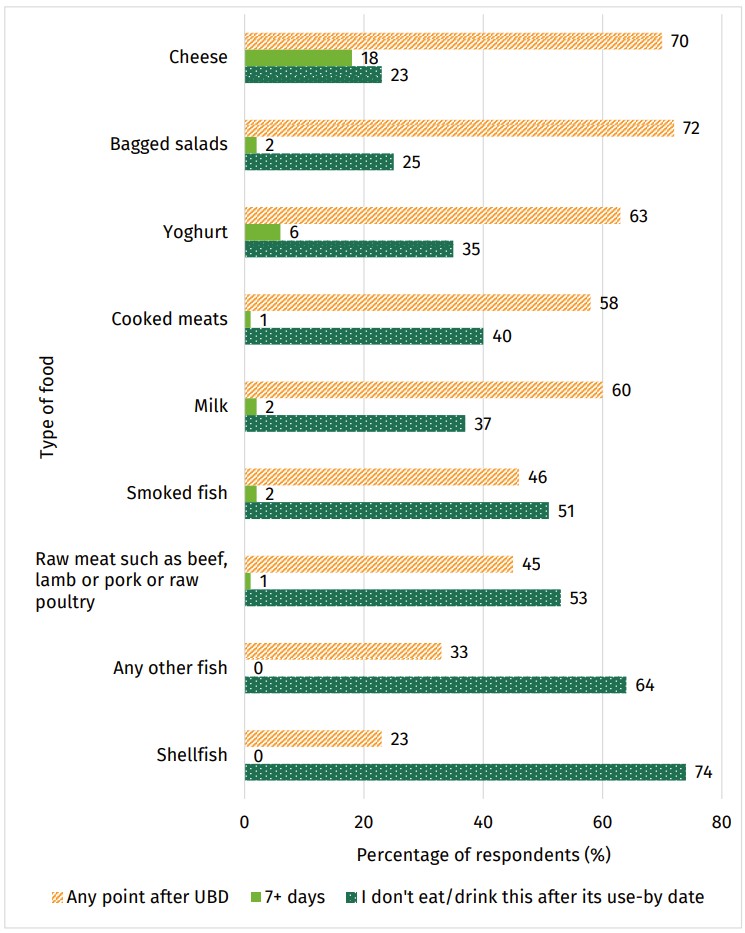
Source: Food and You 2: Wave 9
Respondents were asked what they usually do with food they have bought which is about to go out of date. The majority of respondents reported that they would usually either eat the food (35%) or freeze it by the use-by date (29%). Fewer respondents would throw away the food after the use-by date (12%) or keep it and eat it after the use-by date (7%), however, 15% of respondents reported that it varies too much to say (footnote 28).
Respondents were asked to indicate how they tell whether different foods are safe to eat or cook with. The method which respondents used to assess whether food is safe to eat or cook varied by food type. Smell was most often used to assess raw meat (76%) and milk and yogurt (73%). Respondents most often relied on the use-by date to assess whether fish (75%) and dried or cured meats (66%) were safe to eat or cook with. How the food smells (65% for fish and 50% for dried and cured meats) and how it looks (47% for fish and 47% for dried and cured meats) were also commonly used to assess these items. Eggs were typically assessed using the best before date (59%) and cheese was most often assessed by how it looks (66%) (Figure 23) (footnote 29).
Figure 23. How respondents tell whether different foods are safe to eat or cook with
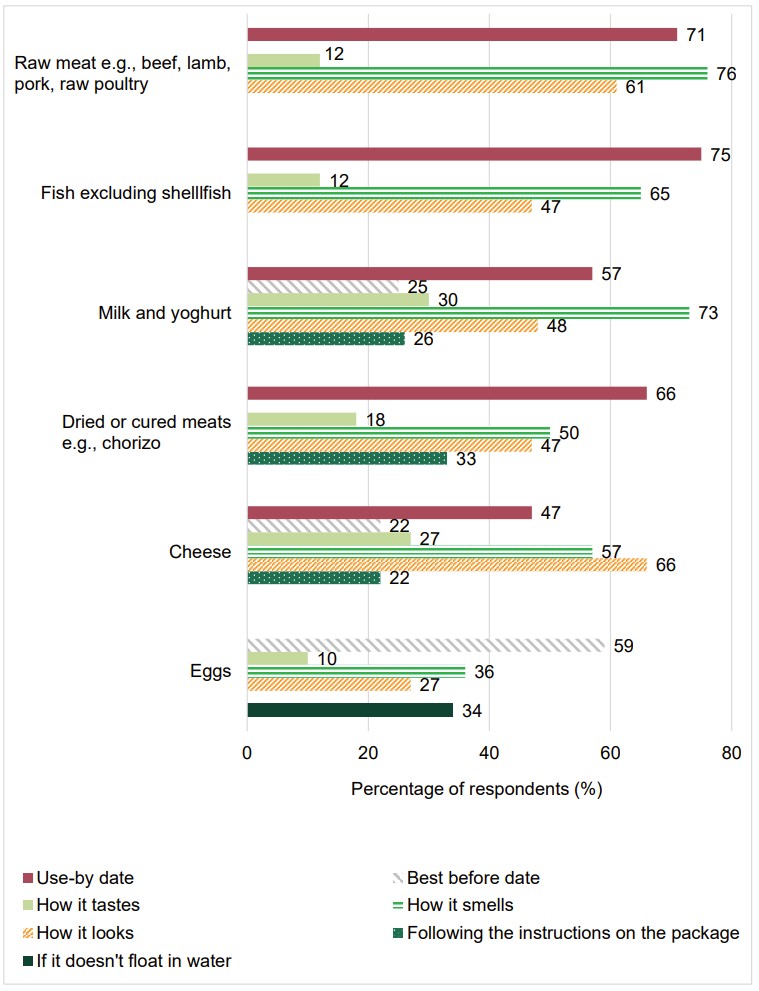
Source: Food and You 2: Wave 9 (footnote 30)
‘Eat within’ information
Some foods have instructions on the label which advise that the food should be eaten within a few days of opening. Respondents were asked to indicate how often they follow this recommendation. Around a quarter of respondents (26%) reported that they always follow the on-pack instruction. However, most respondents (68%) reported that they do not always (most of the time, about half the time or occasionally) follow the on-pack instructions and 6% reported that they never do this (footnote 31).
-
The deep dive ‘Eating at home’ module was last reported in the Food and You 2: Wave 5 Key Findings report. The core module was last reported in the Food and You 2: Wave 8 Key Findings report.
-
Question: When you are at home, how often, if at all, do you wash your hands before starting to prepare or cook food. Responses: always, most of the time, about half the time, occasionally, never, don’t know. Base= 4307, all online respondents and all those who completed Version A of the postal questionnaire, who ever do some food preparation or cooking for their household.
-
Question: When you are at home, how often, if at all, do you wash your hands immediately after handling raw meat, poultry or fish. Responses: always, most of the time, About half the time, Occasionally, Never, I don’t cook meat, poultry or fish, Don’t know. Base= 4111, all online respondents and those who completed Version A of the postal questionnaire who ever do some food preparation or cooking for their household, excluding `I don't cook meat, poultry or fish' and 'not stated'. 67 Question: When you are at home, how often, if at all, do you wash your hands before eating. Responses: always, most of the time, about half the time, occasionally, never, don’t know. Base= 4634, all online respondents and those who completed Version A of the postal questionnaire.
-
Question: When eating outside of the home, how often, if at all, do you wash your hands, or use hand sanitising gel or wipes before eating? Responses: always, most of the time, about half the time, occasionally, never, don’t know. Base= 4634, all online respondents, and those who completed Version A of the postal questionnaire
-
Question: What do you think the temperature inside your fridge should be? Responses: less than 0 degrees C (less than 32 degrees F), between 0 and 5 degrees C (32 to 41 degrees F), more than 5 but less than 8 degrees C (42 to 46 degrees F), 8 to 10 degrees C (47 to 50 degrees F), more than 10 degrees C (over 50 degrees F), other, don’t know. Base=5513, all respondents, excluding those who don't have a fridge. 70 Question: Do you, or anyone else in your household, ever check your fridge temperature? Responses: yes, no, I don't need to - it has an alarm if it is too hot or cold, don’t know. Base= 5501, all respondents, excluding those who don't have a fridge.
-
Question: Do you, or anyone else in your household, ever check your fridge temperature? Responses: yes, no, I don't need to - it has an alarm if it is too hot or cold, don’t know. Base= 5501, all respondents, excluding those who don't have a fridge.
-
Question: How often, if at all, do you or someone else in your household check the temperature of the fridge? Responses: at least daily, 2-3 times a week, once a week, less than once a week but more than once a month, once a month, four times a year, 1- 2 times a year, never/less often, don’t know. Base= 2663, all online respondents and all those who completed the `Eating at Home' questionnaire where someone in household checks fridge temperature.
-
Question: How do you (or someone else in your household) normally check the temperature? Responses: Check the setting / gauge, check the temperature display built into the fridge, put a thermometer in the fridge and check, check for ice or condensation, feel food inside to see if it is cold, don’t know, Other. Base= 2663, all respondents where someone in household checks fridge temperature.
-
Question: Typically, how do you defrost frozen meat or fish? Responses: place the meat or fish in water, leave the meat or fish at room temperature (e.g. on the worktop on a plate, in a container or in its packaging), leave the meat or fish in the fridge, defrost the meat or fish in the microwave oven, some other way, don’t know. Base= 3695, all online respondents and those who answered the version B postal questionnaire who ever do some food preparation or cooking for their household, excluding those who never defrost meat or fish.
-
Question: How often, if at all, do you cook food until it is steaming hot and cooked all the way through? Responses: always, most of the time, about half of the time, occasionally, never, don’t know. Base= 5109, all respondents who ever do some food preparation or cooking for their household.
-
Question: How often, if at all, do you eat...a=chicken or turkey, b=red meat, c=duck, d=beefburgers, e=sausages, f=whole cuts of pork or pork chops… when the meat is pink or has pink or red juices? Responses: always, most of the time, about half of the time, occasionally, never, don’t know. Base A=5079, B=3145, C= 2338, D=2982, E=3092, F=2882, all respondents who are not vegan, pescatarian or vegetarian, and who do eat A/B/C/D/E/F
-
Question: How often, if at all, do you eat...b = raw oysters/ c= raw (that is, unpasteurised) milk? Responses: about once a week or more often, about once a fortnight, about once a month, about once every 3 months, about once a year, less than once a year, never. Base B=5297, C= 5464, all online and postal respondents who are not…B= vegan or vegetarian / C = vegan.
-
Question: When preparing frozen vegetables or frozen fruit, how often do you follow instructions on the packaging? Responses: always, most of the time, about half the time, occasionally, never, I don’t use frozen vegetables or frozen fruit, don’t know. Base= 4079, All online respondents, and those who answered the version B postal questionnaire, who ever do some food preparation or cooking for their household.
-
Question: When reheating food, how do you know when it is ready to eat? (Select all that apply). Responses: I check the middle is hot, I follow the instructions on the label, I can see its bubbling, I use a timer to ensure it has been cooked for a certain amount of time, I check it's an even temperature throughout, I can see steam coming from it, I taste it, I stir it, I put my hand over it/touch it, I use a thermometer/probe, None of the above, I don't check. Base= 4877, all online and postal respondents who ever do some food preparation or cooking for their household, excluding ‘I don't reheat food' and ‘not stated'.
-
Question: How many times would you consider reheating food after it was cooked for the first time? Responses: not at all, once, twice, more than twice, don’t know. Base= 4890, all online and postal respondents who reheat food using one of the methods in the previous question.
-
Question: Generally, what do you do with any leftovers following a meal? Responses: I throw them away or put them in the food waste bin, I leave them at room temperature and eat them later the same day, I leave them at room temperature and eat them the next day, I put them in the fridge, I put them in the freezer. Base = 4,067, all online respondents and those answering the Postal B version of the questionnaire, excluding those who don’t have leftovers.
-
Question: Typically, how soon after cooking do you put any leftovers in the fridge or freezer? Responses: straight away, within 1 hour of cooking, 1 - 2 hours after cooking, more than 2 hours after cooking, don’t know. Base= 3239, all online respondents and those who completed version B of the postal questionnaire, who leave leftovers in a fridge or freezer.
-
Question: When is the latest you would consume any leftovers stored in the fridge? Responses: the same day, within 1-2 days, within 3-5 days, more than 5 days later, it varies too much, don't know. Base= 5526, all online and postal respondents.
-
Question: How often, if at all, do you do the following? a=wash raw chicken, b= wash raw duck, goose or turkey, c= wash raw lamb, beef or pork, d= wash raw fish or seafood. Responses: always, most of the time, about half of the time, occasionally, never, don’t know. Base = 5109, all respondents who ever do some food preparation or cooking for their household.
-
Question: Typically, how do you use chopping boards when preparing a meal with raw meat? Responses: I use a different chopping board for raw meat and other foods, I wash the chopping board between preparing raw meat and other foods, I turn the chopping board over between preparing raw meat and other foods, I use the same chopping board for preparing raw meat and other foods (without washing the board). Base= 3615, all online respondents and those who answered the version B postal questionnaire, who ever do some food preparation or cooking for their household, excluding those who don't use chopping boards or those who don't cook with raw meat.
-
Question: When you use the same chopping board to prepare raw meat and other foods, in which order do you prepare food? Responses: I prepare raw meat before other foods, I prepare other foods before raw meat, I don't think about the order I prepare foods, Don’t know. Base=210, all online respondents and all those who completed the version B postal questionnaire who do some food preparation or cooking and use the same chopping board to prepare meat and other foods without washing the board.
-
Question: How do you store raw meat and poultry in the fridge? Please select all that apply. Responses: away from cooked foods, covered with film/foil, in a sealed container, in its original packaging, on a plate. Base= 3984, all online respondents and all those who completed Version B of the postal questionnaire, except those who don't buy/store meat/poultry, don't store raw meat/poultry in the fridge, do not have a fridge or don't know.
-
Question: Where in the fridge do you store raw meat and poultry? Responses: wherever there is space, at the top of the fridge, in the middle of the fridge, at the bottom of the fridge. Base= 3905, all online respondent and all those who completed Version B of the postal questionnaire who store raw meat/poultry in the fridge except those who don't buy/store meat/poultry, don't have a fridge, or don't know.
-
Question: When shopping for raw meat, fish or shellfish, do you put it in a completely separate shopping or carrier bag away from other food items? Responses: yes, always; yes, most of the time; yes, about half of the time; occasionally; no, never; I never buy raw meat, fish or shellfish. Base= 3304, all online respondents who ever do food shopping.
-
Question: Which of these shows when food is no longer safe to eat? Responses: useby date, best before date, sell by date, display until date, all of these, it depends, none of these, don’t know. Base= 5526, all respondents (postal and online).
-
Question: How often, if at all, do you check use-by dates when you are about to cook or prepare food? Responses: always, most of the time, about half of the time, occasionally, never, it varies too much to say, don’t know. Base= 5109 all respondents (postal and online) who ever do some food preparation or cooking for their household.
-
Question: When, if at all, is the latest you would eat or drink the following items after their use-by date? a=cooked meats, b=smoked fish, c=bagged salads, d=cheese, e=milk, f= raw meat such as beef/pork/lamb/raw poultry, g=shellfish, h=any other fish, i=yoghurt. Responses: 1-2 days after the use-by date, 3-4 days after the use-by date, 5- 6 days after the use-by date, 1-2 weeks after the use-by date, more than 2 weeks after the use-by date, I don't eat/drink this after its use-by date, don't know/I don't ever check the use-by date of this. Base A= 3964, B=3013, C=4010, D=4184, E=4117, F=3911, G=2504, H=3422, I=4033, all online respondents and those who completed Version B of the postal questionnaire, who eat A/B/C/D/F/F/G/H/I. Please note: the figures shown do not add up to 100% as not all responses are shown.
-
Question: When food you have bought is about to go past its use-by date, which of the following do you usually do? Responses: I eat it by the use-by date, I freeze it by the use-by date, I throw it away (after the use-by date), I keep it and eat it after the use-by date, it varies too much to say, I don't check use-by dates. Base = 5526, all respondents.
-
Question: How do you tell whether it is safe to eat or cook with...? a) raw meat like beef, lamb, pork or poultry, b) milk and yoghurt, c) cheese, d) eggs, e) fish (excluding shellfish), f) dried or cured meats (e.g. chorizo). Responses: how it looks; how it smells; how it tastes; use-by date; best before date; b/c/f) follow pack instructions e.g. with within 3 days of opening; d) it doesn’t float in water. Base A=4066, B=4193, C= 4198, D=4160, E=3347, F=3442, all online respondents who completed version B of the postal questionnaire, excluding those who don't eat/cook…A/B/C/D/E/F.
-
Response options for this question varied according to food type.
-
Question: Some foods have an instruction to eat the food within a few days of opening on the label (e.g. `consume within 3 days of opening'). How often, if at all, do you follow instructions on food packaging which tell you how long food should be stored once opened? Responses: always, most of the time, about half of the time, occasionally, never, don’t know. Base=5109, all respondents who ever do some food preparation or cooking for their household.
Introduction
The FSA is responsible for the authorisation of novel foods.
The Department for Environment, Food and Rural Affairs (Defra) has a broad remit and plays a major role in increasing the sustainability, productivity and resilience of the agriculture, fishing, food and drink sectors, enhancing biosecurity at the border and raising animal welfare standards. In addition, Defra oversees the regulation of genetic technologies such as genetically modified organisms (GMO), gene edited (GE) organisms and precision bred foods. The FSA is responsible for the authorisation of novel foods.
This chapter summarises respondent knowledge of genetic technologies (footnote 1).
Awareness of gene-edited (GE), genetically modified (GM) and precision bred foods
Respondents were asked if they had ever heard of genetically modified (GM) food, gene-edited or genome-edited food and precision bred food. Respondents reported greater awareness and knowledge of genetically modified (GM) food than gene-edited or genome-edited food (GE) and least knowledge of precision bred food. For example, 63% of respondents had never heard of precision bred food (footnote 2) whereas 38% of respondents had never heard of GE food (footnote 3) and 8% of respondents had never heard of GM food (footnote 4) (Figure 24).
Figure 24. Awareness and knowledge of genetically modified (GM), gene edited/genome-edited (GE) and precision-bred food
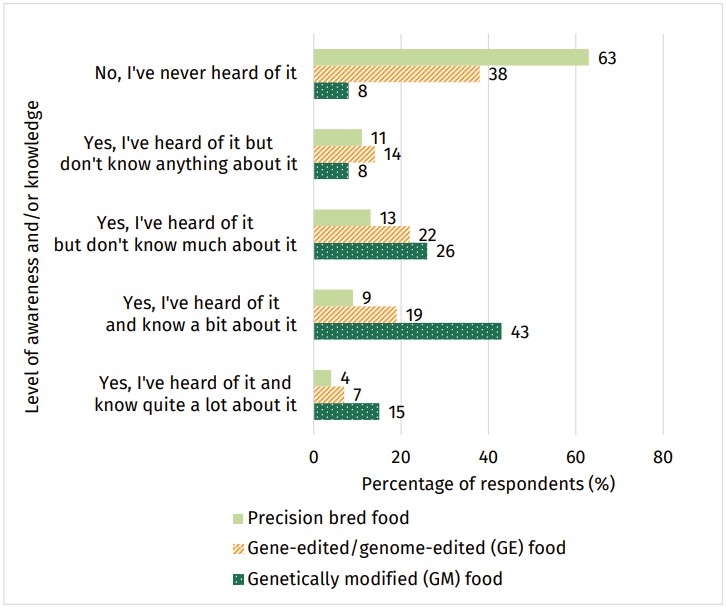
Source: Food and You 2: Wave 9
-
More detailed insights on changes to consumer eating habits, meat alternatives and sustainable diets are available in the Food and You 2 Wave 8 report.
-
Question: Have you ever heard of Precision bred food? Responses: yes I’ve heard of it and know quite a lot about it, yes I’ve heard of it and know a bit about it, yes I’ve heard of it but don’t know much about it, yes I’ve heard of it but don’t know anything about it, no I’ve never heard of it, not stated. Base=4634, all online respondents and all responding to version A postal questionnaire.
-
Question: Have you ever heard of Gene edited or genome edited food? Responses: yes I’ve heard of it and know quite a lot about it, yes I’ve heard of it and know a bit about it, yes I’ve heard of it but don’t know much about it, yes I’ve heard of it but don’t know anything about it, no I’ve never heard of it, not stated. Base=4634, all online respondents and all responding to version A postal questionnaire.
-
Question: Have you ever heard of Genetically modified (GM) food? Responses: yes I’ve heard of it and know quite a lot about it, yes I’ve heard of it and know a bit about it, yes I’ve heard of it but don’t know much about it, yes I’ve heard of it but don’t know anything about it, no I’ve never heard of it, not stated. Base=4634, all online respondents and all responding to version A postal questionnaire.
Background
In 2018 the FSA’s Advisory Committee for Social Science (ACSS) established a new Food and You working group to review the methodology, scope and focus of the Food and You survey. The Food and You working group provided a series of recommendations on the future direction of the Food and You survey to the FSA and ACSS in April 2019. Food and You 2 was developed from the recommendations.
The Food and You 2 survey replaced the biennial Food and You survey (2010-2018), biannual Public Attitudes Tracker (2010-2019) and annual Food Hygiene Rating Scheme (FHRS) Consumer Attitudes Tracker (2014-2019). The Food and You survey has been an Official Statistic since 2014. Due to the difference in methodology between the Public Attitudes Tracker, FHRS Consumer Attitudes Tracker and Food and You survey (2010- 2018) it is not possible to compare the data collected in Food and You 2 (2020 onward) with these earlier data. Comparisons can be made between the different waves of Food and You 2. Since Wave 6, we have published a separate trends report on an annual basis, which comments on changes over time.
Previous publications in this series include:
- Food and You 2: Wave 1 Key Findings (March 2021)
- Food and You 2: Wave 2 Key Findings (July 2021)
- Food and You 2: Wave 3 Key Findings (January 2022)
- Food and You 2: Wave 4 Key Findings (August 2022)
- Food and You 2: Wave 5 Key Findings (March 2023)
- Food and You 2: Wave 6 Key Findings (July 2023)
- Food and You 2: Wave 7 Key Findings (April 2024)
- Food and You 2: Wave 8 Key Findings (September 2024)
- Food and You 2: 2020-2023 trends (December 2023)
Methodology
The Food and You 2 survey is commissioned by the Food Standards Agency (FSA). The fieldwork is conducted by Ipsos. Food and You 2 is a biannual survey. Fieldwork for Wave 9 was conducted between 24th April 2024 to 1st July 2024. Food and You 2 is a sequential mixed-mode ‘push-to-web’ survey (summary of method below). Push-to-web helps to reduce the response bias that otherwise occurs with online-only surveys. This method is accepted for government surveys and national statistics, including the 2021 Census and Community Life Survey.
A random sample of addresses (selected from the Royal Mail’s Postcode Address File) received a letter inviting up to two adults (aged 16 or over) in the household to complete the online survey. A first reminder letter was sent to households that had not responded to the initial invitation. A postal version of the survey accompanied the second reminder letter for those who did not have access to the internet or preferred to complete a postal version of the survey. A third and final reminder was sent to households if the survey had not been completed. Respondents were given a gift voucher for completing the survey.
The sample of main and reserve addresses (footnote 1) was stratified by region (with Wales and Northern Ireland being treated as separate regions), and within region (or country) by local authority (district in Northern Ireland) to ensure that the issued sample was spread proportionately across the local authorities. National deprivation scores were used as the final level of stratification within the local authorities - in England the Index of Multiple Deprivation (IMD), in Wales the Welsh Index of Multiple Deprivation (WIMD) and in Northern Ireland, the Northern Ireland Multiple Deprivation Measure (NIMDM).
Due to the length and complexity of the online questionnaire it was not possible to include all questions in the postal version of the questionnaire. The postal version of the questionnaire needed to be shorter and less complex to encourage a high response rate. To make the postal version of the questionnaire shorter and less complex, two versions were produced. The two versions of the postal survey are referred to as the ‘Eating Out’ and ‘Eating at Home’ postal questionnaires. See the Technical Report for further details.
All data collected by Food and You 2 are self-reported. The data are the respondents own reported attitudes, knowledge and behaviour relating to food safety and food issues. As a social research survey, Food and You 2 cannot report observed behaviours. Observed behaviour in kitchens has been reported in Kitchen Life 2, an ethnographic study which used a combination of observation, video observation and interviews to gain insight into domestic kitchen practices.
The minimum target sample size for the Food and You 2 survey is 4,000 households (2,000 in England, 1,000 in Wales, 1,000 in Northern Ireland), with up to two adults in each household invited to take part. For Wave 9 a total of 5,526 adults (aged 16 years or over) from 3,908 households across England (2,791 adults), Wales (1,265 adults), and Northern Ireland (1,470 adults) completed the survey. An overall household-level response rate of 25.8% was achieved (England 26.1%, Wales 27.4%, Northern Ireland 23.8%). Sixty-two per cent (63.9%) of respondents completed the survey online and 36.1% completed the postal version of the survey. The postal responses from 18 respondents were removed from the data set as the respondent had completed both the online and postal survey. Further details about the response rates are available in the Technical Report.
Weighting was applied to ensure the data are as close as possible to being representative of the socio-demographic and sub-groups in the population, as is usual practice in government surveys. The weighting applied to the Food and You 2 data helps to compensate for variations in within-household individual selection, for response bias, and for the fact that some questions were only asked in one of the postal surveys. Further details about the weighting approach used and the weights applied to the Food and You 2: Wave 9 data are available in the Technical Report.
The data have been checked and verified by four members of the Ipsos research team and two members of the FSA Statistics branch. Further details about checks of the data are available in the Technical Report. Descriptive analysis and statistical tests have been performed by the FSA Statistics branch. R (statistical software) was used by the FSA Statistics branch to calculate the descriptive analysis and statistical tests (t-tests).
The p-values that test for statistical significance are based on t-tests comparing the weighted proportions for a given response within that socio-demographic and sub-group breakdown. An adjustment has been made for the effective sample size after weighting, but no correction is made for multiple comparisons.
Reported differences between socio-demographic and sub-groups typically have a minimum difference of 10 percentage points between groups and are statistically significant at the 5% level (p<0.05). However, some differences between respondent groups are included where the difference is fewer than 10 percentage points when the finding is notable or of interest. Percentage calculations are based only on respondents who provided a response. Reported values and calculations are based on weighted totals.
Technical terms and definitions
Statistical significance is indicated at the 5% level (p<0.05). This means that where a significant difference is reported, there is reasonable confidence that the reported difference is reflective of a real difference at the population level.
Food security means that all people always have access to enough food for a healthy and active lifestyle (World Food Summit, 1996). The United States Department of Agriculture (USDA) has created a series of questions which indicate a respondent’s level of food security. Food and You 2 incorporates the 10 item U.S. Adult Food Security Survey Module and uses a 12 month time reference period. Respondents are referred to as being food secure if they are classified as having high food security (no reported indications of food-access problems or limitations), or marginal food security (one or two reported indications—typically of anxiety over food sufficiency or shortage of food in the house. Little or no indication of changes in diets or food intake). Respondents are referred to as being food insecure if they are classified as having low food security (reports of reduced quality, variety, or desirability of diet. Little or no indication of reduced food intake) or very low food security (reports of multiple indications of disrupted eating patterns and reduced food intake).
NS-SEC (The National Statistics Socio-economic classification) is a classification system which provides an indication of socio-economic position based on occupation and employment status.
Index of Multiple Deprivation (IMD)/Welsh Index of Multiple Deprivation (WIMD)/Northern Ireland Multiple Deprivation Measure (NIMDM) is the official measure of relative deprivation of a geographical area. IMD/WIMD/NIMDM classification is assigned by postcode or place name. IMD/WIMD/NIMDM is a multidimensional calculation which is intended to represent the living conditions in the area, including income, employment, health, education, access to services, housing, community safety and physical environment. Small areas are ranked by IMD/WIMD/NIMDM. This is done separately for England, Wales and Northern Ireland.