Research project
Eating Well Choosing Better Tracker Survey Wave 8 2022
Northern Ireland specific
Report prepared for the Food Standards Agency in Northern Ireland by Ipsos.
This survey and report has been conducted and produced by Ipsos on behalf of the FSA. The EWCB tracker survey measures the progress of the FSA’s EWCB programme in NI through the collection of robust consumer insights and the monitoring of this data over time. The survey collects information on consumer perceptions of healthy eating, healthier options and reformulation; consumer use of traffic light labels; and consumer knowledge and understanding of the recommended daily calorie intake. Fieldwork was conducted between 17th September 2022 and 19th November 2022.
Key Findings
- 91% of participants recognised the traffic light label and 85% reported to understand what traffic light labels are for.
- 62% of consumers choose foods with healthier traffic light colours always/most times.
- Around half of those surveyed would be more likely to buy food reduced in saturated fat (51%), sugar (47%), and salt (42%) compared to the regular version.
- Participants found it difficult to choose healthier food in a range of settings including takeaways (72%), fast-food restaurants (63%), leisure facilities such as cinemas and bowling alleys (63%), restaurants (49%), cafés and sandwich shops (40%) and vending machines (36%).
- Consumers would like to see healthier options in settings such as takeaways (48%), fast food restaurants (46%), food outlets in leisure facilities (37%), restaurants and bars (33%) and vending machines (28%).
- 18% of male and 28% of female participants correctly identified the recommended daily calorie intake for their gender.
- Males and those in a lower socioeconomic group are less likely to find out nutritional information of products; use the traffic light label when shopping for food and want to see increased availability of food lower in saturated fat, sugar and salt.
Background
The Eating Well Choosing Better (EWCB) programme was developed by the FSA to support small and medium sized food businesses in NI to reduce the calorie, sugar, saturated fat, and salt content of the food they produce, sell, or serve, as well as reducing portion sizes to help consumers make healthier choices. The overall aim is to improve the nutritional quality of everyday foods available to NI consumers.
The objectives of the EWCB programme include working in partnership with SMEs and appropriate stakeholders to support the NI food industry to engage with food product improvement and monitoring changes in NI consumers’ attitudes towards food product improvement.
The purpose of this report is to present the findings of the 2022 EWCB survey.
Objectives
The objectives of the EWCB survey are to monitor NI consumers’:
- understanding of healthy eating
- understanding of the daily recommended calorie intake
- understanding of, and use of the multiple traffic light label
- attitudes and behaviours towards reformulation including reduced portion sizes
- attitudes and behaviours towards healthier options outside the home
The survey was first completed in November 2017 to inform the EWCB programme objectives. In May 2020, the FSA in NI made the decision to convert from a biannual survey to an annual survey.
Survey methodology
The first five EWCB surveys conducted between November 2017 and November 2019 were completed using online panels. In the 2020 survey, interviewing was initiated via Computer Assisted Telephone Interviewing (CATI) (318 interviews). To improve the response rate during the 2020 survey (wave 6), Computer Assisted Personal Interviewing (CAPI) was introduced (283 interviews). CAPI is referred to as ‘face-to-face interviewing’, however due to the COVID-19 pandemic, surveys were conducted via doorstep interviewing instead of directly face-to-face in-home. In 2021 (wave 7), all surveys were completed using the CAPI doorstep method that was introduced in the previous year. In 2022 (wave 8), data was collected solely using the traditional face-to-face in-home CAPI interviewing method. As the 2020, 2021 and 2022 survey used similar interviewing methodology, the results from these years are considered comparable. Significant differences in the 2022 findings compared to the 2021 and 2020 survey have been included throughout this report.
Survey questionnaire
The FSA in NI EWCB survey monitors the progress of the EWCB programme through collecting robust consumer insight data on the following:
- knowledge of daily recommended calorie intake.
- are consumers in favour of manufacturers reducing sugar, and/or saturated fat, and/or salt content of foods, and portion sizes of food high in these nutrients?
- ease of selecting healthier choices in food for consumption inside and outside the home.
- do consumers look at front of pack traffic light labels?
- do consumers look for calories, sugar, saturated fat, salt, and portion size on packaged food labels?
- would they like to see high fat, sugar, or salt snacks having a maximum number of calories?
- does this influence consumer’s choice? If so, how?
- what do consumers look for/would they like to see, and have they used calories on menus when eating outside the home?
A copy of the survey questionnaire can be found in the Appendices.
Sampling and sample size
A total of 611 interviews were completed with food shoppers in NI in the 2022 report. Interviewing took place from 17th September to 19th November 2022.
To ensure representation of the population of NI, quota sampling was adopted. Quotas were based on 2011 Census data (Census Office for Northern Ireland, 2011) on key demographic variables in the sample, ensuring representation across gender, age, socio-economic group and region of NI. Quotas and the definition of each socio-economic group can be found in the Appendices.
In 2021, a total of 603 interviews were completed with food shoppers in NI between the 18th August to 9th October 2021 using the CAPI method. In 2020, a total of 601 interviews were completed between the 5th June to 23rd August 2020 (318 interviews were completed using CATI and 283 using CAPI).
Data analysis
The data file was cleaned, weighted, validated, and anonymised. In 2022, corrective weighting on demographic variables was required given some deviation from quotas. Rim weighting was used to weight the data to the target sample for each demographic grouping.
Significance testing was carried out on data to identify any differences in the views, attitudes, and behaviours of key sub-groups. Statistical significance testing establishes whether the variation between groups could have happened by chance or whether it is likely to reflect some 'real' differences in the population. Only statistically significant differences are reported between each year of the survey from 2020 to 2022.
A range of demographic information was collected during the survey, such as age, gender, socio-economic group, and the presence of children in the household to enable sub-group analysis. Demographic differences have been reported where statistically significant differences occur at the 5% level. This means that if a statistical difference was found, there is less than a 5% chance that this difference has occurred by chance. Solid green arrows denote a significantly higher difference against the previous year, solid red arrows denote a significantly lower difference. Significant differences between 2022 and 2020 are denoted by a striped green arrow for significantly higher and a striped red arrow for significantly lower. Full data tables are available on request.
Research considerations
Results should be interpreted with care. Surveys are subject to errors in participants’ interpretation of survey questions and response options. The data reported within this report relies on participants’ self-reported behaviours. Errors could occur due to imperfect recollection, or participants’ tendency to overreport behaviours which are perceived as being desirable and underreport undesirable behaviours.
Views and understanding of healthy eating
This section of the report explores participants’ views of their own personal eating habits and that of their children as well as their understanding of healthy eating and the ease with which they can make healthier choices. Comparisons to 2021 and 20202 survey data have been included throughout.
Views on the meaning of ‘healthy eating’ varied. Many perceived healthy eating to simply mean having a balanced diet, keeping to the correct portion sizes and eating plenty of fresh food such as fruit and vegetables, fish and chicken, while others believed that healthy eating meant avoiding unhealthy foods such as fast food, fried or processed foods.
- “Varied balanced diet and 5 a day and not eating take outs every day.”
- “Small portions, vegetables, no processed foods.”
- “Eating plenty of fruit and vegetables, eat plenty of fish and chicken and no processed foods.”
- “No fried food or take outs.”
There were also frequent mentions of carbohydrates or opting for low carbohydrate options and reducing sugar, salt and fat intake.
- “Reduce sugars, saturated fats, eat 5 portions of fruit a day. Follow food pyramid and food plate guidelines.”
- “Eating stuff with less sugar, oil and less carbohydrates.”
- “Balanced diet, such as fruits, nuts, lean meat, low carbs, and low starch.”
Some participants associated healthy eating with cooking at home, eating vegetarian or following a flexitarian diet.
- “I am a fairly healthy eater, I am flexitarian.”
- “Replacing take outs with home cooked vegetables and lean meat.”
- “Healthy eating is eating a range of fresh fruit and vegetables, cooked at home.”
- “Watching out for hidden sugars and fats in food, for me it’s being vegetarian.”
Perceptions of healthy eating habits
Participants were asked the extent to which they agreed or disagreed that their personal eating habits are healthy.
In 2022, 63% of participants agreed that their personal eating habits were healthy, this is lower than 2021 (69%) but higher than 2020 (57%). More participants disagreed that their personal eating habits were healthy in 2022 (16%) than in 2021 (6%) (Figure 1).
Figure 1: Participants who ‘agree’ or ‘disagree’ that their personal eating habits are healthy
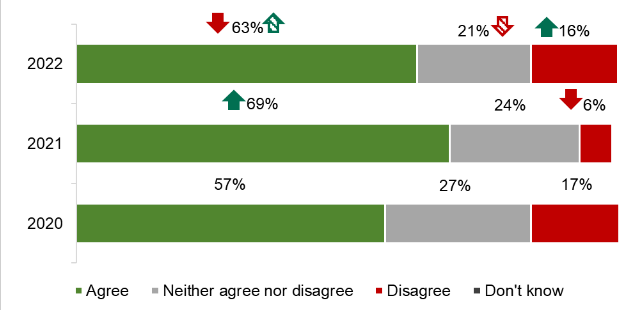
Base: Adults in Northern Ireland: 2022 (611), 2021 (603), 2020 (601)
The green arrow indicates significantly higher than previous year, the green patterned arrow indicates significantly higher than 2020.
The red arrow indicates significantly lower than previous year, the red patterned arrow indicates significantly lower than 2020.
Note: Totals do not add to 100% due to rounding.
Over 7 in 10 (72%) agreed that their children's eating habits were healthy; this has increased since 2020 (62%) (Figure 2).
Figure 2: Participants who ‘agree’ or ‘disagree’ that their children’s eating habits are healthy’
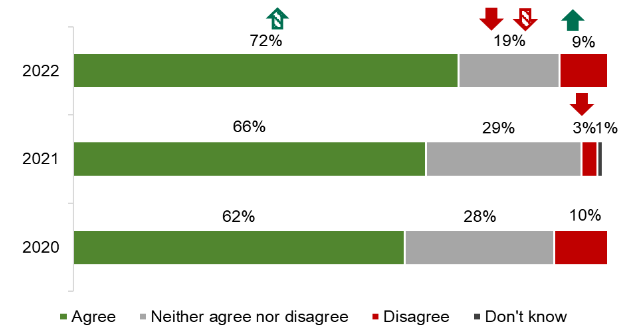
Base: Adults in Northern Ireland: 2022 (200), 2021 (134), 2020 (181)
The green arrow indicates significantly higher than previous year, the green patterned arrow indicates significantly higher than 2020.
The red arrow indicates significantly lower than previous year, the red patterned arrow indicates significantly lower than 2020.
Note: Totals do not add to 100% due to rounding.
Understanding of what is healthier and what is less healthy
Participants were asked the extent to which they agreed or disagreed that they understand what is healthier and what is less healthy.
In 2022, there was no change on whether participants agreed or disagreed that they understood what is healthier and what is less healthy since 2021 (Figure 3).
Figure 3: Participants who ‘agree’ or ‘disagree’ that they understand what is healthier and what is less healthy
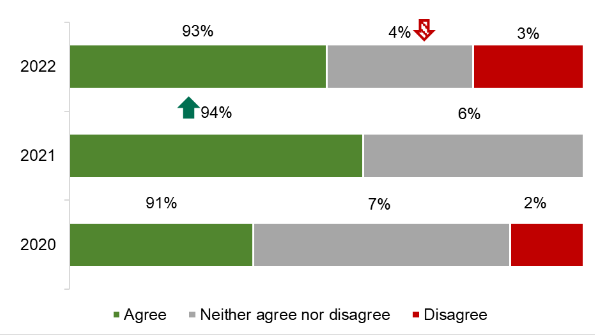
Base: Adults in Northern Ireland: 2022 (611), 2021 (603), 2020 (601)
The green arrow indicates significantly higher than previous year.
The red patterned arrow indicates significantly lower than 2020.
Seeking healthier options
Participants were asked the extent to which they agreed or disagreed that they ‘actively seek out healthier options when shopping’.
Almost 7 in 10 (69%) agreed that they actively seek healthier options; higher than 2020 (61%). The proportion of participants who disagree that they actively seek healthier options when shopping has increased from 8% in 2021 to 14% in 2022 (Figure 4).
Figure 4: Participants who ‘agree’ or ‘disagree’ that they actively seek healthier options when shopping
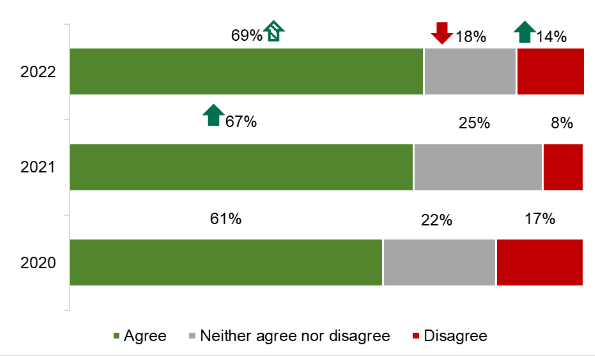
Base: Adults in Northern Ireland: 2022 (611), 2021 (603), 2020 (601)
The green arrow indicates significantly higher than previous year, the green patterned arrow indicates significantly higher than 2020.
The red arrow indicates significantly lower than previous year.
Participants were asked the extent to which they agreed or disagreed that they actively seek out healthier options when eating out.
There was no change since 2021 on whether participants agreed that they actively seek healthier options when eating out; one third (33%) agreed with this statement in 2022. Many disagreed that they actively seek healthier options when eating out (45%), higher than 2021 (32%) and 2020 (39%) (Figure 5).
Figure 5: Participants who ‘agree’ or ‘disagree’ that they actively seek healthier options when eating out
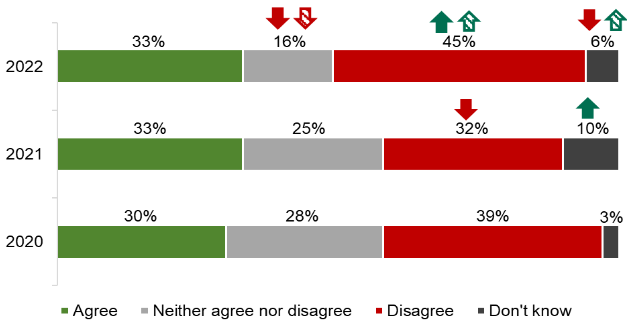
Base: Adults in Northern Ireland: 2022 (611), 2021 (603), 2020 (601)
The green arrow indicates significantly higher than previous year, the green patterned arrow indicates significantly higher than 2020.
The red arrow indicates significantly lower than previous year, the red patterned arrow indicates significantly lower than 2020.
Understanding and awareness of recommended daily calorie intake
This section of the report investigates participants’ knowledge of the UK government’s recommended daily calorie intake for males and females.
There was considerable variation in the understanding of the recommended daily calorie intake for both men and women. A large proportion of participants were not aware of the government recommended daily calorie intake for their gender, although this was notably higher for males. The government recommended daily intake of calories for males is 2,500kcal and for females is 2,000kcal (Public Health England 2016).
Knowledge of recommended daily calorie intake amongst male participants
Similar to previous years, more males either incorrectly identified the recommended daily calorie intake for their gender (36%) or they didn't know the answer (46%), compared to those who correctly identified the correct intake (18%). This is a similar trend to previous years, although the proportion of males giving an incorrect answer increased considerably in 2022 (36%) compared to 2021 (23%) (Figure 6).
Figure 6: Male participants’ knowledge of recommended daily calorie intake for their gender
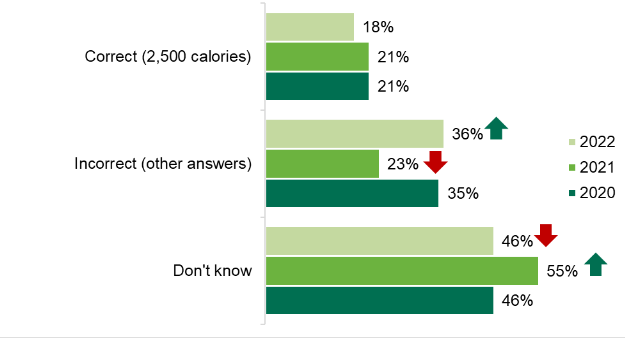
Base: Adult males in Northern Ireland: 2022 (302), 2021 (285), 2020 (288)
The green arrow indicates significantly higher than previous year.
The red arrow indicates significantly lower than previous year.
Note: Totals do not add to 100% due to rounding.
Knowledge of recommended daily calorie intake amongst female participants
A higher proportion of females were correctly able to identify the recommended daily calorie intake for their gender in 2022, compared to males. This is a similar trend to previous years. The proportion of females who were able to correctly identify the recommended daily calorie intake for their gender increased from 20% in 2021 to 28% in 2022 but was lower than the level in 2020 (31%). Fewer females did not know what the recommended daily calorie allowance was when compared to 2021 (26% in 2022 and 37% in 2021) (Figure 7).
Figure 7: Female participants’ knowledge of recommended daily calorie intake for their gender
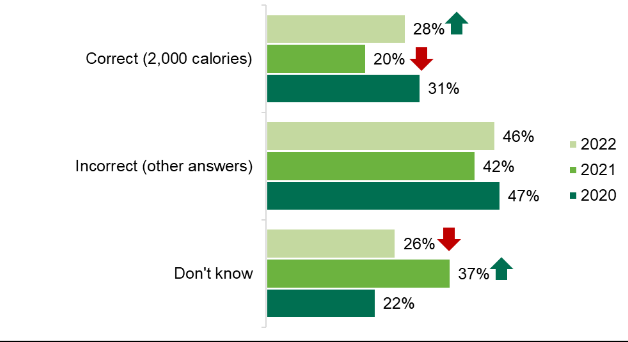
Base: Adult females in Northern Ireland: 2022 (309), 2021 (318), 2020 (312)
The green arrow indicates significantly higher than previous year.
The red arrow indicates significantly lower than previous year.
Note: Totals do not add to 100% due to rounding.
Food purchasing behaviour
This section of the report explores where participants shop for food.
Where participants purchase food
The majority of participants (88%) confirmed that they shop at a supermarket, and although this has decreased from 2021 (92%), supermarkets are still the main source of food shopping for NI consumers.
Over half said they shop at a local shop, newsagents or garage for food in a typical month in 2022 (56%), notably higher than 2020 (48%). While around a third (32%) said they shopped at an independent greengrocers, butchers, bakers or fishmongers; a decrease when compared to 2021 (49%).
In 2022, fewer participants shop for food at a market, farmer’s market or farm shop (6%) than they did in 2021 (10%) or 2020 (11%) (see Figure 8).
Figure 8: Locations where participants shop for food
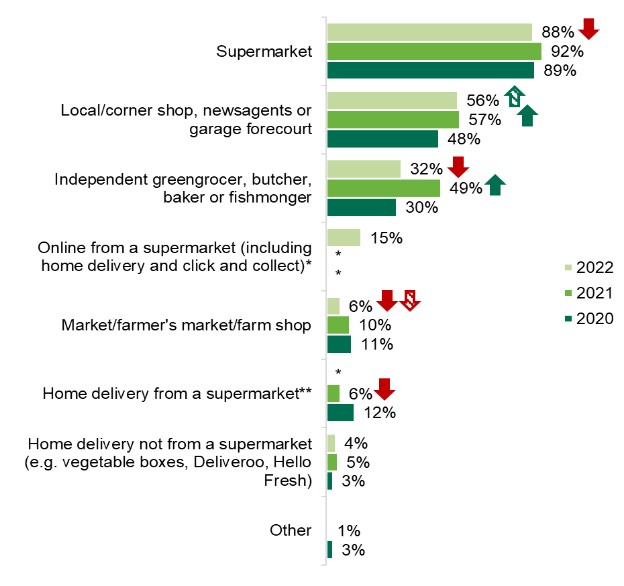
Base: Adults in Northern Ireland: 2022 (611), 2021 (603), 2020 (601)
The green arrow indicates significantly higher than previous year, the green patterned arrow indicates significantly higher than 2020.
The red arrow indicates significantly lower than previous year, the red patterned arrow indicates significantly lower than 2020.
Notes: Totals do not add to 100% as participants could select multiple responses.
Not included in year represented by *.
Home delivery from a supermarket was replaced by online from a supermarket (including home delivery and click and collect) in 2022.
Healthy eating behaviours
This section explores the extent to which participants use nutritional labelling to make informed food purchasing decisions and their awareness and understanding of the traffic light label.
Use of nutritional labelling
Looking at information on the front of the packet (34%) is the most common method used to check for nutritional information in 2022, which is higher when compared to 2020 (24%). Use of the traffic light labelling system is the second most common method used to check for nutritional information (29%), this has not changed when compared to previous years. One quarter (25%) look at the information on the back of the packet, and this is higher than in 2021 (20%) but less than 2020 (36%).
Around a fifth (19%) look at the ingredient list, which is unchanged from 2021. A small proportion use other methods to find out nutritional information when food shopping in-store (2%), this is less than the 5% who used other methods in 2020.
In 2022, 37% of participants who shop for food in-store stated that they do not try to find nutritional information when shopping in-store. This is a smaller proportion than 2021 (49%), but similar to 2020 (35%) (see Figure 9).
Figure 9: How participants find nutritional information when food shopping in-store
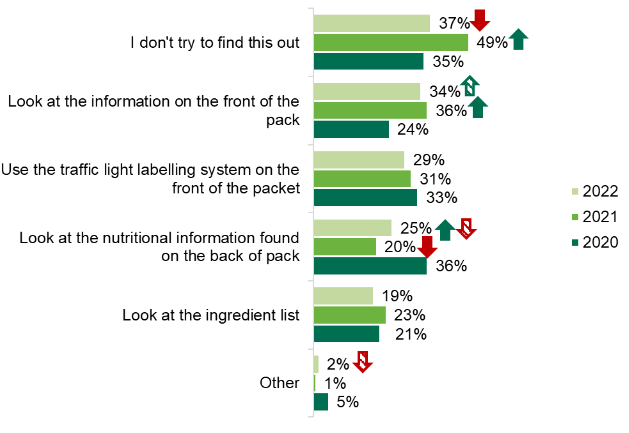
Base: Adults in Northern Ireland who shopped in store: 2022 (599), 2021 (601), 2020 (583) .
The green arrow indicates significantly higher than previous year, the green patterned arrow indicates significantly higher than 2020.
The red arrow indicates significantly lower than previous year, the red patterned arrow indicates significantly lower than 2020.
Note: Totals do not add to 100% as participants could select multiple responses.
Recognition and use of the traffic light label
Participants were shown an image of a traffic light label (Figure 10). Awareness of the traffic light label was high and is increasing when compared with 2021. More than nine in ten (91%) claimed to be aware of it in 2022, an increase from 2021 (87%) (Figure 11).
Figure 10: Traffic light label example
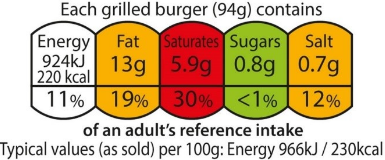
Figure 11: Participants who were, or were not, aware of the traffic light label
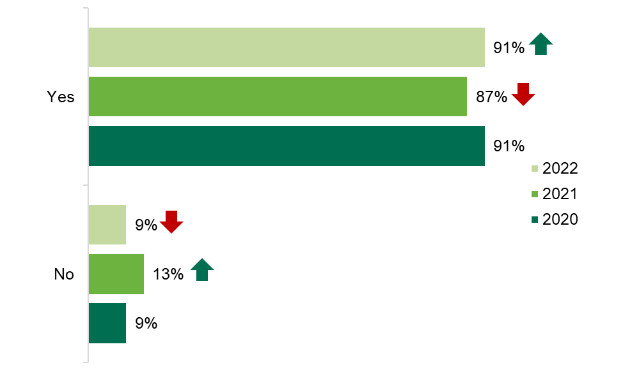
Base: Adults in Northern Ireland: 2022 (611), 2021 (603), 2020 (601)
The green arrow indicates significantly higher than previous year.
The red arrow indicates significantly lower than previous year.
Although awareness of the traffic light system was high, less than half of those who were aware of it make use of the label when food shopping (45%). This is lower when compared to 2020 where more than half claimed they used it (56%) (Figure 12).
Figure 12: Use of the traffic light label when food shopping
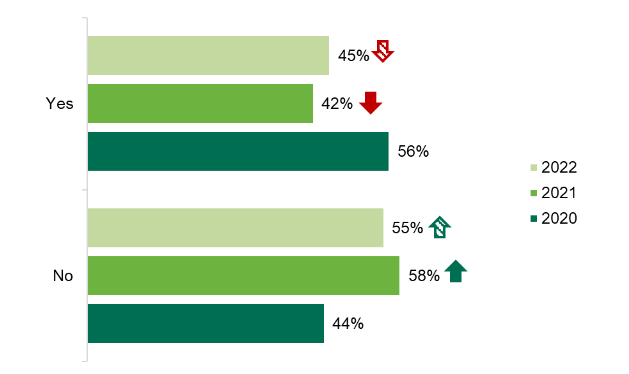
Base: Adults in Northern Ireland who recognised the traffic light image: 2022 (558), 2021 (525), 2020 (544).
The green arrow indicates significantly higher than previous year, the green patterned arrow indicates significantly higher than 2020.
The red arrow indicates significantly lower than previous year, the red patterned arrow indicates significantly lower than 2020.
Understanding of the traffic light label
Participants who recognised the traffic light label were asked about the extent to which they agreed or disagreed with the statement: ‘I understand what traffic light labels on the front of food packaging are for’1.
The majority of participants who recognised the traffic light label agreed that they understand the purpose of the label (85%), an increase from 2021 (79%). While 6% disagreed that they understood what the traffic light labels are for; an increase since 2021 (2%) (Figure 13).
Figure 13: Participant understanding of the traffic light label
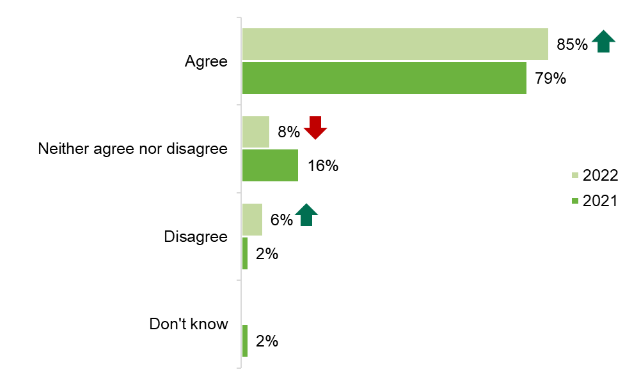
Base: Adults in Northern Ireland who recognise the traffic light image: 2022 (558), 2021 (525).
The green arrow indicates significantly higher than previous year.
The red arrow indicates significantly lower than previous year.
Note: Totals do not add to 100% due to rounding.
When probed further about the purpose of traffic light labels, some participants were able to provide an overview of the purpose of the label, while others were able to offer a more detailed understanding. Most participants correctly highlighted that the label is designed to provide information on calories, fat, sugar, and salt.
- “For people to make a snapshot judgement about how much salt, fat and sugar are in foods which makes it easier for comparing foods.”
- “To guide you to buy healthy options and provide information on salt, sugar, carbs, and calorie intake.”
Participants also identified that the colours were intended as a guide as to how much calories, fat, sugar and salt were in the product.
- “Red means something is particularly high, such as fat. Green means that the product has the right amount of something.”
- “Green is good. Red is high and bad generally.”
- “To give you a broad idea of the food contents, if it is green or orange it is not so bad.”
Some participants also noted how they use the labels personally when food shopping.
- “Encourage people to eat healthier, as they tell you fat and salt content. Not too many people look at them, but I do sometimes.”
- “Keeps me right so I can watch my weight.”
- “I take a quick look sometimes to see that it’s not all red.”
Frequency of using traffic light labelling to make healthier choices
Those who use the traffic light label when shopping for food were asked how often they choose foods with ‘healthier’ traffic light colours or foods with a lower percentage of the recommended daily calorie intake.
One in ten (10%) said that they ‘always’ use the traffic light label to select foods with ‘healthier’ traffic light colours, which has decreased since 2021 (22%). However, over half (52%) said that they use the label ‘most times'; ten percentage points higher than in 2021 (42%) (see figure 14).
Figure 14: Frequency of use of the traffic light label to choose foods with ‘healthier’ traffic light colours
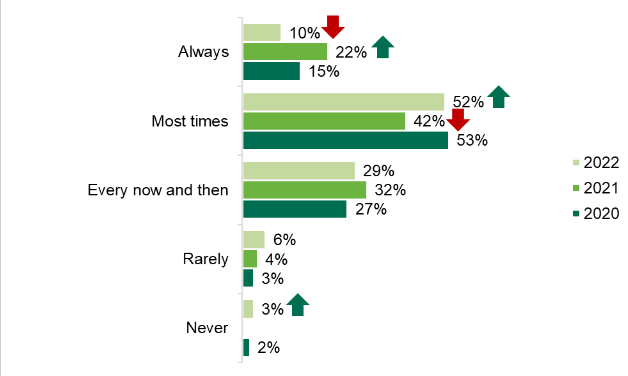
Base: Adults in Northern Ireland who use traffic light labelling: 2022 (254), 2021 (222), 2020 (306).
The green arrow indicates significantly higher than previous year.
The red arrow indicates significantly lower than previous year.
When asked how frequently they used the traffic light label to choose foods with a lower percentage of the recommended daily calorie intake in 2022, one in ten (10%) participants said that they use it ‘always’, which is unchanged from the previous year. More than one fifth (23%) said that they use it ‘most times’, which is less than the 35% who said they used the label most times in 2020. Around one quarter (26%) said they ‘rarely’ used the label to check for a lower percentage of the recommended daily calorie intake, higher than the 14% in both 2020 and 2021. Eleven percent said that they ‘never’ use the traffic light label for this reason, which is similar to previous years (Figure 15).
Figure 15: Frequency of use of the traffic light label to choose foods with a lower percentage of the recommended daily calorie intake
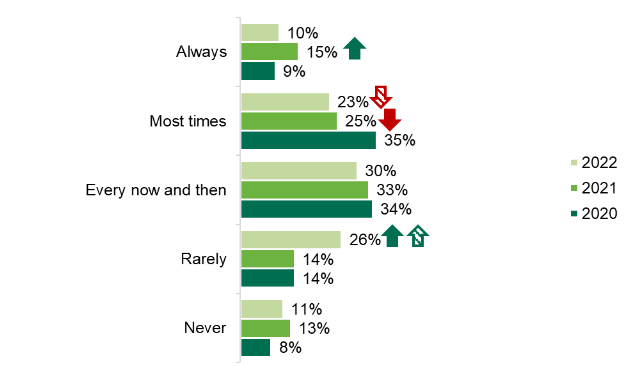
Base: Adults in Northern Ireland who use traffic light labelling: 2022 (254), 2021 (222), 2020 (306).
The green arrow indicates significantly higher than previous year, the green patterned arrow indicates significantly higher than 2020.
The red arrow indicates significantly lower than previous year, the red patterned arrow indicates significantly lower than 2020.
Use of the traffic light label when making food purchasing decisions
Participants were asked whether they look at certain information on the traffic light label when purchasing food for themselves and their children.
The information participants consulted on the traffic light label was dependent on whether they were purchasing food for themselves or their children.
Personal use of the traffic light label across all of the six uses has decreased when compared with 2021 and 2020, with significant decreases in 4 of the 6 (see Figure 16).
- Sugar: The majority who use traffic light labelling use it to understand the amount of sugar in products (70%), a smaller proportion than 2021 and 2020 (82% and 81% respectively).
- Fat: Almost 6 in 10 (57%) use the traffic light label to understand the amount of fat in products, this has decreased when compared to 2021 (79%) and 2020 (73%).
- Saturated fat: The same proportion of participants use the traffic light labelling to understand the amount of saturated fat in products (57%), which is unchanged from previous years.
- Salt: A similar proportion use the traffic light system to understand the amount of salt in products (55%), although this has decreased when compared to 2021 (70%) and 2020 (66%).
- Calories: In 2022, less than half use the label to check for calories (48%), a decrease since 2021 (64%) and 2020 (60%).
- Portion size: While around 3 in 10 (29%) use the traffic light to find out information on portion sizes, this has not changed from the previous year.
Figure 16: Personal use of traffic light labelling
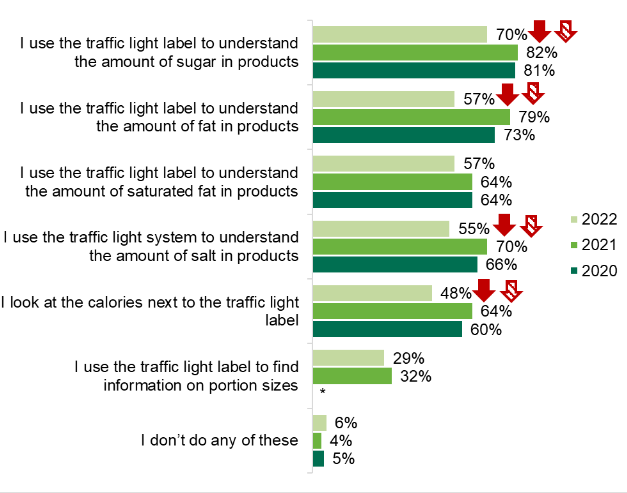
Base: Adults in Northern Ireland who use traffic light labelling: 2022 (254), 2021 (222), 2020 (306)
The red arrow indicates significantly lower than previous year, the red patterned arrow indicates significantly lower than 2020.
Note: Totals do not add to 100% as participants could select multiple responses.
Not included in 2020 represented by *.
In 2022 participants report using the traffic light label more to identify salt (60%) and sugar (78%) levels when purchasing food for their children than they do for themselves. However, participants report using the traffic light label more to identify calories, fat and portion size when purchasing food for themselves (see table 1 for comparison between personal and children).
Table 1: Use of traffic light label when food shopping for self and for children
Use of traffic light label when food shopping |
Personal food shopping |
Food shopping for children |
|---|---|---|
| I look at the calories next to the traffic light label | 48% | 34% |
| I use the traffic light label to understand the amount of fat in products | 57% | 51% |
| I use the traffic light label to understand the amount of saturated fat in products | 57% | 54% |
| I use the traffic light label to understand the amount of sugar in products | 70% | 78% |
| I use the traffic light system to understand the amount of salt in products | 55% | 60% |
| I use the traffic light label to find information on portion sizes | 29% | 21% |
| I don’t do any of these | 6% | 10% |
Base personal food shopping: 254 adults in Northern Ireland who use the traffic light label when food shopping.
Base food shopping for children: 99 adults with children in the household who use the traffic light label when food shopping.
Ease of choosing healthier food and meals
Participants were asked about how easy or difficult they find it to choose healthier food and meals in various settings.
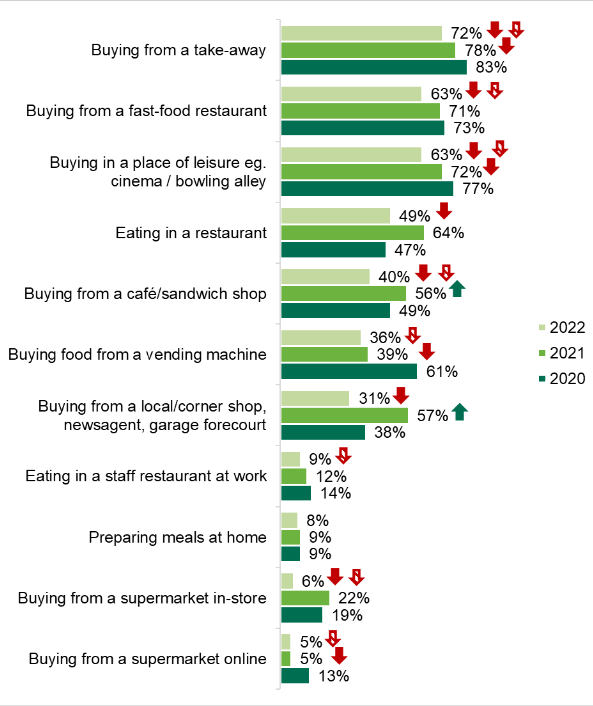
In 2022, every food setting has had a significant change in the proportion of participants who say they found it difficult to choose healthier food, with the exception of ‘preparing meals at home’ (8%). The majority of participants (72%) find it difficult to choose healthier food when buying from a takeaway, decreasing from 78% in 2021 and 83% in 2020. The majority also found it difficult to choose healthier food when buying from a fast-food restaurant (63%), less than both 2021 (71%) and 2020 (73%).
Close to two thirds (63%) found it difficult to choose healthier food when buying from a place of leisure, this is less than 2021 (72%) and 2020 (77%). While the proportion who reported it was difficult to choose healthier when buying from a restaurant has decreased to 49% in 2022 from 64% in 2021.
Two fifths (40%) found it difficult to choose healthier food in cafés and sandwich shops, decreasing from 56% in 2021 and 49% in 2020. Over one third (36%) found it difficult to choose healthier food when buying from a vending machine, decreasing considerably when compared to 2020 (61%).
Choosing healthier food from a local/corner shop was reported to be difficult for 31% in 2022, decreasing from 57% in 2021. Around one tenth (9%) found it difficult to choose healthier food in staff restaurants in comparison to 12% in 2021. Choosing healthier food from a supermarket online was difficult for 5% in 2022 and 2021, compared to 13% in 2020). Less than one tenth (6%) reported finding it difficult to choose healthier food when buying from a supermarket in-store, decreasing from 2021 (22%) and 2020 (19%) (see Figure 17).
Figure 17: The proportion of participants who find it difficult to choose healthier food in food settings outside the home
Base: Adults in Northern Ireland: 2022 (611), 2021 (603), 2020 (601).
The green arrow indicates significantly higher than previous year, the green patterned arrow indicates significantly higher than 2020.
The red arrow indicates significantly lower than previous year, the red patterned arrow indicates significantly lower than 2020.
Note: Participants who stated ‘quite difficult’ or ‘very difficult’ have been combined and classed as ‘participants who find it difficult’ in Figure 17.
Preferred settings for increased availability of healthier options
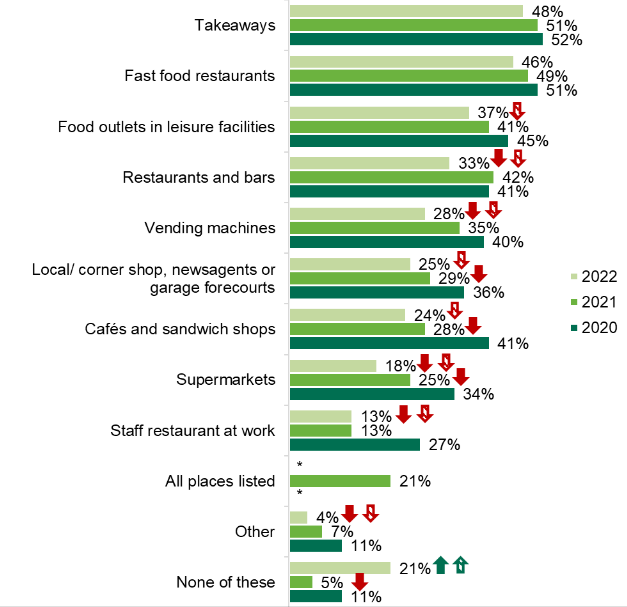
Participants were asked where, if in any setting, they would like to see healthier products. In 2022, close to half would like to see an increased availability of healthier food in takeaways (48%) and fast food restaurants (46%), this is unchanged from previous years.
Over a third would like to see increased availability of healthier food in food outlets in leisure facilities (37%). This has decreased since 2020 (45%). Exactly one third (33%) would like healthier food in restaurants and bars, which has declined since 2021 (42%) and 2020 (41%).
Over a quarter (28%) would like to see better availability of healthier food options in vending machines, which has decreased since 2021 (35%) and 2020 (40%). While similar proportions would like healthier options in local shops, newsagents and garages (25%) and cafés (24%), this has also fallen since 2020 (36% and 41% respectively).
While the want for supermarkets to have better availability of healthier food (18%) has fallen since 2021 (25%) and 2022 (34%), the want for staff restaurants to have better availability of healthier food (13%) has decreased since 2020 (27%).
Over 2 in 10 (21%) did not want healthier options to be made available in any setting and this is the only option to increase from both 2021 (5%) and 2020 (11%) (see Figure 18).
Figure 18: Food settings participants would like to see increased availability of healthier food
The use of calories on menus
This section of the report explores participants awareness of calories on menus, the frequency of seeing calories on menus, and participants’ preferred settings for the display of calories on menus.
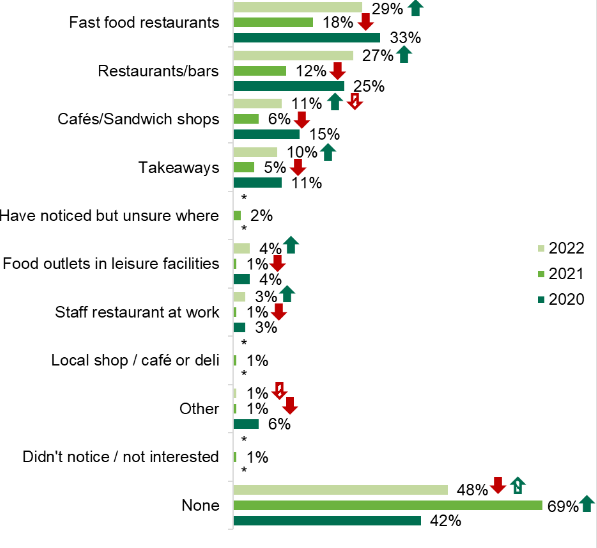
A smaller proportion reported not seeing calorie information on menus in any setting overall in 2022 (48%) when compared to 2021 (69%). However, the 2022 figure was higher than in 2020 (42%).
At least one quarter reported seeing calorie information on menus in fast-food restaurants (29%) and restaurants and bars (27%). This has increased since 2021 when only 18% reported seeing calories on menus in fast-food restaurants and 12% in restaurants and bars (see Figure 19).
Figure 19: Participants who noticed calorie information displayed on menus in food settings outside the home
Base: Adults in Northern Ireland: 2022 (611), 2021 (603), 2020 (601).
The green arrow indicates significantly higher than previous year, the green patterned arrow indicates significantly higher than 2020.
The red arrow indicates significantly lower than previous year, the red patterned arrow indicates significantly lower than 2020.
* Options not included.
Note: Totals do not add to 100% as participants could select multiple responses.
Influence of calorie information on food decisions when eating out
For those who noticed calorie information displayed on menus, the information had most impact in guiding decisions in staff restaurants at work. More than half (59%) said the display of calories on menus in staff restaurants influences their food decisions, nearly one quarter (23%) said it ‘always influences/most times’ while more than a third (36%) reported that it influenced their decisions ‘every now and then’. More than half (51%) said that the display of calories on menus influences their decisions when eating in cafés and restaurants, around one fifth (21%) said it ‘always influences/most times’ while nearly one third (30%) said it influences them ‘every now and then’.
Over one quarter (28%) reported that calorie information influences their decisions ‘every now and then’ in restaurants and bars. Fewer participants reported that calorie information was likely to influence their decisions in fast-food restaurants, takeaways and food outlets in leisure centres with three quarters of participants (74%) reporting that it never influenced their decisions in these three settings (Table 2).
Table 2: Influence of calorie information on food decisions when eating outside the home
| Settings | Always influences/ Most times |
Every now and then | It never influences my decision/Not very often |
|---|---|---|---|
|
Restaurants and bars
|
15% | 28% | 28% |
| Staff restaurant at work | 23% | 36% | 41% |
| Cafés/sandwich shops | 21% | 30% | 49% |
| Fast food restaurants | 8% | 17% | 74% |
| Takeaways | 16% | 9% | 74% |
|
Food outlets in leisure facilities e.g., cinemas, bowling alleys, entertainment centres |
7% | 19% | 74% |
Base: All participants in Northern Ireland who noticed calorie information displayed in each setting.
Note: Row totals do not add to 100% due to rounding.
Preferred settings for the display of calories on menus
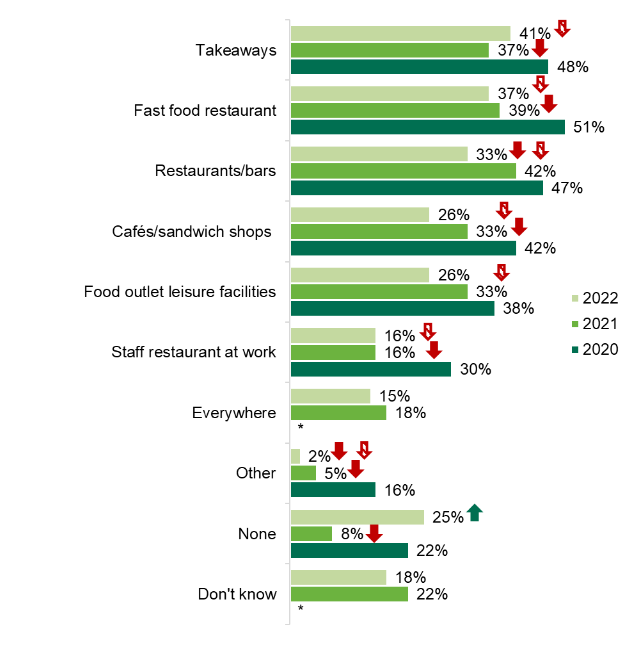
Although one quarter (25%) would prefer not to see calories on menus, over half of respondents would like to see them (57%). However, this has decreased across all settings when compared with previous years (see Figure 20).
Figure 20: Food settings outside the home that participants would like to see calories shown on a food menu
Base: Adults in Northern Ireland: 2022 (611), 2021 (603), 2020 (601)
The green arrow indicates significantly higher than previous year, the green patterned arrow indicates significantly higher than 2020.
The red arrow indicates significantly lower than previous year, the red patterned arrow indicates significantly lower than 2020.
Note: Totals do not add to 100% as participants could select multiple responses.
*Options not included.
Attitudes to reformulating food
This section of the report explores participants’ views on the reformulation of food to reduce sugar, saturated fat, and salt, and the reduction of portion sizes.
Likelihood to purchase reformulated food or reduced portion sizes
The proportion of participants stating that they would be more likely to buy reformulated food or a reduced portion size compared to the regular version has decreased since 2021, with the exception of reduced saturated fat products which has stayed constant at 51%.
Around half of participants reported that they would be more likely to buy products reduced in sugar (47%) and saturated fat (51%), but a smaller proportion would be more likely to buy smaller portion sizes of these products (34%). When compared with 2021, less participants report that they would be more likely to buy reduced sugar products (64% in 2021 and 47% in 2022) (Table 3).
Table 3: Likelihood to purchase reformulated or smaller portion sizes of food
| Reformulated and portion size options |
More likely to buy |
Would not change purchasing behaviour | Less likely to buy |
|---|---|---|---|
| Reduced sugar products | 47% | 38% | 15% |
| Reduced saturated fat products | 51% | 40% | 9% |
| Reduced salt products | 42% | 48% | 10% |
| Smaller portion sizes of sugary snacks/meals | 34% | 46% | 20% |
| Smaller portion sizes of snacks/meals high in saturated fat | 34% | 47% | 19% |
| Smaller portion sizes of snacks/meals high in salt | 26% | 53% | 21% |
Base: 611 adults in Northern Ireland.
Note: Row totals do not add to 100% due to rounding.
Interest in reformulated and reduced portion size options
Participants were asked which reformulated or reduced portion size options they would like to see more of when buying food.
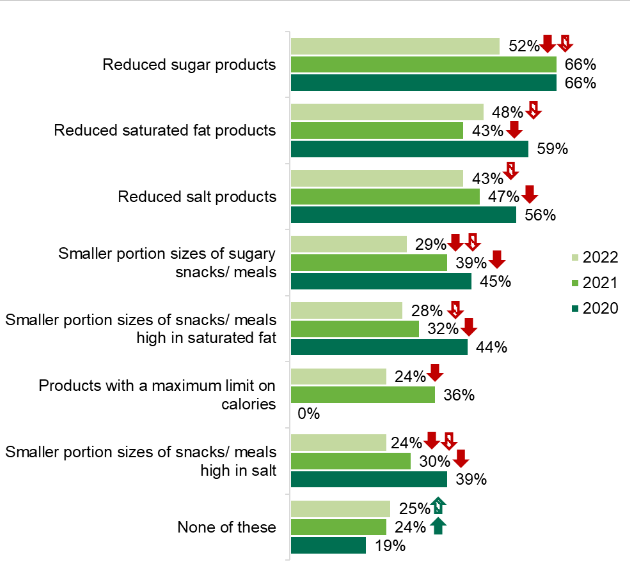
Similar to previous years, consumers would generally like to see increased availability of food reduced in sugar, saturated fat, and salt in comparison to smaller portion sizes of food high in these nutrients.
In general, close to half of participants reported that they would like to see food reduced in sugar (52%), saturated fat (48%) and salt (43%), which has decreased from 2020. Similarly, the percentage of participants who reported wanting to see smaller portion sizes of food high in sugar (29%), saturated fat (28%) and salt (24%) has decreased from 2020 and 2021.
Almost a quarter (24%) of participants report that they would like to see products with a maximum limit on calories which has decreased considerably when compared to 2021 (36%).
One quarter (25%) of participants reported that they would not like to see increased availability of at least one of the reformulated and/or smaller portion size options. This figure is unchanged from 2021 although has increased when compared to 2020 (19%) (see Figure 21).
Figure 21: Proportion of participants who would like to see increased availability of healthier alternatives when shopping for food
Base: Adults in Northern Ireland: 2022 (611), 2021 (603), 2020 (601).
The green arrow indicates significantly higher than previous year, the green patterned arrow indicates significantly higher than 2020.
The red arrow indicates significantly lower than previous year, the red patterned arrow indicates significantly lower than 2020.
* Not included in 2020.
Note: Totals do not add to 100% as participants could select multiple responses.
Key demographic variable analysis
All analysis mentioned below is significant to the 95% level unless stated otherwise. Therefore, questions where no significant differences are found are not included. Questions and possible answers within questions with an insufficient base for reliable significance testing are also omitted from the demographic variable analysis.
Where the question is an agreement scale, ‘agree’ is the sum of strongly agree and tend to agree.
All demographic analysis can be found in the data tables that can be requested. Below is a summary of the key demographic findings.
Gender
Women (75%) were more likely to say they actively seek out healthier options when shopping compared to men (62%).
Women were also more likely to look at information on the front of the pack to find out nutritional information than men (38% versus 29%) and more likely to say they use the traffic light labelling system to find out nutritional information in comparison to men (35% versus 23%).
Nearly half of men (48%) report that they do not try to find out the nutritional information on products and 28% of women do not try to find out the nutritional information either.
Women (54%) were more likely than men (36%) to report having used the traffic light label when shopping for food.
Women were also more likely than men to report having used the traffic light label to look at calories (56% versus 33%).
Men (25%) were more likely than women (17%) to say that they would not like to see healthier products across a range of food settings (restaurants/pubs, vending machines, staff restaurants etc).
Male participants (32%) were more likely to report not wanting to see reformulated food or smaller portion sizes than female participants (18%).
Males
Men aged between 18-34 (25%) and 35-54 (23%) were more likely to have stated the correct recommended daily calorie intake (2,500) for their gender than those aged 55 and over (6%).
Male participants from a higher socio-economic group (25%) were more likely to have stated the correct recommended daily calorie intake (2,500) for their gender than those from a lower socio-economic group (13%).
Age
Participants aged between 18-24 (15%) and 35-54 (23%) were more likely to report shopping for food online from a supermarket in comparison to those aged 55 and over (4%).
Those aged between 18–34 (55%) were more likely than those aged 55 and over (35%) to report using the traffic light label to look at calories next to the label.
Those aged between 18-34 (43%) and 35-54 (41%) were more likely than those aged 55 and over (26%) to say they would like to see healthier products in food outlets in leisure facilities. These age groups were also more likely to report that they would like to see healthier products in vending machines (18-34, 35%; 35-54, 30%; 55 and over, 21%).
Participants aged between 35-54 (17%) were more likely to report that they would like to see healthier products in staff restaurants than those aged 55 and over (9%).
Participants aged between 18-34 (39%) and 35-54 (36%) were more likely to report having noticed calories shown on food menus in fast food restaurants than those aged 55 and over (11%).
Older participants aged 55 and over (30%) were more likely to report not wanting to see reformulated food or smaller portion sizes than those aged 35-54 (21%).
Socio-economic group
Those from a higher socio-economic group (43%) were more likely to report that they look at information on the front of the pack to find out nutritional information than those from a lower socio-economic group (26%).
They were also more likely to report that they use the traffic light labelling system to find out nutritional information in comparison to those from a lower socio-economic group (38% versus 22%).
Those from a lower socio-economic group (46%) were less likely than those from a higher socio-economic group to say they try to find out nutritional information of products (27%).
Participants from a higher socio-economic group (52%) were more likely than those from a lower socio-economic group (40%) to report having used the traffic light label when shopping for food.
They were also more likely to say they have used the traffic light label to look at calories next to the label (57% versus 37%).
Those from a higher socio-economic group (26%) were more likely to say they find it easy to choose healthier food and meals when eating in a staff restaurant at work compared to those from a lower socio-economic group (12%).
Those from a higher socio-economic group (37%) were more likely than those from a lower socio-economic group (29%) to report that they would like to see healthier products in restaurants and/or pubs.
They were also more likely to have noticed calories shown on food menus in fast food restaurants (34% versus 24%).
Participants from a lower socio-economic group (29%) were more likely to report not wanting to see reformulated food or smaller portion sizes than those from a higher socio-economic group (20%).
It is important to note that this survey was carried out during a period (17th September to 19th November 2022) of rising inflation, which resulted in significant price increases for food and drink. Coupled with this, the war in Ukraine also impacted the availability of some foods. This context should be considered when analysing key trends as NI consumers were faced with many competing priorities.
A large proportion of participants claimed to understand ‘what is healthier’, recognising the role of a varied and balanced diet of fruits, vegetables, and proteins such as lean meat and fish in contributing to a healthy diet, as well as reporting the need to limit intakes of fats, sugar, salt, ‘processed’ and ‘fast’ foods. This has stayed relatively constant over the past three years. These findings suggest that NI consumers have a good understanding of a healthy balanced diet as per the Eatwell Guide (FSA, 2020).
Although the majority agreed their personal eating habits are healthy, this has decreased when compared to 2021. This shift could reflect the impact of the cost-of-living crisis and the affordability of healthy food in relation to disposable income (IGD, 2022).
Recent figures show, one quarter of children in NI are classed as overweight or obese (DOH NI, 2020). It is encouraging that in contrast to previous years, a higher percentage of participants agree that their children's eating habits are healthy. Forming good nutrition habits in early life can reduce the risk of obesity and overweight in childhood, leading to better health outcomes in adulthood (WHO, 2021).
NI consumers continue to report being more likely to seek healthier options when food shopping compared to eating out. While shopping, significantly more consumers report looking at some form of nutritional labelling on food packaging than in 2021. Although most consumers continue to report an awareness and understanding of the traffic light labelling system, there has been a decrease in the proportion of consumers who report using this labelling to make food purchasing decisions.
Similar to 2020 and 2021, the majority of participants found it challenging to make heathier choices when eating out. At least one quarter reported they would want to see calorie labelling in settings such as cafes, sandwich shops, fast food restaurants, takeaways, and food outlets in leisure facilities.
A large proportion of participants were not aware of the government recommended daily calorie intake for their gender, although there are gender differences in the understanding of the daily recommended calorie intake. Considerably more female participants than males were able to recognise the correct daily calorie intake. Positively, since 2021, there has been a rise in the percentage of females who correctly identified the daily recommended calorie intake. This demonstrates that there may be scope for more education on calorie requirements among the male population of NI.
Taken together, the results of the 2022 EWCB survey demonstrate several opportunities exist to educate, encourage, and enable consumers to make healthier choices both in and outside the home.
Supporting consumers to make healthier choices in the shopping environment
Despite awareness and understanding of the traffic label being high, less than half use this label when making food decisions, significantly less than in 2020. Decreased use of front of pack nutrition labels has also been reported by the Institute of Grocery Distribution (IGD, 2020). A potential reason for this is the impact of COVID-19 on how consumers shop for food. As the pandemic and intermittent lockdowns resulted in shortages of supply, choice and availability became more important determinants of food choice than nutritional profile (IGD, 2020). As front of pack nutritional labelling is recommended by the World Health Organisation as a strategy to improve dietary intake (WHO 2022), it will be important to continue monitoring NI consumer engagement with this label as the UK emerges from the COVID-19 pandemic and continues through a cost-of-living crisis.
In a recent study, the UK traffic light label was compared to other front of pack nutrition labels. It was reported that the UK traffic light label had the highest proportion of participants who reported having enough information to select healthier food choices (Packer et al. 2021). Although the use of the label has decreased in 2022, consumers who use the label check for information on sugar, fat and saturated fat.
More than half of people who use the traffic light label to buy 'healthier' food report using it ‘most times' when making food decisions, even though the use of the label has decreased. Considering this, there may be potential for further consumer promotion and education regarding the use, purpose, and benefits of the label. By highlighting competitive advantage in terms of "healthier" front of pack labelling, food manufacturers may be persuaded to engage in reformulation and display front of pack nutritional labelling.
Reformulating food to reduce saturated fat, sugar, and salt, as well as reducing the portion size of food high in these nutrients is recognised as an important public health strategy to tackle obesity and to support consumers to make healthier choices when food shopping (UK Parliament Post 2021). The results of the EWCB survey demonstrate that the majority (75%) of NI consumers are receptive to food reduced in either sugar, saturated fat, or salt or smaller portions of foods containing these nutrients and would like to see increased availability of at least one of these options when buying food. Consumers are more receptive to foods reduced in sugar, fat and salt than smaller portion sizes. These findings highlight the need to continue supporting the food industry to make smaller portions of food appealing to consumers.
Supporting consumers to make healthier choices when eating out of home
Most consumers reported finding it easier to prepare healthier meals at home and to choose healthier products when purchasing food items in a supermarket store or from a local shop than making healthier choices when eating outside of the home. Participants found it particularly difficult to make healthier choices in fast food restaurants, take-aways, leisure facilities and vending machines. In response, a large proportion of consumers would like to see increased availability of healthier food in these settings as well as restaurants and bars.
The results suggest it is important to continue supporting and encouraging food businesses to provide healthier options and to make those options appealing to consumers.
NI consumers report that calorie information on menus impacts the decision on what to eat in some settings more than others. For example, food decisions were more likely to be influenced by calorie labelling in staff restaurants at work and sandwich shops/cafes compared to fast food restaurants, takeaways, food in leisure centres, and restaurants and bars.
Despite this, at least one third of participants reported they would like to see calorie labelling on menus across a range of food settings, although the proportion of participants reporting that they would like to see calories shown on menus in settings outside the home is lower across all settings when compared with 2020.
Consumer awareness of calorie information on menus could be a result of mandated calorie labelling being implemented throughout England in a drive to tackle obesity and improve the nation’s health (DHSC, 2021).
Providing calorie information on menus in NI would support consumers to make healthier informed choices, particularly consumers who also want to see increased availability of healthier options outside the home.
Demographic trends
The findings of this survey show that consumers’ knowledge, attitudes, and behaviours toward healthier food vary by gender. Males in NI are less likely than females to actively seek healthier options when they shop for food, find nutrition information on food packages, or recognise, use, and understand the traffic light label. They are also more likely to not want to see healthier products outside the home, claim that calorie labelling on menus never affects their choice of food, and state that they do not want calories to be displayed on food menus in any of the common settings.
Differences in food choice between males and females have also been documented in other research (Arganini et al. 2012). Women are consistently reported to have a higher intake of fruit and vegetables, dietary fibre and a lower intake of fat than men (Arganini et al. 2012). Women are also known to place greater importance on healthy eating than men (Bärebring et al. 2020) and are reported to be more interested in and actively seek health related information. Such findings highlight the need to further consider the most effective public health strategies to engage males with healthier eating.
Differences in attitudes and behaviours towards healthier food were also evident across socio-economic groups. Those from lower socio-economic groups are significantly less likely to agree that their personal eating habits were healthy; to actively seek out healthier options when eating out; to recognise and use the traffic light label; and, to say they would like to see products with a maximum limit on calories when they buy food.
The World Health Organisation (WHO) recognises the impact of socio-economic inequalities on health, particularly obesity and nutrient deficiencies (WHO 2014). Dietary intake in socially disadvantaged groups is driven by complex interactions between behaviours and exposure to daily social, economic and physical environments resulting in dietary intakes being less likely to meet government healthy eating guidelines (Gillies et al. 2021). Socially disadvantaged groups also tend to have a higher incidence of diet related non-communicable diseases including cardiovascular disease, cancers, and type 2 diabetes (Gillies et al. 2021), as well as higher morbidity and mortality rates due to these conditions. As the findings of this survey indicate that socially disadvantaged groups are less likely to seek out healthier options, the importance of continuing to prioritise this demographic group when developing policy to improve dietary intake is of paramount importance.
- Department of Health Northern Ireland (DOH NI), 2020. Health Survey (NI) First Results 2018/2019. [Web page]. [Accessed 24 February 2023].
- Department of Health and Social Care (DHSC), 2021. Calorie labelling in the out of home sector: implementation guidance. [Web page]. [Accessed 24 February 2023].
- Food Standards Agency (FSA), 2020. The Eatwell Guide. [PDF]. [Accessed 10 March 2023].
- Gillies, C., Sabina Super, S., te Molder, H., de Graaf, K. and Wagemakers, A. (2021) 'Healthy eating strategies for socioeconomically disadvantaged populations: a meta-ethnography', [PDF]. The International Journal of Qualitative Studies on Health and Well-being, 16(1).
- Institute of Grocery Distribution (IGD), 2022. How the cost of living crisis will impact health. [Web page]. [Accessed 24 February 2023].
- Institute of Grocery Distribution (IGD), 2020. Shopper insights: Front of pack nutrition labels. [Web page]. [Accessed 2nd March 2023].
- Packer, J., Russell, S. J., Ridout, D., Hope, S., Conolly, A., Jessop, C., Robinson, O. J., Stoffel, S. T., Viner, R. M. and Croker, H. (2021) Assessing the Effectiveness of Front of Pack Labels: Findings from an 'Online Randomised-Controlled Experiment in a Representative British Sample', [PDF]. Nutrients, 13(3), pp. 900-915.
- UK Parliament POST, POST NOTE Number 638, January 2021. Food and drink reformulation to reduce fat, sugar and salt. [Web page]. [2nd March 2023].
- Westenhoefer, J. (2005) ‘Age and gender dependent profile of food choice’, [Web page].
- Forum of Nutrition, (57) pp.44-51.
- World Health Organisation (WHO), 2021. How healthy are children’s eating habits- WHO/Europe surveillance results. [Web page]. [Accessed 24 February 2023].
- World Health Organisation (WHO), 2022. Manual to develop and implement front-of-pack nutrition labelling. [PDF]. [Accessed 10 March 2023].
- World Health Organisation (WHO), 2014. Obesity and inequalities. Guidance for addressing inequalities in overweight and obesity. [Web page] [Accessed 2nd March 2023].
Good morning/afternoon/evening, I am _____________ from Ipsos, a market and social research company. We are currently conducting a research study about consumer attitudes and behaviours towards healthier food. We are conducting this research on behalf of the Food Standards Agency (FSA). Your input would be of great value to us. There are no right or wrong answers, and please be assured that the information collected from you will be treated completely confidentially. Your answers will be combined with information from other participants and only the total results will be used for reports that will be provided to the FSA.
The survey will take approximately 20 minutes to complete.
Would you be happy to take part in this research?
1. Yes
2. No
Thank you for agreeing to complete this survey. Before we begin, if you would like to read our privacy policy then you can access it at <insert link>.
I also must draw to your attention that within this survey we ask information about your household and income, just to ensure that we speak to a range of people within Northern Ireland. Are you happy to proceed with this research on this basis?
1. Yes
2. No
I'd also like to inform you that Ipsos is a member of the Market Research Society. All information that you give us will be treated in the strictest confidence and your identity will not be passed on to a third party or connected to your answers in any way.
Before continuing with this survey, I need to check that you are eligible to take part.
In the last 12 months, who is typically responsible for the food shopping for your household? Please include both online and in store food shopping.
- I am responsible for all or most of the food shopping
- I share the responsibility with someone else
- Someone else in my household
- Someone else outside of my household e.g., a relative or carer
- Each person is responsible for their own food shopping
- Don’t know
Which of the following best describes you…?
- Male
- Female
- In another way
- Refused/prefer not to say
What is your age?
[TYPE IN]
Can you confirm your postcode? (If required: this is just so we can check that we have up-to-date records)
[TYPE IN]
Which of these regions best describes where you live?
- Belfast City
- Greater Belfast
- Co. Down
- Co. Armagh
- Co. Tyrone/ Co. Fermanagh
- Co. Derry
- Co. Antrim
- None of these
Which of these best describes the area you live in?
- Open countryside
- A hamlet
- A village
- A small town in the countryside
- A medium town
- A large town
- Inner city
- Outer city (Suburban)
The Chief Income Earner is the person in your household with the largest income, including you. If the Chief Income Earner is retired but still has the largest income via an occupational pension, please answer for their most recent occupation.
If the Chief Income Earner is not in paid employment but has been out of work for less than 6 months, please answer for their most recent occupation.
1. Self Employed / Business Owner
2. Skilled manual worker (for example, Skilled Bricklayer, Carpenter, Plumber, Painter, Bus/ Ambulance Driver, HGV driver, AA patrolman, pub/bar worker, etc.)
3. Semi or unskilled manual work (for example, Manual workers, all apprentices to be skilled trades, Caretaker, Park keeper, non-HGV driver, shop assistant)
4. Supervisory or clerical/junior managerial/professional/ administrative (e.g., Office worker, Student Doctor, Police Constable, Firefighter, Foreman with 25+ employees, salesperson, etc.)
5. Intermediate managerial/professional/administrative (for example, Newly qualified (under 3 years) doctor, Solicitor, Board director small organisation, middle manager in large organisation, teacher, principal officer in civil service / local government, military lieutenant)
6. Higher managerial/professional/administrative (for example, Established doctor, Solicitor, Architect, Board Director in a large organisation (200+ employees), head teacher, police/fire chief, top level civil servant / public service employee, high ranking military officer)
7. Casual worker – not in permanent employment
8. Student
9. Housewife / Homemaker
10. Retired and living on state pension
11. Unemployed or not working due to long-term sickness
12. Full-time carer of other household member
How many employees do you have?
1. None – just me
2. 1 – 5
3. 6 – 25
4. 25+
Do you have any children aged under 16 living at home currently?
1. Yes
2. No
Do you have any grandchildren aged under 16 that you purchase food for at least once a month? By ‘food’ we mean food used to prepare whole meals and treats/snacks.
1. Yes
2. No
And how old are your children and grandchildren?
1. 0-3
2. 4-6
3. 7-10
11-13
14-16
You qualify for our survey! Thank you for taking part.
We would now like to ask you some questions about yourself and your opinion on things relating to food. There are no right or wrong answers here, we are just interested in what you think.
We would like you to take a moment to think about healthy eating.
What does healthy eating mean to you?
On a scale of 1-5 where 1 is strongly disagree and 5 is strongly agree…
To what extent would you agree or disagree that your personal eating habits are healthy?
To what extent would you agree or disagree that your children’s eating habits are healthy?
To what extent would you agree or disagree that your grandchildren’s eating habits are healthy?
1. Strongly disagree
2. Tend to disagree
3. Neither agree nor disagree
4. Tend to agree
5. Strongly agree
6. Don’t know
To what extent do you agree or disagree with the following statements?
- I understand what is healthier and what is less healthy
- I actively seek out healthier options when shopping
- I actively seek out healthier options when eating out
1. Strongly disagree
2. Tend to disagree
3. Neither agree nor disagree
4. Tend to agree
5. Strongly agree
6. Don’t know
What do you think the Government recommended daily calorie intake is for males? If you think you know but aren’t sure, please let us know what you think it is.
[TYPE IN]
What do you think the Government recommended daily calorie intake is for females? If you think you know but aren’t sure, please let us know what you think it is.
[TYPE IN]
In a typical month, where do you shop for food?
- Supermarket (including mini supermarkets for example, Metro/local)
- Online from a supermarket (including home delivery and click and collect)
- Home delivery not from a supermarket (for example, vegetable boxes, Deliveroo, Hello Fresh)
- Local/corner shop, newsagents, or garage forecourt
- Independent greengrocer, butcher, baker, or fishmonger
- Market/farmers’ market/farm shop
- Other (please specify)
- None of these
How, if at all, do you tend to find out how much sugar, salt, saturated fat, or calories are in a product when food shopping in store?
- look at the ingredient list
- look at information on the front of the pack (e.g. claims)
- use the traffic light labelling system
- look at the nutritional information usually found on the back-of-the-pack
- other (please specify)
- I don’t try to find this out
How, if at all, do you tend to find out how much sugar, salt, saturated fat, or calories are in a product when food shopping online?
- look at the ingredient list
- look at information on the front of the pack (e.g. claims)
- use the traffic light labelling system
- look at the nutritional information usually found on the back-of-the-pack
- other (please specify)
- I don’t try to find this out
Thinking about when you are choosing food whilst shopping, some foods show traffic light labels on the front of packets/packaging
Here is an example image of the traffic light label
Do you recognise this traffic light image?
1. Yes
2. No
Do you use this when shopping for food?
1. Yes
2. No
On a scale of 1-5 where 1 is strongly disagree and 5 is strongly agree, to what extent would you agree or disagree with the following statement:
I understand what traffic light labels on the front of food packaging are for.
1. Strongly disagree
2. Tend to disagree
3. Neither agree nor disagree
4. Tend to agree
5. Strongly agree
6. Don’t know
What do you think these traffic lights are for?
OPEN QUESTION
How often, if at all, do you choose ….?
- Foods with ‘healthier’ traffic light colours (green/amber)
- Foods with a lower percentage of my recommended daily calorie intake
Which, if any, of these do you do when buying food for yourself?
Which, if any, of these do you do when buying food for your children?
Which, if any, of these do you do when buying food for your grandchildren?
1. I look at the calories next to the traffic light label
2. I use the traffic light label to understand the amount of Fat in products
3. I use the traffic light label to understand the amount of Saturated fat in products
4. I use the traffic light label to understand the amount of Sugar in products
5. I use the traffic light label to understand the amount of Salt in products
6. I use the traffic light label to find information on portion size
7. I don’t do any of these
Overall, for each of the following, how easy or difficult is it for you to choose healthier food and meals?
- when buying from a supermarket in-store
- when buying from a supermarket online
- when buying from a local/corner shop, newsagent, or garage forecourt
- when eating in restaurants and/or pubs
- when eating in my staff restaurant at work
- when preparing meals at home
- when buying food from a vending machine
- when buying from cafés/sandwich shop e.g., supermarket cafés/high street coffee shops
- when buying from a take-away
- when buying from/eating in a fast food restaurant
- food outlet in leisure facilities for example, cinemas, bowling alleys, entertainment centres
1. Very difficult
2. Quite difficult
3. Quite easy
4. Very easy
5. Not applicable
Where, if in any setting, would you like to see healthier products?
1. Supermarkets
2. Local/ corner shop, newsagents, or garage forecourts
3. Restaurants and/or pubs
4. Staff restaurant at work
5. Vending machines
6. Cafés/Sandwich shops for example, supermarket cafés/high street coffee shops
7. Fast food restaurants
8. Takeaways
9. Food outlets in leisure facilities for example, cinemas, bowling alleys, entertainment centres
10. Other (please specify)
11. None of these
Have you ever noticed calories being shown on a food menu in any of these places?
1. Restaurants/pubs
2. Staff restaurant at work
3. Cafés/Sandwich shops for example, supermarket cafés/high street coffee shops
4. Fast food restaurant
5. Takeaways
6. Food outlets in leisure facilities for example, cinemas, bowling alleys, entertainment centres
7. Other (please specify)
8. None of these
How often, if at all, do calories shown on a food menu influence your decision of what to eat?
- in restaurants/pubs
- staff restaurant at work
- in cafés/Sandwich shops for example, supermarket cafés/high street coffee shops
- in fast food restaurant
- in takeaways
- food outlets in leisure facilities for example, cinemas, bowling alleys, entertainment centres
1. It never influences my decision
2. Not very often
3. Every now & then
4. Most times
5. It always influences my decision
In what venues, if any, would you like to see calories being shown on a food menu?
Restaurants/pubs
1. Staff restaurant at work
2. Cafés/Sandwich shops for example, supermarket cafés/high street coffee shops
3. Fast food restaurant
4. Takeaways
5. Food outlets in leisure facilities for example, cinemas, bowling alleys, entertainment centres
6. Other (please specify)
7. None of these
Thinking about when you are shopping for/choosing food products, in particular manufactured products such as sauces, cereals, meals, snacks, and puddings…
How likely or unlikely would you be to buy these options compared to a regular version of products? (for example, for sauces, cereals, meals, snacks and puddings)
- reduced sugar products
- reduced saturated fat products
- reduced salt products
- smaller portion sizes of sugary snacks/meals
- smaller portion sizes of snacks/meals high in saturated fat
- smaller portion sizes of snacks/meals high in salt
1. Much less likely to buy it
2. A little less likely to buy it
3. It wouldn’t change
4. A little more likely to buy it
5. Much more likely to buy it
Which, if any, would you like to see more of when you buy food?
1. Reduced sugar products
2. Reduced saturated fat products
3. Reduced salt products
4. Products with a maximum limit on calories (e.g., chocolate bars, sweets, slices of cake, croissants, biscuits)
5. Smaller portion sizes of sugary snacks/meals
6. Smaller portion sizes of snacks / meals high in saturated fat
8. Smaller portion sizes of snacks / meals high in salt
9. None of these
Almost finished! Thank you for your opinions so far. Now we would just like to ask a final question about yourself.
Please select the range which best describes your annual household income?
If you’re not sure, your best guess is fine.
1. Under £10,000
2. £10,000-£19,999
3. £20,000-£29,999
4. £30,000-£39,999
5. £40,000-£49,999
6. £50,000-£59,999
7. £60,000-£69,999
8. £70,000-£79,999
9. £80,000-£89,999
10. £90,000-£99,999
11. £100,000+
12. Not sure / Don’t know
13. Would rather not say
Thank you for your participation in this survey which is being conducted on behalf of the Food Standards Agency.
Would you be willing for us to contact you if we have any further questions about the interview?
- Yes
- No
- Refused/Prefer not to answer
- Don’t know
Table 4: Age bands, proportion in NI population and proportion in survey
| Age band | Proportion in the population |
|
Proportion in the survey |
|---|---|---|---|
| 18 to 24 | 13% | 13% | 12% |
| 25 to 34 | 18% | 18% | 22% |
| 35 to 44 | 18% | 18% | 16% |
| 45 to 54 | 18% | 18% | 16% |
| 55 to 64 | 14% | 14% | 15% |
| 65 or older | 19% | 19% | 18% |
Base: 611 adults in Northern Ireland
Table 5: Gender, proportion in NI population and proportion in survey
| Gender | Proportion in the population |
|
|
|---|---|---|---|
| Male | 49% | 49% | 49% |
| Female | 51% | 51% | 51% |
Base: 611 adults in Northern Ireland
Table 6: Socio-economic group, proportion in NI population and proportion in survey
| Socio-economic group | Proportion in the population | Weighted proportion |
|
|---|---|---|---|
| ABC1 | 45% | 45% | 41% |
| C2DE | 55% | 55% | 59% |
Base: 611 adults in Northern Ireland
Table 7: Explanation of socio-economic groupings
| Grade |
|
Examples of occupations | Retiree description. |
|---|---|---|---|
| A | These are professional people, or are very senior in business or commerce or are top level civil servants. |
|
Retired people, previously grade A, and their widows. |
| B. | Middle management executives in large organisations, with appropriate qualifications Top management or owners of small business. |
|
Retired people, previously grade B, and their widows. |
| C1 | Junior management owners of small establishments: and all others in non-manual positions Jobs in this group have very varied responsibilities and educational needs |
|
Retired people previously grade C1 and their widows. |
| C2 | All skilled manual workers, and those manual workers with responsibility for other people |
|
Retired people previously grade C2 with a pension from their job Widows if receiving pensions from their late husband’s job |
| D | All semi-skilled and unskilled manual workers, and apprentices and trainees to skilled workers |
|
Retired people previously grade D with a pension from their job Widows if receiving pensions from their late husband’s job |
| E | All those entirely dependent on the state long term, through sickness, unemployment, old age, or other reasons. Those unemployed for a period exceeding 6 months (otherwise classify on previous occupation) Casual workers and those without a regular income Only households without a chief wage earner will be coded in this group |
|
N/A |
Revision log
Published: 27 March 2023
Last updated: 4 April 2024