Research project
What’s on the children’s menu?
Northern Ireland specific
Research into children’s meals served in restaurants in Northern Ireland
Acknowledgements
The Food Standards Agency in Northern Ireland would like to thank:
- Michelle Young, Aoibheann Dunne and Catherine Hopkins for data analysis and preparing the report.
- The Food and Nutrition Subgroup of the Northern Ireland Food Manager’s Group (NIFMG), for managing the survey and sampling and assisting in the preparation of the final report.
- Environmental Health Teams from the eleven councils in Northern Ireland who conducted the survey and sampling and funded the nutritional analysis of children’s restaurant meals.
This report is available in accessible PDF format:
Northern Ireland
Executive Summary
Introduction
Families and children enjoy eating out regularly as a way of socialising and celebrating as well as for convenience. Food eaten in places like restaurants, fast food outlets and cafés, known collectively as the out of home food sector, tends to come in bigger portions and be higher in energy, fat, salt and sugar and lower in fruit and vegetables than meals prepared at home.
In Northern Ireland, children are eating too much saturated fat, sugar and salt and not enough fruit, vegetables, oily fish and fibre. This is having a harmful impact on their growth and development and increases the risk of excess weight gain and tooth decay.
It is estimated that around a quarter of the calories eaten by UK consumers now comes from food from the out of home sector, therefore food businesses such as restaurants, fast food outlets and cafés have more influence over consumers diets.
To understand more about the food available to children when eating out, the FSA and local council environmental health teams conducted research with Northern Ireland restaurant owners/managers to explore their perspectives of providing heathier options for children, to investigate the range of options available on children's menus and determine the nutritional content of popular children’s meals.
Main findings
The children’s menus were limited in terms of choice and there were few healthy options.
The most popular children’s meals were reported to be coated fried chicken and chips, sausages and chips, burger and chips and a pasta dish.
Chips were offered with 72% of children’s meals, while vegetables were only available with 24% of meals.
The coated fried chicken and chips, sausages and chips and burger and chips meals were generally high in total fat, saturated fat and salt. Some of the children’s meals contained more of these nutrients than is recommended for younger children.
While views on providing healthier options were mixed, most restaurant owners/managers saw the out of home/food service sector as having a role in improving children’s diets.
Conclusions
This research indicates that work is needed to improve the nutritional quality of food available to children when eating out.
Next steps and recommendations
The FSA has developed ‘Healthier catering tips for children's menus’. The guidance which will be promoted by local councils, provides tips for businesses to improve the nutritional quality of their children’s meals.
The FSA will also consider how it can further support businesses to improve the nutritional quality of food available on children’s menus.
Introduction
Children’s diets
In Northern Ireland, children’s diets generally do not meet current dietary recommendations. Data from the National Diet and Nutrition Survey (NDNS) shows that children in Northern Ireland are eating too much sugar, saturated fat and salt and not enough fruit, vegetables, oily fish and fibre (Figure 1).
Figure 1. Children’s dietary recommendations and average dietary intakes
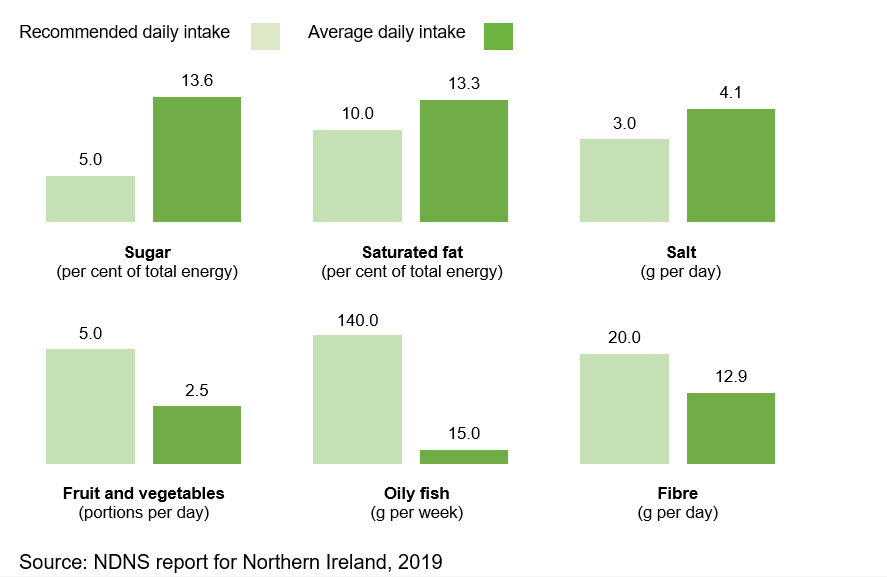
Not meeting dietary recommendations in childhood can impact growth and development and lead to excess weight gain and tooth decay (SACN, 2023).
Eating out of home
Eating habits in Northern Ireland have changed over the years and eating out is no longer an occasional treat. There has been an increase in the number of food businesses such as full service and quick service restaurants, coffee shops and cafés, food-to-go and takeaways serving food out of the home. There has also been an increase in consumers eating out or ordering takeaway. An FSA survey found that 60% of Northern Ireland respondents with children aged 16 years or under ate out at least once in the 4 weeks prior to completing the survey (FSA, 2022). Another survey reported that half of UK families eat out at least once a week and make up an estimated 57% of restaurants’ revenue (Caterer, 2023).
Evidence suggests that meals eaten out of the home in for example, restaurants, tend to be bigger and higher in energy, saturated fat, sugar and salt and lower in fruit, vegetables and micronutrients compared to meals prepared at home (Ziauddeen et al., 2018; Young et al., 2019).
Children’s menus tend to have limited choice and healthier options are often not available (safefood, 2013). Research shows that children, parents and caterers think children’s menus could be improved and that there is a desire for healthier options (safefood, 2013; Mintel, 2021; Caterer, 2023).
There is accumulating evidence to support the need to improve the nutritional quality of children’s meals in UK chain and fast-food restaurants (PHE, 2020). There is however a lack of evidence on the nutritional content of children’s meals served in local restaurants in Northern Ireland. This report aims to address this evidence gap.
As part of Northern Ireland’s Obesity Prevention Strategy ‘A Fitter Future for All’, the Food Standards Agency (FSA) and local councils in Northern Ireland committed to exploring the foods available to children when eating out and assessing the nutritional content of this food.
Study overview
The aim of this research was to –
- gather information on children’s menus and identify barriers and opportunities to making them healthier,
- investigate the range of foods available to children in restaurants in Northern Ireland and
- determine the portion size and nutritional content of popular children’s meals served in restaurants in Northern Ireland.
The results of this research can be used to inform work to support food businesses to make the food they serve to children healthier. The results may also be used as baseline data against which any changes can be measured.
Methods
There were three parts to this research –
- A survey with restaurant owners/managers
- Analysis of children’s menus from restaurants in Northern Ireland
- Sampling and nutritional analysis of popular children’s meals served in restaurants in Northern Ireland
Survey and analysis of menus
Environmental Health Officers (EHO) surveyed restaurant owners/managers and obtained children’s menus from at least ten restaurants or hotels in their local council area between May and August 2022. The survey was conducted in person or by phone.
The survey is available on request by emailing DietaryHealthNI@food.gov.uk.
The survey responses and menus were analysed by the FSA and results were used to identify the most popular children’s meals for sampling and nutritional analysis.
Sampling and nutritional analysis
EHO’s collected a minimum of eight samples (two samples of each of the most popular children’s meals) from local restaurants or hotels between January and March 2023.
Multinational chain restaurants and chain hotels as well as other food outlets such as cafés, bakeries and service stations were excluded.
Samples were sent to the Public Analyst Scientific Services, a United Kingdom Accreditation Service (UKAS) accredited laboratory, for Group II nutritional analysis (energy, total fat, saturated fat, sugars, fibre, protein and salt).
The sampling protocol is available on request by emailing DietaryHealthNI@food.gov.uk.
Data
Data tables of anonymised survey responses, menu analysis and nutritional analysis results are available on request by emailing DietaryHealthNI@food.gov.uk.
Main findings
Children’s menus
Few healthy options were available on children’s menus and choice was limited.
The most popular children’s meals (those restaurant owner/managers reported were most commonly ordered by customers) were coated fried chicken and chips, sausages and chips, burger and chips and pasta.
Chips were available with 72% of meals, while vegetable sides were available with only 24% of meals.
Meal deals were popular, with many restaurants offering a main course, a drink, and a dessert for a set price (56%).
Children’s menus were generally for those under 12 years of age (73%).
Nutritional content
The coated fried chicken and chips, sausages and chips and burger and chips meals were generally high in energy, total fat, saturated fat and salt –
- 43% of meals contained more than half the average daily energy recommendation for 5-year-olds.
- 66% of meals contained more than half the average daily total fat recommendation for 5-year-olds.
- 47% of meals contained more than half the average daily maximum saturated fat recommendation for 5-year-olds.
- 70% of meals contained more than half the daily maximum amount of salt recommended for 5-year-olds.
Some children’s meals contained more energy, total fat, saturated fat, and salt than is recommended for younger children.
Healthy options
Half (50%) of restaurant owners/managers reported including a healthier option on their children’s menu. However, they were not well promoted. Only 10% of these establishments promoted them on their children’s menu.
Healthier options were reported to be things like pasta, roast dinner and grilled chicken.
Restaurants that provided healthier options found that it was cost effective and customer attitudes were positive.
Restaurant owners/managers attitudes to providing healthier options were mixed but most agreed that the out of home sector had a role in improving children’s diets (70%).
Survey with restaurant owners/managers
A total of 136 surveys were returned, of which 133 met the inclusion criteria.
Children’s menus
All 133 restaurants had a children’s menu and a third (32%, n = 43) also reported that children could order smaller portions off the main menu.
Most children’s menus had an age limit (83%, n = 111). The majority were reported to be for children under 12 years of age (73%, n = 83).
Over half of restaurants did not offer different sized children’s meals for different age groups (68%, n = 90). A third of restaurant owners/managers did however report that restaurants would provide baby bowls or bigger or smaller portions on request (32%, n = 43).
Restaurant owners/managers were asked about the pricing structure of their children’s menus and whether they offered any promotions. Many restaurants offered a set menu for a set price (56%, n = 70). This mainly consisted of a main meal, drink and dessert. Very few restaurants offered promotions (12%, n=15). The main promotion was ‘children eat free with a full price adult meal’ (of the restaurants that offered promotions 64% (n=9) ran this promotion).
The children’s meals that restaurant owners/managers reported were most commonly ordered were coated (breaded and battered) fried chicken and chips (85%, n = 113 businesses reported this to be one of the most commonly ordered meals), sausages and chips (47%, n = 62), burger and chips (38%, n = 50) and pasta (includes pasta in either a tomato-based or a cream-based sauce) (32%, n = 42).
None of the menus were reported to include nutritional information.
Cooking practices
When asked where children’s meals were made, just over half of restaurant owners/managers reported that they were a combination of food items made from scratch on site and food items bought in preprepared (53%, n = 69). Forty-four percent (n = 58) reported that the entire meal was made from scratch on site and 3% (n = 4) reported meals were bought in preprepared.
Salt was added to children’s meals in 21% (n = 28) of restaurants. This was mainly to chips and water for cooking pasta and rice. Most restaurant owners/managers however, reported that salt was not added to children’s food served in their restaurant (79%, n = 104).
Healthy options
Restaurant owners/managers were asked about the provision of healthier options on children’s menus in their restaurants.
Half of restaurant owners/managers reported that at least one option they thought was healthier was included on the children’s menu (50%, n = 66). Only 5% (n = 7) of restaurant owners/managers reported informing customers which options were healthier and this was largely done verbally, with only two restaurant owners/managers reporting that the information was included on the menu.
Restaurant owners/managers didn’t inform customers which options were healthier because they thought it would be clear by looking at the menu (11%, n = 14), they didn’t want to influence customer decisions (9%, n = 12), they had never thought about it (6%, n = 8) and because there was no room on the menu (2%, n = 3).
The healthier options were reported to be things like pasta (23%, n = 31), roast dinner (14%, n = 19) and grilled or pan-fried chicken (8%, n = 10).
Restaurant owners/managers that reported including healthier options on children’s menus provided a range of responses when asked why they did so. Responses fell into four broad categories, 57% (n = 24) reported that it was to add variety to the menu, 29% (n = 12) reported that there was a demand for healthier options from parents and/or children, 7% (n = 3) reported it was for health reasons and 7% (n = 3) reported that it was to reflect the options available on the main menu. Some responses from restaurant owners/managers are provided below.
For variety & I think healthier option should always be available
Parents would sometimes request another option rather than chicken bites and they want veg with their children’s meals
I didn’t put healthy choices on with the intention of being healthy, it just happens to be a healthier option and a popular choice
Most restaurant owners/managers that reported providing healthier options found that doing so did not result in any additional cost (73%, n = 44). Some restaurant owners/managers reported that healthier meals cost more than other options on the children’s menu (18%, n = 11) and some reported that they had incurred costs for product development (5%, n = 3).
Consumer attitudes to providing healthier options were reported as being mainly positive (59%, n = 36). Only one restaurant owner/manager reported that attitudes were negative.
Restaurant owners/managers that did not offer healthier options were asked whether they had ever thought about putting healthier options on the menu. Most restaurant owners/managers reported that they hadn’t thought about it (54%, n = 33). Forty - six percent (n = 28) reported that they had thought about it but hadn’t done it.
When asked about barriers to putting healthier options on children’s menus, half of restaurant owners/managers reported that there was no demand for healthier food (50%, n = 67). Other perceived barriers were cost (5%, n = 7), time (5%, n = 7) and not knowing how to make children’s meals healthier (2%, n = 3). 40% (n = 53) of restaurant owners/managers didn’t think there were any barriers to putting healthier options on children’s menus.
Most restaurant owners/managers reported that staff had no nutrition training (86%, n = 114) however, 70% (n = 91) expressed that they would find it beneficial.
The majority of restaurant owners/managers agreed that the out of home sector has a role in improving children’s diets (70%, n = 93).
Children’s menus
A total of 136 children’s menus were returned, of which 135 met the inclusion criteria.
Starters
Just under a quarter of children’s menus included starters (22%, n = 29). Eighty-three starters were included on the children’s menus analysed. Where starters were included, the average number of options was 3. The most common options were soup (19%, n = 25), garlic bread (18%, n = 24) and fruit (8%, n = 11) (Table 1).
Table 1: Starter options
| Starter | Number of menus that include starter option | Percentage of menus that include starter option |
|---|---|---|
| Soup | 25 | 19% |
| Garlic bread | 24 | 18% |
| Fruit | 11 | 8% |
| Chicken based for example chicken wings | 4 | 3% |
| Cheese based for example mozzarella sticks | 2 | 1% |
Main Course
A total of 880 main course options were included on the children’s menus analysed. The average number of main course options was 7. The most common main courses included coated (breaded or battered) fried chicken (90%, n = 122), a burger (79%, n = 107) and sausages (78%, n = 105) (Table 2).
Table 2: Main course options
| Main course | Number of menus that include main course option | Percentage of menus that include main meal option |
|---|---|---|
| Coated (breaded or battered) fried chicken | 122 | 90% |
| Beef burger | 107 | 79% |
| Sausages | 105 | 78% |
| Coated (breaded or battered) fried fish | 96 | 71% |
| Pasta (in either a tomato-based or cream-based sauce) | 93 | 69% |
| Pizza | 55 | 41% |
| Roast | 38 | 28% |
| Steak | 29 | 21% |
| Grilled chicken | 26 | 19% |
| Chicken burger | 18 | 13% |
| Curry | 13 | 10% |
Sides
Thirty six percent (n = 48) of the children’s menus included a list of sides that customers could choose from (Image 1) however many did not, on these menus’ sides were predefined (64%, n = 87) (Image 2).
Image 1. Example of a children’s menu with a choice of sides
Children’s menu one
Beef burger
Sausages
Lasagne
Chicken curry
Fish goujons
Roast dinner
All of the above served with a choice of the following sides:
Vegetables (carrots and peas)
Creamed potatoes, rice, pasta, fries
Image 2. Example of a children’s menu without a choice of sides
Children’s menu two
Beef or chicken burger and fries
Chicken nuggets and fries
Fish fingers and fries
Sausages with beans and fries
Lasagne with fries
The most common sides on children’s menus were chips, they were included on 96% of menus (n = 130) followed by mashed potato, which was included on 65% of menus (n = 88) and vegetable sides, which were included on 53% of menus (n = 71) (vegetables contained in meals for example, tomatoes in pasta in tomato-based sauce, were not included as they were considered part of the main meal and not a side dish) (Table 3).
Table 3: Side options
| Sides/accompaniment | Number of menus that include this side/accompaniment option | Percentage of menus that include this side/accompaniment option |
|---|---|---|
| Chips/fries | 130 | 96% |
| Mashed potato, champ | 88 | 65% |
| Vegetables | 71 | 53% |
| Beans | 61 | 45% |
| Garlic Bread | 22 | 16% |
| Rice | 15 | 11% |
| Roast Potato | 7 | 5% |
| Boiled Potato | 4 | 3% |
Given that some sides were offered as an option with multiple meals on children's menus, while others were only offered with one main meal option, the number of meals that could be served with the various sides was also considered. Chips were included in the menu description for 72% of children’s meals (n = 634).
When vegetable sides per meal were considered, 24% of the children’s meals included a side of vegetables in the menu description (n = 208). Vegetable sides included things like peas, sweetcorn, carrots, and broccoli.
Beans were included in the menu description for 21% of children’s meals (n=187).
Desserts
Desserts were included on 67% of children’s menus (n = 90). A total of 194 desserts were included on the children’s menus analysed. Where desserts were included, the average number of options was 2. The most common desserts were ice-cream (66%, n = 89), a cake-based dessert (33%, n = 44) and jelly (9%, n = 12) (Table 4).
Table 4: Dessert options
| Desserts | Number of menus that include this dessert option | Percentage of menus that include this dessert option |
|---|---|---|
| Ice-cream | 89 | 66% |
| Cake-based dessert for example sponge cake, a brownie, sticky toffee pudding, a waffle | 44 | 33% |
| Jelly | 12 | 9% |
| Fruit | 11 | 8% |
| Cookie | 7 | 5% |
| Meringue | 5 | 4% |
Drinks
Drinks were included on less than half of children’s menus (41%, n = 55). A total of 101 drinks were included on the children’s menus analysed. Where drinks were included, the average number of options was 2. The most common drinks were squash type drinks (33%, n = 44), milk (9%, n = 12) and milkshakes (5%, n = 7) (Table 5).
Table 5: Drink options
| Drinks | Number of menus that include this drink option | Percentage of menus that include this drink option |
|---|---|---|
| Squash type drinks - fruit shoots, cordial | 44 | 33% |
| Milk | 12 | 9% |
| Milkshakes | 7 | 5% |
| Fizzy drinks | 6 | 4% |
| Fruit juice | 5 | 4% |
| Water | 2 | 1% |
Sampling and nutritional analysis
The results of the survey and menu analysis were used to decide which children’s meals to sample for nutritional analysis. Coated fried chicken, a burger and sausages were identified as being popular main courses, both on menus and ordered by customers. Chips were often the default side on menus and restaurant owners/managers reported they were a popular choice. Pasta was also a popular main course and many restaurant owners/managers reported that pasta in a tomato-based sauce was the healthier option on their menu. Coated fried chicken and chips, sausages and chips, a burger and chips and pasta in a tomato-based sauce were therefore the meals which were sampled.
EHO’s sampled meals as they were served. For example, if a meal was served with vegetables, beans, dips or sauces, garlic bread etc. this was included in the sample. Where there was a choice of side, EHO’s asked the restaurant owner/manager what the most popular side was and included it in the sample.
A total of 94 samples of children’s meals were collected, of which 91 met the inclusion criteria.
Table 6 shows the number of samples per meal type.
Table 6: Number of samples per meal type
| Meal | Number of samples |
|---|---|
| Coated (breaded or battered) fried chicken and chips | 23 |
| Burger and chips | 24 |
| Sausages and chips | 23 |
| Pasta in a tomato-based sauce | 21 |
The nutritional analysis results provided below are per portion, results per 100g are available on request by emailing DietaryHealthNI@food.gov.uk.
Children’s meals
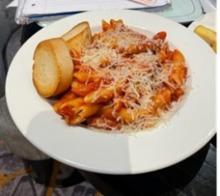
Images 3 to 10 are examples of typical meals sampled and the variety of portion sizes.
Image 3. Coated fried chicken and chips (229 g, 478 Kcal)
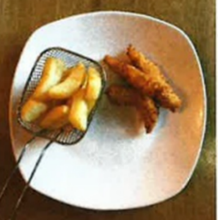
Image 4. Coated fried chicken and chips (465 g, 1195 Kcal)
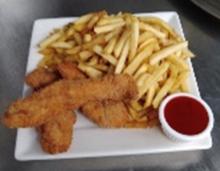
Image 5. Sausages and chips (186 g, 558 Kcal)

Image 6. Sausages and chips (386 g, 645 Kcal)
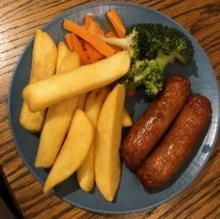
Image 7. Burger and chips (189 g, 512 Kcal)
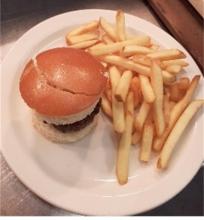
Image 8. Burger and chips (433 g, 1009 Kcal)
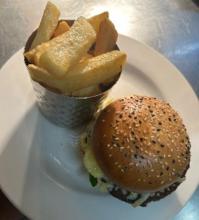
Image 9. Pasta in tomato-based sauce (115 g, 145 Kcal)
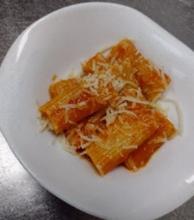
Image 10. Pasta in tomato-based sauce (408 g, 462 Kcal)
Portion size
On average, the children’s meals sampled weighed 308g. The average weight per portion was greatest for the burger and chips (328g) followed by coated fried chicken and chips (307g), pasta in tomato-based sauce (303g) and sausages and chips (293g).
The weight of the children’s meals sampled ranged from 115g to 465g. The weight of the coated fried chicken and chips meals ranged from 222g to 465g; the burger and chips meals ranged from 189g to 433g; the sausages and chips meals ranged from 186g to 386g and the pasta in tomato-based sauce ranged from 115g to 408g.
Energy
Per meal
On average, the children’s meals sampled contained 665kcal. The average energy content per meal was greatest for the burger and chips (827kcal), followed by coated fried chicken and chips (709kcal), sausages and chips (692kcal) and pasta in tomato-based sauce (402kcal).
The energy content of the children’s meals sampled varied considerably from 145kcal to 1195kcal. The energy content of the coated fried chicken and chips meals ranged from 478kcal to 1195kcal; the burger and chips meals ranged from 512kcal to 1111kcal; the sausages and chips meals ranged from 558kcal to 807kcal and the pasta in tomato-based sauce meals ranged from 145kcal to 859kcal.
Total fat
Per meal
On average, the children’s meals sampled contained 30.7g of fat. The average fat content per meal was greatest for the sausages and chips (39.6g), followed by the burger and chips (37.3g), coated fried chicken and chips (34.2g) and the pasta in tomato-based sauce (9.7g).
Fat content per meal varied considerably from 1.4g to 59.0g. The fat content of the coated fried chicken and chips meals ranged from 23.0g to 59.0g; the burger and chips meals ranged from 20.6g to 59.0g; the sausages and chips meals ranged from 30.0g to 46.0g and the pasta in tomato-based sauce meals ranged from 1.4g to 33.0g.
Saturated fat
Per meal
On average, the children’s meals sampled contained 8.0g of saturated fat. The average saturated fat content per meal was greatest for the sausages and chips (11.3g), followed by the burger and chips (11.2g), coated fried chicken and chips (5.1g) and the pasta in tomato-based sauce (3.9g).
The saturated fat content per meal varied considerably from 0.9g to 19.8g. The saturated fat content of the coated fried chicken and chips ranged from 2.4 to 9.2g; the burger and chips ranged from 5.7g to 19.8g; the sausages and chips ranged from 6.8 to 14.2g and the pasta in tomato-based sauce ranged from 0.9g to 15.0g.
Total sugars
Per meal
On average, the children’s meals sampled contained 5.0g of total sugars. The average total sugars content per meal was greatest for the pasta in tomato-based sauce (6.5g) followed by the burger and chips (6.1g), sausages and chips (4.6g) and coated fried chicken and chips (2.7g).
The total sugars content per meal varied considerably from 0.4g to 16.3g. The total sugars content of the coated fried chicken and chips ranged from 0.1g to 9.7g; the burger and chips ranged from 1.7g to 14.6g; the sausages and chips ranged from 0.4g to 8.4g and the pasta in tomato-based sauce ranged from 2.0g to 16.3g.
Salt
Per meal
On average, the children’s meals sampled contained 2.3g of salt. The average salt content per meal was greatest for the sausages and chips (3.3g), followed by the burger and chips (2.8g), coated fried chicken and chips (1.6g) and the pasta in tomato-based sauce (1.3g).
The salt content per meal ranged from 0.2g to 5.0g for all the meals sampled. The salt content of the coated fried chicken and chips ranged from 0.2g to 3.5g; the burger and chips ranged from 1.0g to 5.0g; the sausages and chips ranged from 2.2g to 4.5g and the pasta in tomato-based sauce ranged from 0.4g to 4.4g.
Fibre
Per meal
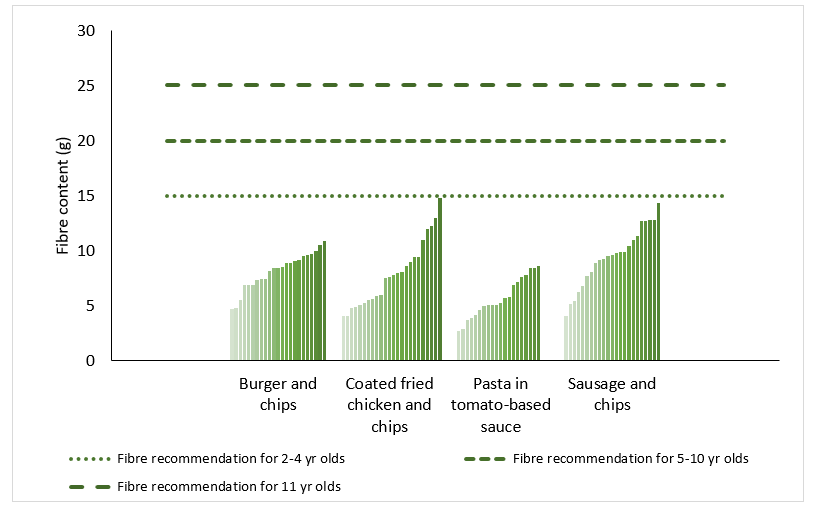
The children’s meals sampled contained an average of 7.9g of fibre. The average fibre content per meal was greatest for the sausages and chips (9.5g), followed by the burger and chips (8.6g), coated fried chicken and chips (7.9g) and the pasta in tomato-based sauce (5.4g).
The fibre content per meal ranged from 2.7g to 19.8g for all the meals sampled. The fibre content of the coated fried chicken and chips ranged from 4.1g to 14.8g; the burger and chips ranged from 4.7g to 19.8g; the sausages and chips ranged from 4.1g to 14.3g and the pasta in tomato-based sauce ranged from 2.7g to 8.6g.
Preparation methods
Most meals were bought in preprepared from a supplier (47%, n = 43). A quarter of meals (25%, n = 23) were made from scratch by the business and 28% of meals (n = 26) were a combination of items that were bought in preprepared and items that were made from scratch. It was not possible to compare the nutritional content of meals by preparation method.
Most restaurant owners/managers/chefs reported that the portion size of children’s meals was standardised (84%, n = 77). It was not possible to compare the nutritional content of meals by standardisation of portion size.
Salt was added to 31% (n = 28) of the children’s meals. The remaining 69% (n = 91) had no salt added during preparation or cooking. There was no significant difference in the salt content of meals with added salt compared to meals with no added salt.
Sides/accompaniments
Sides/accompaniments were included with 46% of the children’s meals sampled (n = 42). The most common sides were beans (22%, n = 20), garlic bread (10%, n = 9) and tomato ketchup (7%, n = 6) (Table 7).
Table 7. Sides/accompaniments served with children’s meals
| Side | Number of meals that included option | Percentage of meals that included option |
|---|---|---|
| Beans | 20 | 22% |
| Garlic bread | 9 | 10% |
| Tomato ketchup | 6 | 7% |
| Vegetables | 4 | 4% |
| Cheese | 3 | 3% |
Vegetables
Vegetables were included in 27% of the children’s meals sampled (n = 25). The vegetable in most of these meals was the tomato in the pasta in a tomato-based sauce meal (23%, n = 21). Four of the children’s meals were served with a side of vegetables (4%). Vegetable sides included peas (n = 3), carrots (n = 2) and broccoli (n = 1). A side of beans was served with 22% (n = 20) of the children’s meals (Table 8).
Table 8: Vegetables in children’s meals
| Vegetable | Number of meals that included option | Percentage of meals that included option |
|---|---|---|
| Tomatoes in tomato-based sauce | 21 | 23% |
| Beans | 20 | 22% |
| Vegetables (peas, carrots, broccoli) | 4 | 4% |
Comparison with children’s dietary recommendations
Energy
Energy requirements for children range from 932 kcal per day for 2-year-old females to 2127 kcal per day for 11-year-old males (SACN, 2011). Figure 2 shows the energy content of the sampled children’s meals and the average daily energy requirements for 2- to 4-year-olds.
Figure 2. Energy content of sampled children’s meals and dietary recommendations
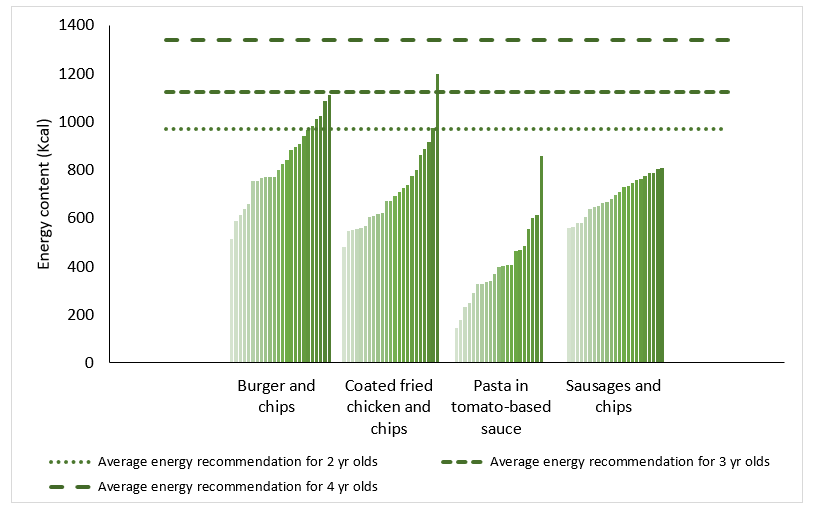
The average energy content of the children’s meals (665 kcal) was over two thirds of the average daily energy requirement for 2-year-olds and just under a third of the average daily energy requirement for 11-year-olds.
The meal with the greatest amount of energy, a coated fried chicken and chips meal (1195 kcal), contained more energy than the daily energy recommendation for 2- and 3-year-olds and over half the daily energy recommendation for 11-year-olds.
Forty-three percent of meals contained more than half the average daily energy recommendation for 5-year-olds.
Total fat
It is recommended that children consume no more than 35% of their daily energy intake as total fat (COMA, 1991). When calculated as grams, total fat recommendations range from 36.2g for 2-year-old females to 82.7g for 11-year-old males. Figure 3 shows the total fat content of the sampled children’s meals and the average total fat recommendations for 2- to 11-year-olds.
Figure 3. Total fat content of sampled children’s meals and dietary recommendations
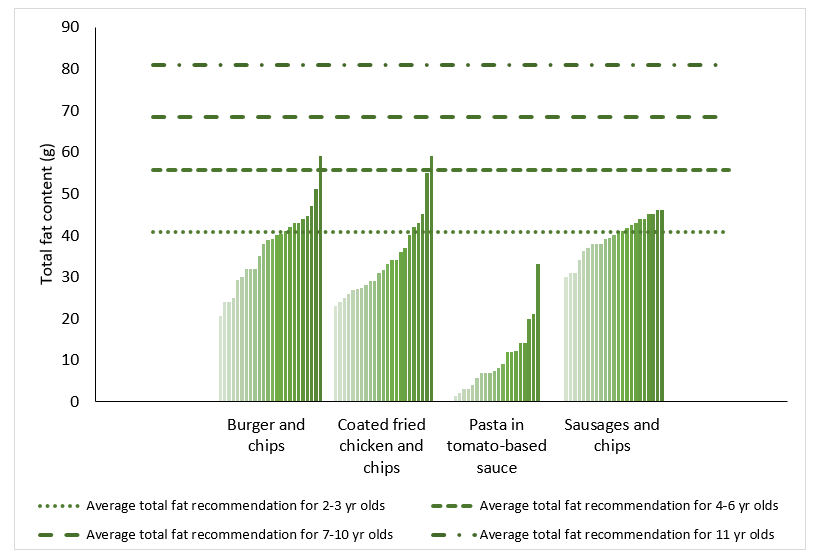
On average, the sampled children’s meals contained 30.7g total fat. This is 82% of the average daily total fat recommendation for 2-year-olds and 38% of the average daily recommendation for 11-year-olds.
The meals with the greatest amount of total fat, a coated fried chicken and chips meal and a burger and chips meal (59.0g total fat), contained more total fat than the daily total fat recommendation for 2- to 6-year-olds.
Sixty-six percent of meals contained more than half the average daily total fat recommendation for 5-year-olds.
Saturated fat
It is recommended that children consume no more than 11% of their daily energy intake as saturated fat (SACN, 2019). When calculated as grams, saturated fat recommendations range from 11.4g for 2-year-old females to 26.0g for 11-year-old males. Figure 4 shows the saturated fat content of the sampled children’s meals and the average saturated fat recommendations for 2- to 11-year-olds.
Figure 4. saturated fat content of sampled children’s meals and dietary recommendations
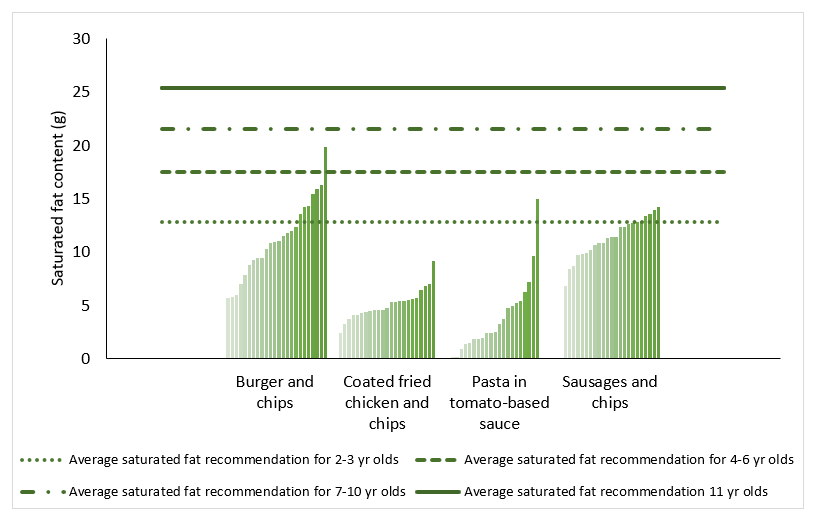
On average, the sampled children's meals contained 8.0g saturated fat. This is 71% of the average daily maximum saturated fat recommendation for 2-year-olds and 32% of the average daily maximum recommended for 11-year-olds.
The meal with the greatest amount of saturated fat, a burger and chips meal (19.8g saturated fat), contained more saturated fat than the daily saturated fat recommendation for 2- to 7-year-olds.
Forty-seven percent of meals contained more than half the average daily maximum saturated fat recommendation for 5-year-olds.
Salt
It is recommended that 2- to 3-year-olds consume no more than 2g salt per day, 4- to 6-year-olds no more than 3g, 7-to-10 year-olds no more than 5g and 11-year-olds no more than 6g (SACN, 2003). Figure 5 shows the salt content of the sampled children’s meals and the salt recommendations for 2-to 11-year-olds.
Figure 5. Salt content of sampled children’s meals and dietary recommendations
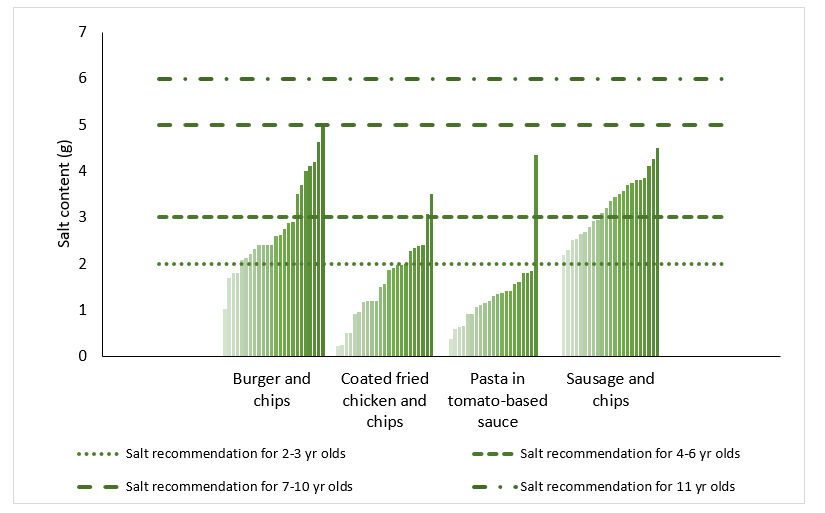
On average, the sampled children’s meals contained 3g of salt. This is more than the maximum salt recommendation for 2- and 3-year-olds and the maximum salt recommendation for 4- to 6-year-olds.
The meal with the greatest amount of salt, a burger and chips meal (5.0g salt) contained more salt than the maximum daily salt recommendation for 2- to 6-year-olds and the maximum daily salt recommendation for 7- to 10-year-olds.
Seventy percent of meals contained more than half the daily maximum amount of salt recommended for 5-year-olds.
Sugar
The nutritional analysis results provide information on the total sugars content of the meals while the dietary recommendation is for free sugars. It has not been possible to determine the free sugars content of the sampled children’s meals.
Fibre
It is recommended that 2- to 4-year-olds consume 15g dietary fibre per day, 5- to 10-year-olds 20g and 11-year-olds 25g. Figure 6 shows the fibre content of the sampled children’s meals and the fibre recommendations for 2- to 11-year-olds.
Figure 6. Dietary fibre content of sampled children’s meals and dietary recommendations
Discussion
This research explores the food available to children when eating out in restaurants in Northern Ireland. It considers the practices in restaurants and the perspectives of restaurant owners/managers, it investigates the range of options available on children’s menus and reports on the nutritional content of popular children’s meals. It does not consider foods available to children in other out of home settings such as café’s, takeaway and grab- and- go.
This research found that, in general, the range of food and drink choices on children’s menus is limited. The most popular children’s meals, in terms of those restaurant owners/managers reported were most commonly ordered by customers and those most commonly found on menus, were similar. These were coated fried chicken and chips, sausages and chips, burger and chips, coated fried fish and chips and pasta. Few menus included a choice of side/accompaniment. Chips were offered as a side with a lot of children’s meals (72%) while vegetable sides were available with just under a quarter of children’s meals (24%). It was encouraging to see that high sugar fizzy drinks were included on very few children’s menus (4%) and that milk was the second most common drink behind squash type drinks. Despite this, only 9% of children’s menus included milk as an option. Healthier options were also limited and rarely promoted. These findings are similar to research conducted by safefood in 2013 into children’s foods when eating out on the island of Ireland.
This research also found that, in general, popular children’s meals are high in energy, total fat, saturated fat and salt and some children’s meals contain more energy, total fat, saturated fat, and salt than is recommended for younger children. It is therefore likely that children are eating more fat and salt than they need when eating out. It is widely accepted that eating habits are established early in life. Given that children are eating out regularly this could be driving poor dietary behaviours.
Government departments and other organisations have developed policies to improve the nutritional quality of food eaten out of the home. Public Health England developed reduction and reformulation targets to encourage out of home food businesses to reduce calories, fat, sugar and salt in the foods they serve. The Food Safety Authority of Ireland also set reduction and reformulation targets for out of home food businesses in Ireland. Public Health Scotland (PHS) and Food Standards Scotland (FSS) developed an Eating Out Eating Well Framework. It includes a code of practice for children’s menus which aims to improve the nutritional quality of food for children.
While most restaurant owners/managers agreed that the out of home sector had a role in improving children’s diets (70%) recommendations need to be cost effective and appealing to customers.
Conclusions
Overall, this research indicates that work is needed to improve the nutritional quality of food available to children when eating out. It was encouraging that many restaurant owners/managers indicated that the eating out of home sector has a role in improving children’s food. However, support is needed to develop cost effective strategies to improve the offerings on children’s menus which will be appealing to customers.
Next steps and recommendations
The next steps for the FSA and local councils and recommendations for food businesses and consumers are based on the findings of this research.
Next steps for FSA and local councils
The FSA has developed healthier catering guidance with a specific focus on improving children’s menus which will be promoted with food businesses.
The FSA will –
- consider the availability of nutrition training for chefs in Northern Ireland and
- consider ways to support local food businesses to make the meals they serve to children healthier.
Local councils will –
- inform business that contributed to this research, and other relevant businesses, of the results and will promote the healthier children’s menus guidance and
- promote the FSA’s calorie calculator and allergen management tool, MenuCal.
Recommendations for food businesses
- review the portion size of children’s meals and consider whether they are suitable for children.
- reduce fat, sugar and salt across the children’s menu.
- contact suppliers to explore availability of lower calorie, fat, sugar and salt foods.
- add more fruit and vegetables to menus by including at least one portion with each main course and including fruit and vegetables as starters and/or desserts.
- review cooking methods and consider whether some foods could be baked or grilled rather than fried or cooked from fresh rather than doubled fried.
- include at least one main course option that isn’t fried.
- allow consumers to choose side dishes or make healthier sides the default.
- include water and low-fat milk on menus.
- promote healthier options and encourage uptake.
- offer small or half portions of meals from the main menu.
- use the FSA’s free calorie calculator and allergen management tool MenuCal to calculate the energy content of meals.
Recommendations for consumers
- be aware that children’s meals served in restaurants in Northern Ireland can be high in energy, fat, sugar and salt and that they can provide more energy, fat and salt than is recommended for younger children.
- when eating out choose healthier options when available.
- ask for healthier options to create a demand.