English Cymraeg
Does proactively asking about allergens before ordering by Food Business Operator staff improve customer outcomes?

Appendix 1: Interaction Models and ITT Model Outputs

This sections covers the interaction models and ITT model outputs for proactively asking about allergens behavioural trial report.

Table 7: Model outputs, interaction models

Predictors are shown in the first column. Perceptions of food safety is a common header for the second to the fourth columns. Estimates, confidence interval and p-value for perception are shown in the second, third and fourth column respectively. Confidence in identifying ingredients is a common header for the fifth to the seventh columns. Estimates, confidence interval and p-value for confidence are shown in the fifth, sixth and seventh column respectively. Comfort asking staff about ingredients is a commoPredictors are shown in the first column. Perceptions of food safety is a common header for the second to the fourth columns. Estimates, confidence interval and p-value for perception are shown in the second, third and fourth column respectively. Confidence in identifying ingredients is a common header for the fifth to the seventh columns. Estimates, confidence interval and p-value for confidence are shown in the fifth, sixth and seventh column respectively. Comfort asking staff about ingredients is a commo


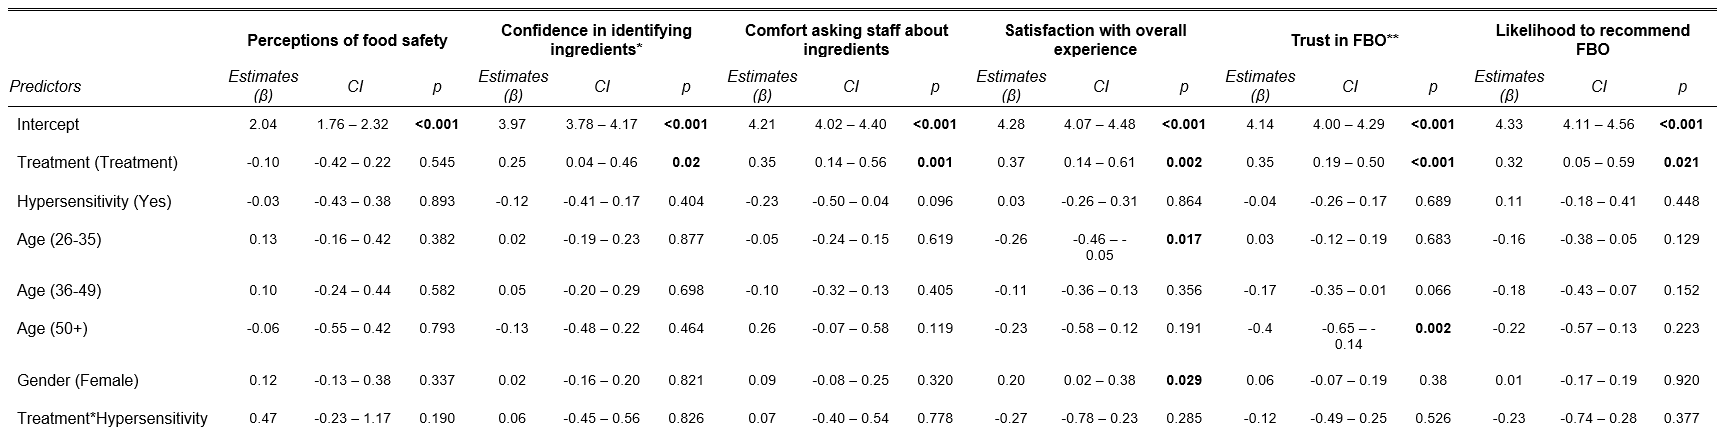
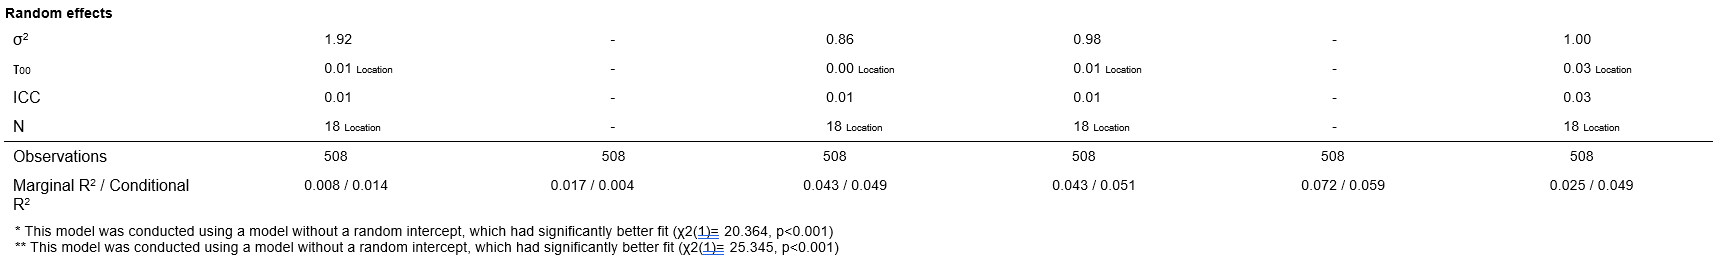
Table 8: Model outputs, intent-to-treat models (primary outcomes)

Predictors are shown in the first column. Perceptions of food safety is a common header for the second to the fourth columns. Estimates, confidence interval and p-value for perception are shown in the second, third and fourth column respectively. Confidence in identifying ingredients is a common header for the fifth to the seventh columns. Estimates, confidence interval and p-value for confidence are shown in the fifth, sixth and seventh column respectively. Comfort asking staff about ingredients is a commo

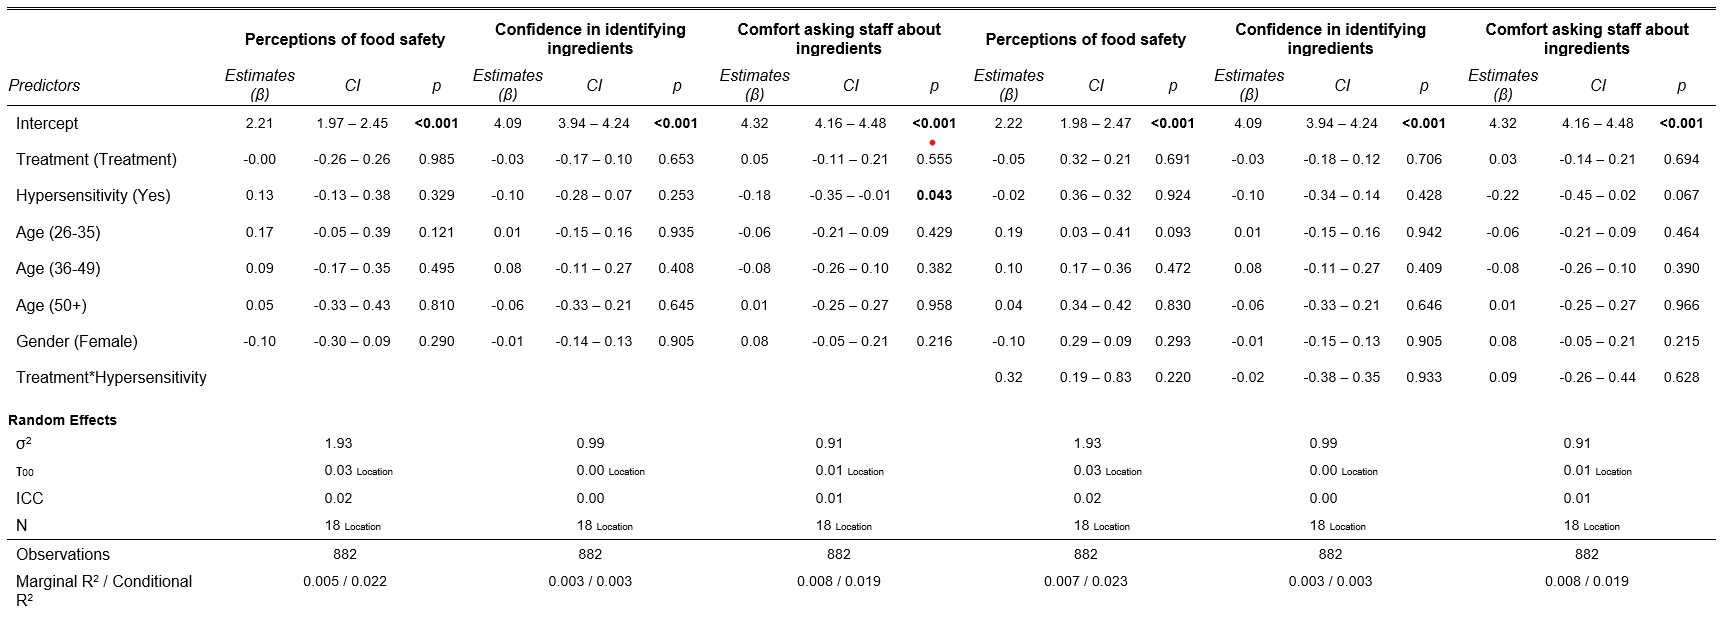
Table 9: Model outputs, intent-to-treat models (secondary outcomes)

Satisfaction with overall experience is a common header for the second to the fourth columns. Estimates, confidence interval and p-value for satisfaction are shown in the second, third and fourth column respectively. Trust in FBO is a common header for the fifth to the seventh columns. Estimates, confidence interval and p-value for trust are shown in the fifth, sixth and seventh column respectively. Likelihood to recommend FBO is a common header for the eighth to the tenth columns. Estimates, confidence intSatisfaction with overall experience is a common header for the second to the fourth columns. Estimates, confidence interval and p-value for satisfaction are shown in the second, third and fourth column respectively. Trust in FBO is a common header for the fifth to the seventh columns. Estimates, confidence interval and p-value for trust are shown in the fifth, sixth and seventh column respectively. Likelihood to recommend FBO is a common header for the eighth to the tenth columns. Estimates, confidence int

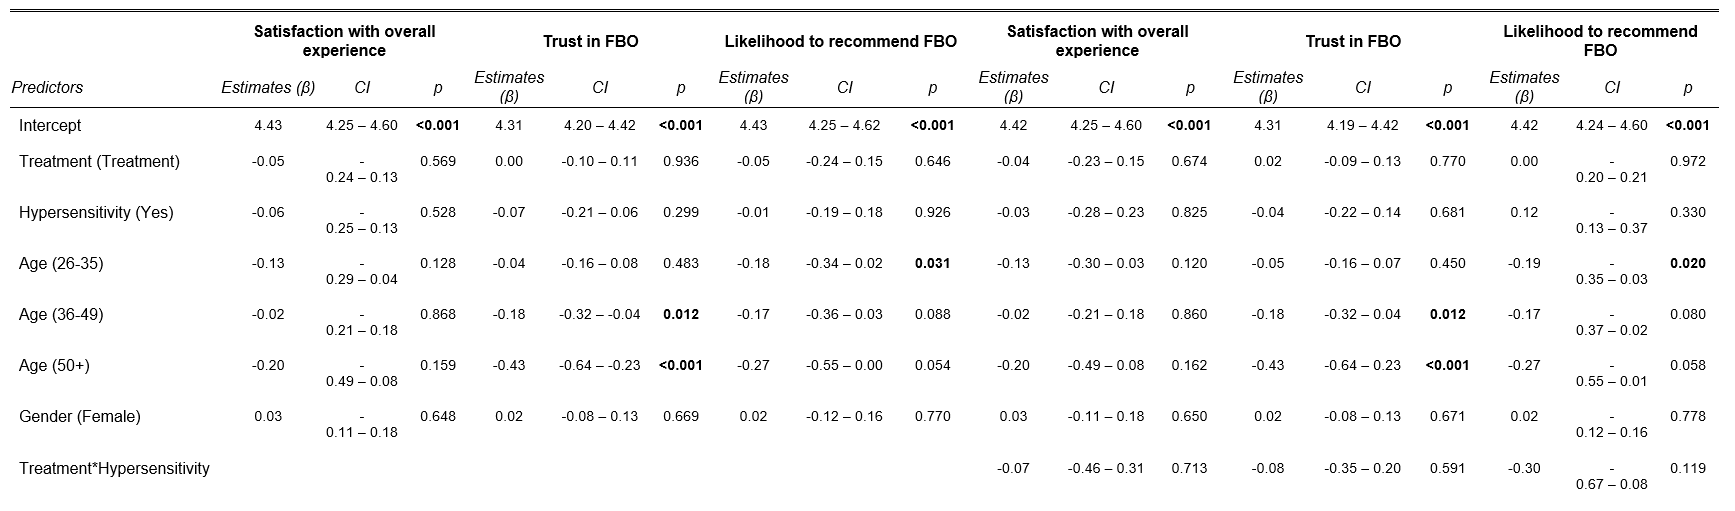
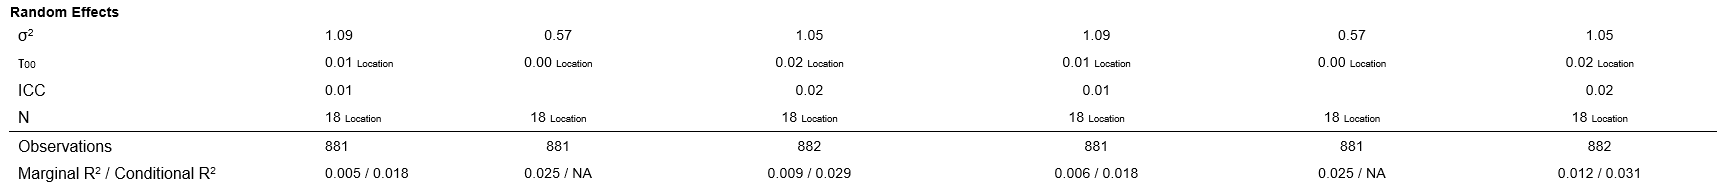
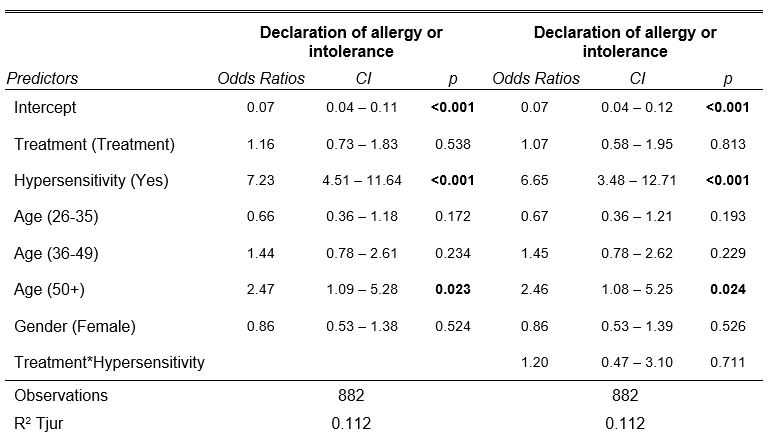
Table 10: Model outputs, interaction models II - Declaration of allergy or intolerance
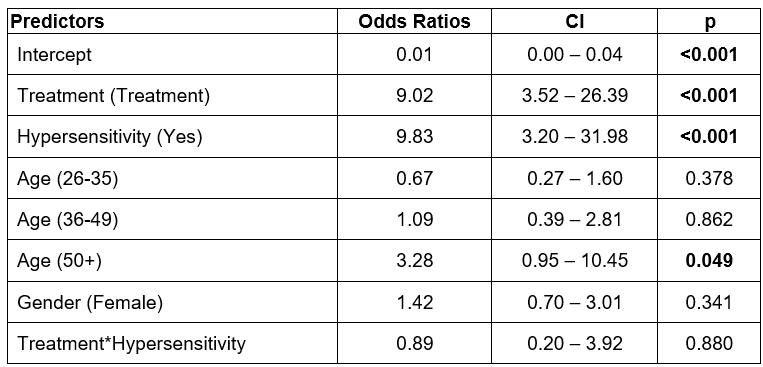
Predictors are shown in the first column. Odds ratios are shown in the second column. Confidence intervals are shown in the third column and p-values are shown in the fourth column.
Predictors Odds Ration CI p
Intercept 0.01 0.00 to 0.04 <0.001
Treatment (Treatment) 9.02 3.52 - 26.39 <0.001
Hypersensitivity (Yes) 9.83 3.20 - 31.98 <0.001
Age (26 to 35) 0.67 0.27 - 1.60 0.378
Age (36 to 49) 1.09 0.39 - 2.81 0.862
Age (50+) 3.28 0.95 - 10.45 0.049
Gender (Female) 1.42 0.70 - 3.01 0.341
Treatment Hypersensitivity  0.89 0.20 - 3.92 0.880

Observations: 508

R Tiur 0.231

* This model was conducted using a model without a random intercept, which had a better fit (AIC = 248.200, vs 250.207)

Table 11 Model outputs, intent-to-treat models (secondary outcomes II)

Predictors are shown in the first column. Odds ratios, confidence intervals and p-values for declaration of allergy or intolerance are shown in the second, third and fourth column respectively. Odds ratios, confidence intervals and p-values for declaration of allergy or intolerance with treatment*hypersensitivity as an additional predictor are shown in the fifth, sixth and seventh column respectively. The number of observations is shown on the eleventh row, and the R-squared statistic on the twelfth row.
Add to smarter communications search Off