Does proactively asking about allergens before ordering by Food Business Operator staff improve customer outcomes?
Proactively asking about allergens: Materials and methods
This trial took the form of a matched pairs cluster randomised trial, where the clusters were 18 branches of a national FBO.
5.1 Trial Design
This trial took the form of a matched pairs cluster randomised trial, where the clusters were 18 branches of a national FBO. Half of the branches implemented the intervention, where they asked customers whether they had any food allergies or intolerances on ordering, and half of the branches were a control who were not instructed to say this (and carried on with usual practice).
5.2 Participants
To ensure the relevance and feasibility of the intervention, we recruited an FBO that sells food that is not pre-packaged/ that is packaged after ordering, and which does not use self-service machines. The trial was implemented in 18 outlets, 9 in the intervention arm and 9 in the control. There were 9 outlets in London (5 in control arm and 4 in intervention arm) and 9 outside London (4 in control arm and 5 in intervention arm); two outlets were kiosks which did not have seating.
Participants were customers who entered the FBO between 28th March 2022 and 30th June 2022 (inclusive), who placed a food order at the till, and who chose to complete a survey about their experience.
5.3 Intervention
5.3.1 Intervention and procedure
Staff in branches in the intervention arm were instructed by branch managers to ask “Do you have any food allergies or intolerances?” before customers placed their order. If a customer replied in the affirmative, the FBO’s standard protocol in handling these cases were followed, which involved directing customers to scan a QR code to access allergen information.
In the control branches, all branches continued with their standard practice, which was not to proactively ask, but to direct any customer who asked staff about allergens to scan the QR code for information.
In both the treatment and control groups, customers had the option of scanning a QR code to participate in a survey (see Appendix 2 for the full survey). If they ordered takeaway, then a leaflet with the QR code was placed in their takeaway bag. If they were dining in, then the leaflet was placed on the tray with their order. Restaurants with seating also displayed table toppers with the QR code directing customers to the survey. The staff at branches were asked to direct the customer to the QR code, and to invite them to complete the survey.The materials leaflet and table toppers advertised that participants completing the survey could be entered into a prize draw for 25 Love2Shop vouchers each worth £50.
The prize draw was conducted via an automated computer process through which 25 email addresses were randomly drawn from response data after deleting duplicated email addresses. After the prize draw, the randomly selected winners were sent an email notifying them that they had won and including a unique redeem code.
All customers were able to withdraw from the survey at any time before completion of the survey, either by not starting or by not completing the survey. Once the survey data was submitted the data collected was stored anonymously, meaning it was not possible to for participants to withdraw data after submission.
5.3.2 Implementation Checks
To confirm fidelity to our intervention and business compliance, fieldworkers were used to serve as mystery shoppers. Each participating store was visited by a field worker in Week 1 and then again in Week 4. The fieldworkers recorded whether they were asked about allergens and intolerances or not (they did not know which arms the branches the visited were in). They also recorded whether they received the leaflet and the proportion of tables that had the table topper.
Throughout the trial fieldwork, and in addition to the mystery shopping visits, analysts also monitored survey responses weekly – particularly Q7 (“Thinking back to when you were served, did the [INSERT CHAIN NAME] employee ask you whether you have a food allergy or intolerance before you made your purchase?”) – to establish whether the intervention was being delivered in treatment branches and not delivered in control branches. In response to the first visit and the low compliance observed (see results section) a meeting with branch managers was scheduled and they were contacted by email to remind them of the trial requirements. Across the trial, branch managers were met in Week 1 and Week 11 to reinforce intervention delivery processes. Additionally, reminder emails were sent to all the branches during weeks 1, 6, and 12, and a branch specific email to branches reporting low response rates during week 7.
5.4 Outcomes
The primary outcome measures were collected via questions presented in random order in the survey and rated on 5-point Likert scales. They were:
1. How confident are you that, if needed, you could find out the ingredients in any food or drink products at [INSERT CHAIN NAME]? Ranging from 1 “Not confident at all” to 5 “Very confident”
2. How comfortable would you feel in asking a member of staff at [INSERT CHAIN NAME] for information about the ingredients in the foods or beverages they are selling? Ranging from 1 “Not comfortable at all” to 5 “Very comfortable”
3. How concerned or unconcerned are you about the safety of the food that is sold in [INSERT CHAIN NAME]? Ranging from 1 “Very unconcerned” to 5 “Very concerned''
These were based on the questions from the feasibility study, which were taken from the Public Attitudes Tracker (Food Standards Agency, 2020a), FSA’s flagship survey, and modified following the suggestions of a peer reviewer, so that they more directly targeted the issues that the intervention was designed to address.
The secondary outcome measures were:
4. Thinking back to when you were served, did you declare an allergy or intolerance? Yes or No
5. How satisfied are you with your overall experience at [INSERT CHAIN NAME] today? 5-point Likert scale ranging from 1 “Very unsatisfied” to 5 “Very satisfied”
6. How much do you trust or distrust [INSERT CHAIN NAME] as a business responsible for the sale of food and beverages? 5-point Likert scale ranging from 1 “I distrust it a lot” to 5 “I trust it a lot”
7. How likely are you to recommend [INSERT CHAIN NAME] to your friends or family? 5-point Likert scale ranging from 1 “Very unlikely” to 5 “Very likely”
We asked the following question as a part of our fidelity check and sensitivity analysis:
8. Whether the customer was asked about food hypersensitivities: ‘Thinking back to when you were served, did the [INSERT CHAIN NAME] employee ask you whether you have a food allergy or intolerance before you made your purchase?’ (Y/N)
5.5 Sample size
Prior to the trial, power calculations were conducted to illustrate the relationship between the sample size, effect size, significance level and statistical power.
Our power calculations suggested we should have 30 premises (15 in the trial arm and 15 in the control), with 125 survey respondents per branch, in order to have an 80% chance of detecting a similar-sized effect to that we found in the feasibility trial on one of our primary outcome measures (specifically, the effect of the intervention on confidence about asking staff for information on ingredients, which was small, Cohen’s d = 0.2). These calculations assumed an intraclass correlation coefficient (ICC) of 𝜌 = 0.03, a conservative assumption given the results of the feasibility trial (where the ICCs were ~𝜌 = 0.01).
5.6 Randomisation
We used pair matching to maximise efficiency, and therefore the statistical power of the trial, by reducing the variance between clusters (Rutterford, Copas and Eldridge, 2015). We used pair matching on the following criteria:
- weekly customer footfall
- location (London/ non-London)
- two kiosks with no seating (one in London and one outside London) were matched with each other
We did not match on Food Hygiene Rating Scheme (FHRS) score because most scored 5, the highest possible value (footnote 1). We did not have access to branch customer satisfaction scores.
In each matched pair, one branch was randomly allocated to the treatment group, while the other was allocated to the control group. This process was executed via stratified random assignment (where each FBO type is a strata), conducted using R’s randomizr package (Coppock, 2019).
5.7 Blinding
Management at the FBOs were aware of their participation in a trial, and the fact that some branches received the intervention while others did not. The researchers and data handlers were not blinded to condition and FBO type.
Staff at the branches were aware of their participation in a study, as we needed them to place the QR codes leading to the customer survey in visible locations. However, staff in control branches were not told the purpose of the trial, in an effort to reduce contamination bias. Store managers were told that other stores had been asked to make changes, in order to improve the customer experience, and that it was important for their stores to continue with business as usual so that we could see if the changes made a difference.
Staff in intervention branches were asked to proactively ask customers whether the customer had any allergies or intolerances, and as such may have been able to deduce the purpose of the study. The managers knew the purpose of the study.
Customers at the branches were not aware of their participation in a study when ordering. They were aware of their participation if they choose to take part in the survey. The purpose of the study was not disclosed at the start of the survey, but participants were debriefed on a final screen after completing the survey.
5.8 Statistical methods
5.8.1 Primary analysis
As Moerbeek (2006) and Raudenbush (1997) recommend, hierarchical models should be used for analysis of cluster randomised trials. In line with this recommendation, we used a series of pre-registered two-level hierarchical linear models in our primary analysis (https://osf.io/973d8/). These models illustrated if there was a treatment effect, controlling for the impacts of individual-level covariates – food hypersensitivity, age and gender – some of which were unbalanced across trial arms due to the implementation of clustered randomisation.
There were several model permutations, as follows:
Models in which our primary outcomes were the dependent variable (Yij); and
Models which our secondary outcomes were the dependent variable (Yij) (footnote 2)
The equation for these models (written in the single equation form outlined by (Hox, Moerbeek and Van de Schoot, 2017)) was:
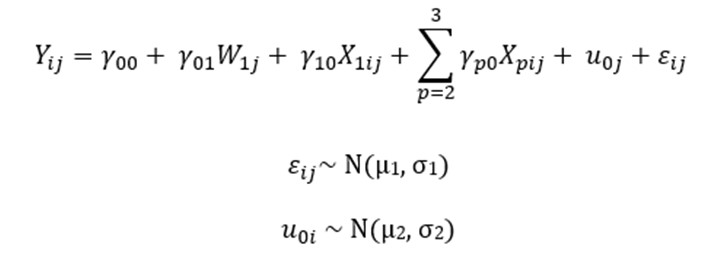
Where:

represents the score on the primary or secondary outcome variables for the ith person in cluster j;

represents the model intercept;

represents the influence of the intervention on the outcome variable(s);

represents the influence of the food hypersensitivity on the outcome variable(s);

represents the influence of gender and age on the outcome variables;

is the random intercept for cluster j

is the individual error term.
Where mixed models resulted in a singular fit – due to trivially small or non-existent intraclass correlation coefficients – linear models without the random intercept for clusters (
) were run. Likelihood ratio tests were used to establish that these fixed effects models had better fit.
Given the issues with intervention fidelity noted in the feasibility trial (McPhedran et al., 2021), per-protocol analysis (Gupta, 2011) – which only included customers for whom the intervention was delivered as intended (that is, they reported being asked by branch staff about food hypersensitivities as measured by Q7 in the survey) (footnote 3) – was of primary interest.
5.8.2 Additional analysis
In addition to the primary analysis, a series of three models were conducted as part of sensitivity analysis. This analysis was conducted to assess the robustness of the findings of the primary models to changes in functional form and/or specification.
The first series of sensitivity models was conducted using the same specification as the primary models, but included an additional interaction term
. This interaction term was included to assess whether the intervention had a differential effect for those with food hypersensitivities.
The second series of sensitivity analysis was conducted using ordinal mixed effects models with a probit link function. This series established whether the treatment effects remained if a different type of model was used.
The third and final series of sensitivity analysis was conducted using a ‘intention-to-treat’ approach. In this approach, customers in the treatment branches were considered as the treatment group, irrespective of receipt of the intervention. This was a tertiary model of interest, as it represented low-fidelity delivery in the real world.
5.8.3 Confidence level and the familywise error rate
In this trial, we tested three primary and three secondary hypotheses. In order to maintain the familywise error rate at α = 0.05, we tested each hypothesis using a Bonferroni-corrected value α = 0.05/6 = 0.0083.
-
Branches in Scotland were scored on a different pass/ fail system and all passed. One English branch had a 3-star rating. All other branches had 5-stars.
-
In the case of the declaration of food allergy or intolerance, a mixed logit model will be used.
-
Q7 is: “Thinking back to when you were served, did the [INSERT CHAIN NAME] employee ask you whether you have a food allergy or intolerance before you made your purchase?”
Revision log
Published: 12 April 2023
Last updated: 12 April 2024