Does proactively asking about allergens before ordering by Food Business Operator staff improve customer outcomes?
Proactively asking about allergens: Results
Results from the fieldwork conducted from March to June 2022.
6.1 Recruitment
Fieldwork for the trial was conducted from 28th March to 30th June 2022 in 18 branches of a national FBO. There were n = 936 survey completions across the two trial arms (n = 395 in the treatment arm, and n = 541 in the control arm), with an average completion time of 160.02 seconds (SD = 118.29 seconds). There were n = 348 males who completed the survey and the modal age group of participants was 16-25 (n = 423 or 45.2%). The study analysed age in bands because some participants preferred not to state their age, but did respond to a follow up question about what age group they were in. 16.6% (n = 155) of respondents reported that they had a food hypersensitivity.
In total, n = 530 participants received the correct treatment and were analysed (n = 154 in the treatment arm and n = 376 in the control arm). There were n = 198 males that were analysed. Most participants that were analysed were aged 16-25 (n = 239 or 45.1%). Among these participants, 16.8% (n = 89) reported that they had a food hypersensitivity.
Attrition was higher in the treatment arm (n = 427 incomplete surveys, or 52%) than in the control arm (n = 289 incomplete surveys, or 35%). However, the majority of dropouts – 635 of 716 in total – were on the first and second page, which were an information and consent page respectively. The trial flow can be seen below in Figure 2.
Figure 2: Trial flow (cluster and participant level)

Balance checks were conducted to investigate whether there was significant difference between treatment and control groups for three demographic variables: age, gender and hypersensitivity. There was an imbalance in gender in the per protocol groups, X2(1, n = 511) = 5.95, p = 0.015, with 72 males in the treatment group and 126 in the control group. The results are reported in Table 3.
Table 1: Balance of covariates in treatment and control arms (n, %) by demographic variable
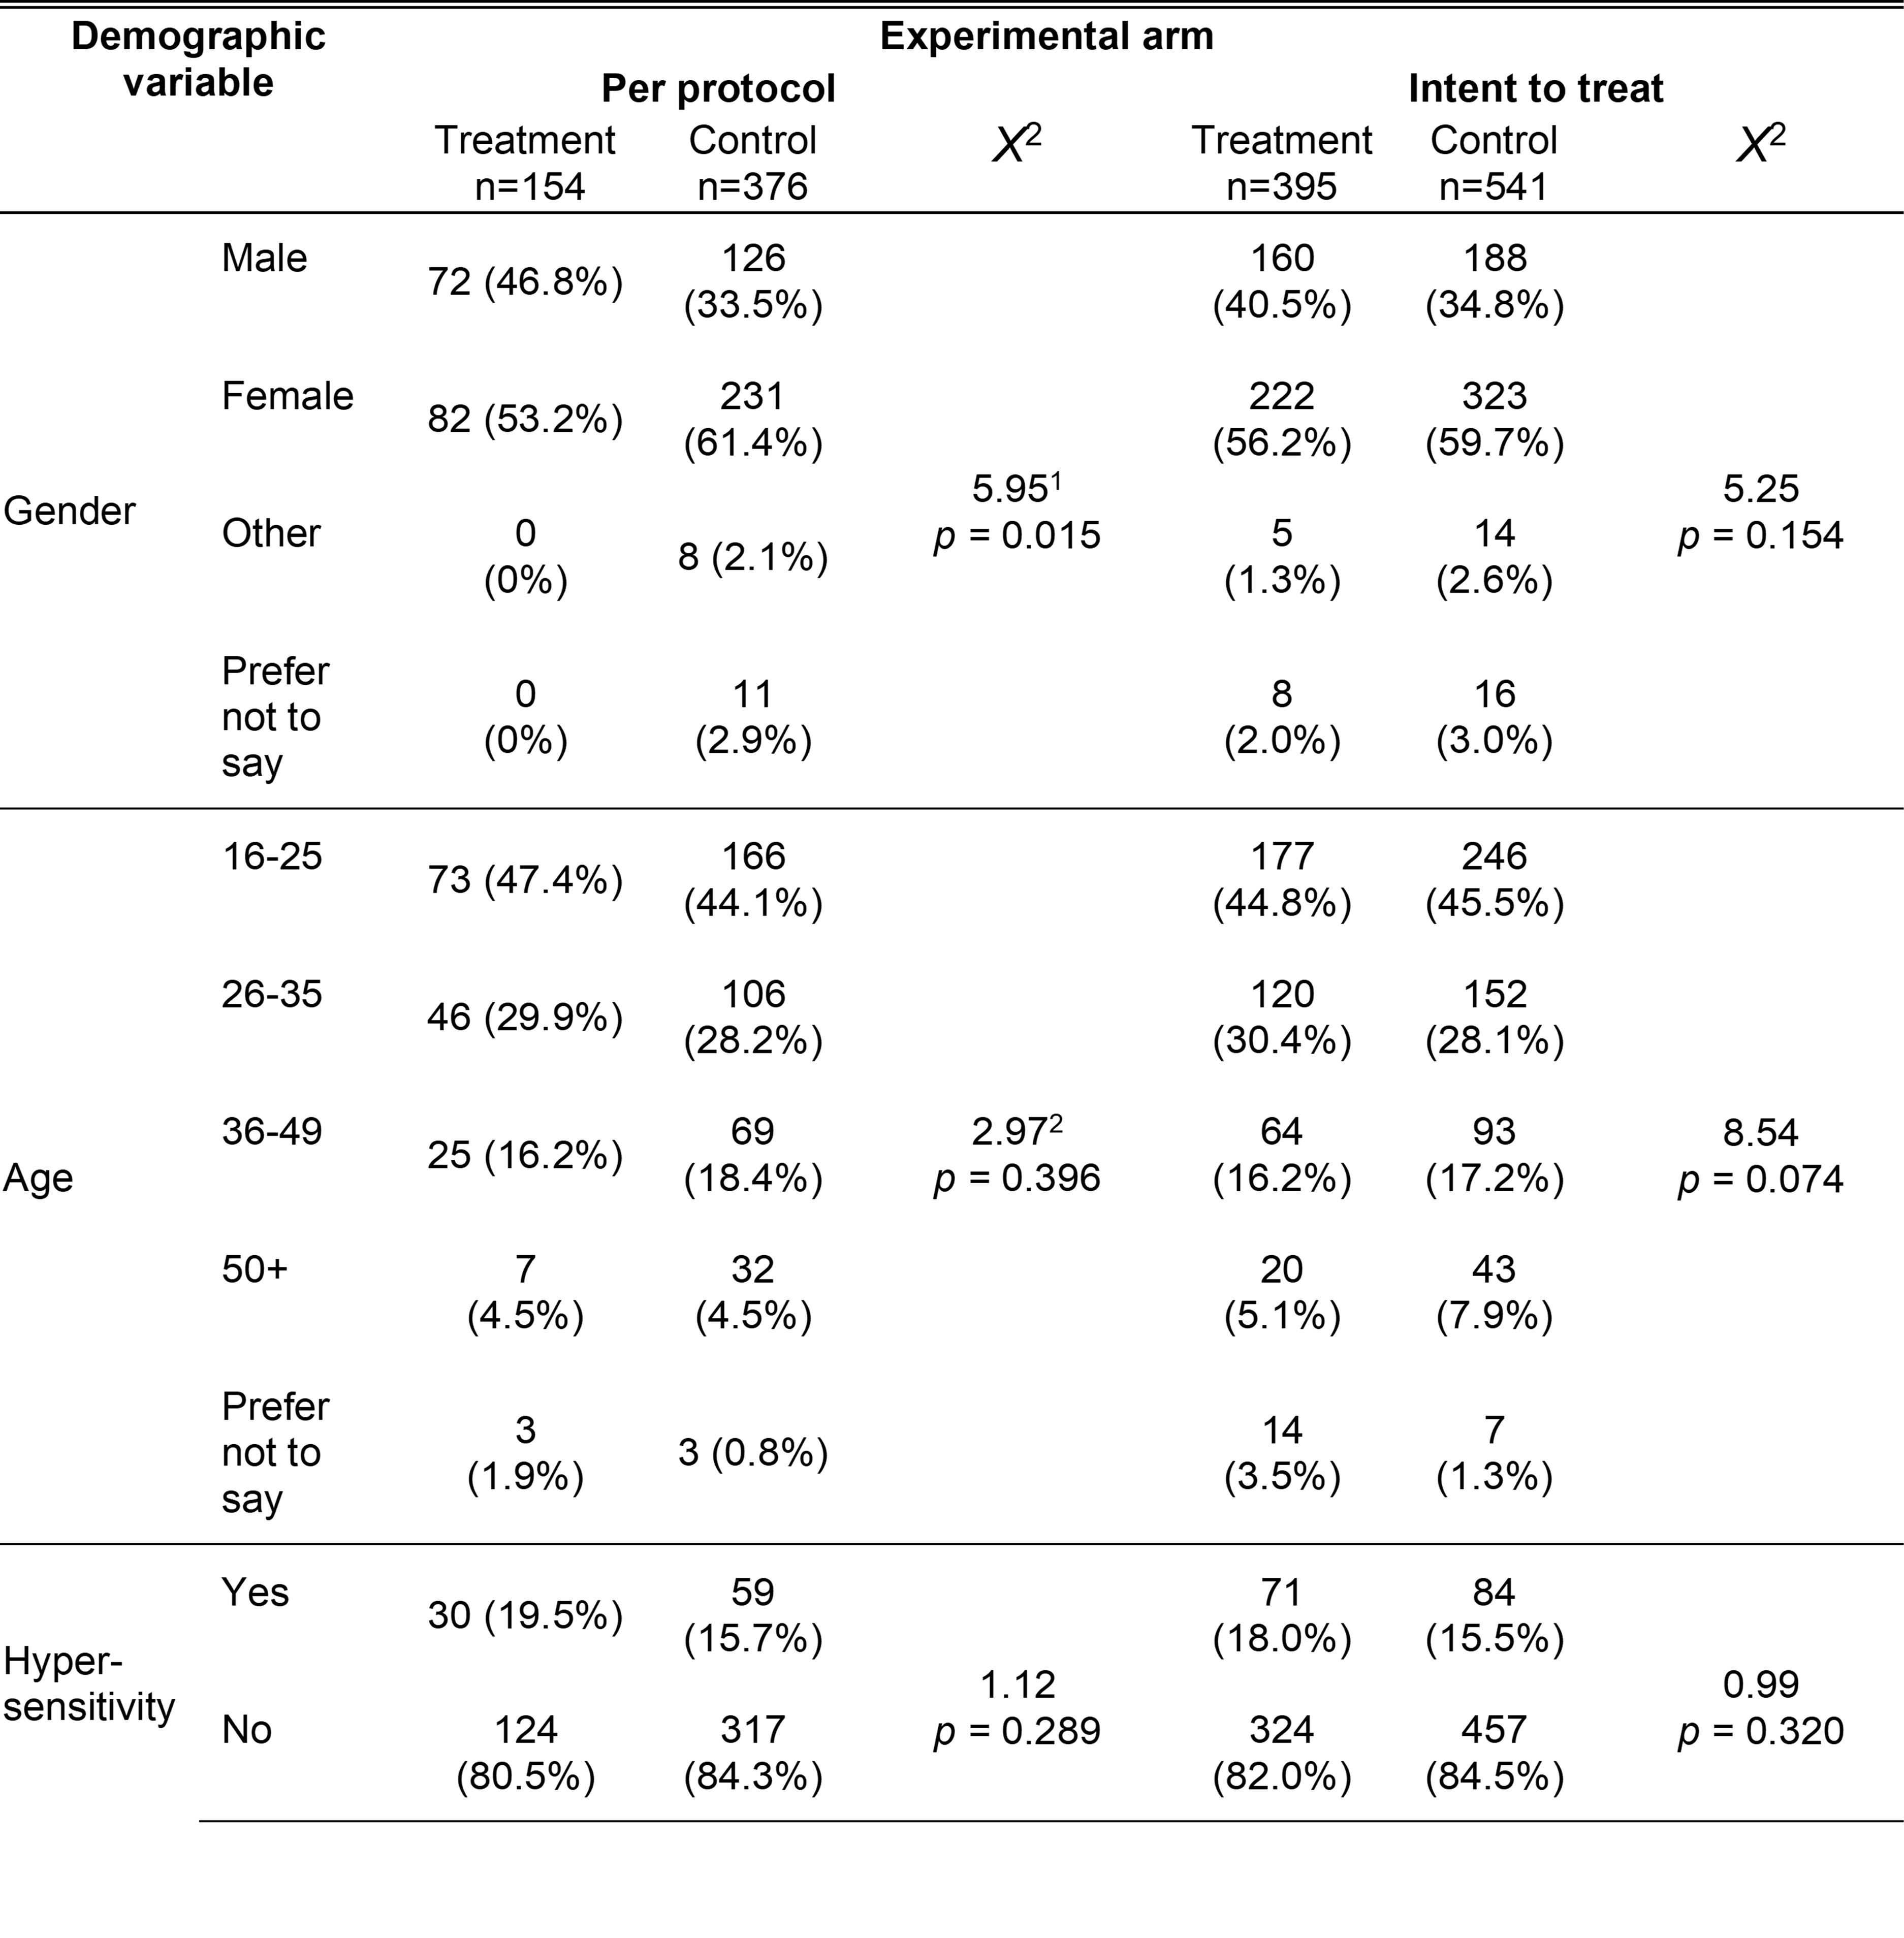
Demographic variable is a common header for the first and second columns. Under demographic variable, gender is a common header for the fourth to seventh rows; age is a common header for the eighth to twelfth rows and hypersensitivity is a common header for the thirteenth and fourteenth rows. Experimental arm is a common header from the third to the eighth columns and is divided into per protocol and intent to treat sub headers with each spanning three columns (treatment descriptives, control descriptives and the Chi-square statistic).
1. 'Other' and 'Prefer not to say' were dropped as cell sizes for the treatment group were too small.
2. 'Prefer not to say' were dropped as cell sizes for treatment and control groups were too small.
6.2 Intervention delivery
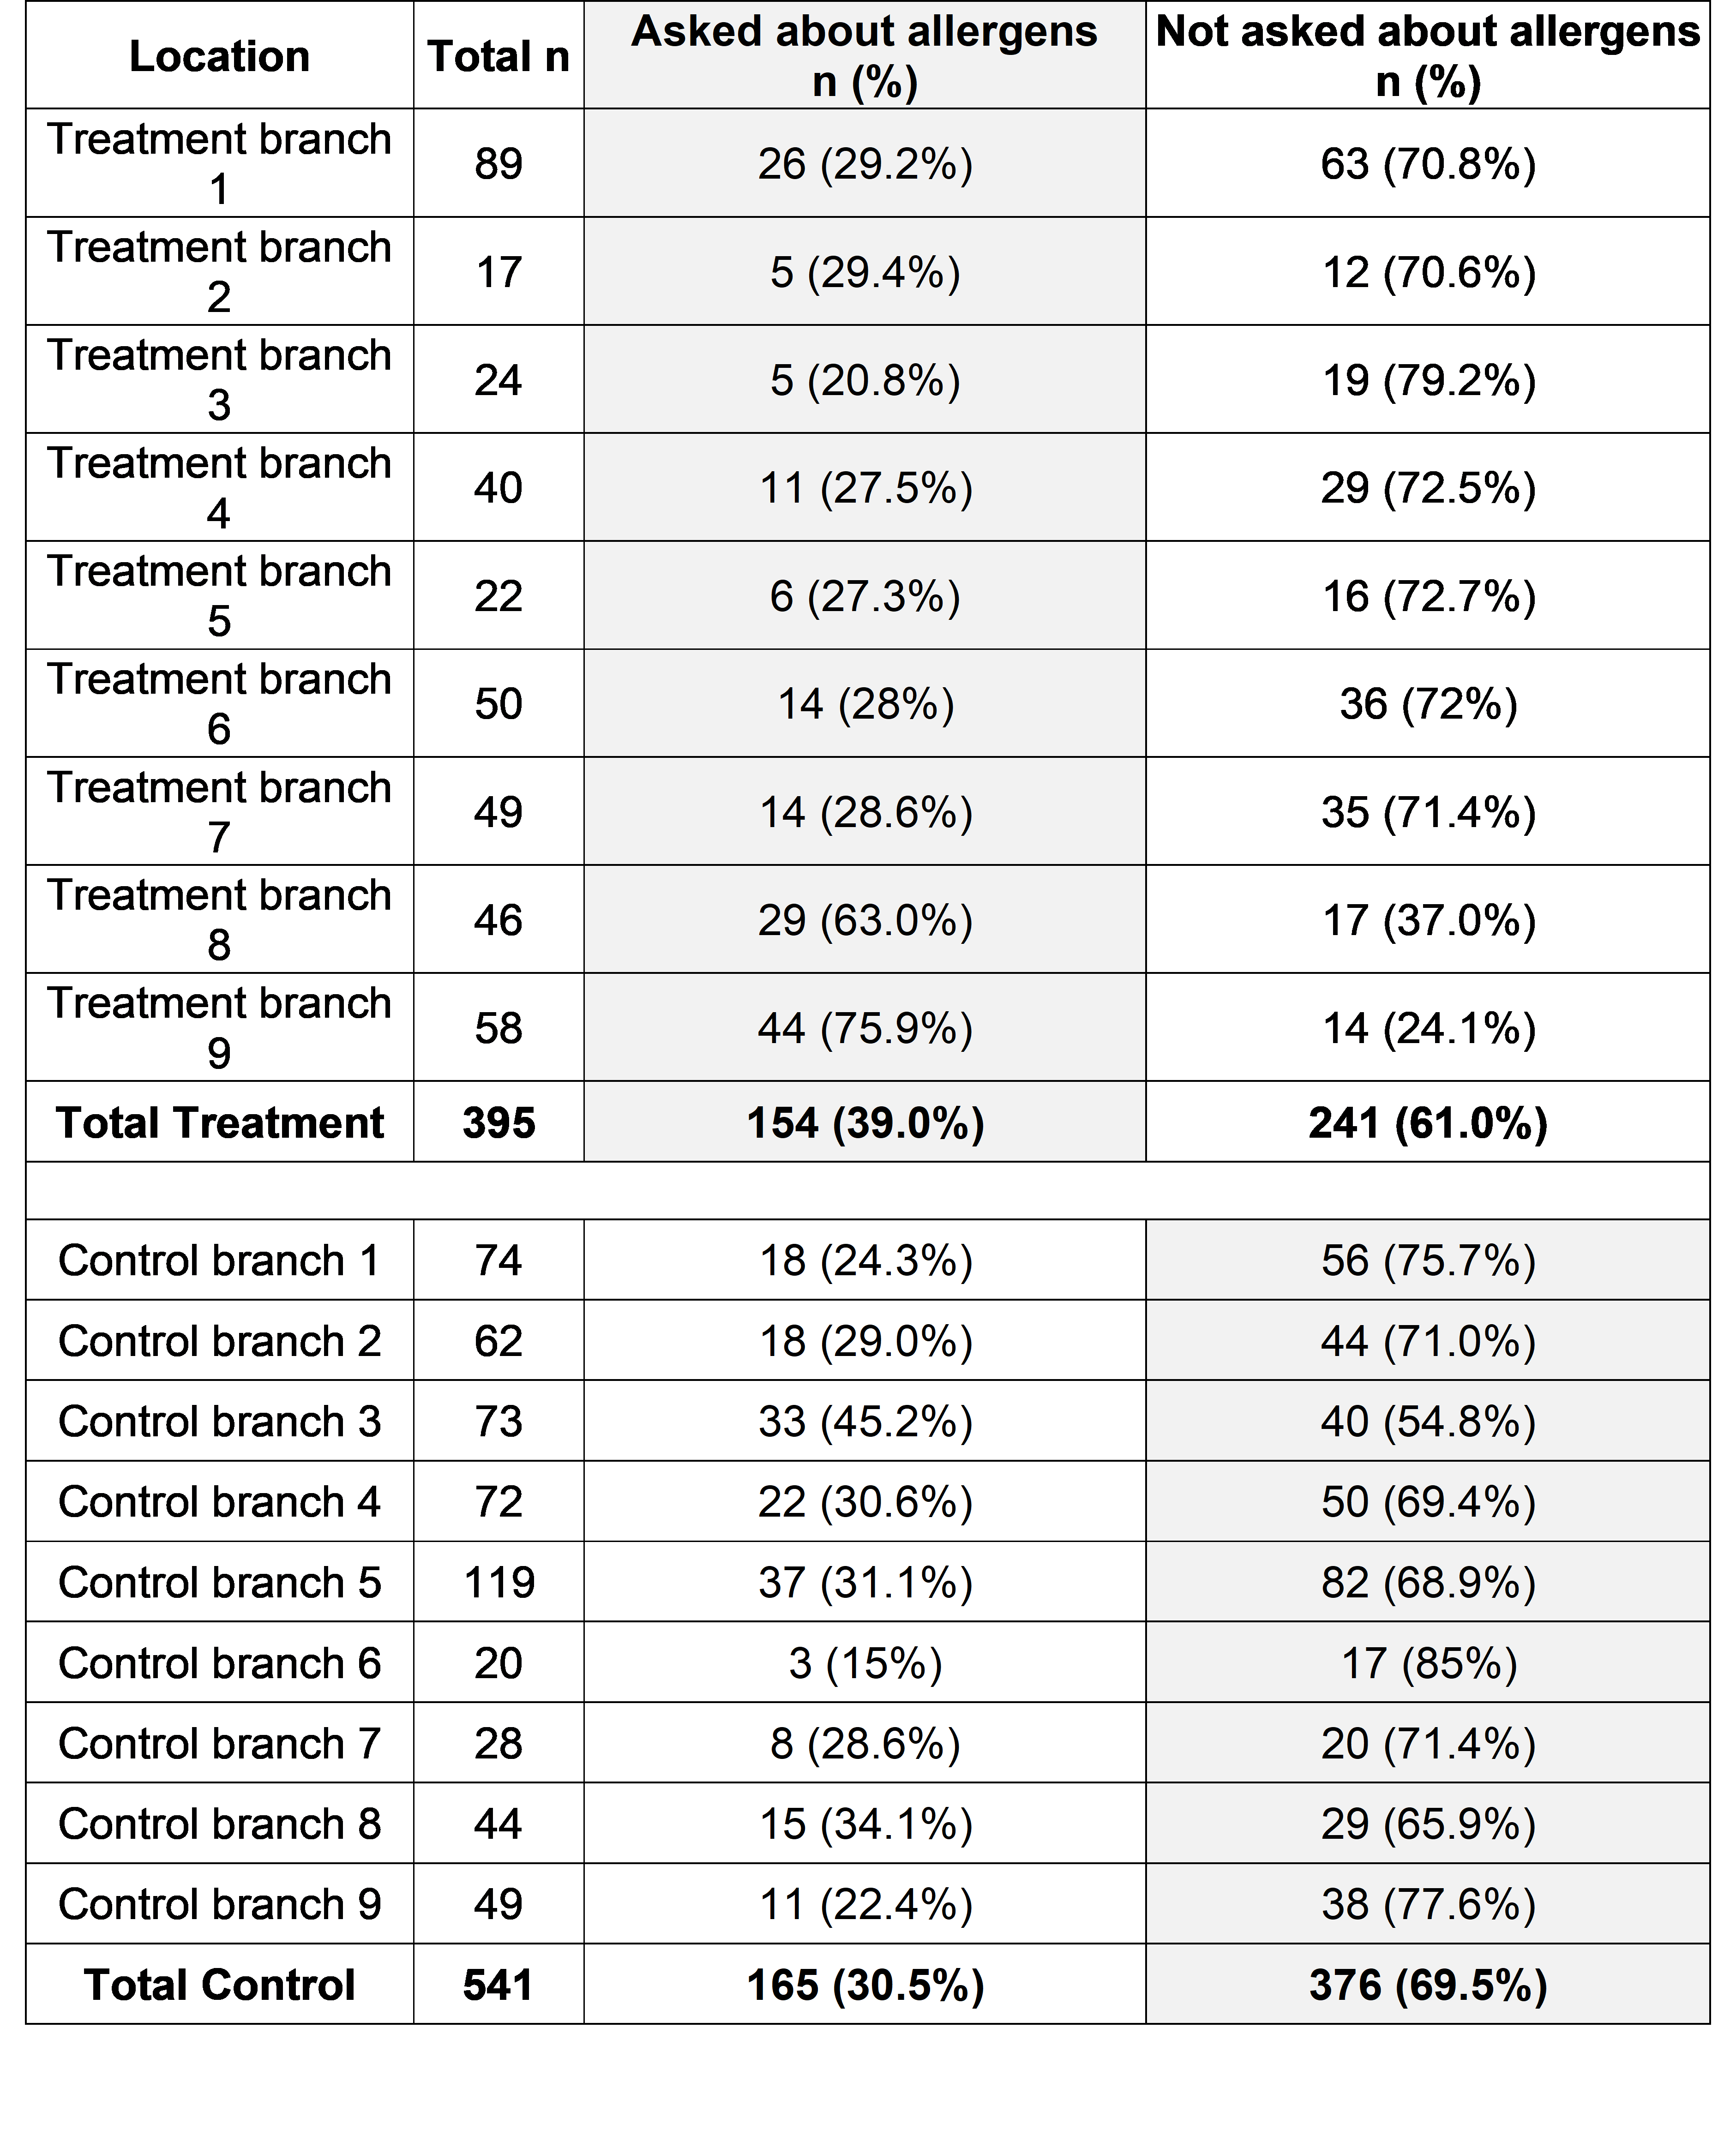
Overall, 39.0% of participants (154 of 395) in the treatment arm said they were asked whether they had a food allergy or intolerance. The staff in the control arm were told to go about business as usual, so they were not dissuaded from asking about allergens if they would have done anyway; 30.5% (165 of 541) of participants in the control arm said they were asked about allergens, which is less than the proportion who were asked in the treatment arm, X2(3, n = 936) = 7.32, p < 0.01. Fidelity in the treatment arm varied between branches, ranging from 20.8% to 75.9% (see Table 4).
Table 2: Intervention fidelity by location: grey column represents survey responses showing the intervention delivered as intended in each arm (that were included in the per protocol analysis)
| Location | Total n | Asked about allergens n (%) | Not asked about allergens n (%) |
|---|---|---|---|
| Treatment branch 1 | 89 | 26 (29.2%) | 63 (70.8%) |
| Treatment branch 2 | 17 | 5 (29.4%) | 12 (70.6%) |
| Treatment branch 3 | 24 | 5 (20.8%) | 19 (79.2%) |
| Treatment branch 4 | 40 | 11 (27.5%) | 29 (72.5%) |
| Treatment branch 5 | 22 | 6 (27.3%) | 16 (72.7%) |
| Treatment branch 6 | 50 | 14 (28%) | 36 (72%) |
| Treatment branch 7 | 49 | 14 (28.6%) | 35 (71.4%) |
| Treatment branch 8 | 46 | 29 (63.0%) | 17 (37.0%) |
| Treatment branch 9 | 58 | 44 (75.9%) | 14 (24.1%) |
| Total treatment | 395 | 154 (39.0%) | 241 (61.0%) |
| Control branch 1 | 74 | 18 (24.3%) | 56 (75.7%) |
| Control branch 2 | 62 | 18 (29.0%) | 44 (71.0%) |
| Control branch 3 | 73 | 33 (45.2%) | 40 (54.8%) |
| Control branch 4 | 72 | 22 (30.6%) | 50 (69.4%) |
| Control branch 5 | 119 | 37 (31.1%) | 82 (68.9%) |
| Control branch 6 | 20 | 3 (15%) | 17 (85%) |
| Control branch 7 | 28 | 8 (28.6%) | 20 (71.4%) |
| Control branch 8 | 44 | 15 (34.1%) | 29 (65.9%) |
| Control branch 9 | 49 | 11 (22.4%) | 38 (77.6%) |
| Total control | 541 | 165 (30.5%) | 376 (69.5%) |
Fidelity observed during the mystery shopping visits (i.e. treatment branches asking about allergens, and control branches not doing so) was relatively low at 42.9%, and was similar between both visits. However, this was mainly due to treatment branches not proactively asking about allergens: across the implementation checks only one treatment branch was compliant and asked about allergies and intolerances as instructed (5.6%), while in 18 visits to control branches the mystery shoppers observed intervention fidelity, i.e. not asking about allergens, 14 times (77.8%).
During the first visits, mystery shoppers also noticed only three branches had put out table toppers, one treatment (5.6%) and two control (11.1%). At the time of the first visit, not all the branches had had table toppers delivered. By the second visits table toppers had been put out in 13 of the 16 branches that had tables, six treatment (33.3%) and seven control (38.9%). Compliance with handing out the leaflets containing QR codes in take-away bags increased from only one branch (control) during the first visit to five branches, two treatment (11.1%) and three control (16.7%), during the second visit.
6.3 Primary outcomes
Table 3: Response distribution, primary outcomes
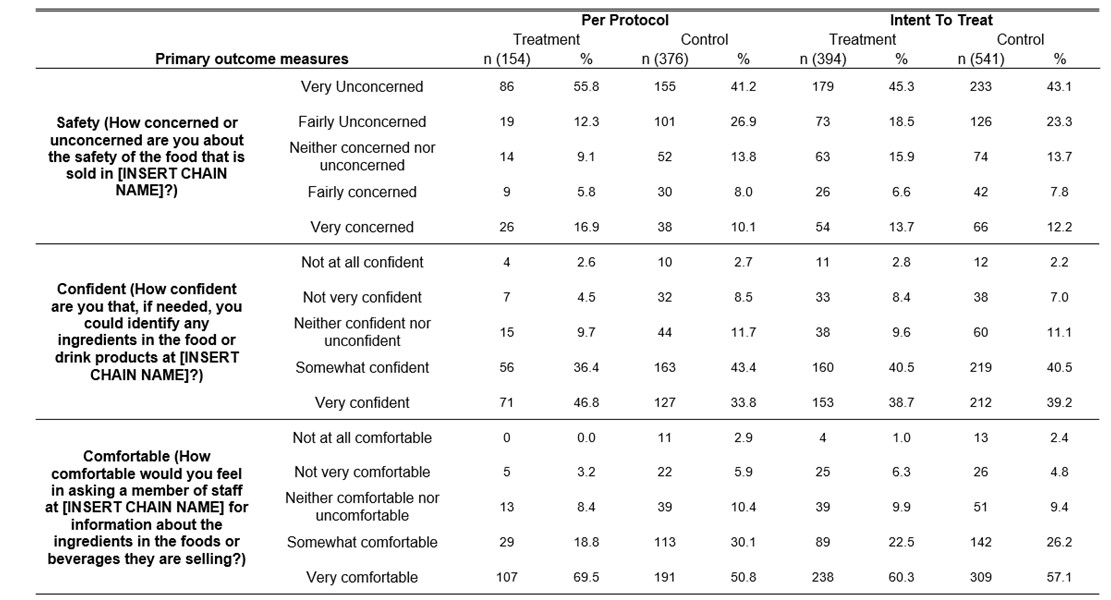
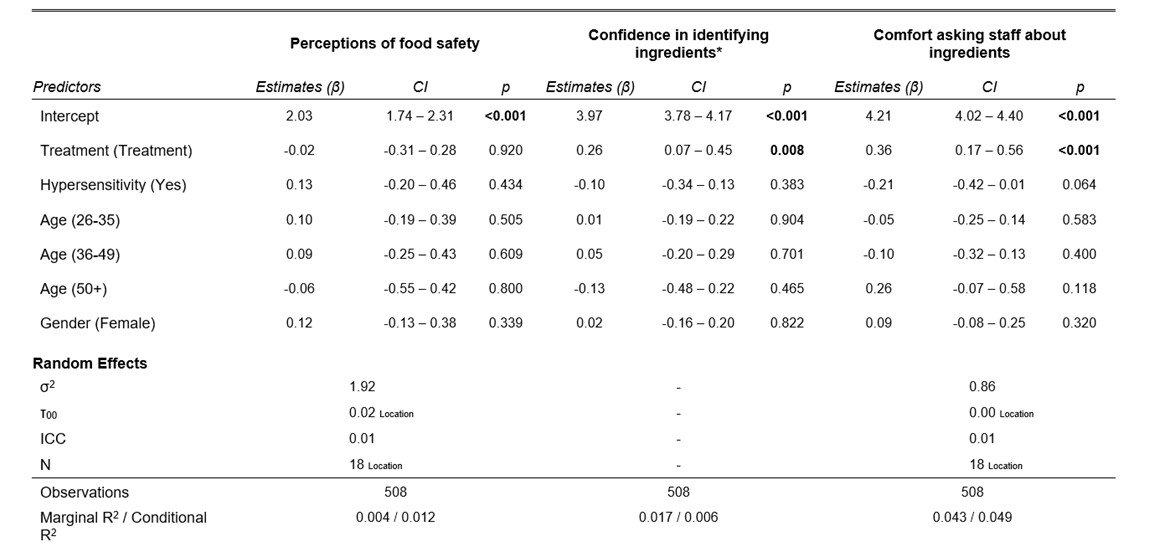
Customers in the treatment group who reported being proactively asked about their food hypersensitivities reported greater confidence that they could identify ingredients in the products served at the FBO than those in the control group who reported not being asked. Among those in the treatment group, almost 83.2% were either ‘very’ or ‘somewhat’ confident they could identify ingredients, compared to 77.2% in the control group (see Table 3 and Figure 3). Controlling for the influence of demographic covariates (gender and age), those in the treatment group were, on average, 0.26 points more confident than those in the control group (β = 0.26, p < 0.01). See Table 4 for the full model. This result was corroborated by the ordinal probit model (OR = 1.36, p < 0.01).
The intervention also increased customers’ level of comfort in asking a member of staff for information about product ingredients. For those in the treatment group, a majority (69.5%) were ‘very’ comfortable, while in the control group, only half (50.8%) were ‘very’ comfortable (see Table 3 for the breakdown of the figures and Figure 4 for a violin plot of the results). Controlling for the influence of demographic covariates, those in the treatment group were, on average, 0.36 points more comfortable than those in the control group (β = 0.36, p < 0.001). See Table 4 for the full model. This result was again supported by the ordinal probit model (OR = 1.66, p < 0.001).
However, the intervention did not have an effect on customers’ level of concern regarding the safety of the food that is sold in the FBO. Overall, a majority (65.3%) were ‘very’ or ‘fairly’ unconcerned about the quality of food that is sold in the FBO, compared to 68.1% in the control (see Table 3). The intervention did not have a significant impact on level of concern in the primary model (β = -0.02, p = 0.920). See Table 4 for the full model. The result which was supported by the ordinal probit model in the sensitivity analysis (OR = 0.90, p = 0.351).
The ICC was 0.01 for comfort asking staff about ingredients and perceptions of food safety. For confidence in identifying ingredients the mixed models resulted in a singular fit – due to trivially small or non-existent intraclass correlation coefficients. Likelihood ratio tests established that a fixed effects model, without the random intercept for clusters, had better fit. See Table 4 for full models, including details of random effects.
Figure 3: Level of confidence in identifying ingredients in the food and drink products by treatment, violin plot
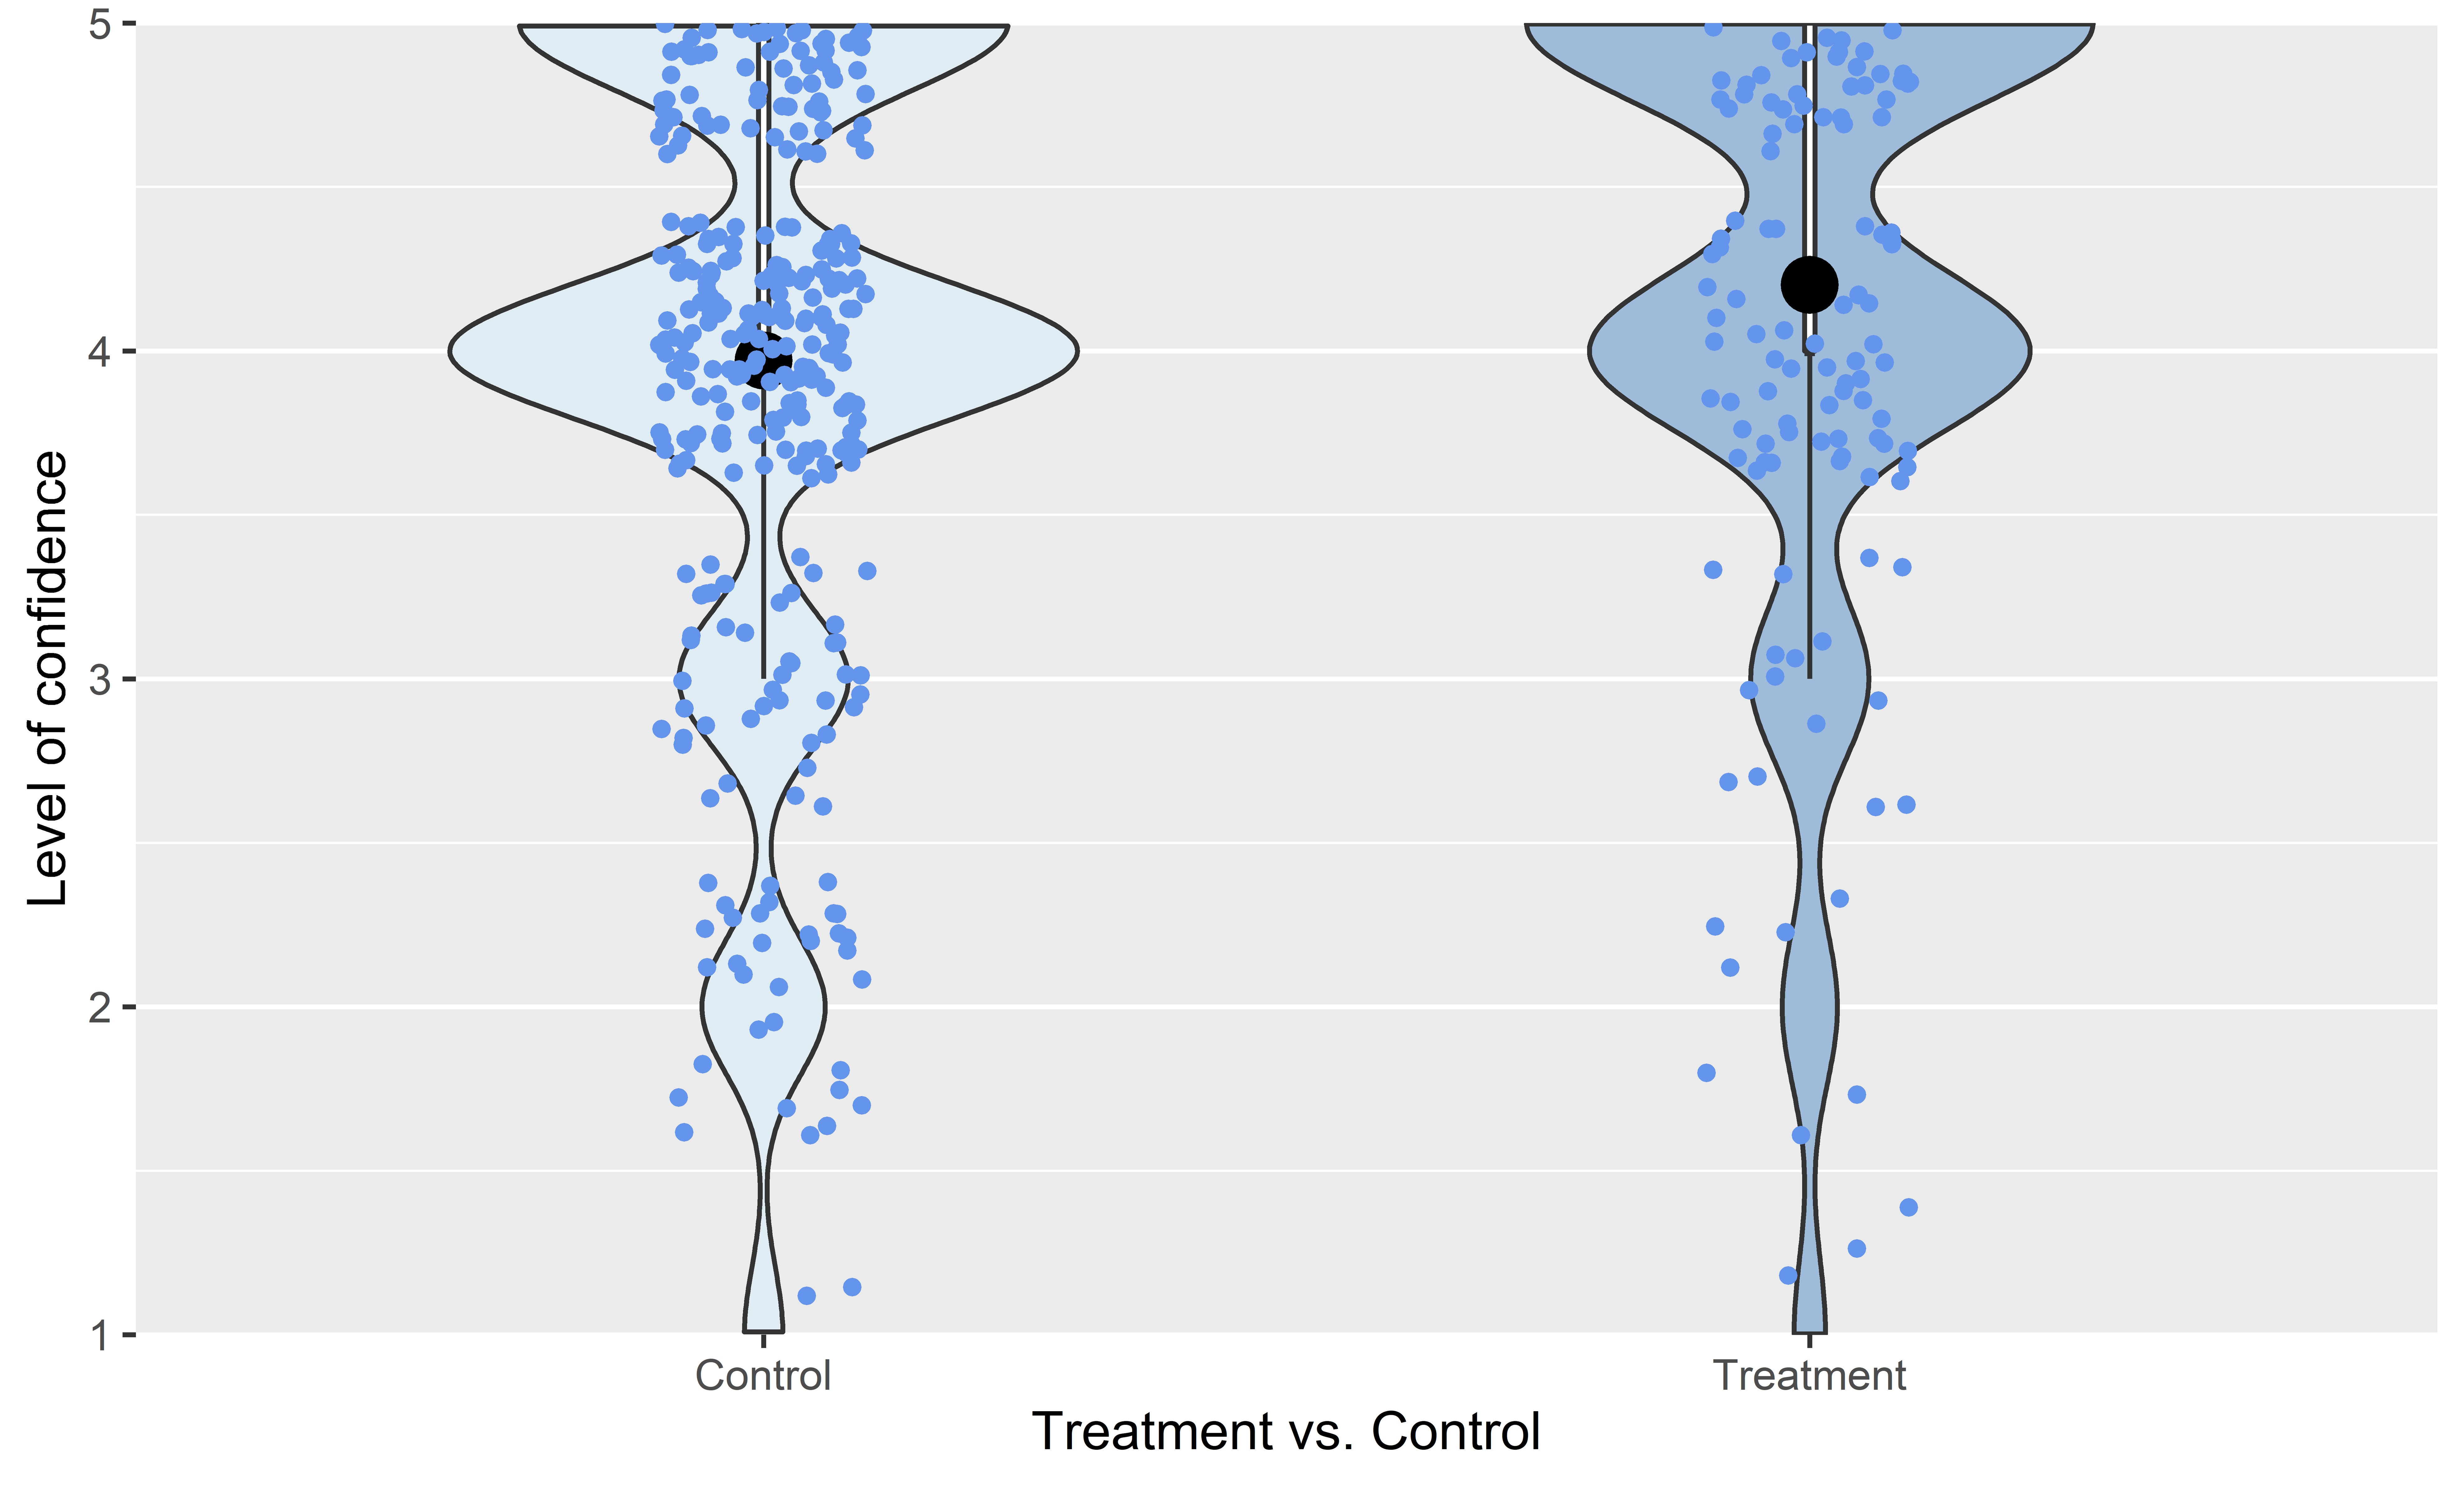
Figure 4: Level of comfort in asking a member of staff for information about the ingredients in the foods or beverages by treatment, violin plot
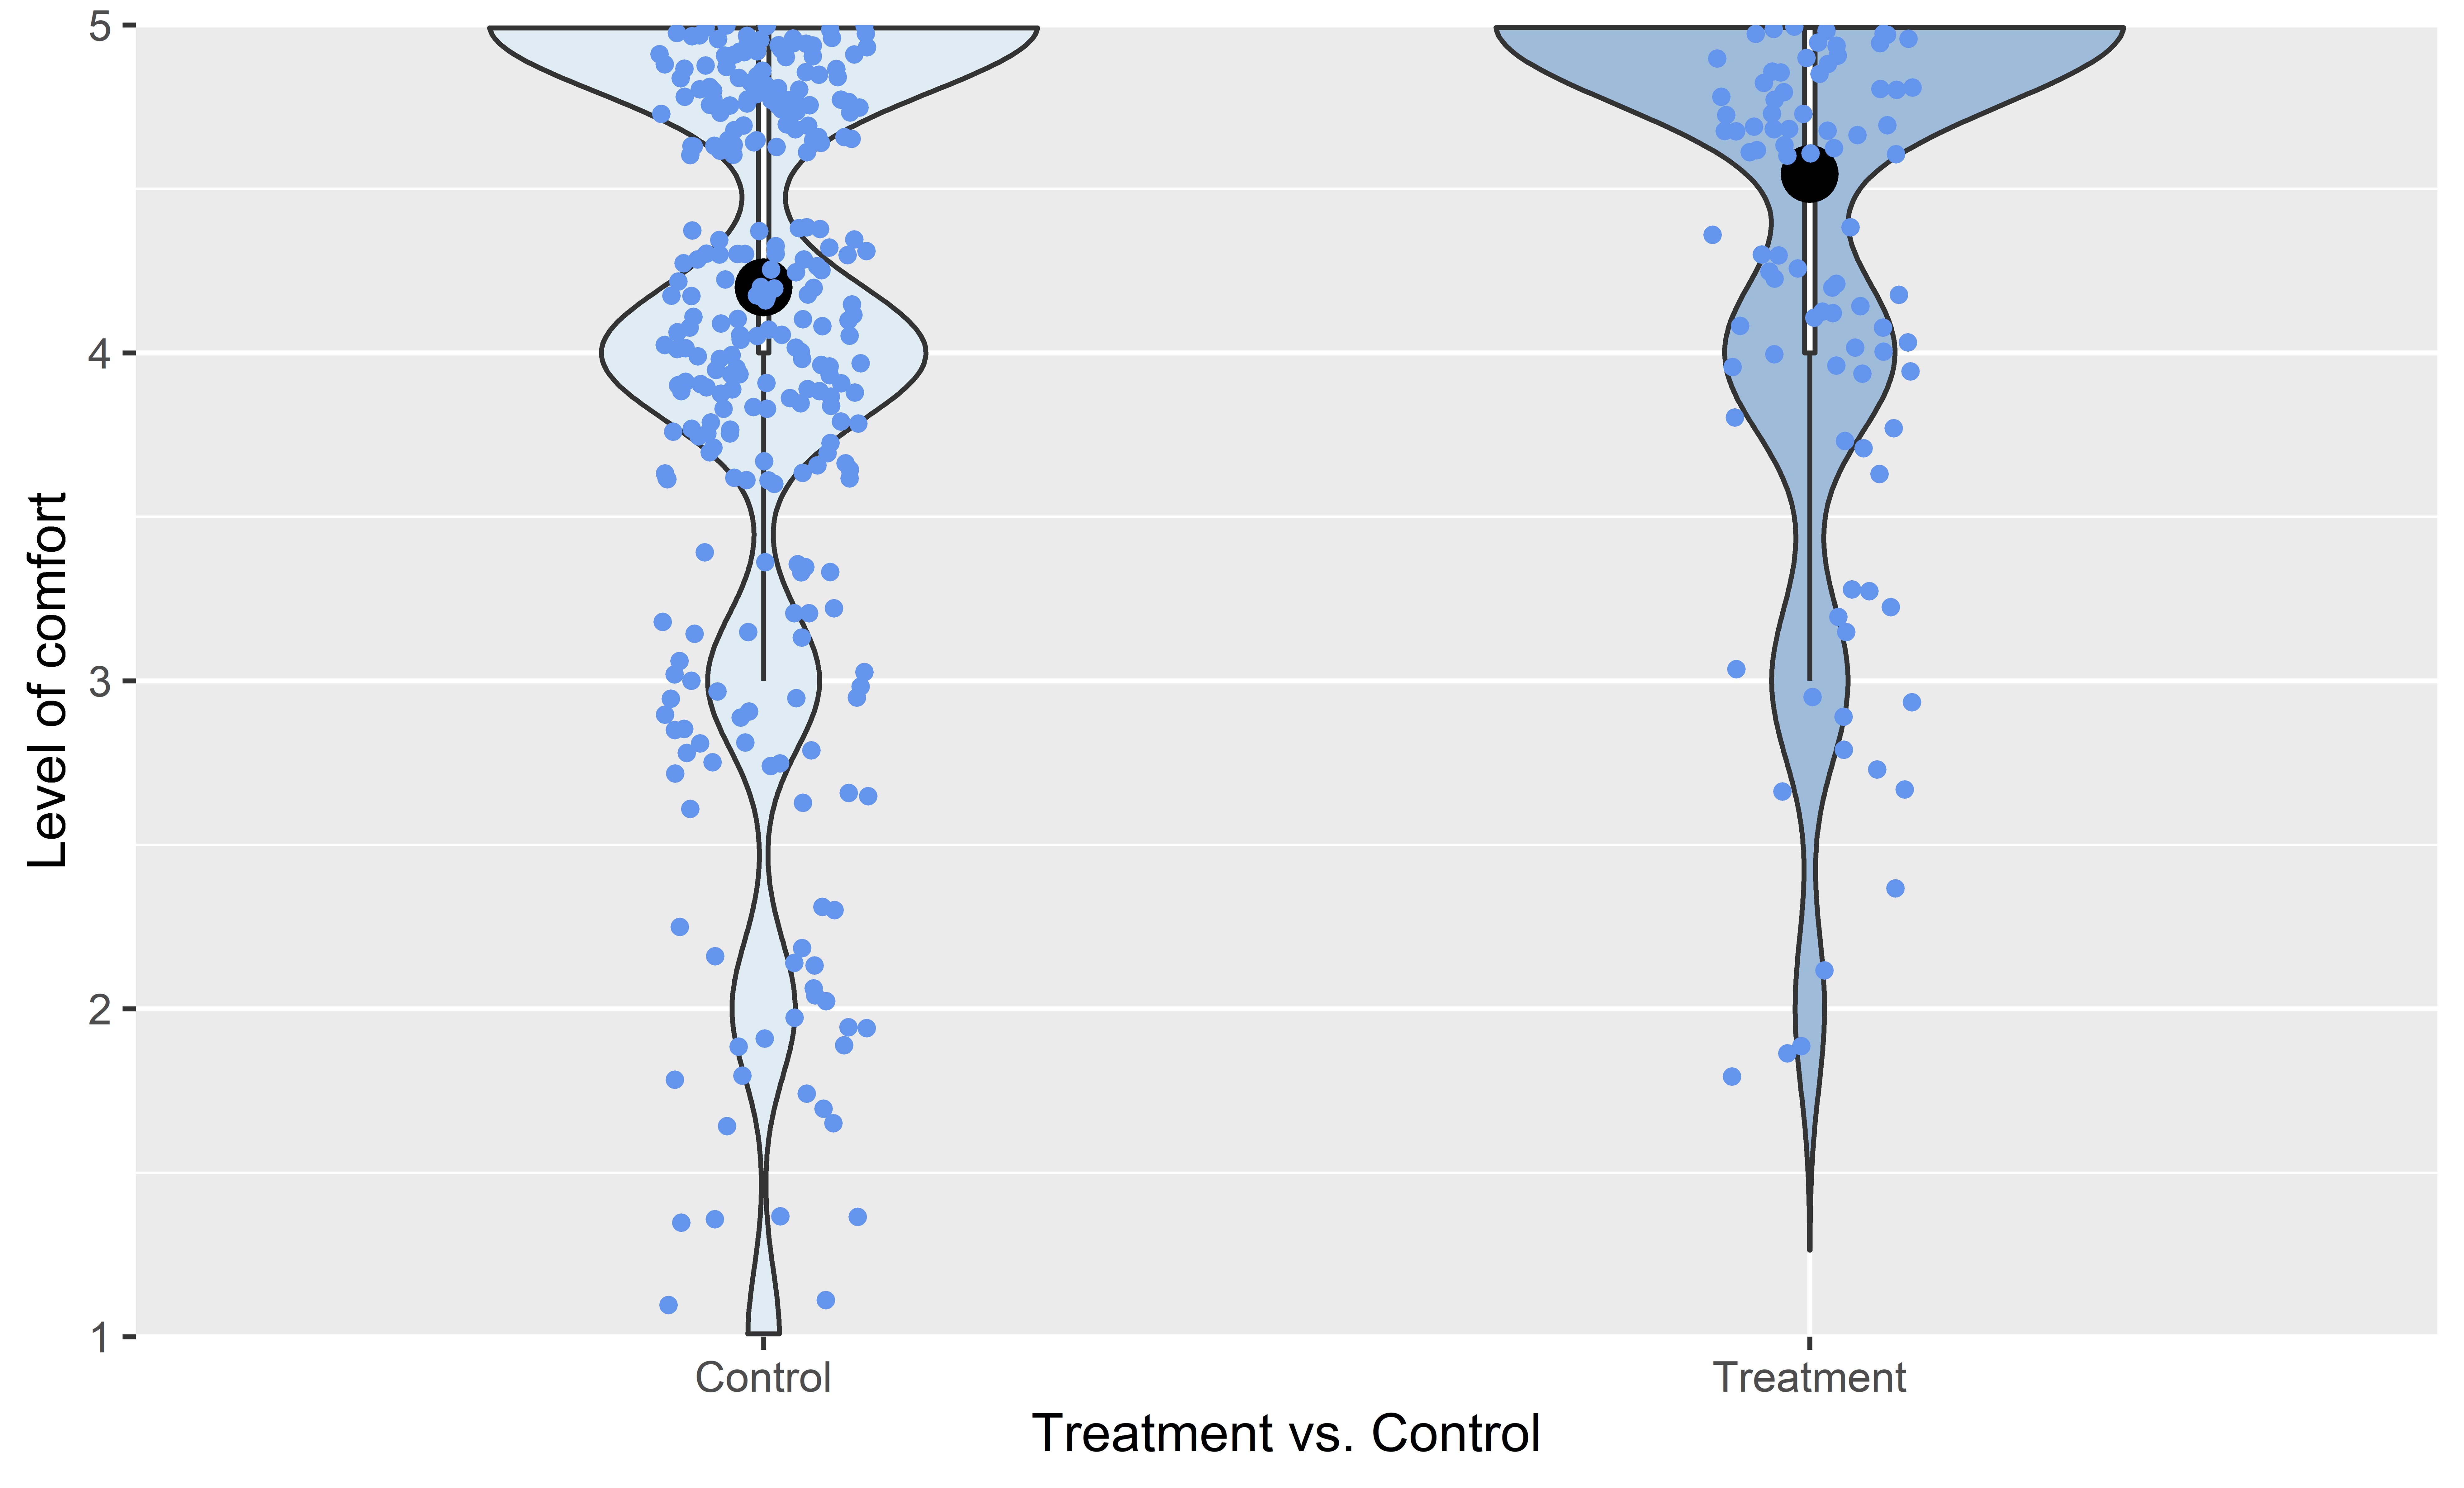
Table 4: Model outputs, primary outcomes
*This model was conducted using a model without a random intercept, which had significantly better fit χ2(1) = 19.476, p < 0.001.
6.4 Secondary outcomes
There were four secondary outcomes in this trial and the intervention had a positive effect on all four (see Table 5).
Trust in the FBO was enhanced by proactively asking customers about their hypersensitivities. The proportion of customers in the treatment group reporting they trusted the business or trusted it a lot was 91.6%, compared to 81.6% in the control group. Holding covariates constant, those in the treatment group trusted the FBO 0.33 points more than those in the control group (β = 0.33, p < 0.001). (See Table 6 for the full model.) A similar result was observed in the respective ordinal probit model (OR = 1.75, p < 0.001).
Customers’ satisfaction with their visit to the FBO increased. The proportion of customers in the treatment group reporting they were Fairly Satisfied or Very Satisfied was 92.8%, compared to 85.4% in the control group. Controlling for covariates, those in the treatment group were, on average, 0.33 points more satisfied than those in the control group (β = 0.33, p = 0.004). (See Table 6 for the full model.) This result was corroborated by the sensitivity analysis’ ordinal probit model (OR = 1.52, p < 0.01).
For the third secondary outcome – likelihood to recommend the FBO to family or friends – there was also a statistically significant difference between the treatment and control groups, controlling for covariates (β = 0.28, p = 0.033). (See Table 6 for the full model.) The proportion of customers in the treatment group reporting they were Fairly Likely or Very Likely to recommend the FBO was 90.2%, compared to 85.3% in the control group.
Finally, the treatment had a pronounced positive effect on the odds of declaring one’s (self-reported) allergy or intolerance. Controlling for covariates, those who received the treatment had significantly higher odds of declaring their hypersensitivity (OR = 8.58, p < 0.001). To put the magnitude of this treatment effect in perspective, the impact of having a hypersensitivity on declaration was similar (OR = 9.19, p < 0.001). See Table 6 for the full model.
Table 5: Response distribution, secondary outcomes
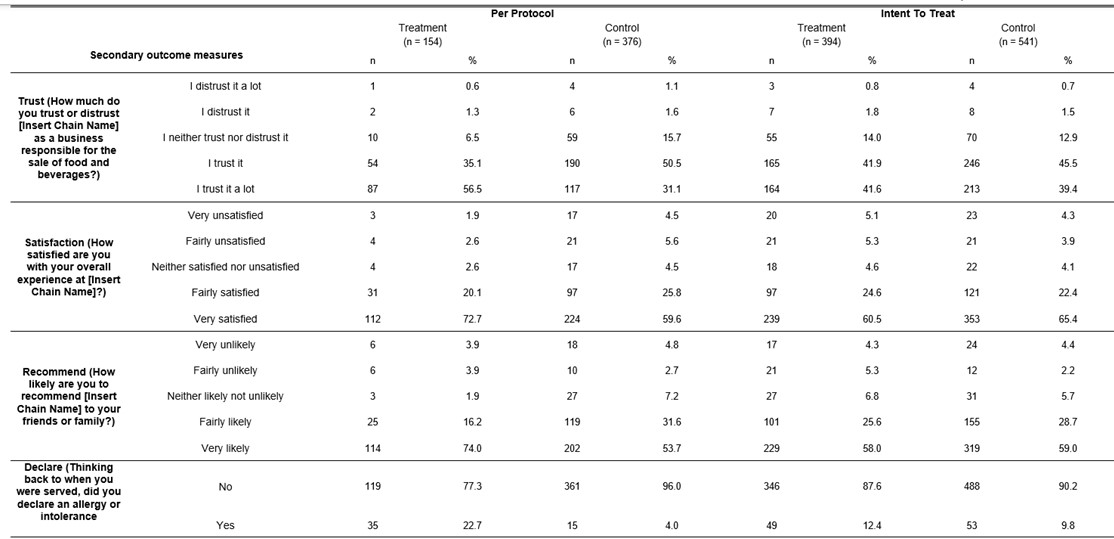
Table 6: Model outputs, secondary outcomes
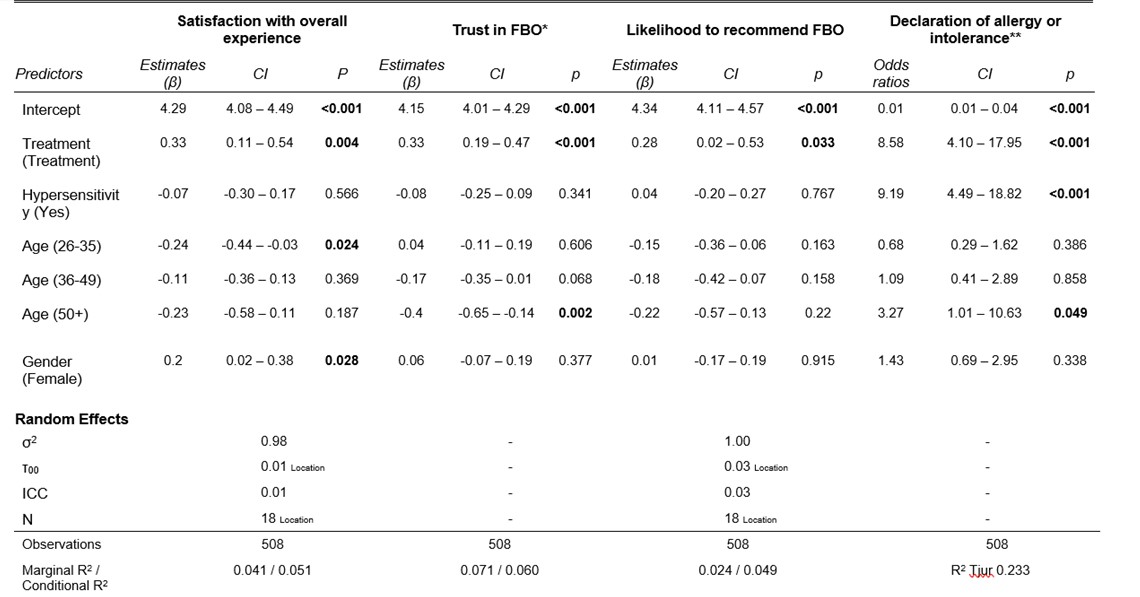
*This model was conducted using a model without a random intercept, which had significantly better fit (χ2(1) = 23.830, p < 0.001).
**This model was conducted using a model without a random intercept, which had a better fit (AIC = 246.200, vs. 248.230)
6.5 Sensitivity analysis
We ran two sensitivity analyses.
First, the models which included the additional interaction term (intervention*hypersensitivity) had similar results to the primary models (see Table 7 in Appendix 1). For all of the outcome variables, the patterns of significance were similar to those observed in the primary analysis above. Specifically, there was a significant treatment effect observed for the intervention for: confidence in identifying ingredients (β = 0.25 , p < 0.05); comfort asking about ingredients (β = 0.35, p < 0.01); satisfaction (β = 0.37, p < 0.01); trust (β = 0.35, p < 0.001); likelihood to recommend the FBO (β = 0.32, p < 0.05); and declaration (OR = 9.02, p < 0.001). For all of these outcomes, the interaction term was non-significant, meaning that differential treatment effects were not observed for customers with hypersensitivities.
Second, the final series of sensitivity analysis was conducted using a ‘intention-to-treat’ approach (see Table 8 and Table 9 in Appendix 1). For all of the outcome variables, a null treatment effect was observed.
Revision log
Published: 12 April 2023
Last updated: 12 April 2024