Our Food 2022: An annual review of food standards across the UK
Our Food 2022: The nation's plate
This chapter explores what we know so far about the impact of cost of living pressures on our ability to access a healthy and safe diet.
Consumers and food standards
At a glance
In this chapter, we look at:
- how inflation has affected the cost and affordability of different foods
- how food choices, priorities and behaviours have changed
- what impact this is having on our ability to access a healthy diet
Introduction
2022 was a tough year for consumers UK food and drink prices rose at the fastest rate since 1977, wages fell in real terms, and there were steep rises in fuel and energy prices, and the cost of borrowing, all of which compounded the financial pressure on households.
But what difference did this make to people’s behaviours and thoughts about food? Can we detect any changes in what we eat, how we cook and how we shop? This chapter explores what we know so far about the impact of cost of living pressures on our ability to access a healthy and safe diet.
The impact on the consumer
Food inflation affects different people in different ways. Although the media and other commentators often use headline inflation figures to describe the rate at which food prices are rising, these are calculated by looking at the average changes in price across a selection of typical items from our shopping baskets.
However, the extent to which someone is personally affected by inflation – and how that may in turn influence what they eat – depends on the foods they buy and how much those items’ prices have changed. So, before we look at our dietary choices, it is useful to look at how price rises vary across different food categories to give us a more nuanced picture of the impact on consumers.
For this report, we have chosen to build our analysis around a selection of commonly bought items, which we have broken down by Eatwell Guide categories (figure 3). This shows that three food categories experienced the sharpest rises in price when averaged out over the course of the year:
- oils and spreads
- dairy products such as milk, yoghurt and cheese, as well as non-dairy alternatives
- fish, eggs, meat and other proteins (footnote 1)
The breakdown also shows that foods high in fat, salt and sugars experienced the lowest rate of inflation (8%), closely followed by fruit and vegetables (9%).
Figure 3: Average percentage 12-month year on year increase in costs during 2022 for Eatwell guide categories

Source: ONS Consumer Prices Index including owner occupiers' housing costs (CPIH) January 2022 to December 2022.
Of course, analysing these differences only gives us part of the story. Our ability to adapt to any increases in price will also depend on how cheap or expensive something is to begin with, and how much and how often we eat it. Price rises in staples such as pasta, eggs, milk and bread, are likely to be felt more keenly by households than luxury or occasional items.
From a healthy eating perspective, it is also important to consider the amount of products within each category a person needs to consume as part of a balanced diet: hence, although we can see that fruit and vegetables experienced lower inflation than other categories, consumers would need to buy a lot more of them if they want to meet government healthy eating guidelines.
All of this needs to be understood in the context of an individual’s wider financial position: in cases where people’s household budgets are already precariously balanced, as we will see, the personal impact of these differing inflationary effects can be especially harsh.
How much are we spending on our food?
A sign of how difficult things became for households can be seen when we look at how much people spent on food overall in 2022. With food prices going up sharply, it would be natural to assume that we would see people spending more on food. In fact, we saw the opposite. Increased financial pressure in areas where people have less control over what they spend (such as housing or energy costs) means that spending on in-home food fell in 2022, even though total household expenditure itself increased (footnote 2).
In 2021, out of a total household spend of £1,276 billion, the UK spent 9.5% (£120 billion) on in-home food and non-alcoholic drinks and 1.9% (£24 billion) on alcoholic drinks. In 2022 we spent over £8 billion less (a total of £112 billion) on in-home food and non-alcoholic drinks and £2 billion less on alcoholic drinks (a total of £22 billion) compared to the previous year, a respective drop of nearly 6.9% and 9.6% (footnote 3).
The percentage of disposable income spent on food outside the home (restaurants and café meals, takeaways, contract catering, and canteens) in 2022 was higher than in 2021 but 37% below pre-pandemic levels (2019) across all income groups. While 2021 showed an unusually large dip in spending on food outside the home, which has slightly recovered for 2022, the overall trend is in line with consumers changing their spending habits due to the increased cost-of living[6].
This is the first time in a decade we have seen a year-on-year reduction in in-home spend on food and drink. Although in-home expenditure on food rose particularly sharply in 2021, likely due to the unique conditions we experienced during the COVID-19 pandemic, we are now seeing a levelling off to pre-pandemic levels.
There are some stark dividing lines between different income groups. When we look at how much of people’s disposable income was spent on in-home food (figure 4), we find that lower-income households now spent more than 16% of their weekly budget on in-home food. By comparison, the highest-income households spent just 5% of their weekly budget on in-home food.
An indication of how this may be affecting some people’s ability to access healthy food is found in the Food Foundation’s 2023 Broken Plate Report. According to its analysis, which covers 2021 to 2022, the poorest fifth of UK households would need to spend 50% of their disposable income on food to meet the cost of the Government’s recommended healthy diet, whereas the richest fifth would only need to spend 11%.
Figure 4: Percentage of disposable household income spent on in-home food by income deciles in financial years 2020 to 2022

*Each decile represents one tenth (10%) of UK households. The information for the lowest (or first) decile is collected differently from the rest and represents the 20% of UK households with the lowest income. The highest decile represents the 10% of UK households with the highest income.
This compares to 43% for the poorest fifth and 10% for the richest fifth reported a year earlier in the 2022 report, suggesting that it has become harder for the most deprived households to afford a healthy diet. The latest report also suggests that healthier foods are over twice as expensive per calorie than less healthy foods, which makes it even more challenging to purchase and consume a healthy diet.
If we factor in the additional price inflation seen last year, it is reasonable to conclude that pursuing a healthy diet is now likely to require an even higher proportion of disposable budget for low-income households. With other non-discretionary costs also rising, this is likely to be contributing to a widening of dietary inequalities, which may impact on the already significant pressures on the NHS.
How did price rises affect our priorities and behaviours?
Understandably, the financial environment strongly influenced people’s mindset and attitudes to food in 2022.
When asked about a range of food-related issues, food prices rose to become the number one food issue of concern for consumers across England, Wales and Northern Ireland (footnote 4) (figure 5). For these parts of the UK, this is the first time food prices have been the most commonly-reported concern since tracking began in 2020, surpassing other issues such as food waste, animal welfare and the amount of fat, sugar or salt in food. In Scotland, food prices also became the number one concern for consumers in December 2021 and remained at the top throughout 2022 (footnote 5) (figure 6).
Figure 5: The top reported food concerns for consumers in England, Wales and Northern Ireland

Source: FSA Food and You 2 survey - Wave 3 (conducted April to June 2021) and Wave 5 (conducted April to July 2022).
Figure 6: The top reported food concerns for consumers in Scotland

Source: Food in Scotland Consumer Tracker - Wave 13 (conducted December 2021) and Wave 15 (conducted December 2022).
As general concerns about food prices increased, so too did people’s anxieties about affordability of food. In England, Wales and Northern Ireland, worries about being able to afford food rose to a peak of 40% in September 2022, before dropping slightly during the autumn and winter. Although differences in how the data is collected make it difficult to make a direct comparison, the data for Scotland shows a similar picture: again, around 40% of adults reported that they were worried about being able to afford enough food in December 2022.
These financial concerns appear to have affected how people shopped and ate. Many consumers reported swapping out preferred brands for cheaper alternatives, changing the type of foods they ate, eating out less, and ordering fewer takeaway meals. In the FSA’s Food and You 2 survey, those who reported making changes to their eating habits in the last 12 months were asked the reason or reasons for making these changes. The most common answer was financial (69%) followed by health concerns (47%). In Scotland, two-thirds (67%) of those who said they had worried about affording food over the previous 12 months said they had eaten out less often while 5% said they had fewer takeaways.
Food swapping behaviours
England, Wales and Northern Ireland - Around a third of respondents reported changing the food they bought (34%) or where they bought food from (33%) to cheaper alternatives in the last 12 months (April-July 2022).
Scotland - Almost half of respondents (46%) reported swapping brands for cheaper alternatives more often and 37% had bought reduced to clear food items more often in the last six months (December 2022).
Cutting down on takeaways and eating out
England, Wales and Northern Ireland - 47% of respondents reported eating out less, and 41% reported eating fewer takeaways in the last 12 months when surveyed between April and July 2022 (Food and You 2, Wave 5).
Scotland - Over half of respondents (56%) in Scotland reported eating out less and 50% reported eating fewer takeaways in the six months leading to December 2022 (Food in Scotland, Wave 15).
Similarly, in-depth focus group research conducted by FSA and FSS in late 2021 and early 2022 explored the lived experiences of UK consumers, showing the changes that many were forced to make as their budgets became more stretched.
The research reveals that the impact of cost of living pressures was not confined to the lowest income groups: it found that across different income brackets, people were swapping out premium brands for cheaper alternatives or using budget retailers instead of their regular supermarket.
People also perceived higher-quality food as more expensive and felt that buying cheaper foods meant they had to make compromises on food quality, health and nutrition.
Yet other research suggests that the prices of cheaper own brand and budget ranges went up faster than the branded ranges. Analysis by the consumer watchdog Which? shows that throughout 2022 own-label budget and own-label branded foods went up by over 18% compared to 13% for branded goods. While the baseline price of many of these ranges is cheaper than the premium brand, the increase is likely to have hit the most financially vulnerable groups hardest.
As I’ve gotten older, I really have noticed how horrible cheaper food is I wish that they would sell food that is accessible to everybody so that poor people could eat things like salmon for example there’s no doubt about it in the long run, you eat cheap stuff, you get ill.
I try to purchase products which are on offer or multi-buy deals This allows me to buy higher-quality food for a lower price… This is how I wish things would change - deals and offers were on more healthy foods than junk foods.
FSA and FSS’s own qualitative research supports this: it shows that for some households every penny used to buy food is carefully budgeted, and a relatively small increase within a food budget that is already under huge pressure represents a major issue.
If it’s something that’s a wee bit more expensive, I would indulge, to have the quality of it Then I’m willing to pay the price for the quality, but I think I’m getting to the stage in the current climate where the quality’s not coming with the price You know, the lower items are coming with high-quality price tags, but high-quality’s not being delivered.
Food insecurity
What does this all mean in practice? One of the most important measures showing how all of this has affected people’s diet and food choices is the proportion of households now defined as being food insecure.
The FSA’s Food and You 2 research uses the United States Department of Agriculture (USDA) measure of adult food security:
- high food security means there are no reported indications of food-access problems or limitations.
- marginal food security means there are one or two reported indications – typically of anxiety over food sufficiency or shortage of food in the house, and little or no indication of changes in diets or food intake.
- low food security means there are reports of reduced quality, variety, or desirability of diet, but little or no indication of reduced food intake.
- very low food security means there are reports of multiple indications of disrupted eating patterns and reduced food intake. Those with high or marginal food security are referred to as “food secure”.
Those with low or very low food security are referred to as “food insecure”.
In the FSA’s survey conducted between April and July 2022, it was found that:
- one in five (20%) households across England, Wales and Northern Ireland were defined as food insecure, with around half of these (or one in ten households overall) classified as having very low food security.
- 13% of households were shown to have marginal food security.
This is the highest level of reported household food insecurity since tracking began in 2016 (footnote 7).
Food security exists when all people, at all times, have physical and economic access to sufficient, safe and nutritious food that meets their dietary needs and food preferences for an active and healthy life
The evidence also shows that some groups are more at risk of food insecurity than others (figure 7). For example, in England, Wales and Northern Ireland those with a long-term health condition are nearly twice as likely to be food insecure than those without a long-term health condition.
Other groups that are more likely to report food insecurity include younger adults, households with children under 16, and unemployed or low income households. People with food allergies are also more likely to report food insecurity, and recent FSA research indicates that adults with a food allergy spend more on food on average compared to those without a food allergy.
And there is significant regional variation too: 25% of those in the north-west of England and 25% of those in Yorkshire and the Humber are food insecure compared to 13% of those in the south-east and 15% of those in the south-west of England.
Figure 7: Who is most vulnerable to food insecurity?
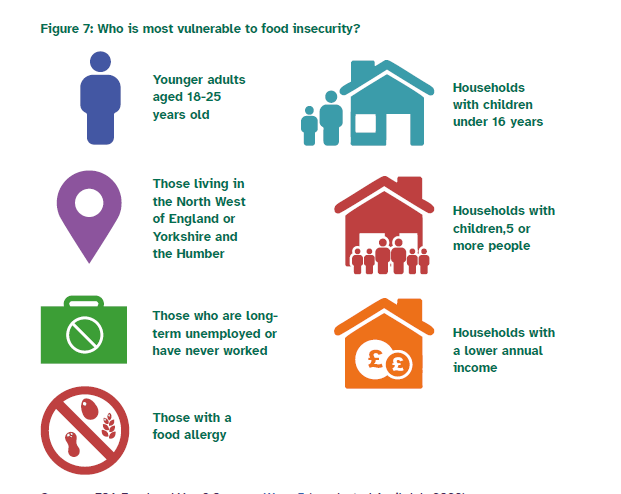
Source: FSA Food and You 2 survey - Wave 5 (conducted April to July 2022)
To give us a sense of the impact this has on people’s lives, the FSA’s monthly tracking data shows that the proportion of adults skipping meals or cutting the size of meals because they did not have enough money to buy food rose during much of 2022 (figure 8). On average, 26% of people did so in 2022, compared to 20% in 2021 (footnote 8). In Scotland, 22% of adults skipped a meal due to lack of money in 2022, compared to 20% in 2021.
Figure 8: Proportion of respondents reporting they have cut down on portion size/ skipped meals due to money [FSA figures for England, Wales & Northern Ireland]

*An ‘*’ is used to indicate months with a statistically significant difference to the previous month.
Source: FSA Consumer Insights Tracker (March 2022 to March 2023)
The impact on the population's health and diet
As last year’s report made clear, for decades our diets have contained too much salt and saturated fat, too many free sugars (footnote 9) and not enough oily fish, fruit and vegetables, and fibre. These findings are also reflected in the most recent Scottish Health Survey for 2021 (figure 9).
Figure 9: Key findings from the Scottish Health Survey 2021

Source: Scottish Health Survey 2021
It is too soon to say what the impact of cost of living pressures will be on people’s dietary choices, not least because we do not have the latest data from the National Diet and Nutrition Survey, the most comprehensive data source on the types and quantities of food consumed in the UK as a whole.
What we do know from research conducted in early 2022 is that most people (70%) feel confident that they know what a healthy nutritious diet is. This was typically associated with fresh, minimally-processed food that offers a good variety of nutrients. These included fruit and vegetables, traditional staples such as milk and bread, and good quality meat. In contrast, unhealthy foods were often perceived to be more processed, higher in additives, and higher in saturated fat, sugar and salt. People may be feeling that it is increasingly hard to achieve a healthy diet in the current economic environment.
When asked about their concerns for the future of food over the next three years approximately two-thirds (68%) of participants said they were concerned about the cost of healthy food (footnote 10), 53% felt priced out of healthy foods (footnote 11) and 31% said that they find it difficult to find fresh food that fits within their budget (for example, fruit, vegetables, meat) (footnote 12).
Concerns about the ability to access healthy food were most commonly expressed by people in lower socio-economic groups, those with lower incomes, people living with food insecurity, ethnic minority groups, larger households, younger families and younger adults (aged 18-44) without children who are living alone or with a partner.
Healthy to me is eating fruit and vegetables along with fresh cooked wholesome dinners on a daily basis.
I worry about the affordability of buying food - with inflation and no pay rises for workers Not being able to feed my family properly Having to rely on rubbish unhealthy food which could compromise our health
To what extent are these concerns influencing what goes in people’s shopping baskets? ONS purchasing data for 2022 shows that although we spent less on in-home food than in previous years, the reduction in spending was spread relatively evenly across meat, fruit and vegetables and sugary goods, suggesting that there has not been any notable difference in the way we divide our spending between different food categories.
What about the perceived “quality” of the food we are purchasing? We have already shown evidence that consumers are switching to cheaper alternatives such as own brand or value range products, reducing portion size/quantity or reducing spend on premium produce in favour of household staples. However, while this might feel like a drop in the perceived quality – or desirability – of people’s food, what we do not know yet is whether all of the above has had any impact on the actual nutritional value of what people eat.
Food safety and cost of living pressures
One final consequence of the financial pressures experienced during 2022 relates to how people store and cook their food. The FSA started monitoring consumers’ food storage and cooking behaviours on a monthly basis from September 2022 (see figure 10). FSS asked consumers a similar question in December 2022, asking respondents to consider the previous six months (figure 11).
Some of these behaviours involved using different cooking methods – for instance, in September 2022 around six in ten people (59%) in England, Wales and Northern Ireland reported using cheaper cooking methods (such as air fryers, microwaves, or slow cookers) instead of ovens to heat food as a way of saving money. In Scotland, 45% reported switching cooking methods over the six months up to December 2022.
However, a smaller proportion of people reported behaviours that could put them at greater risk of food poisoning, including reducing the length of time food was cooked for, lowering the cooking temperature for food, changing the setting of their fridge or freezer, or even switching these appliances off altogether to reduce electricity costs.
We also found some evidence that consumers were eating food past its use by date: this peaked when a third of consumers in England, Wales and Northern Ireland reported doing this in October 2022 (figure 12).
In England, Wales and Northern Ireland, all of these behaviours declined in November 2022, coinciding with the introduction of the Energy Bills Support Scheme, and the November Cost of Living payment (to eligible households). Although we cannot prove causation, it is possible that these schemes contributed to this observed decrease.
Figure 10: Change to consumers’ food storage and cooking practices in England, Wales and Northern Ireland

*An ‘*’ is used to indicate months with a statistically significant difference to the previous month.
Source: FSA Consumer Insights Tracker (September 2022 to March 2023)
Figure 11: Things people have done in Scotland to save money in the last 6 months

Source: Food in Scotland Consumer Tracker, Wave 15, December 2022
Figure 12: Further changes made by consumers in England, Wales and Northern Ireland to save money

*An ‘*’ is used to indicate months with a statistically significant difference to the previous month.
Source: FSA Consumer Insights Tracker (September 2022 to March 2023)
In summary
The cost of food increased on average 11% during 2022, with oil and spreads, dairy products and non-dairy alternatives, fish, eggs, meat and other proteins experiencing some of the sharpest increases and foods that are high in fat, salt and sugar experiencing smaller price rises than many other staple foods.
However, our analysis of people’s purchasing data suggests there has not been any significant shift in how we divide our spending between different food categories. Overall spending on in-home food also fell slightly last year – the first year-on-year fall for more than a decade.
Food prices became the top food concern for UK consumers in 2022, surpassing all other food-related concerns for the first time since FSA/FSS polling began. A smaller, but sizable number of people were worried about being able to afford food. People also reported making changes to what and where they ate throughout 2022 including changing what they bought or where they shopped, swapping premium or luxury items for cheaper alternatives, eating out less, and ordering fewer takeaways in an effort to reduce costs.
The number of households reporting food insecurity across England, Wales and Northern Ireland rose to 20%, the highest level since tracking began in 2016, with a further 13% of households reporting marginal food security. This suggests that up to a third of all households have material concerns about having enough food to eat. One in ten households are experiencing very low food security with regularly disrupted eating patterns and reduced food intake. A similar trend has been seen in Scotland, 40% of adults were worried about affording food in December 2022, compared to 17% in July 2020.
Approximately two-thirds of people are concerned about the cost of healthy food over the next three years and more than half feel ‘priced out’ of eating healthily. Consumers tell us in our research that they are having to make compromises on the perceived quality of their food. The publication of the forthcoming National Diet and Nutritional Survey for 2022 will help us to understand whether this is translating into any meaningful changes in people’s diets. However, it will take longer for any changes in health outcomes to become apparent.
-
This excludes beans and pulses due to unavailability of data.
-
All figures in this paragraph from ONS Consumer trends: chained volume measure,
seasonally adjusted. -
All figures in this paragraph from ONS Consumer trends: chained volume measure,
seasonally adjusted. -
Respondents were asked: Do you have concerns about any of the following?
The amount of sugar in food, food waste, animal welfare, hormones, steroids or antibiotics
in food, the amount of salt in food, the amount of fat in food, food poisoning, food hygiene when eating out, food hygiene when ordering takeaways, the use of pesticides, food fraud or crime, the use of additives (for example, preservatives and colouring), food prices, genetically modified (GM) foods, chemical contamination from the environment, food miles, the number of calories in food, food allergen information, cooking safely at home, none of these, don’t know. Respondents could select multiple responses. The percentages indicate the proportion of respondents who selected each option. -
Differences in percentages between Scotland and the rest of the UK may be due to
methodological differences in how data are collected. -
Social Grade has six possible classifications (A, B, C1, C2, D and E). Census data uses
a combined, four-way classification. C1: Supervisory, clerical, and junior managerial,
administrative and professional occupations. DE: Semi-skilled and unskilled manual
occupations; unemployed and lowest grade occupations. -
The FSA has been measuring food insecurity since 2016. In 2016 and 2018, food insecurity was measured in Food and You. Since 2020 it has been measured in Food and You 2.
-
Because of differences in the way that the data is collected, we cannot make direct
comparisons between the official USDA measure as set out in Food and You 2 and the
more informal measures of certain food insecurity behaviours tracked monthly. -
Free sugars refers to all added sugars in any form; all sugars naturally present in fruit and
vegetable juices, purées and pastes and similar products in which the structure has been
broken down; all sugars in drinks (except for dairy-based drinks); and lactose and galactose added as ingredients. -
Respondents were asked: To what extent do these areas concern you about the future of
food in the UK over the next 3 years? Cost of healthy food. Response options: Not at all
concerned, A bit concerned, Quite concerned, Extremely concerned. Reported percentage
for concerned combines ‘Extremely concerned’ and ‘Quite concerned’ responses. -
Respondents were asked: To what extent do you agree or disagree with this statement?
I feel priced out of healthy foods. Response options: Disagree strongly, Disagree slightly,
Neither agree nor disagree, Agree slightly, Agree strongly. Reported percentage combines
‘Agree slightly’ and ‘Agree strongly’ responses. -
Respondents were asked: To what extent do you agree or disagree with this statement?
It’s difficult to find fresh food (for example, fruit, vegetables, meat) that fits my budget.
Response options: Disagree strongly, Disagree slightly, Neither agree nor disagree, Agree
slightly, Agree strongly. Reported percentage combines ‘Agree slightly’ and ‘Agree strongly’
responses.