Testing the impact of overt and covert ordering interventions on sustainable consumption choices: a randomised controlled trial
Testing ordering interventions: Appendix C Details of Statistical Methods and Results
An overview of the statistical methods used and their results.
The main model for testing the two hypotheses was a generalised linear mixed model with logistic link function given a binary primary outcome. A basic model specification is:
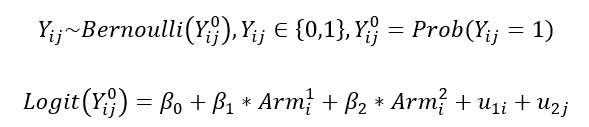
where:

is binary variable indicating whether a more sustainable product was chosen for participant i in product category j. The binary variable equals 1 if the rank of chosen product is 1, 2 or 3, and equals 0 if the rank of the chosen product is 4, 5 or 6.

is a binary variable indicating whether participant i was randomly allocated to the covert ordering arm.
equals 1 if participant i was randomly allocated to the covert ordering arm, and equals 0 if participant i was randomly allocated to the control (random ordering) arm or the overt ordering a
Similarly,

is a binary variable indicating whether participant i was randomly allocated to the overt ordering arm.
equals 1 if participant i was randomly allocated to the overt ordering arm, and equals 0 if participant i was randomly allocated to the control (random ordering) arm or the covert ordering arm.

and

represent the corresponding fixed effects of being in the covert ordering arm and the overt ordering arm on the primary outcome variable.

is the random effect of participant

where N is the number of participants.

is the random effect of product category

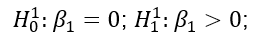
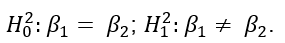
With the model specification, our hypotheses can be written as:
In addition to the basic specification above, there was a set of potential covariates that could be added as fixed effects to the model including average price difference between the three more sustainable products and three less sustainable products in a category, whether a participant eats meat, participants’ environmental concern, attitudes towards nudges, participants’ age, gender, education level, income group, and the order in which a product category appears in the six-page sequence (footnote 1). We examined the correlations between four continuous potential covariates: participants’ environmental concern, attitudes towards nudges, participants’ age, and household income. No strong correlations were found between these variables (highest pairwise correlation coefficients -0.17).
Then we ran a model with the basic specification (see Appendix Table 6) and all potential covariates, after which we computed the variance inflation factors (VIF) for all the covariates, and no covariate had a VIF statistic value larger than 4, indicating no multicollinearity issues (Kabacoff, 2011). However, the initial model was estimate with a warning message and a suggestion to rescale variables. Consequently, we mean centred and standardized all continuous covariates in subsequent models that we estimated. Estimation of the same model, with the basic specification outlined above, with rescaled covariates did not produce warnings. Then we ran backward selection for the remaining covariates using Likelihood Ratio Tests (LRTs) with α = 0.05, starting by removing covariates with the highest p-values. This process gave us the final set of covariates to include in any analysis with the primary outcome as the dependent variable. Participants’ attitudes towards nudges, environmental concern, serial position of product page, average price difference between more/less sustainable products, and participants’ gender were dropped. Whether a participant ate meat, had at least a bachelor’s degree, participants’ age and total household income were included as covariates in the optimal model. The LRT statistic was not significant between the model with all covariates and the optimal model with the reduced set of covariates.
A random individual effect (intercept) and a random product category effect (intercept) were assumed, and theoretically warranted, in the basic model specification. However, it was not clear whether the inclusion of additional random effects was justified by the data. Therefore, LRTs were conducted to compare the goodness-of-fit of models with different random effects structure (Bates et al., 2018; Matuschek et al., 2017). Following Bates et al. (2018), we started with the maximal model which included random intercepts and random slopes (random differences in the effects of two treatment arm variables) for participants and product categories and did not impose restrictions on the variance covariance components. We stopped at the additive model with random effects of participants and random effects of product categories (as in the basic model specification above). A simpler model was selected if the more complex model did not lead to significant improvement of goodness-of-fit (with p < 0.05 as the threshold) or led to non-convergence. As a sensitivity analysis, the model selection procedure was run with an alternative cutoff of p < 0.20 (Matuschek et al., 2017). The LRT test statistic indicated that the basic specification with the random intercepts of participants and random intercepts of product categories was preferred, regardless of whether a threshold of 0.05 or 0.20 for the LRT was used.
As a sensitivity analysis, we estimated the primary effects of interest using secondary outcomes, which were alternative forms of the primary outcome variable. The first alternative was a binary variable which equals 1 if the rank of the chosen product is 1 and equals 0 if the rank of the chosen product is not 1. This binary variable indicates whether the most sustainable product is chosen or not at the product category level. This allowed us to examine the results regarding a different choice of cut-off points. A logistic model was used as the dependent variable is still binary. We went through a similar procedure to select the set of covariates and random effects as that for the primary outcome. The covariate selection process resulted in the removal of gender, attitudes towards nudges, household income, price difference between most sustainable products and the rest (not when threshold was 0.2), and serial position of product page (not when threshold was 0.2), sequentially. The preferred random effect structure was the one with random intercepts for participants and product categories. Appendix Table 7 shows the results of our optimal model. Critically, the coefficient for neither covert ordering arm nor overt ordering arm was significant. Note that the coefficients for covariates did differ, in terms of the magnitude of the effect, compared to those of the optimal model using the primary outcome. Appendix Table 7 shows that participants who were older, with higher education degree, and stronger environmental concern, were more likely to choose the most sustainable product. Furthermore, as in the optimal model for the primary outcome, participants who do not eat meat were more likely to choose the most sustainable product using the first secondary outcome.
A second alternative consisted of using an ordinal outcome variable that indicates the rank of sustainability of the product chosen in each category (from 1 to 6 with 1 being the most sustainable and 6 being the least sustainable). An ordinal regression model was used as the outcome variable is ordinal, using the clmm2 function in R. The command only allowed one random effect, and the LRTs showed that the model with product categories random intercept was preferred to an alternative model with participant random intercept. LRTs also indicated that ordinal models that relaxed the proportional odds assumptions for both treatment variables were preferred. The backward covariate selection process resulted in the removal of education, attitudes towards nudges, average price difference between more/less sustainable products, serial position of product page, household income (not when threshold was 0.2) and gender, sequentially. Appendix Table 8 shows the results of the optimal model for this secondary outcome. Note that most coefficients for covert and overt ordering arms were not significant, with the exception of the probability of choosing the lowest ranked product. The coefficients for the selected covariates show that not eating meat, having higher environmental concern, and being younger were associated with choosing a product with a higher sustainability rank.
As an extra sensitivity analysis, we also estimated the main model with primary outcome without any covariates. We went through the same model selection process for random effect structure but without any covariates included. This analysis led to the same conclusions regarding the effects of the interventions (with the random intercepts model being selected as in the optimal model, as well).
We also ran the following additional analyses:
First, we explored if the effects of covert and overt sustainability ordering on sustainable consumption differed for different age/gender/socioeconomic groups. Participants’ age, gender, higher education status, and their income group were added to the main specification (with the same random effect structure and other covariates as used in the primary analysis) and interacted with the two treatment arm variables respectively. The estimated coefficients for the interaction terms indicated whether the effects differed between age/gender/socioeconomic groups (proxied by education and income group).
Second, we explored whether participants’ environmental concern and reactance to nudges moderated the effect of an overt sustainability ordering on the probability of choosing a more sustainable product. To explore these possible moderation effects, a measure of environmental concern/reactance to nudges, based on answers to corresponding questions in the questionnaire, was added to the main specification (with the selected random effect structure and covariates) and interacted with the treatment variable for overt ordering arm to estimate the effect of overt ordering for participants with different level of environmental concern/reactance to nudges.
We also explored whether participants engaged in any compensatory behaviour by looking at the order effect of the sequence of product categories. During the experiment, product categories were shown to participants in a randomized sequence and the realized sequence was recorded for each participant. Research has shown that when individuals are nudged to choose healthier food, they might engage in compensatory behaviour by consuming more unhealthier food in the categories that are not targeted (Wisdom et al., 2010). It is possible that while more sustainable products were selected at the beginning of the experiment, less sustainable products were consumed more towards the end of the experiment, especially for participants in the overt arm where they were made aware about the purpose of the intervention. To explore this, the number of the product page in the six-page sequence was added to the main specification as a continuous variable to interact with the two treatment arm variables. Negative interaction effect with the treatment variable for overt ordering arm was expected.
Finally, to further explore the mechanisms, we looked at outcomes from survey responses that measured participants’ normative attitudes towards buying sustainably. The overt statement and ordering intervention might convey the message to consumers that they should choose sustainable products, which would support and probably increase the effect of the ordering intervention. Therefore, analysis was conducted to explore whether an overt ordering intervention had a positive effect on this outcome. An ordinal regression was run with the survey response of normative attitudes towards buying sustainably being the outcome variable and a binary variable indicating whether a participant was in the overt treatment arm (1, yes; 0, no) being the predictor.
No significant results were found for these additional analyses.
-
The order in which a product category appears in the six-page sequence was treated as a continuous variable, but we checked whether inference varies when this variable was treated as categorical; whether a participant eats meat and gender were binary variables; education was transformed into a dichotomised variable based on whether a participant has at least bachelor’s degree or not; all the other potential covariates were treated as continuous variables.
Revision log
Published: 23 February 2023
Last updated: 28 February 2024