Testing the impact of overt and covert ordering interventions on sustainable consumption choices: a randomised controlled trial
Testing ordering interventions: Results
An overview of the results of the project.
3.1 Recruitment
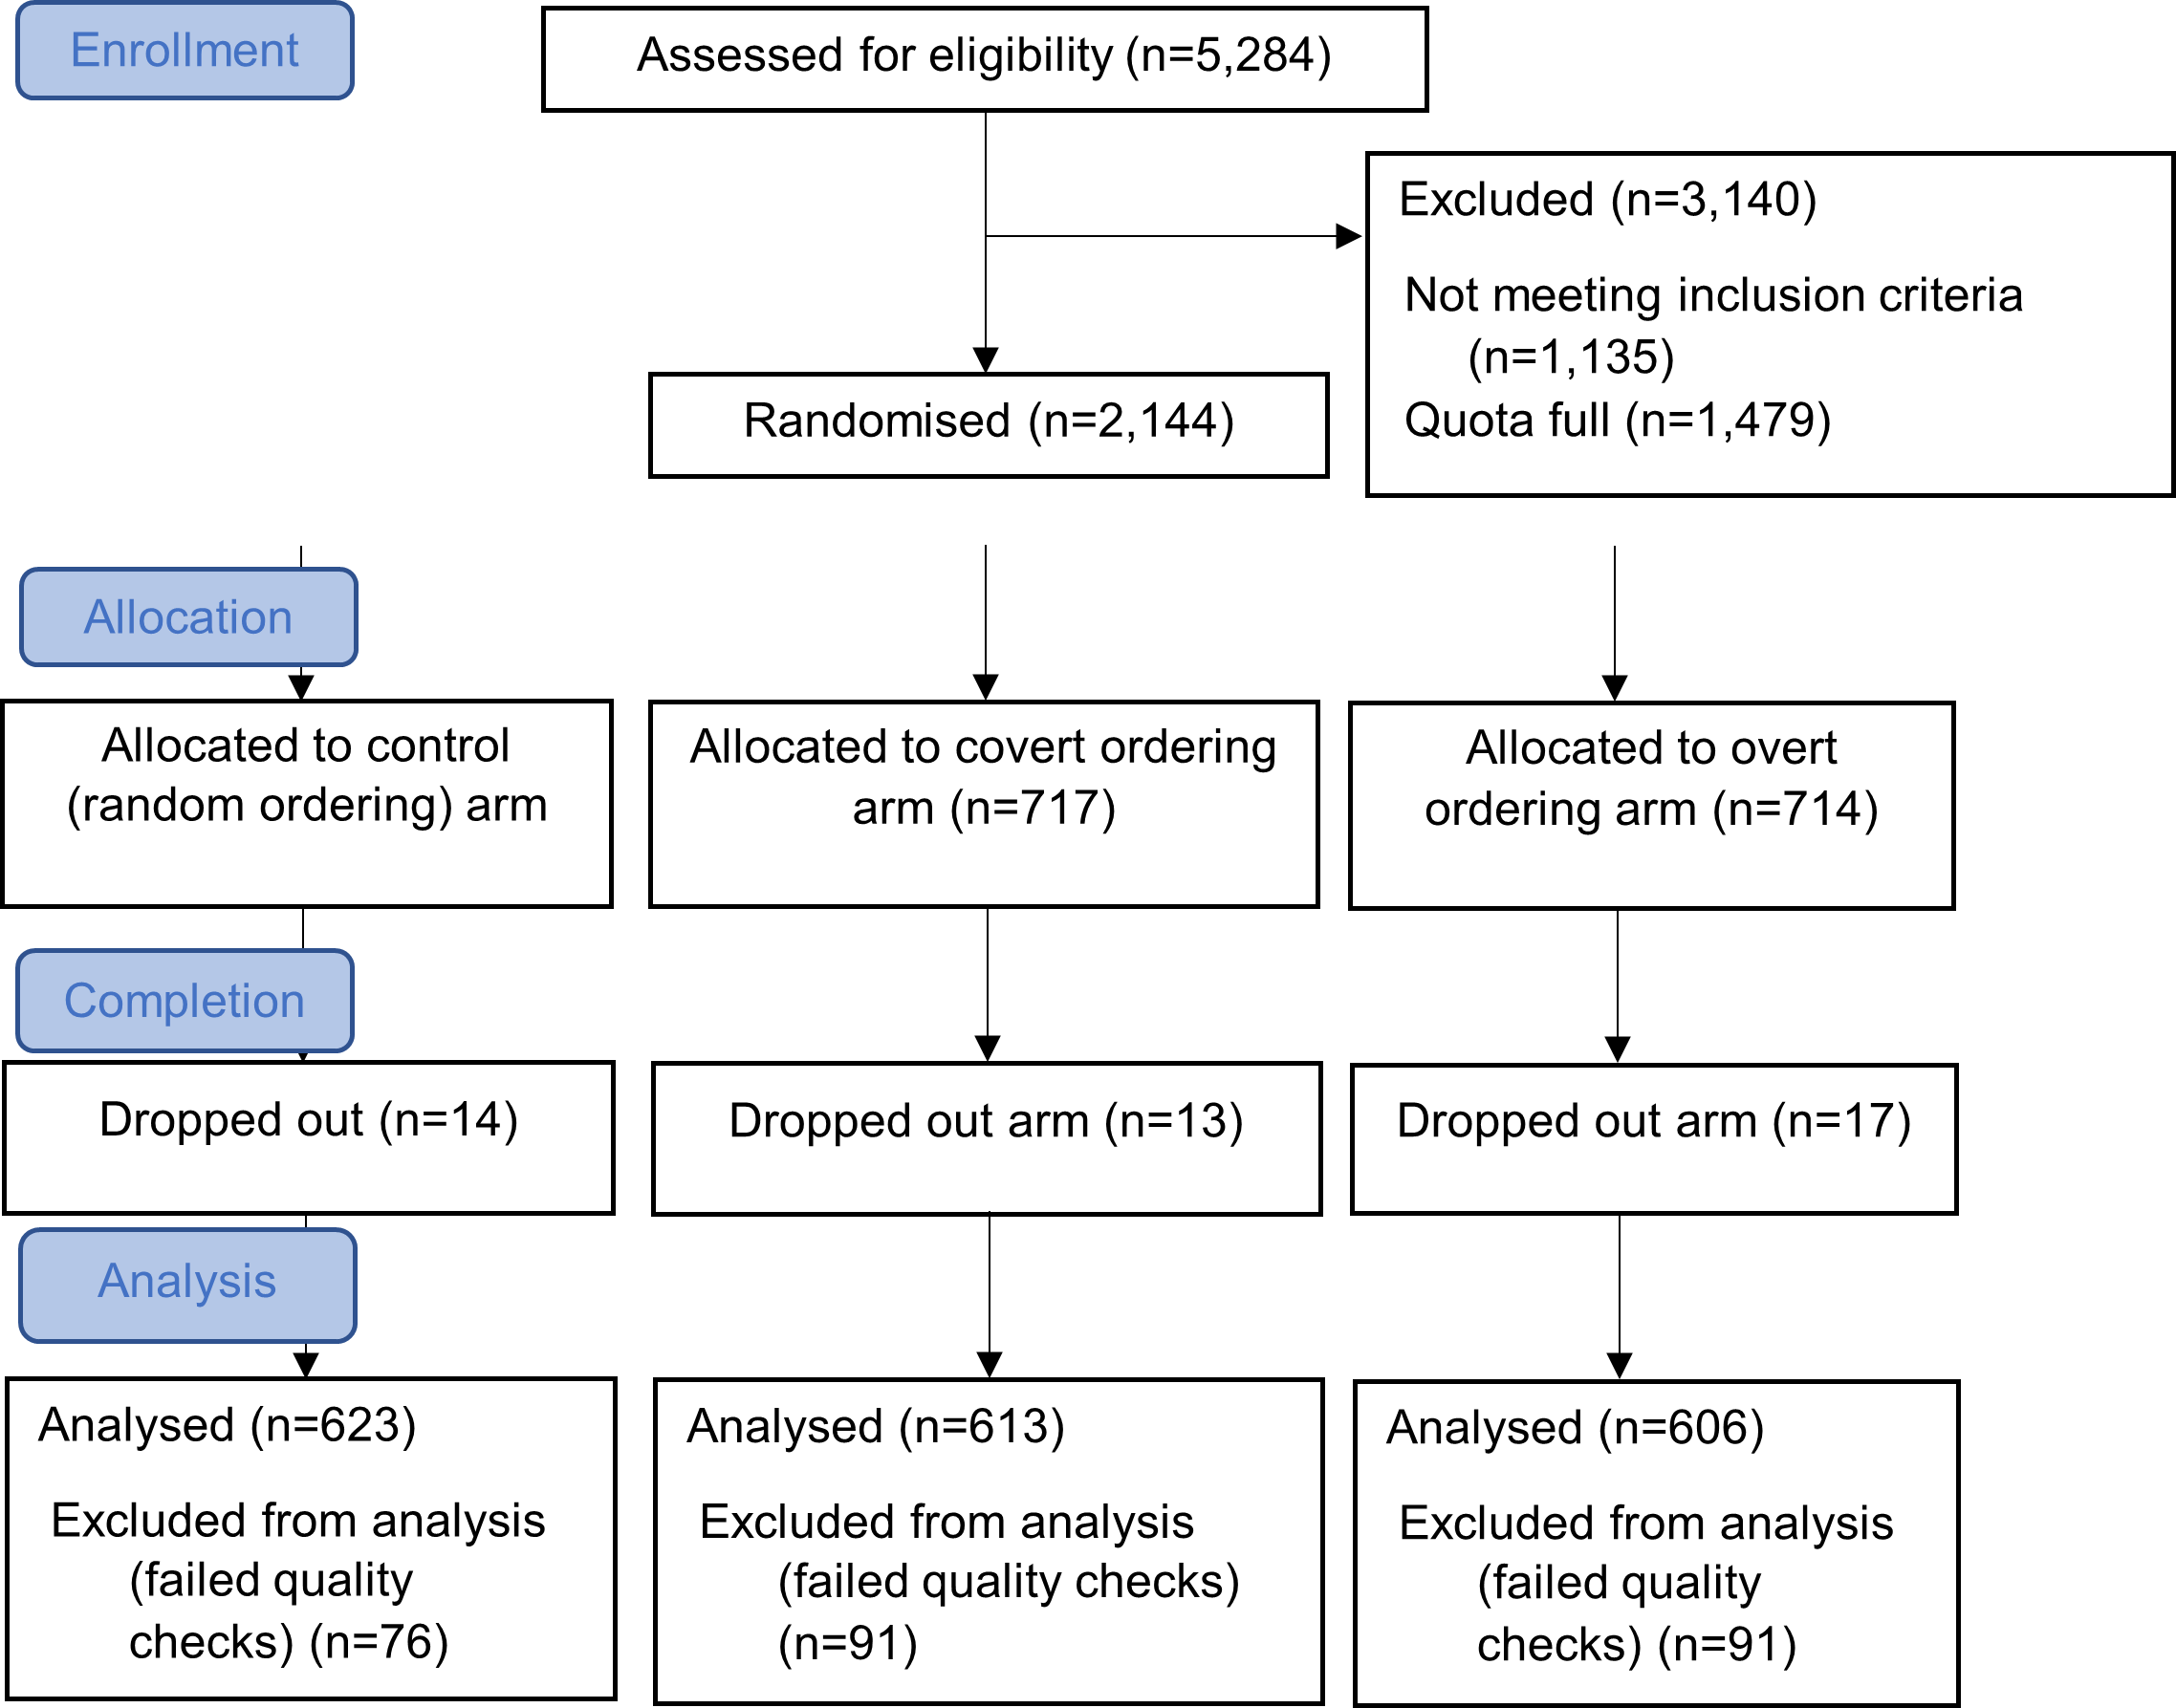
The online experiment was launched on the 9th of March 2022 and finished on the 21st of March 2022 A total of 5284 potential participants were assessed for eligibility; 2144 participants passed the qualification stage and started the experiment; 44 participants dropped out during the experiment; 258 participants completed the experiment but failed the quality checks, and were thus not included in the final sample; 1842 participants were included in the final sample with complete data used for statistical analyses. Figure 7 shows the participant flow. Baseline demographic characteristics for each arm can be found in Appendix Table 4. Responses to attitudinal questions for each arm can be found in Appendix Table 10.
Figure 7: Participant Flow
The modal frequency of online grocery shopping among participants was ‘at least weekly’ in all three arms, and 37.9% across the sample as a whole.
Participants on average spent 5.96 minutes on the experiment (SD = 5.62). Participants received the standard panel incentives for completing the experiment (which is confidential commercial information) and spent an average of £14.90 (SD = 1.48) on the shopping task, leaving average change of £15.10. 984 (53.4%) of participants chose to enter the prize draw. 1301 (70.6%) of participants accessed the experiment with their mobile phone, while 526 (28.6%) of participants used a desktop/laptop computer and 15 (0.8%) of participants used a tablet. The trial was conducted according to the trial protocol without deviation.
3.2 Main Results
Participants chose a more sustainable product 59.5% of the time in the random-ordering arm, 58.8% of the time in the covert ordering arm, and 59.6% of the time in the overt ordering arm, an average of 59.3% over the entire sample. Our optimal model showed that there was no statistically significant effect of the covert ordering intervention on the probability of choosing more sustainable products versus less sustainable products (OR = 0.97, 95% CI 0.88-1.07, p = 0.533). Furthermore, our hypothesis that the effects of the covert ordering intervention and overt ordering intervention do not differ could not be rejected (z-value = -0.533, p = 0.594). See Table 2 for results of the optimal model with optimal random effects structure and reduced set of covariates. Note that the variances of random effects (participant-related variance = 0.03, category-related variance = 0.04) were smaller than expected in the power simulations, but so was the effect size of the interventions. Specifically, we assumed that the effect size of the interventions would be 5% to 8%, but the actual effect size was much lower (point-based estimate, given our optimal model, for both intervention arms was less than 1%). The results were not sensitive to the inclusion of extra covariates.
There were demographic differences in sustainable choices. Older people were less likely to choose a more sustainable product (OR = 0.88, 95% CI 0.85 – 0.92, p < 0.001), as were people with higher education (OR = 0.91, 95% CI 0.83 – 0.99, p < 0.028), and higher household income (OR = 0.96, 95% CI 0.92 – 1.00, p < 0.031). Those who did not eat meat were more likely to choose a sustainable product (OR = 1.16, 95% CI 1.01 – 1.32, p < 0.033).
The models specified as sensitivity analyses with secondary outcomes all showed the same pattern of results (see Appendix C and Appendix D).
Table 2. Optimal model for primary outcome - more sustainable product chosen

Overt ordering and covert ordering are indicator variables of the experimental conditions, with the control random ordering as the reference level; the coefficients for Overt/Covert ordering show the difference between these conditions and Control random ordering.
3.3 Additional Analyses
There were also no effects of the intervention when we inspected for differences between different demographic groups or participants’ attitudes to sustainability. Putting interaction terms into the model for the primary outcome—allowing the terms for the intervention arms to interact with participants’ age, gender, higher education status, and their household income—found no statistically significant results. A model that contained interaction terms for the intervention arms and participants’ environmental concern and their reactance to nudges also found no statistically significant results.
Last, no differences were found between experimental arms in terms of participants’ normative attitudes towards buying sustainably. (See Figure 8 for the distribution of answers for each experimental arm.)
Figure 8: Histogram of normative attitudes towards shopping sustainably for each experimental arm

3.4 Exploratory Analyses
Since we did not find an effect of our interventions, we performed some exploratory analyses to try to explain why we did not find an effect (footnote 1).
We expected that the covert ordering would have an effect because automatic processes would lead consumers to choose positions that are more reachable and more salient. If this mechanism is at work, we would expect participants in the control (random ordering) and covert ordering arms to be more likely to select products that are positioned at the top of the vertical list. However, in the control (random ordering) arm, products in different positions on a page were chosen by participants with similar frequencies (see Figure 9), contradicting the assumption that people choose products in positions that are more reachable and more salient. Although in the covert and overt ordering arms, products in different positions were chosen by participants with different frequencies, the patterns varied across different product categories. Note that product positions in both the covert and overt ordering arms were determined by their sustainability ranking, meaning the same position represents the same product for these two arms. Thus, the similarity of patterns for a product category between these two arms could reflect the variance of preference for different products in a category shared by participants in both arms.
Figure 9: Frequency of choices by product position

None of the variables we manipulated or controlled for explained much of the variance in participants’ choices. To further explore what drives the purchasing decision, we ran a logistic regression model with product’s price, weight, and position to predict the characteristics that make a product more likely to be chosen in the random-ordering arm. (footnote 2)
Table 3. Factors affecting whether a product is chosen in control (random ordering) arm - more sustainable product chosen

* The reference level for position is Position 1; the coefficients for Positions 2-6 show the difference between these positions and Position 1.
Participants were more likely to select cheaper products (OR = 0.67, 95% CI 0.62 – 0.71, p < 0.001). Without the adjustment for multiple comparisons there was a statistically significant difference between position two and position one, as well as position two and position four (see Table 3 and Appendix Table 9). However, adjusting the p-value for multiple comparisons using Tukey’s correction (footnote 3), only the difference between position four and position two remained statistically significant, whereby the odds of choosing a product were lower when a product was in position 4 compared to position 2 (OR = 0.78, 95% CI 0.65 – 0.93, p < 0.001) (see Appendix Table 9 for the log odds estimates). However, the model accounted for 3.2% (conditional R2 = 0.032) of the variance in purchasing behaviour (pseudo-R2 value was calculated using the delta method, see Nakagawa et al., 2017), which suggests that product choices are affected largely by factors other than price, weight, and position that were not accounted for by our model. Looking more closely at the relationship between frequency of choices and the price rank of a product within its category (see Figure 10), products of the same price rank within a category were chosen with very different frequencies; while for product categories like pizza, the most expensive product was chosen most often, for other product categories like ice-cream, it was the cheapest product that was chosen most often. When we examined the probability of choosing a product and price variation in each product category, it became obvious that there were factors other than price that affected choices. For example, five snack products had the same price of £1.99 but two of them were chosen much more often; the most preferred pizza was the most expensive one in the category; and the two most expensive desserts were preferred to the two cheap desserts that were approximately half the price of the most expensive desserts.
Figure 10: Frequency of choices by price rank of product

We expected that the overt-ordering intervention would operate via participants noticing the ordering and consciously choosing products that are more sustainable; however, it seems that most participants did not notice. In our post-intervention questionnaire, only 19.5% of participants in the overt-ordering arm correctly answered that the products were listed in order of sustainability. The modal choice in all arms was the products were listed randomly. (See Figure 11 for the percentage of participants choosing each answer to this question for each experimental arm.) In overt ordering arm, participants who used a desktop were more likely to answer correctly that products were ordered by sustainability, with 34.2% answering correctly compared to 14.2% who used a mobile (OR = 0.32, 95% CI 0.21 – 0.49, p < 0.001) and 0.0% of those who used a tablet (see Appendix Table 11). In contrast there was no relationship between time spent on product choice pages and likelihood of choosing the correct option for the overt arm (OR = 1.00, 95% CI 1.00 – 1.00, p = 0.241).
Figure 11: Percentage of participants choosing each answer to the question about product ordering, split by experimental arm

We also did some exploratory analyses to probe possible influences on behaviour (all looking at interactions between the factors of interest and the three arms). We found no evidence that the interventions affected people differently depending on what device they were using (mobile vs tablet vs laptop); likewise, we found no evidence that interventions had a different effect depending on the total time spent on the product choice pages. Similarly, the way people thought that the products were ordered did not affect the interventions, for instance thinking that products were ordered by healthiness did not lead to different choices in the interventions than thinking that they were ordered by any of the other principles. However, when we look only at the participants in the overt arm, those who chose correctly that products were ordered by sustainability were more likely to choose a more sustainable product than participants in the overt arm who did not notice the sustainability ordering (OR = 1.24, 95% CI 1.04 – 1.49, p = 0.017) (footnote 4). Note that this was an exploratory analysis, so the result would need to be confirmed in further work.
-
The analyst was unblinded about the treatment assignment at this point as the pre-registered analysis had been completed and the extra analyses required knowledge of treatment assignment to help understand the results.
-
This analysis does not work for the covert and overt ordering arms because position was fixed for products and thus confounded with other product characteristics.
-
Multiple comparisons increase the likelihood of false positives (Type I error); therefore corrections are needed.
-
In the covert arm, those who chose products were ordered by sustainability were also more likely to choose a more sustainable product although not significantly (OR = 1.25, 95% CI 0.85-1.82, p = 0.252)