English Cymraeg
Testing the impact of overt and covert ordering interventions on sustainable consumption choices: a randomised controlled trial

Testing ordering interventions: Appendix D Additional Tables and Figures

Additional tables and figures relevant to the project.

Last updated: 12 September 2023

Table 4. Baseline demographic characteristics

The first column shows the 'mean completion time' in the third row, 'ethnic group' from the fifth to ninth row, 'gender' from the eleventh to fourteenth row, 'age' in the sixteenth row, 'education' from the eighteenth to twenty-fifth row, 'total household income' from the twenty-eighth to the thirty-eighth row, 'online shopping frequency' from the fortieth to the forty-fourth row, 'eat meat' in the forty-sixth and forty-seventh row, and finally 'device' from the forty-ninth to fifty-first row.  The second cThe first column shows the 'mean completion time' in the third row, 'ethnic group' from the fifth to ninth row, 'gender' from the eleventh to fourteenth row, 'age' in the sixteenth row, 'education' from the eighteenth to twenty-fifth row, 'total household income' from the twenty-eighth to the thirty-eighth row, 'online shopping frequency' from the fortieth to the forty-fourth row, 'eat meat' in the forty-sixth and forty-seventh row, and finally 'device' from the forty-ninth to fifty-first row.  The second cThe first column shows the 'mean completion time' in the third row, 'ethnic group' from the fifth to ninth row, 'gender' from the eleventh to fourteenth row, 'age' in the sixteenth row, 'education' from the eighteenth to twenty-fifth row, 'total household income' from the twenty-eighth to the thirty-eighth row, 'online shopping frequency' from the fortieth to the forty-fourth row, 'eat meat' in the forty-sixth and forty-seventh row, and finally 'device' from the forty-ninth to fifty-first row.  The second cThe first column shows the 'mean completion time' in the third row, 'ethnic group' from the fifth to ninth row, 'gender' from the eleventh to fourteenth row, 'age' in the sixteenth row, 'education' from the eighteenth to twenty-fifth row, 'total household income' from the twenty-eighth to the thirty-eighth row, 'online shopping frequency' from the fortieth to the forty-fourth row, 'eat meat' in the forty-sixth and forty-seventh row, and finally 'device' from the forty-ninth to fifty-first row.  The second c

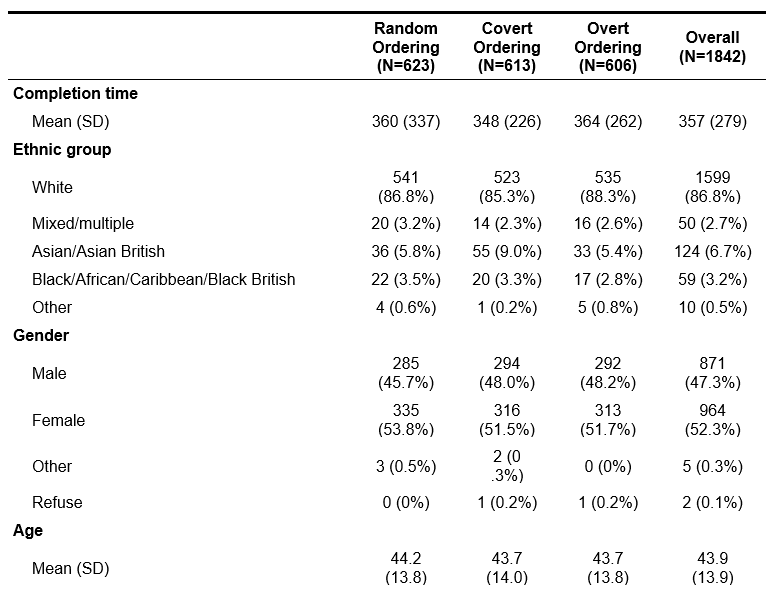
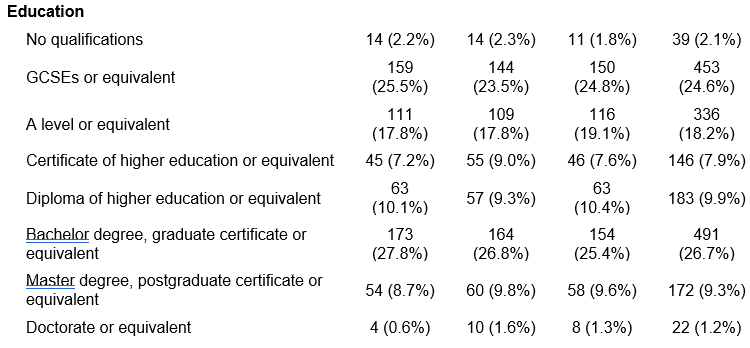
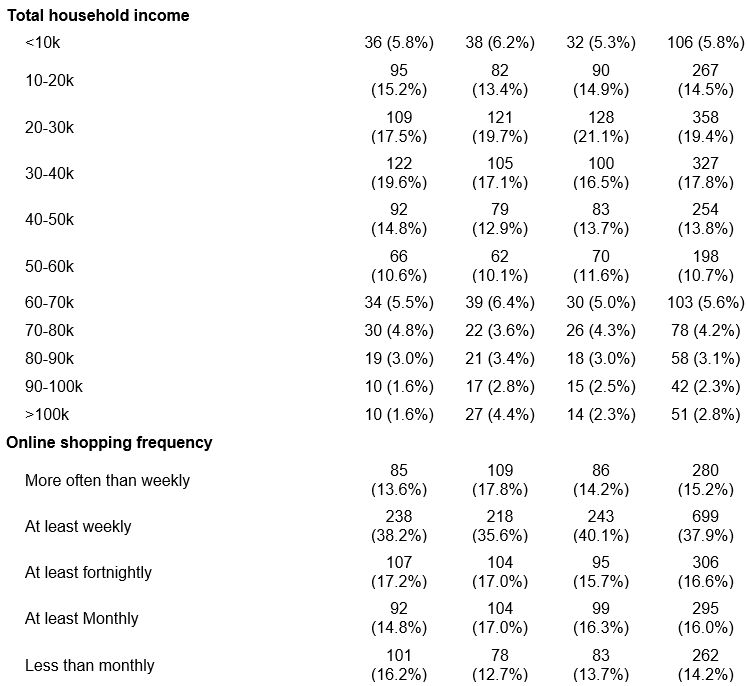
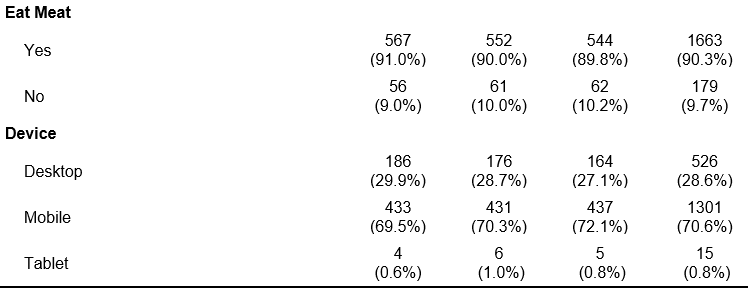
Table 5. Summary of secondary outcomes

The first column shows the 'most sustainable product chosen' from the third to the fourth row. The first column shows the 'sustainable rank of chosen product' from the sixth to the eleventh row. The first column shows the 'number of sustainable product chosen' from the fourteenth to the twentieth row. The first column shows the 'number of most sustainable product chosen from the twenty-second to the twenty-fourth row and from the twenty-sixth to the twenty-ninth row.  The second column shows the number (and

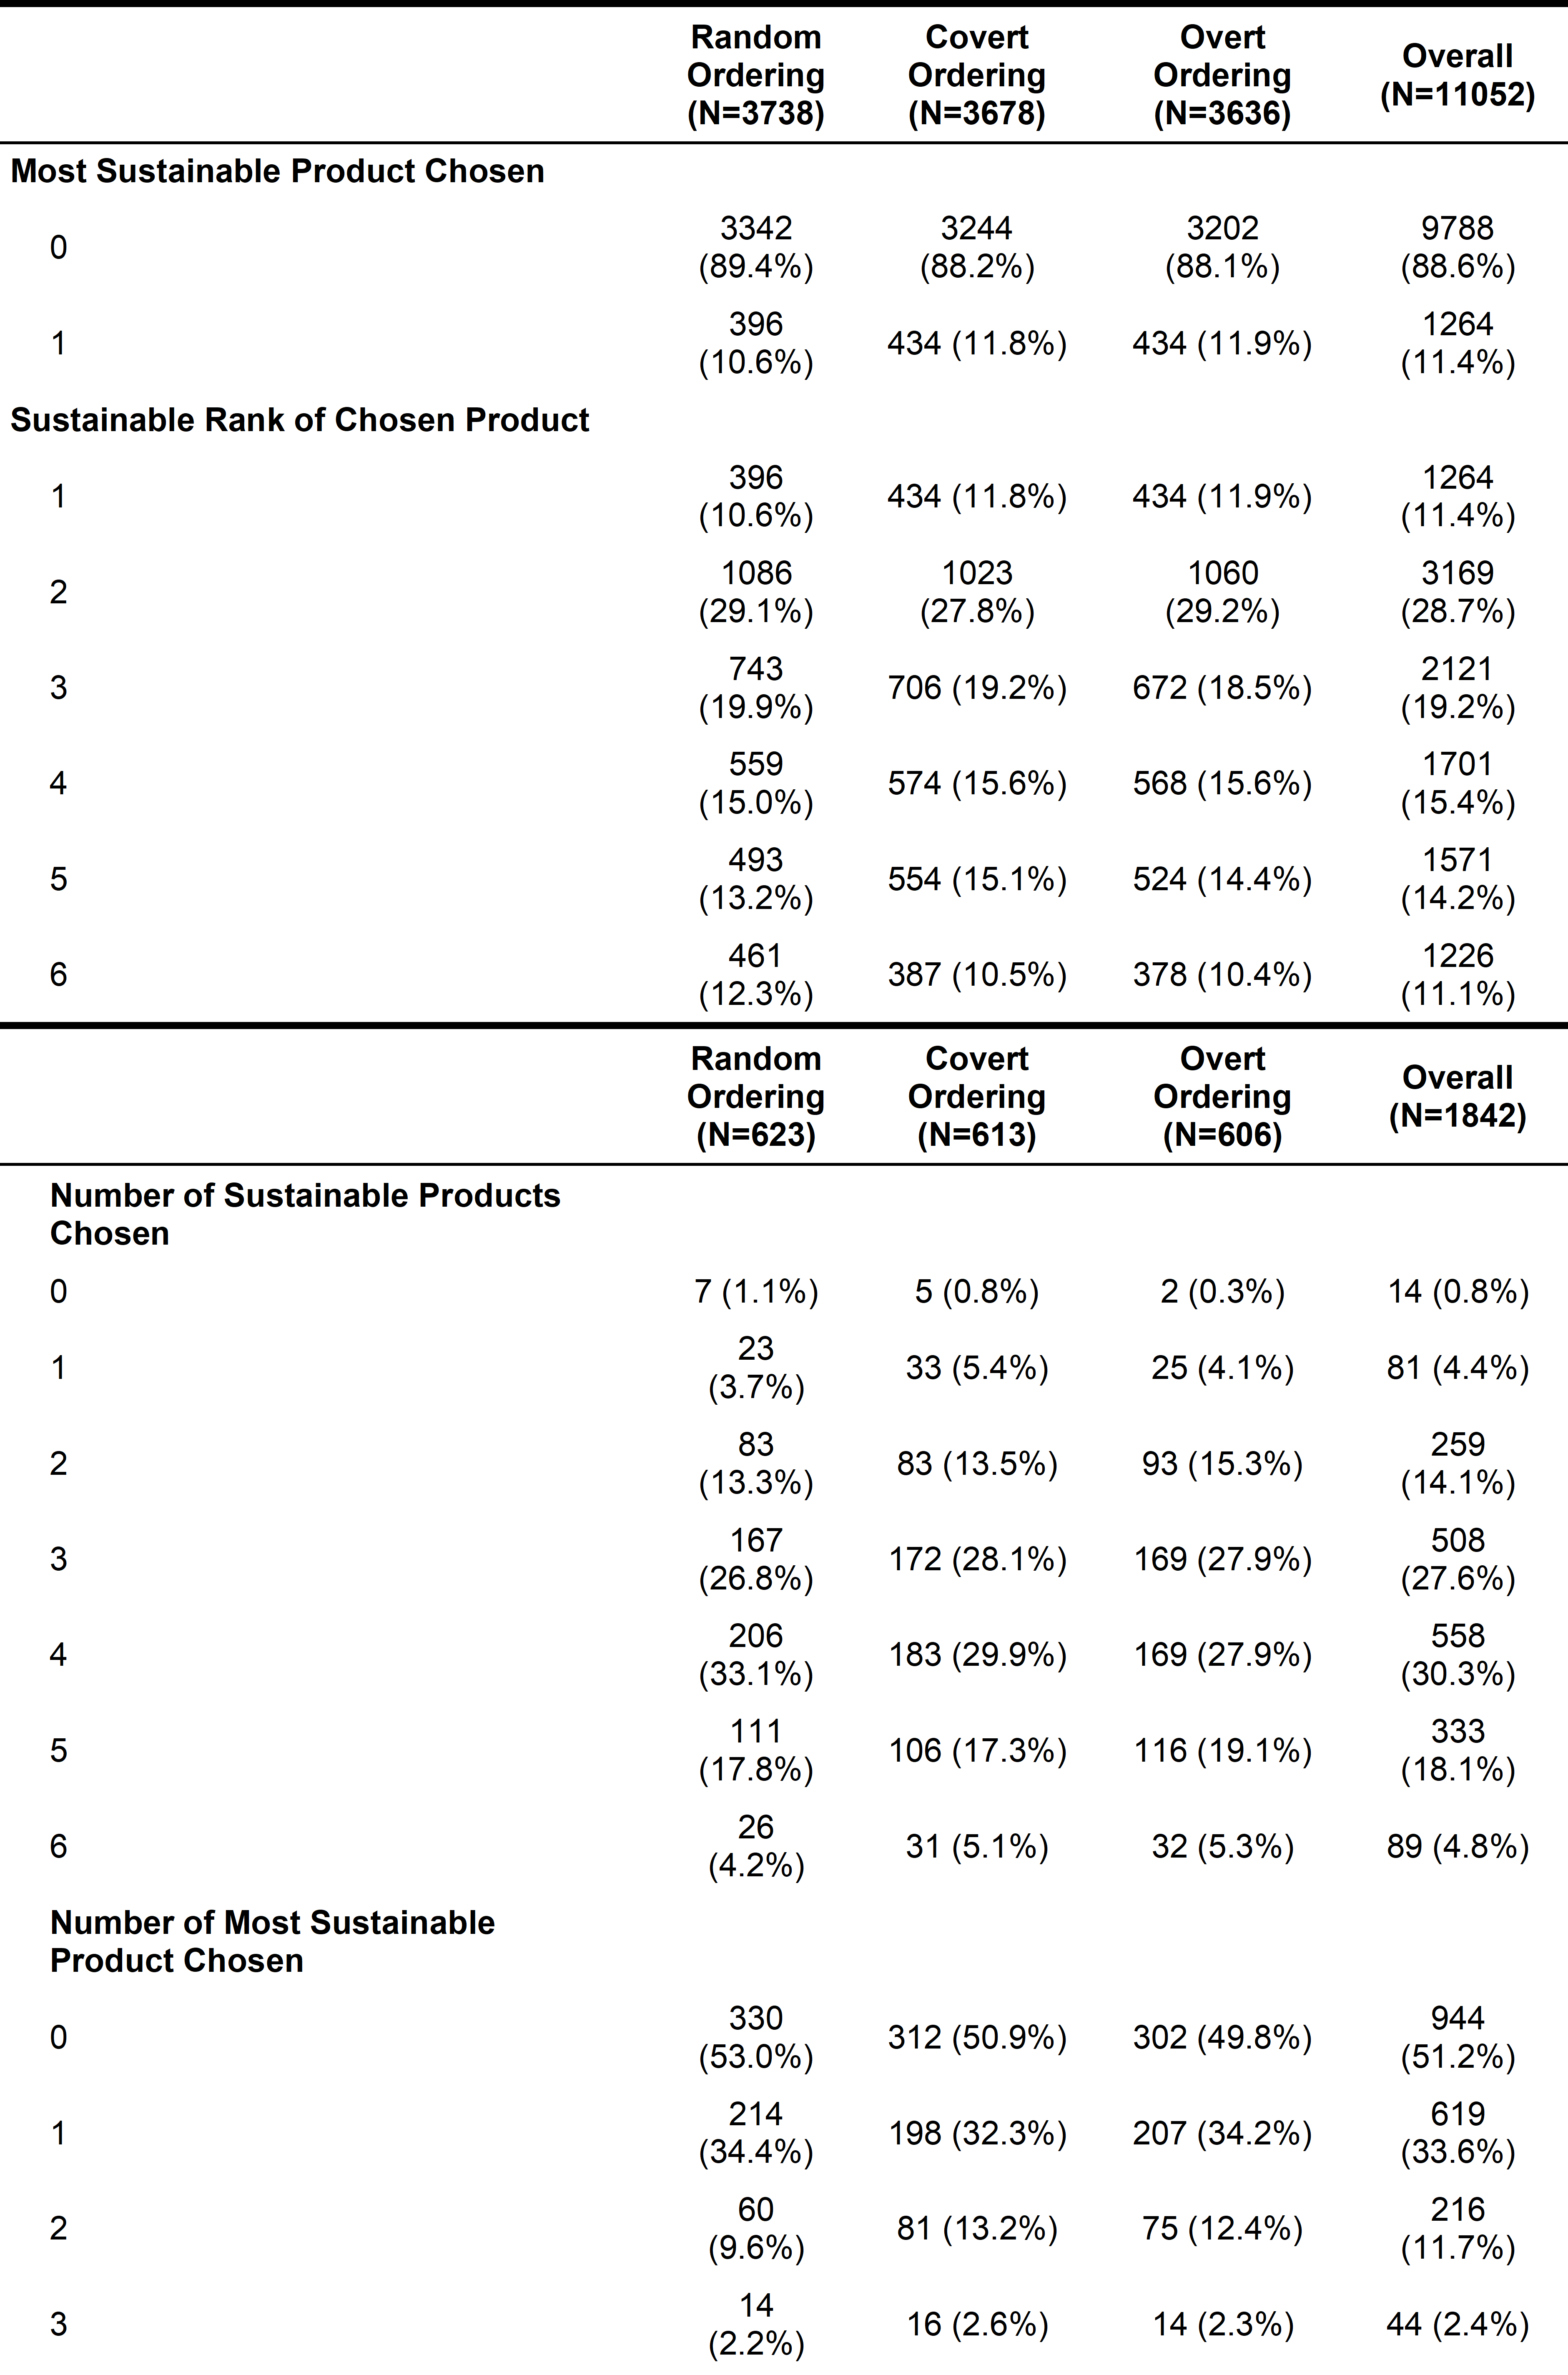
Table 6. Basic model with all potential covariates

Predictors are shown in the first column and span from the third row to the sixteenth row. ‘More sustainable product chosen’ spans from the second to the fourth columns. Estimates, confidence intervals and p-values for the likelihood of choosing sustainable products are shown in the second, third and fourth columns respectively.

Table 7. Optimal model for first secondary outcome

Predictors are shown in the first column and span from the third row to the ninth row. ‘Most sustainable product chosen’ spans from the second to the fourth columns. Estimates, confidence intervals and p-values for likelihood of choosing sustainable products are shown in the second, third and fourth columns respectively.

* Overt ordering and covert ordering are indicator variables of the experimental conditions, with the control random ordering as the reference level; the coefficients for Overt/Covert ordering show the difference between these conditions and Control random ordering.

Table 8. Optimal model for second secondary outcome

Predictors are shown in the first column and span from the third row to the twentieth row. ‘Sustainable rank of product chosen’ spans from the second to the fourth columns and covers estimates, confidence intervals and p-values for likelihood of choosing of sustainable products which are shown in the second, third and fourth columns respectively.

* The coefficients of intercepts show the differences in baseline odds ratios of choosing a product that has a sustainability rank of 2 versus 1, 3 versus 2, 4 versus 3, 5 versus 4, and 6 versus 5. Overt ordering and covert ordering are indicator variables of the experimental conditions, with the control random ordering as the reference level; the coefficients for Overt/Covert ordering show the difference between these conditions and Control random ordering.

Table 9. Multiple comparison of position effects with Tukey’s correction
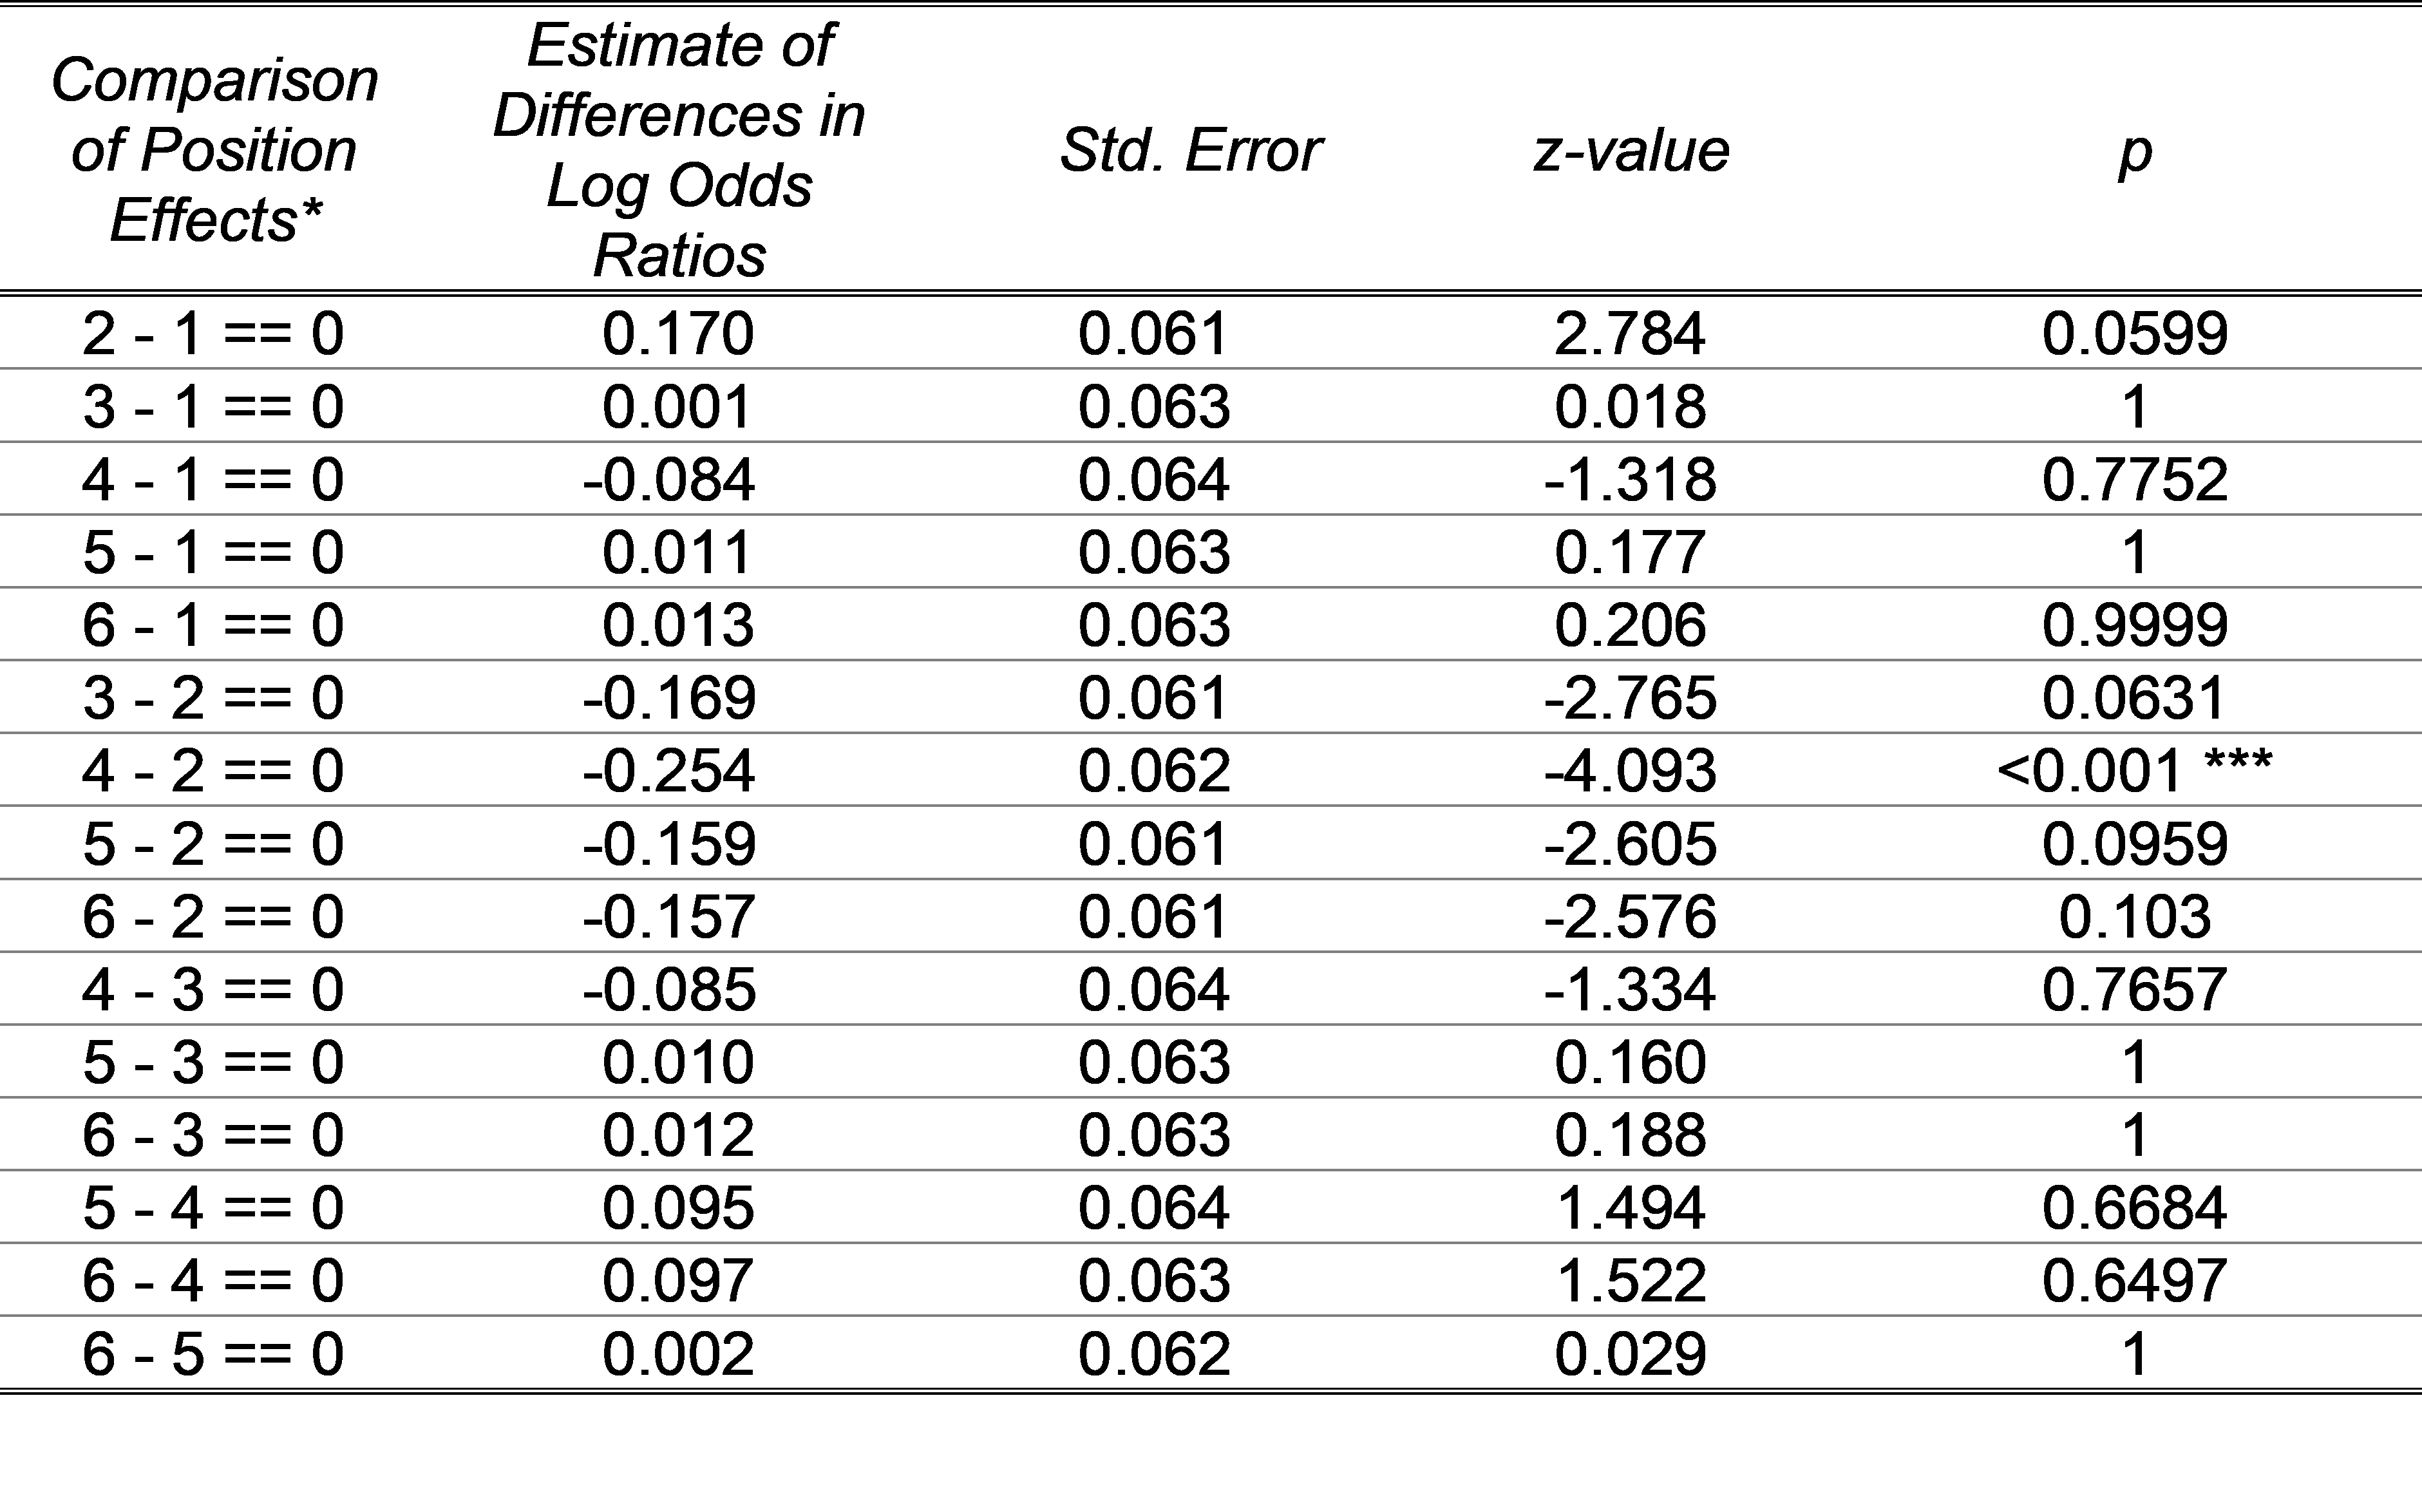
Table showing results
Comparison of Position Effects(footnote) Estimate of Differences in Log Odds Ratios Std. Error z-value p
2 - 1 == 0 0.170 0.061 2.784 0.0599
3 - 1 == 0 0.001 0.063 0.018 1
4 - 1 == 0 -0.084 0.064 -1.318 0.7752
5 - 1 == 0 0.011 0.063 0.177 1
6 - 1 == 0 0.013 0.063 0.206 0.9999
3 - 2 == 0 -0.169 0.061 -2.765 0.0631
4 - 2 == 0 -0.254 0.062 -4.093 <0.001 ***
5 - 2 == 0 -0.159 0.061 -2.605 0.0959
6 - 2 == 0 -0.157 0.061 -2.576 0.103
4 - 3 == 0 -0.085 0.064 -1.334 0.7657
5 - 3 == 0 0.010 0.063 0.160 1
6 - 3 == 0 0.012 0.063 0.188 1
5 - 4 == 0 0.095 0.064 1.494 0.6684
6 - 4 == 0 0.097 0.063 1.522 0.6497
6 - 5 == 0 0.002 0.062 0.029 1

*Each row tests a null hypothesis that the probability of being chosen does not differ for the two positions, e.g. 2 - 1 == 0 tests the hypothesis that Position 2 does not differ from Position 1

Table 10. Responses to attitudinal questions in questionnaire

The first column shows attitudinal scores for 'environmental concern' from the third to ninth row, 'reactance to nudge' from the eleventh to seventeenth row, and 'normative attitude to shopping sustainably' from the nineteenth to twenty-fifth row.   The second column shows the number and percentage of responses in the random ordering condition, the third column shows the number and percentage of responses in the covert ordering condition, the fourth column shows the number and percentage of responses in the

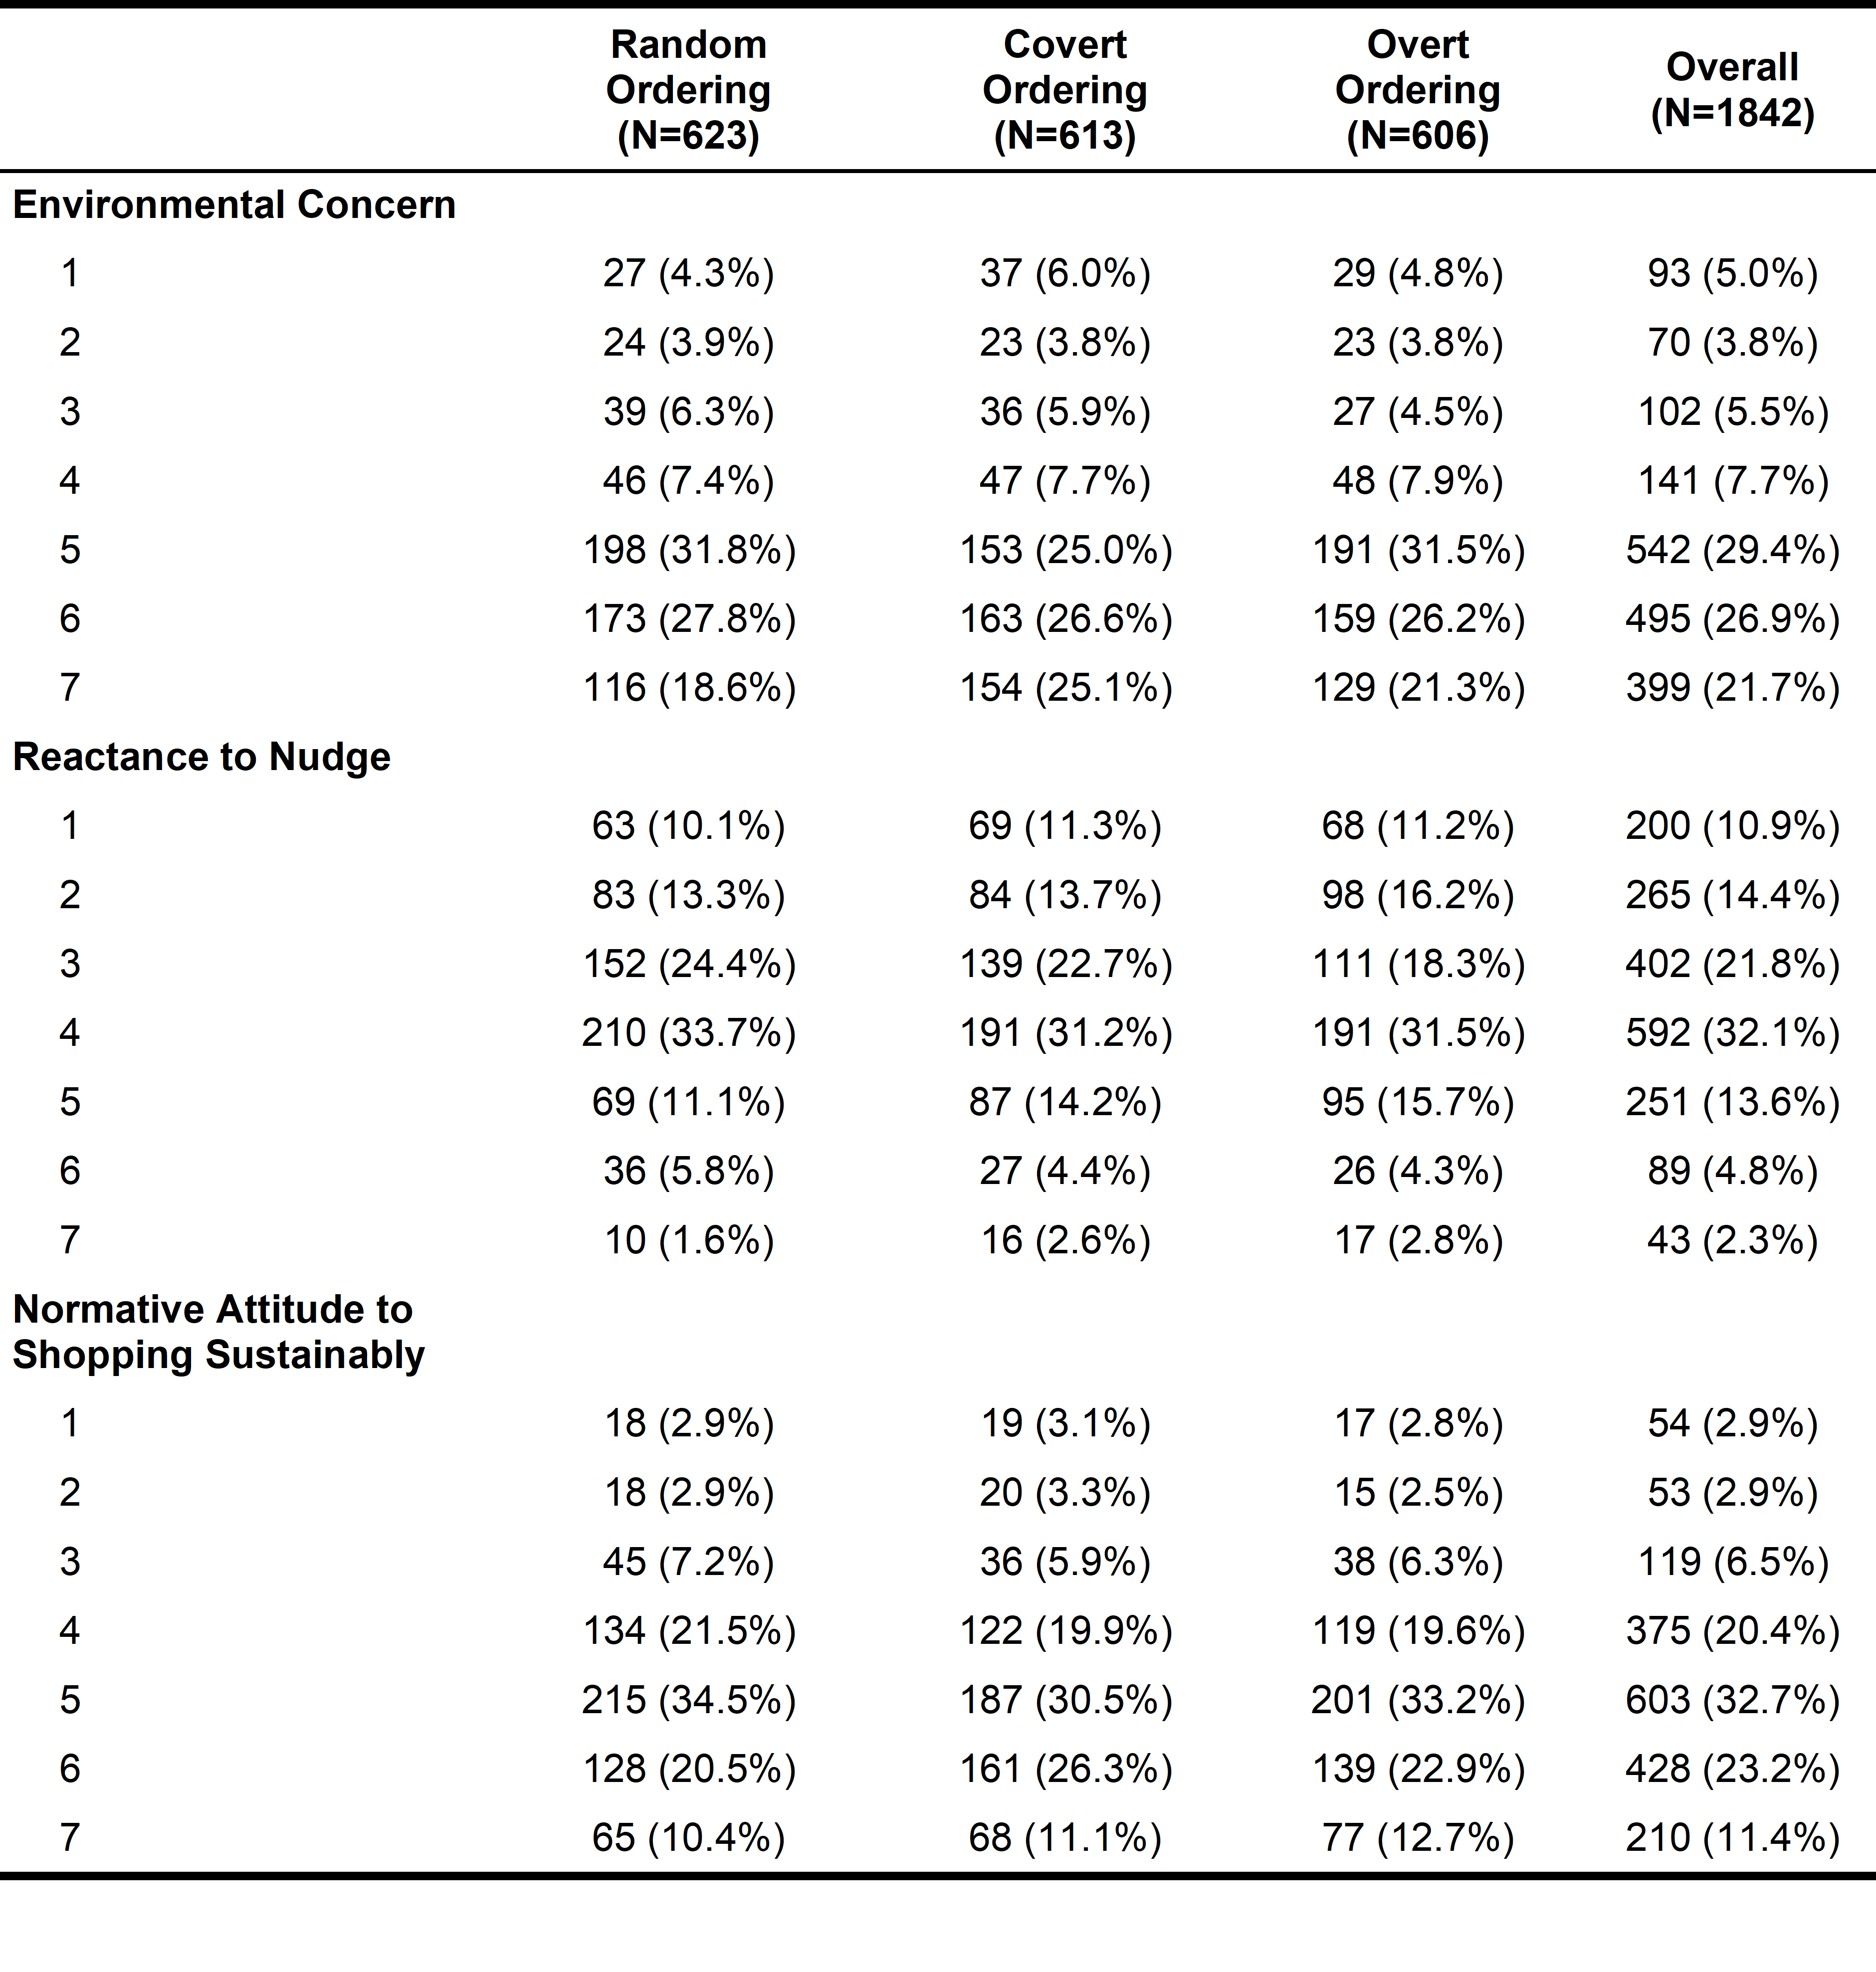
Table 11. Percentage of participants choosing each answer to the question about the product ordering in the overt arm, split by device
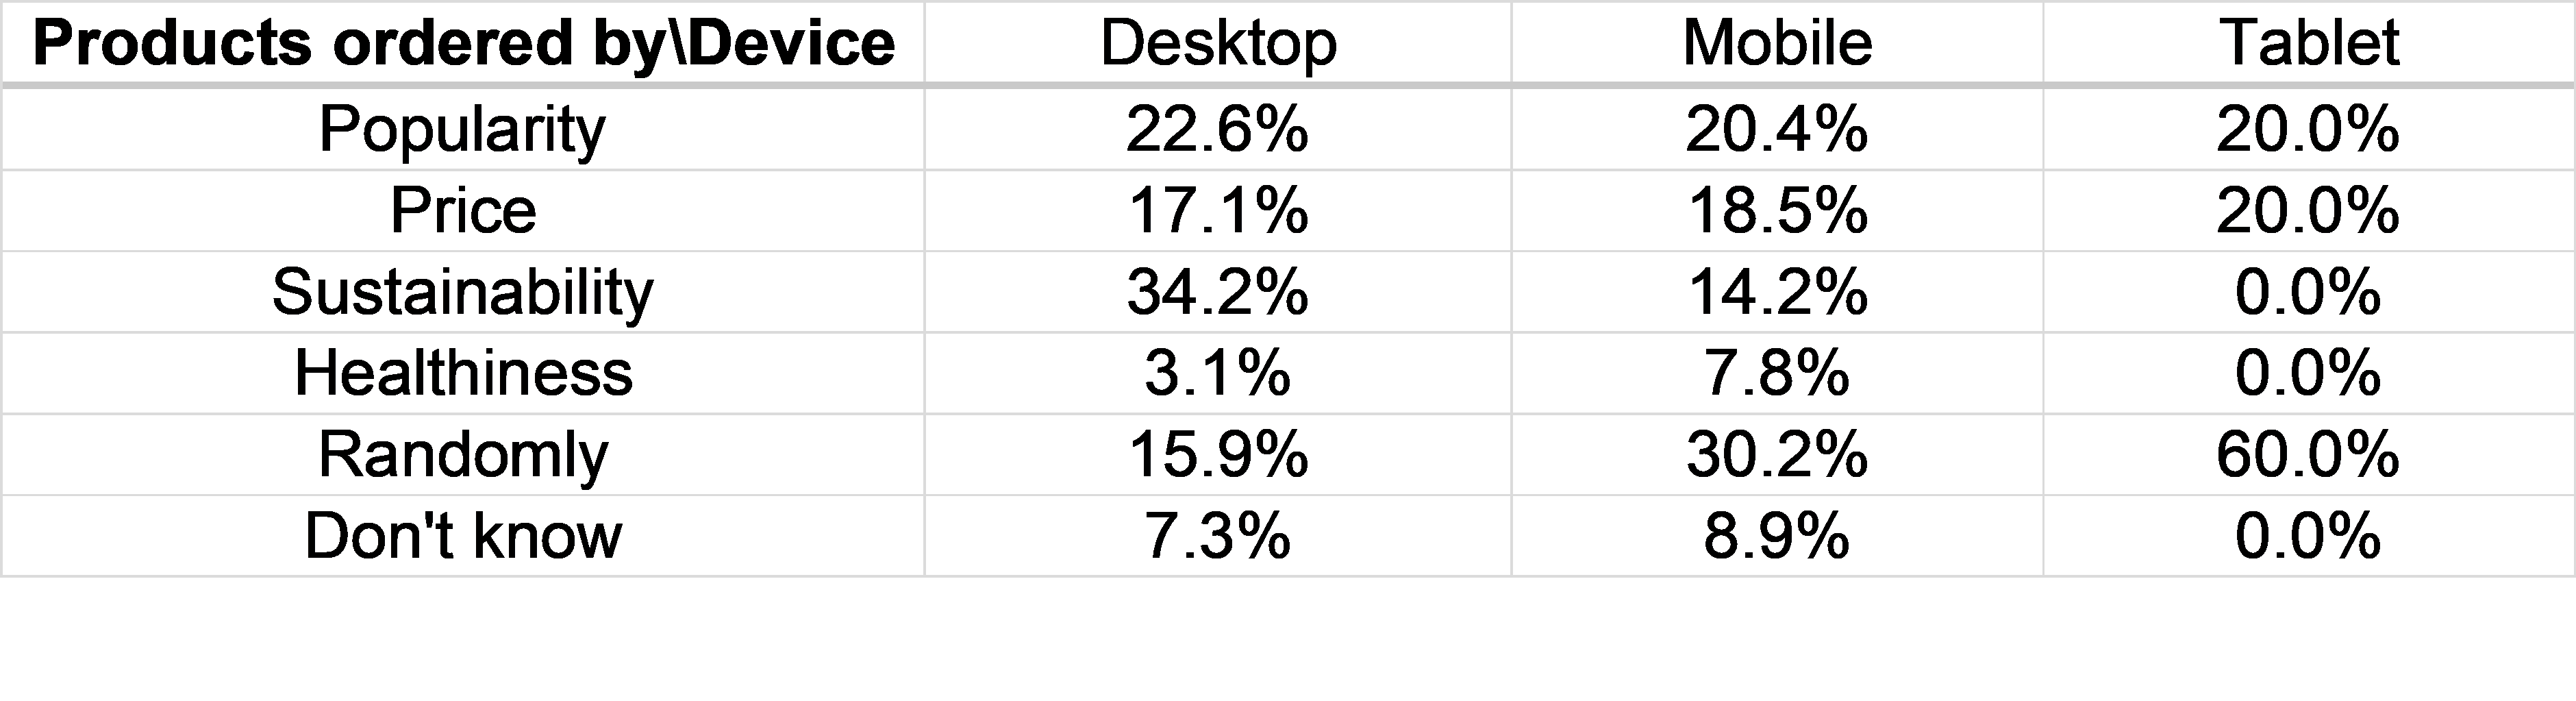
Table showing results

Products ordered by/ Device Desktop Mobile Tablet
Popularity 22.6% 20.4% 20.0%
Price 17.1% 18.5% 20.0%
Sustainability 34.2% 14.2% 0.0%
Healthiness 3.1% 7.8% 0.0%
Randomly 15.9% 30.2% 60.0%
Don't know 7.3% 8.9% 0.0%