Testing the impact of overt and covert ordering interventions on sustainable consumption choices: a randomised controlled trial
Testing ordering interventions: Methods
An explanation of the methods used in the project and the outcomes.
2.1 Trial design
An online experiment was conducted with a three-arm between-subjects design. Participants were randomly assigned with equal probability to one of the three arms: control (random ordering), covert (sustainability) ordering, overt (sustainability) ordering. Participants were asked to shop for a meal for two, making six product choices (one product from each of the six product categories), in a simulated online supermarket environment, given a budget for shopping high enough to cover the cost of selecting the most expensive products on the list. The products were chosen from the range available in the online grocery store of a major retailer. To incentivise participants to choose their most preferred products and to ensure that they were price sensitive, as price is the most influential driver of shopping behaviour (Osman & Jenkins, 2021), participants were given the option to enter a prize draw where 10 randomly chosen participants would get a delivery of the items that they chose plus any change from the budget.
In the control (random ordering) arm, products in each product category were randomly ordered. The random order was generated by the computer program for each participant independently, and for each product category independently. In the covert ordering arm, products in each product category were listed in the order of most sustainable to least sustainable, but no information about this ordering was given to the participants. In the overt ordering arm, products in each product category were listed in the order of most sustainable to least sustainable, and a statement was shown in a box at the top of each product category page to reveal this ordering to participants (see Figure 4 and Figure 6). The statement said “The products on this page have been ordered from the most environmentally sustainable to the least environmentally sustainable. This is to make it easier for you to choose a more sustainable product if you wish.”. Other than these differences, the three experimental arms were the same (footnote 1).
The sustainability rank of products in each category was based on the data provided by the web browser extension Envirofy (Shakeri & McCallum, 2021). Envirofy calculates the carbon footprint of products by adding the CO2 emitted during production, transportation, and packaging of the product. The web browser extension gave the calculated CO2 for products in the online grocery store of a major retailer. We used it to generate an ordered product list from lowest to highest carbon footprint, which was implemented for the covert ordering and overt ordering experimental arms.
2.2 Participants and Randomisation
The target population for this trial was online grocery shoppers who are aged over 18 in England, Wales, and Northern Ireland (Scotland was excluded as it is not covered by the FSA). As no official statistics were available on the specific demographic breakdown of online grocery shoppers in the targeted areas, we used quotas plus screening questions to get a sample close to a representative sample of the target group. Firstly, demographic and geographical quotas (see Table 1) based on the population estimates for England, Wales and Northern Ireland were imposed. Secondly, potential participants were asked about their frequency of online grocery shopping as one of the qualification questions (along with demographic questions to implement quotas) and those who chose “never” to the question were excluded.
Participants were recruited through the online panel provider Lucid. Multiple quality checks were embedded in the experiment including checking for consistency of responses to equivalent questions, unusual or implausible answers to certain questions, completion time that was unreasonably short, or whether same response was given to a block of questions. Participants who failed the quality checks were removed from the final sample. The panel provider sent out new invites to potential participants in batches until the planned sample size was reached. Participants were paid the standard panel provider points for completing the experiment conditional on passing the quality checks.
Table 1. Sampling quotas
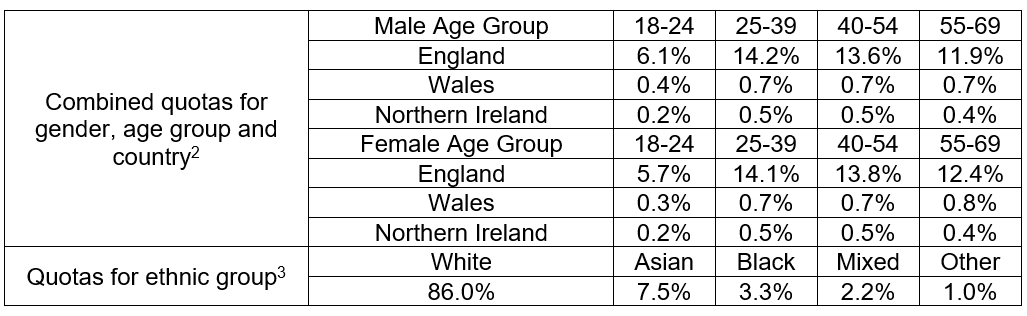
The quotas for age, gender and location come from ONS mid-2020 population estimates, the age, gender and location quotas are based on population aged 18-69 in England, Wales and Northern Ireland.
The quotas for ethnic group come from 2011 Census data and are based on population of all ages in England, Wales and Northern Ireland, as ethnic data for population aged 18-69 is not available.
Participants who passed the qualification stage were randomly allocated with equal probability to one of the three experimental arms. A simple randomization process was used as, with large sample sizes, the samples are usually very similar and balanced across experimental arms. A computer algorithm embedded in the experimental program was used to generate and implement the random allocation sequence to allocate participants recruited to experimental arms.
2.3 Procedure
The experiment involved a simulated online grocery shopping task where participants shopped for six food products for dinner for two in a simulated online supermarket environment. This task was chosen because it allowed a variety of product categories within a familiar and realistic shopping activity. Each participant was given a budget of £30 at the start of the experiment and was introduced to the task. The budget was set to be high enough that it was not possible to exceed the budget with any possible combination of product choices and participants were informed about this at the start. Participants were also informed that they could choose to enter a prize draw where 10 randomly chosen participants would get a delivery of the items that they chose plus any change from the budget. All products used in the experiment were chosen from the range available in the online grocery store of a major retailer; the picture, information and price associated with each product were obtained from the online grocery store as well.
There were six product categories: snack, soup, pizza, dessert, ice-cream, and tea, which were chosen to fit the shopping task. We were also subject to the constraints that there needed to be a range of products of comparable popularity and price, enough non-supermarket-own-label products in a product category, and the products within a category needed to have enough variation in terms of the carbon footprint data provided by Envirofy. Each product category was on a separate page. In the introduction screen, participants were informed about the six product categories and that they would be shown in random order. The product category pages looked like a generic online supermarket interface with products in a category listed in a single column as the main content of the page, which mimicked the way that they would look on a mobile device (footnote 2). An icon of the basket was shown with a number indicating the total price of the products in the basket, which was updated as the content of the basket changes. The layout of the six pages did not differ except for the product-related information. The order of the six pages was randomized for all participants independently. See Figure 3, Figure 4, Figure 5 and Figure 6 for screenshots of the simulated online supermarket.
Figure 3: Screenshot of a product category page in the simulated online supermarket for covert ordering arm, as it looked on a desktop

Figure 4: Screenshot of a product category page in the simulated online supermarket for overt ordering arm, as it looked on a desktop

Figure 5: Screenshot of a product category page in the simulated online supermarket for control (random ordering) arm, as it looked on a mobile phone

There were six products within each product category (See Appendix B for the lists of products). Products in each category were chosen based on the following procedure: 1) products were searched using the name of the product category as a keyword in a real online supermarket environment; 2) chosen products had to differ in terms of names and descriptions from each other but be of similar sizes/weights and enough for serving two people; 3) any supermarket own-label products were avoided to make the simulated online supermarket generic (footnote 3). A picture, a name with brief description (including size/weight), and a price was displayed for each product, as on a real online supermarket shopping page. There was a button to add the product to the basket, which would become a button to remove the product once a product was added. Only one product from each category could be added to the basket. Product choices could be changed while participants stayed on the page but could not be modified once they proceeded to the next page. Participants were informed about this on the introduction page and was reminded about this on each product category page.
Figure 6: Screenshot of a product category page in the simulated online supermarket for overt ordering arm, as it looked on a mobile phone

After participants completed the product choices for the six categories, they were shown the products they had chosen along with the remaining budget and were reminded about the possibility of entering the prize draw. Then they were asked to complete a questionnaire. The first question was a manipulation check, about their awareness of the intervention. Participants were asked, “In the task you just completed, how were the products on each screen ordered?” and given multiple choice from the following answers: by popularity, by price, by sustainability, by healthiness, randomly, don’t know. Then participants were asked about their environmental concern, attitudes towards nudges, normative attitudes towards shopping sustainably, whether they eat meat, and demographics (age, gender, education, income) were asked (see Appendix A for the questionnaire).
The experiment could be completed on a computer, mobile, or tablet, subject to participants’ preference. During the experiment, the computer program automatically recorded the type of the device participants used to complete the experiment, the time spent on each page, and any random order generated. The company DecTech was commissioned to script and administer the online experiment.
No personnel interacted directly with the participants during the trial period as it was an online experiment. Participants in the control (random ordering) and covert ordering arm were blinded to their treatment arm. Participants in the overt ordering arm knew about the intervention but did not know what the other treatment arms were. The experiment was designed to let the participants in the overt ordering arm know about the treatment, as the research question was whether knowing about the treatment changes the treatment effect. The study data was labelled by someone other than the person conducting data analysis without revealing how participants corresponded to the treatment arms, to ensure the analyst was blinded to the treatment assignments.
2.4 Outcomes
The primary outcome of the study was a binary variable indicating whether a more sustainable product was chosen or not at the product category level. It took a value of 1 if the chosen product was one of the three most sustainable products in the category according to the Envirofy ranking, and equalled 0 if the chosen product was one of the three least sustainable products. We decided to use a binary variable as the primary outcome variable instead of the ordinal variable because using an ordinal variable as the dependent variable would require an ordinal regression model and additional assumptions would have to be made, such as the proportional odds assumptions, which might not be met. There are also greater risks of non-convergence when estimating an ordinal regression model with complicated random effects structure. (However, note that we did run ordinal regression models, treating the outcome variable as ordinal, as part of our sensitivity analysis). A cut-off had to be selected to transform the ordinal variable to binary; without a strong reason to choose a particular cut-off, we chose the middle point. The chosen primary outcome represents the likelihood of choosing the three more sustainable products in a category, which is a meaningful result to show for the interventions, as we expected a general shift towards more sustainable products.
It is also possible to use the total carbon footprint of all the six chosen products in the basket as an outcome measure, as Koutoukidis et al. (2019) did. There are two main reasons we decided not to follow this approach: Firstly, this measure would be sensitive to the carbon footprint measures of certain products and certain categories. For example, if two desserts happen to have a very big gap in terms of their carbon footprint compared to the differences between other products, the entire outcome can be driven by the choices between these two desserts. Using outcomes based on the sustainability rank instead of the actual carbon footprint number can help with this issue, making the results more generalisable. This is especially important in the sustainability case, relative to healthiness, given the controversy over how environmental impact should be calculated, and we do not want the results to be very sensitive to the numbers given by the particular sustainability measure we have chosen. Secondly, using the total carbon footprint aggregates over the different product categories and would not allow us to generalise the results to other product categories. The advantage of having different/multiple product categories is that the outcome will not rely on a particular product category or the specific product categories chosen. We would be able to model how the outcome variables and the treatment effects vary across different product categories by including random effects, which enables us to estimate a treatment effect on the outcome variable generalisable to a randomly selected product category (which can be none of the six particular categories chosen in the experiment because we are using them as a “sample” of all possible product categories to estimate a distribution). When we aggregate over different product categories, the information given by the variability across different product categories is lost so we cannot model the variability across product categories and cannot estimate a treatment effect that can be generalised to a randomly selected product category.
There were three secondary outcomes which are alternative forms of the primary outcome, including a binary variable of whether the participant chose the most sustainable product and an ordinal outcome variable that indicates the rank of sustainability of the product chosen in each category. These were used for sensitivity checks, which are described in Appendix C.
2.5 Sample size
The target sample size was 1800 participants completing the whole experiment and passing the quality checks, with around 600 participants in each experimental arm. 2100 participants were targeted to complete the experiment to allow for up to 15% to be cleaned out due to failure of quality checks.
We chose our target sample size based on a power simulation, run using a logistic regression model with the primary outcome variable and random intercepts for participants and product categories, using the Bonferroni-corrected cut-off threshold p < 0.025 to determine whether the results were significantly different from those expected if the two null hypotheses were correct. We had a power of 0.999 to detect a difference of 8%, and a power of 0.843 to detect a difference of 5% assuming relatively low variability of individual and product category random effects (standard deviation being 0.693 and 0.203), between the covert ordering arm and control (random ordering) arm (which is in line with the range of effect sizes found in the literature). Details of power simulations, with the different scenarios considered, can be found in the OSF preregistration (https://osf.io/ehd2j).
2.6 Data Diagnostics
Participants who did not complete the whole experiment or failed the quality checks were excluded from the final sample for data analysis as described in the participants’ section. There was no other post-data collection exclusion of participants. There was no missing data for any of the variables used in the data analyses. Outliers are not a concern given the nature of the outcome variables.
2.7 Statistical Methods
The main model for testing the two hypotheses was a generalised linear mixed model with logistic link function given a binary primary outcome. The basic specification of the model is given in Appendix C. The statistical programming language R (R Core Team, 2021) and the development environment RStudio (RStudio Team, 2021) Version 2021.9.1.372 were used to perform the data analysis.
2.8 Ethics and Registration
Ethics approval was obtained for this trial from LSE Research ethics committee (Ref: 57054). This study and the data analysis plan were preregistered on Open Science Framework (https://osf.io/ehd2j) before trial launch and any data collection. The full trial protocol can also be accessed via the Open Science Framework preregistration.
-
Given six products in each category, there are 6*5*4*3*2*1=720 possible orderings for a product category, and the sustainability ordering will be 1 out of the 720 possibilities. Therefore, for the majority in the control (random ordering) arm, the ordering will be different from the treatment arms. We did not exclude ex ante the possibility of randomly generating an ordering that happens to be the same as the sustainability ordering in treatment arms for the control (random ordering) arm because we want the ordering in the control (random ordering) arm to be truly random, which gives us a clear interpretation of any effects found.
-
[1] Note that the layout of product lists varies across devices for real online supermarkets, usually with a single column vertical list layout like the one in this study for mobile phones, but a 4-column grid layout for wider screens. The study standardised the layout for all device types in order to get a clean effect of sustainability ordering and to maximise the power of the study given limited budget and sample size. If the layout were allowed to vary across device types, it would be difficult to interpret the results as it is not completely clear what the equivalent of top of the list position is for a grid layout, and device type would confound layout format. However, since the effect of the ordering intervention might differ depending on the layout and screen type, caution needs to be taken when generalizing the findings of this study.
-
We chose to include six products in each product category because this study focuses on ordering of products, namely the position effects, and six products should give enough variation in terms of position of products (see Bar-Hillel (2015), Dayan & Bar-Hillel (2011) and Schmidtke et al. (2019) for research studying position effects with similar number of products in a category). Products in different positions are predicted to be chosen with different probabilities based on the assumption that individuals pay more attention to certain positions on a page. This is different from the “above-the-fold” effect, which concerns the extra effort involved in scrolling down a page. Given a fixed budget, there is a trade-off between the number of products in each category and the number of categories. Increasing the number of product categories can help increase the power given a fixed sample size, while increasing the number in a category will not. Therefore, we settled with six products per category with six categories, given the budget available.
Revision log
Published: 23 February 2023
Last updated: 4 May 2023