Impacts of Food Hypersensitivities on Quality of Life in the UK and Willingness to Pay (WTP) to remove those impacts
Appendix I. Sample Descriptives: EQ5D and EQ-VAS
How the impact of food hypersensitivity was captured.
The impact of living with a food hypersensitivity, and hence the gain to be valued if it was removed, was captured using three approaches:
1. EQ-5D
Respondents scored their (child’s) health using EQ-5D at the time of the survey and how they imagined it would be if the FHS was removed.
2. Visual Analogue Scale (VAS)
Respondents scored their (child’s) health using EQ-VAS at the time of the survey and how they imagined it would be if the FHS was removed.
3. Condition-specific measures (FAQLQ, FIQLQ, or CDQ) for adults and children
This appendix covers the first two approaches. EQ-VAS Condition-specific measures. FAQLQ, FIQLQ, and CDQ are covered in Appendix K of the report, for adults and children.
Adult results: EQ5D-5L and EQ-VAS
Table 1 reports the mean utility score representing the health of the adult respondents estimated from the EQ5D-5L. These utility scores were generated from the levels for each completed EQ5D shown in Appendix J.
Table 1. Summary statistics for the calculated utility score from EQ5D-5L for adults
| - | Mean | Std. Dev. | N | Min | p25 | Median | p75 | Max |
|---|---|---|---|---|---|---|---|---|
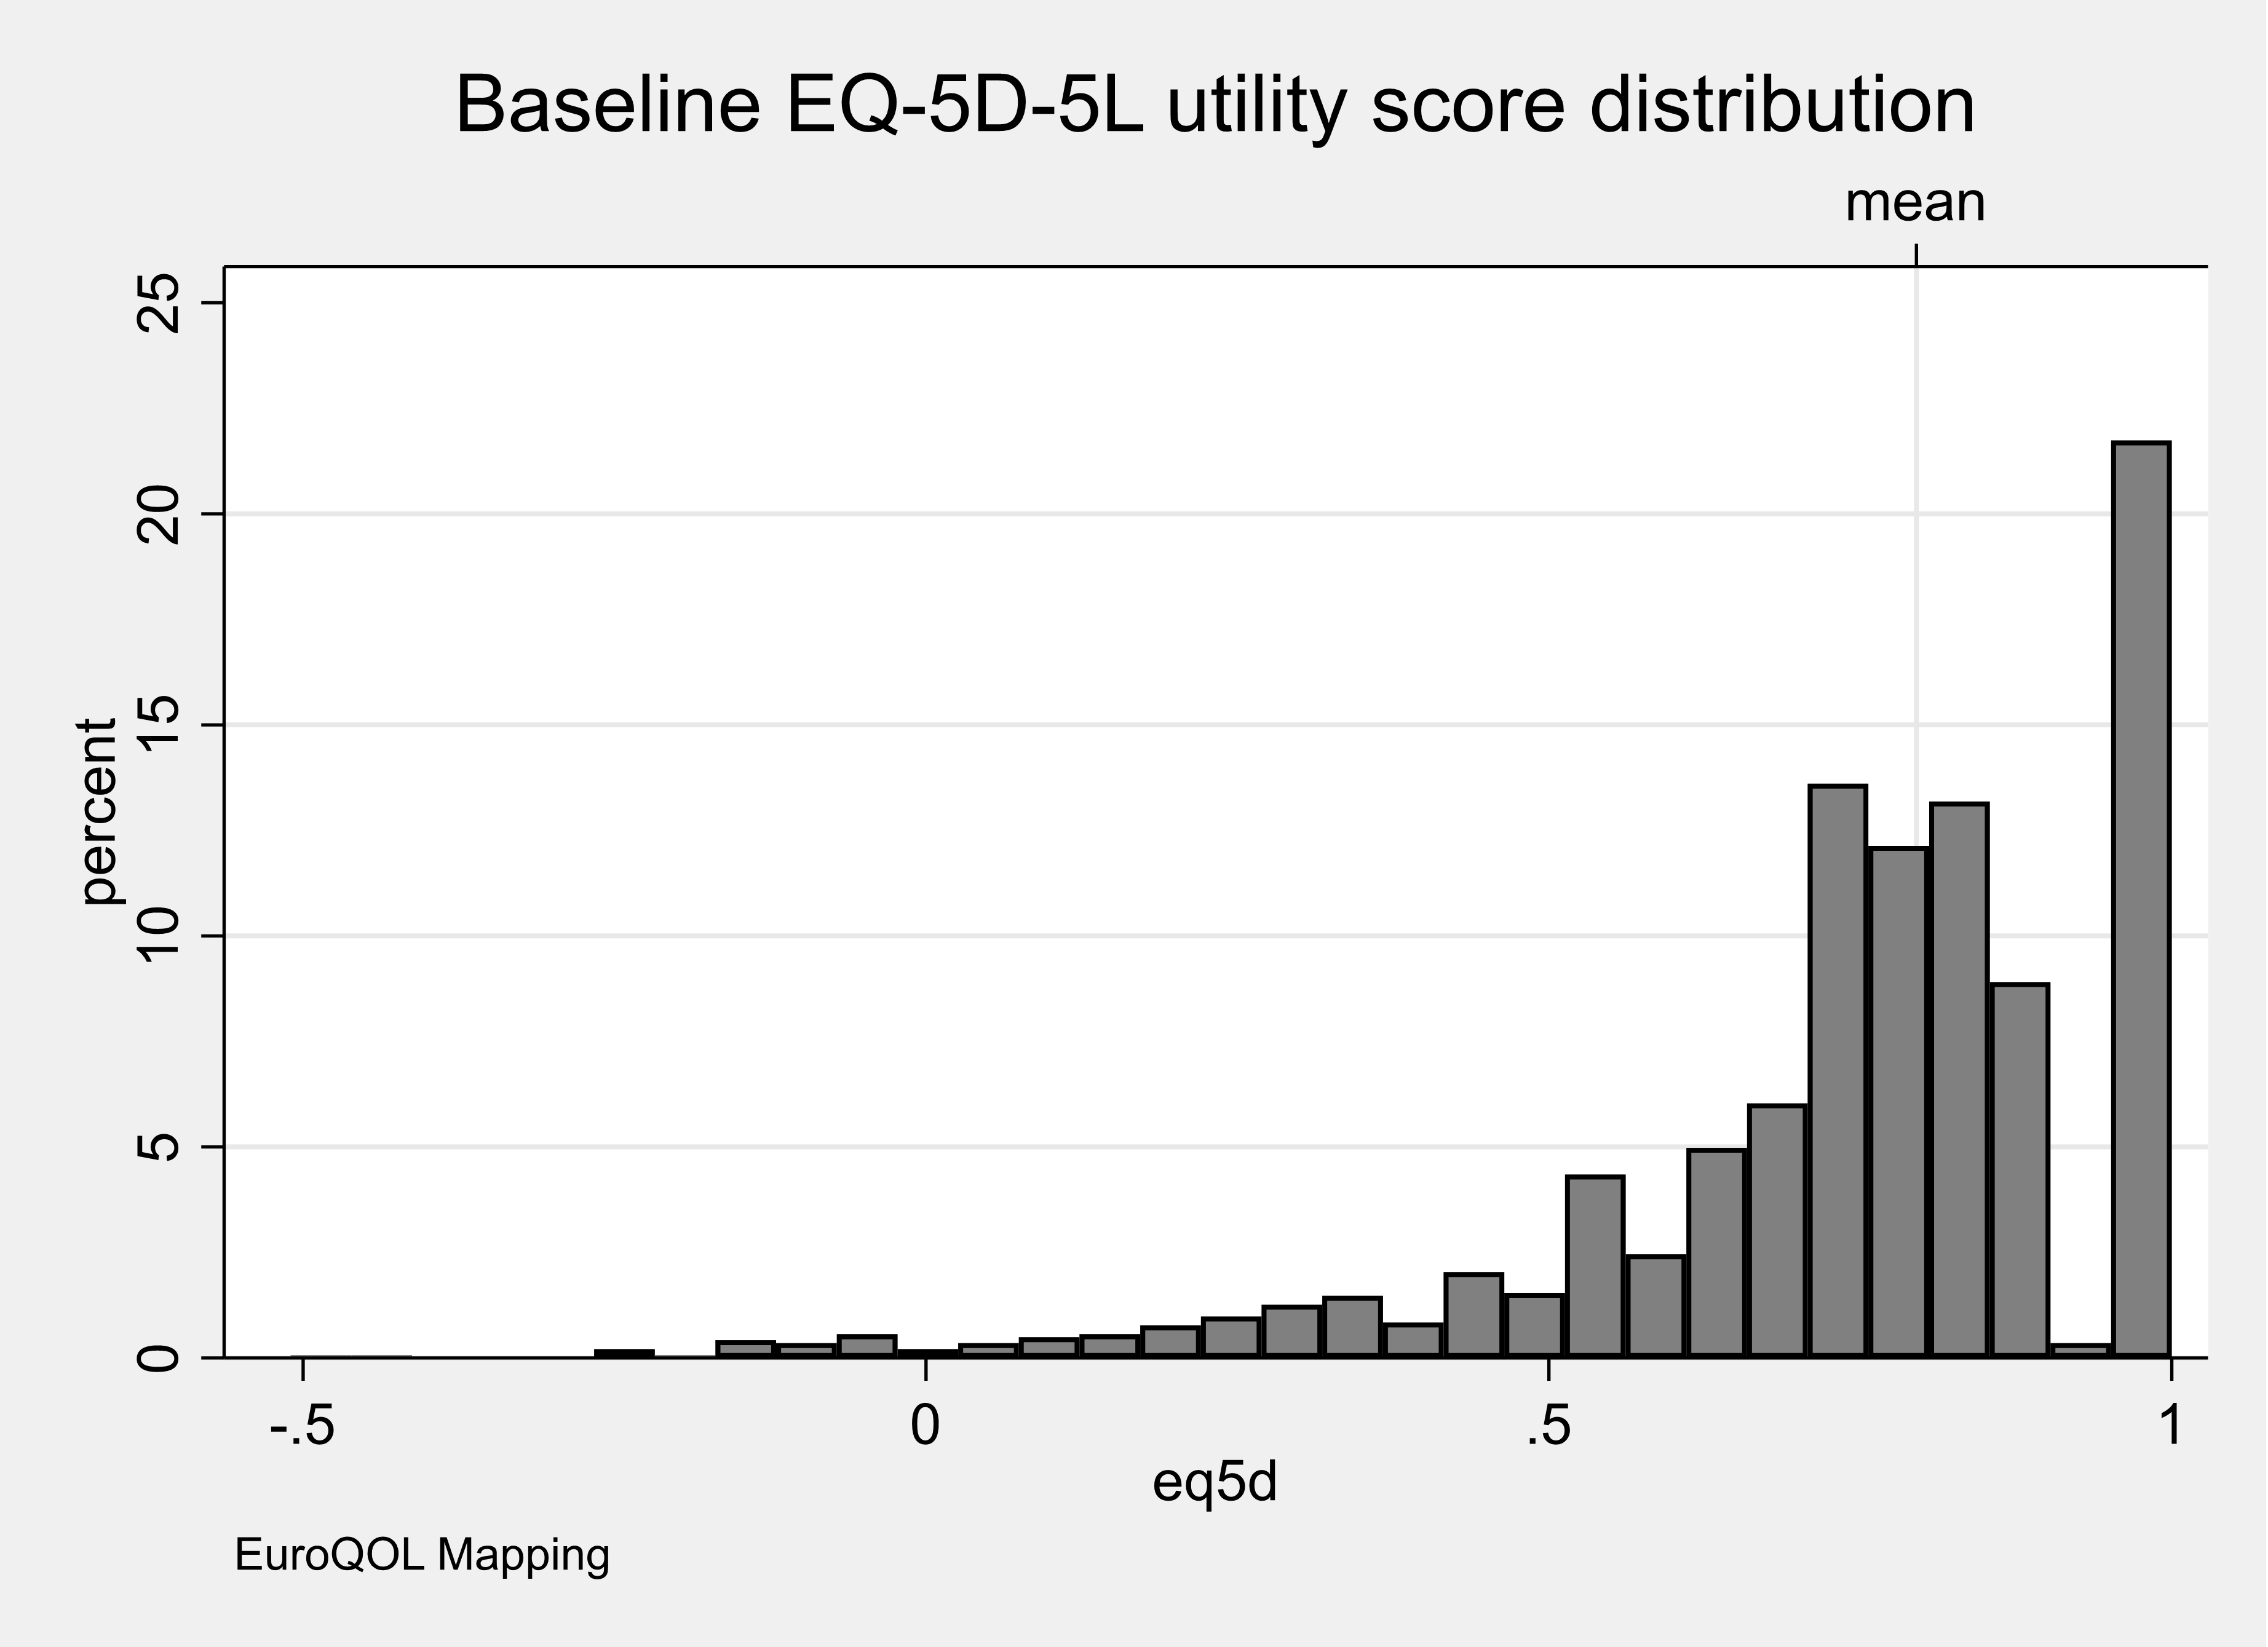
| EQ5D index | 0.74 | .24 | 1426 | -.51 | .66 | .77 | .88 | 1 |
Figure 1 shows the distribution of the utility scores for the population of adult respondents. This Figure shows that over one-fifth of adult respondents rated their health to be ‘perfect’ (score 1) despite living with a food hypersensitivity. Table 3 and Figure 1 in Appendix J show how the observed EQ5D levels compared with those values from the UK population.
Accepted published values representing the ‘population normal’ scores for each of the domains for the EQ5D-5 level and total utility score are not available for the UK [https://euroqol.org/eq-5d-instruments/eq-5d-5l-about ]. In Appendix J, Figure 1 we show an illustrative comparison using data from Feng et al (2015) that reports some exemplar data from 996 respondents that completed the EQ5D-5 level as part of the original valuation study [Devlin et al (2018)]. Comparing the data we observed from the population of adults living with a food hypersensitivity with the EQ5D-5L domain scores from Feng (2015) shows that, in general, a lower proportion of adults scored ‘level one’ (no problems) on the EQ5D-5L (representing perfect health). In the adult population with a food hypersensitivity, a higher proportion scored ‘level two’ (slight problems) and a similar proportion scored ‘level five’ (unable to perform a function or in the extreme in terms of anxiety/depression or pain/discomfort) using the EQ5D-5L compared with the reported population norms from Feng and colleagues.
Devlin et al (2018) has published a population level value set for the five-level version of EQ5D use in England but an independent review has meant that national decision-making bodies such as NICE recommend against its use. This recommendation means that there is no publically available set of data to allow a direct comparison of population norms of EQ5D-5 level utility scores in an adult population with a population living with a food hypersensitivity. There are population form data available for the EQ5D-3L, which contains the same domains (mobility, self-care, usual activities, pain/discomfort, anxiety/depression) but measured using a three-level rather than five-level scale for each domain [Svende et al (2014)]. Using a country-specific valuation exercise the population average value of health status is 0.855. This value compares to 0.74 in an adult population living with a food hypersensitivity that suggests they are living at a lower level of health status. Looking at the EQ-VAS rating scale, for the UK population the score (using a scale of 0 to 100) is 82.8 for people aged between 45 and 54 years. This compares to a value of 69.4 for the adult population living with a food hypersensitivity.
Figure 1. Distribution of utility scores representing the current health of adult
Respondents were asked to identify the food hypersensitivity that had the most substantial impact on them. Table 2 reports the mean utility score representing the health of the respondents estimated from the EQ5D-5L for each category of food hypersensitivity. These utility scores were generated from the levels for each completed EQ5D shown in Appendix J.
Table 2. Summary statistics for the calculated utility score from EQ5D-5L for adults for the worst or only food hypersensitivity
| Only or Worst condition | mean | sd | N | min | p25 | Median | p75 | Max |
|---|---|---|---|---|---|---|---|---|
| Coeliac Disease | 0.8 | .18 | 601 | -.44 | .73 | .8 | .91 | 1 |
| Food Allergy | 0.73 | .25 | 385 | -.51 | .63 | .77 | .88 | 1 |
| Food Intolerance | 0.68 | .27 | 440 | -.22 | .58 | .74 | .84 | 1 |
Figure 2 shows the distribution of the utility scores for the population of adult respondents for each category of food hypersensitivity for the worst condition only. This Figure shows that over one-fifth of adult respondents living with a food allergy or coeliac disease rated their health to be ‘perfect’ despite living with a food hypersensitivity. In contrast, only around 15% of adult respondents rated their health to be ‘perfect’ if they were living with food intolerance.
Figure 2. Distribution of utility scores representing the current health of adults for the worst or only food hypersensitivity
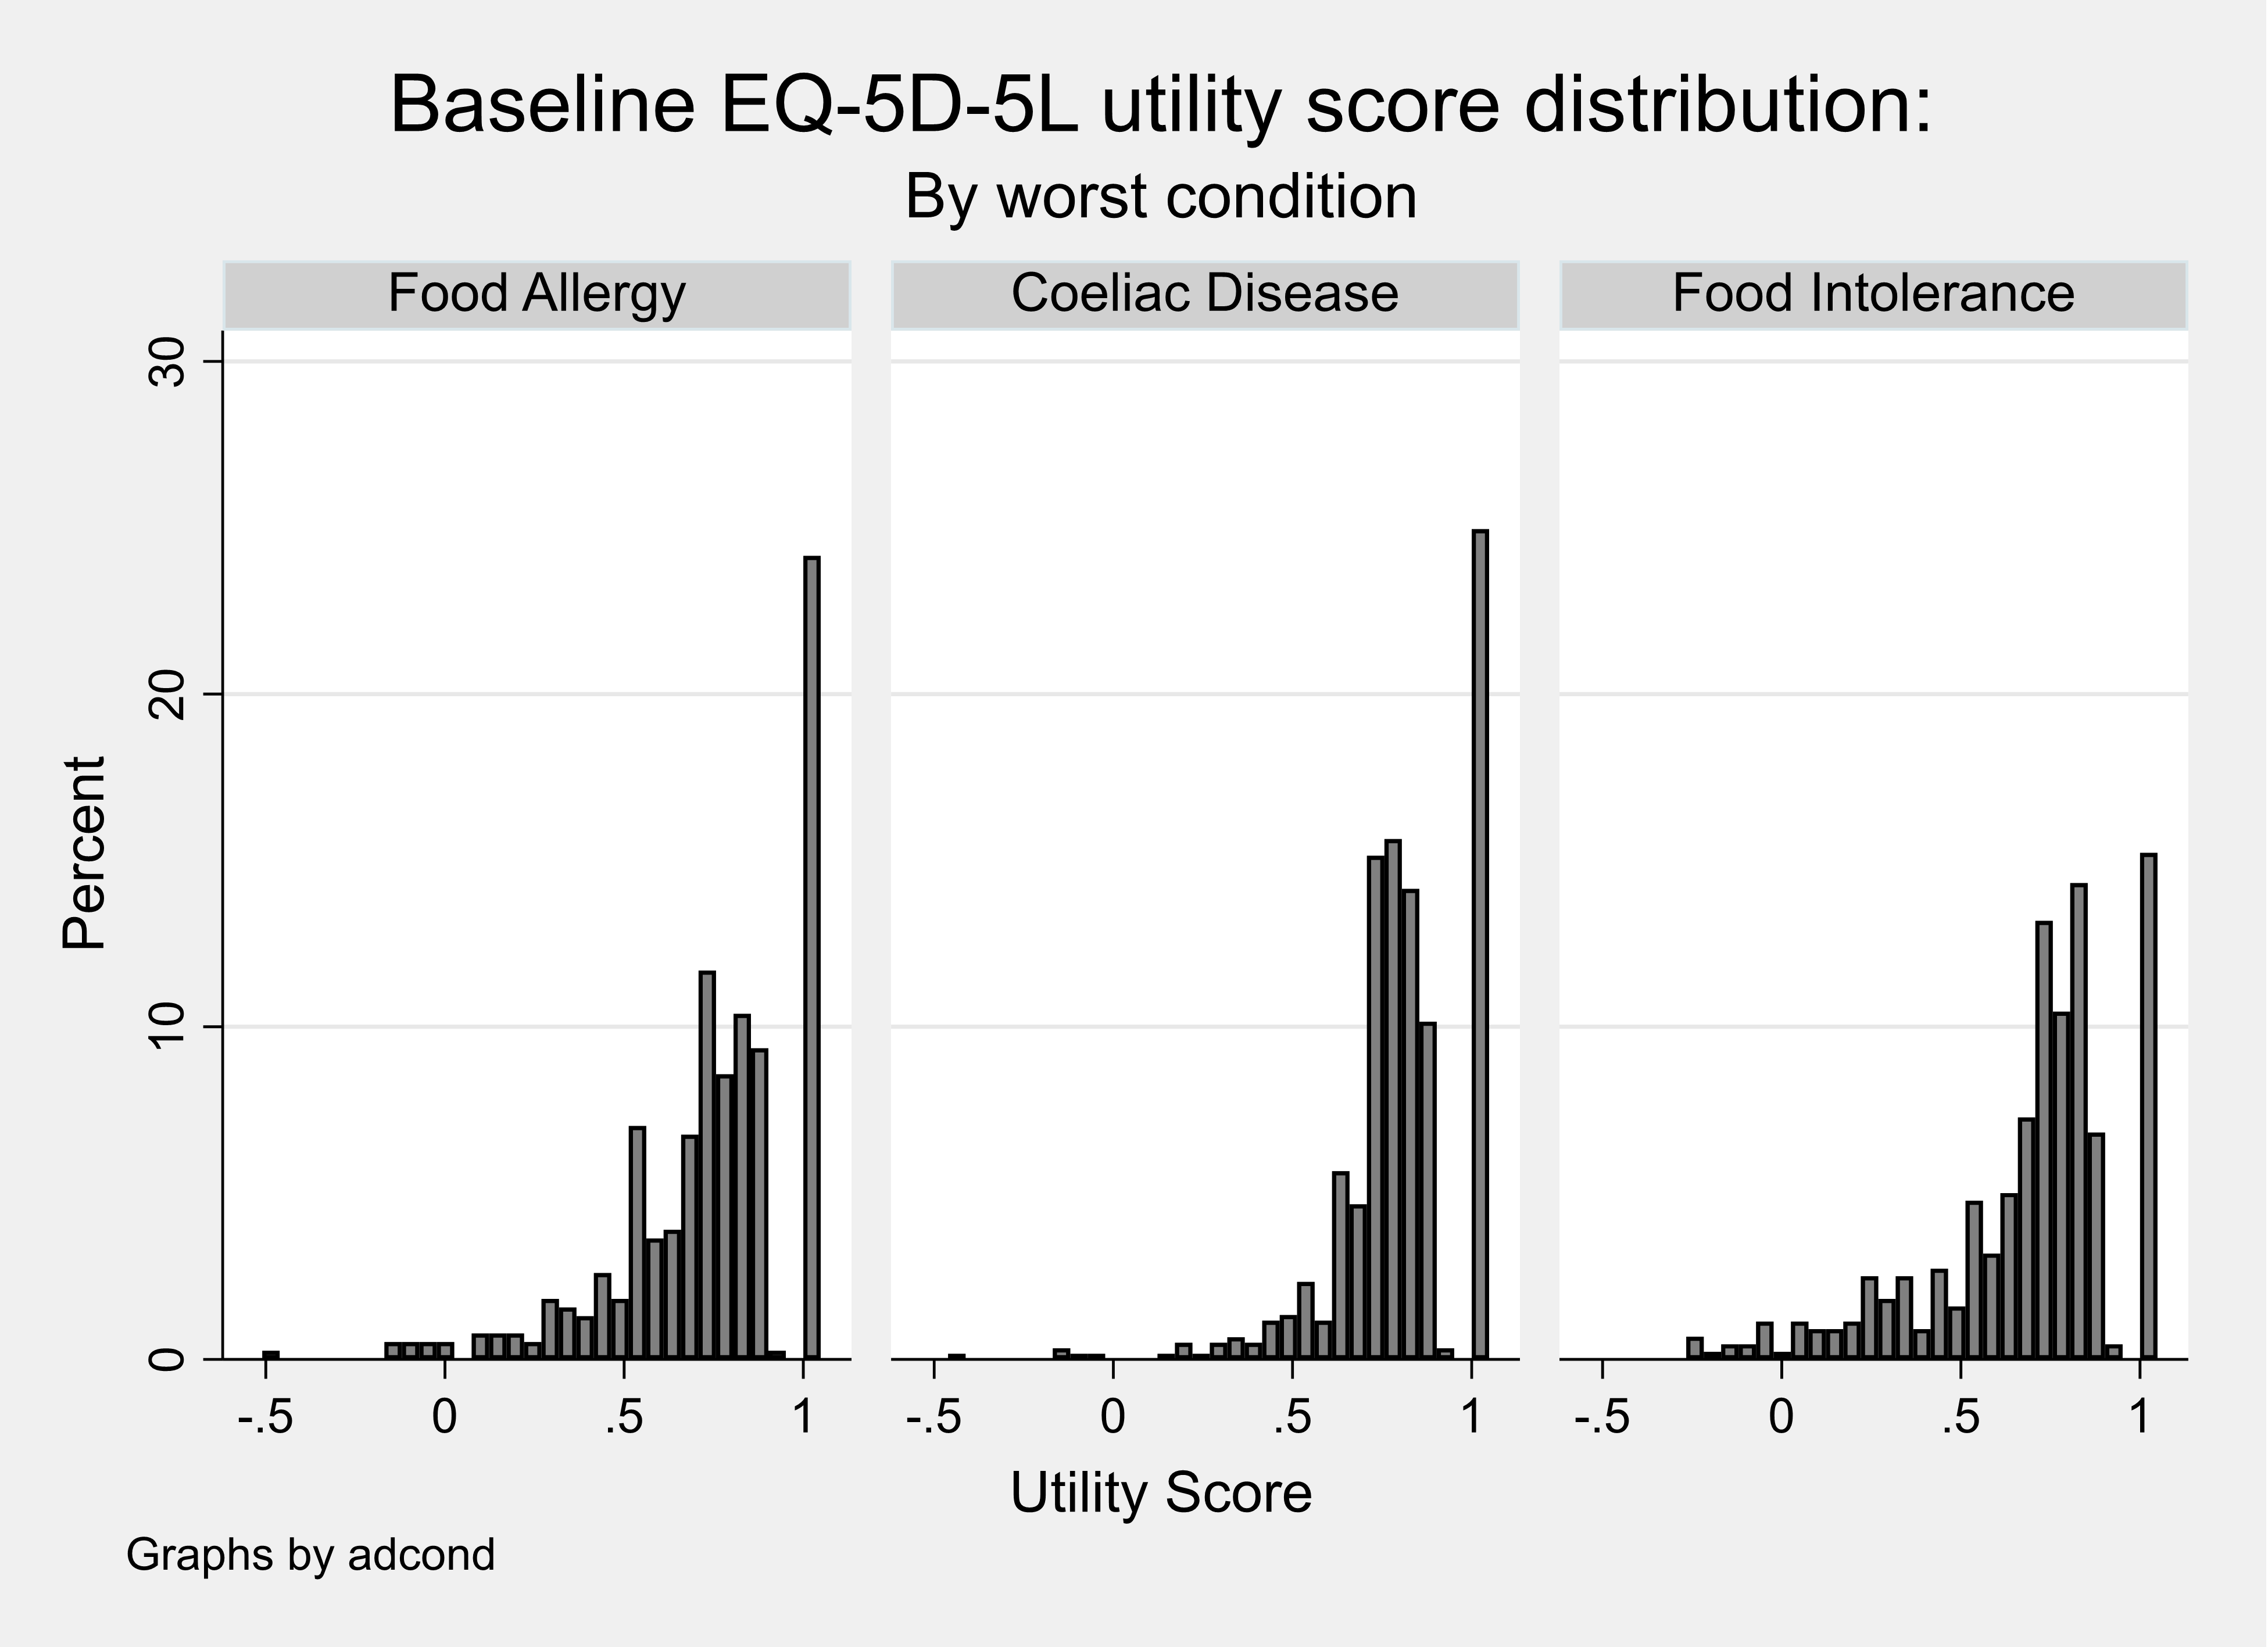
The distribution of the utility scores are characteristic of those from other populations that complete the EQ5D multi-attribute measure of health status; right bounded at a value of one (representing perfect health) with a substantial gap to the next set of observations, left bounded, and multi (often bi) modal [Hernández Alava et al (2012)].
Table 3 reports the mean utility score representing the health of the respondents estimated from the EQ5D-5L for adults living with one FHS and also multiple FHS.
Table 3. Summary statistics for the calculated utility score from EQ5D-5L for adults with one or multiple conditions
| Condition | Mean | sd | N | min | p25 | Median | p75 | Max |
|---|---|---|---|---|---|---|---|---|
| Coeliac Disease | 0.81 | .18 | 508 | -.44 | .74 | .84 | 1 | 1 |
| Food Allergy | 0.75 | .26 | 274 | -.51 | .65 | .8 | 1 | 1 |
| Food Intolerance | 0.7 | .26 | 365 | -.22 | .62 | .77 | .85 | 1 |
| Multiple | 0.68 | .23 | 279 | -.2 | .58 | .73 | .84 | 1 |
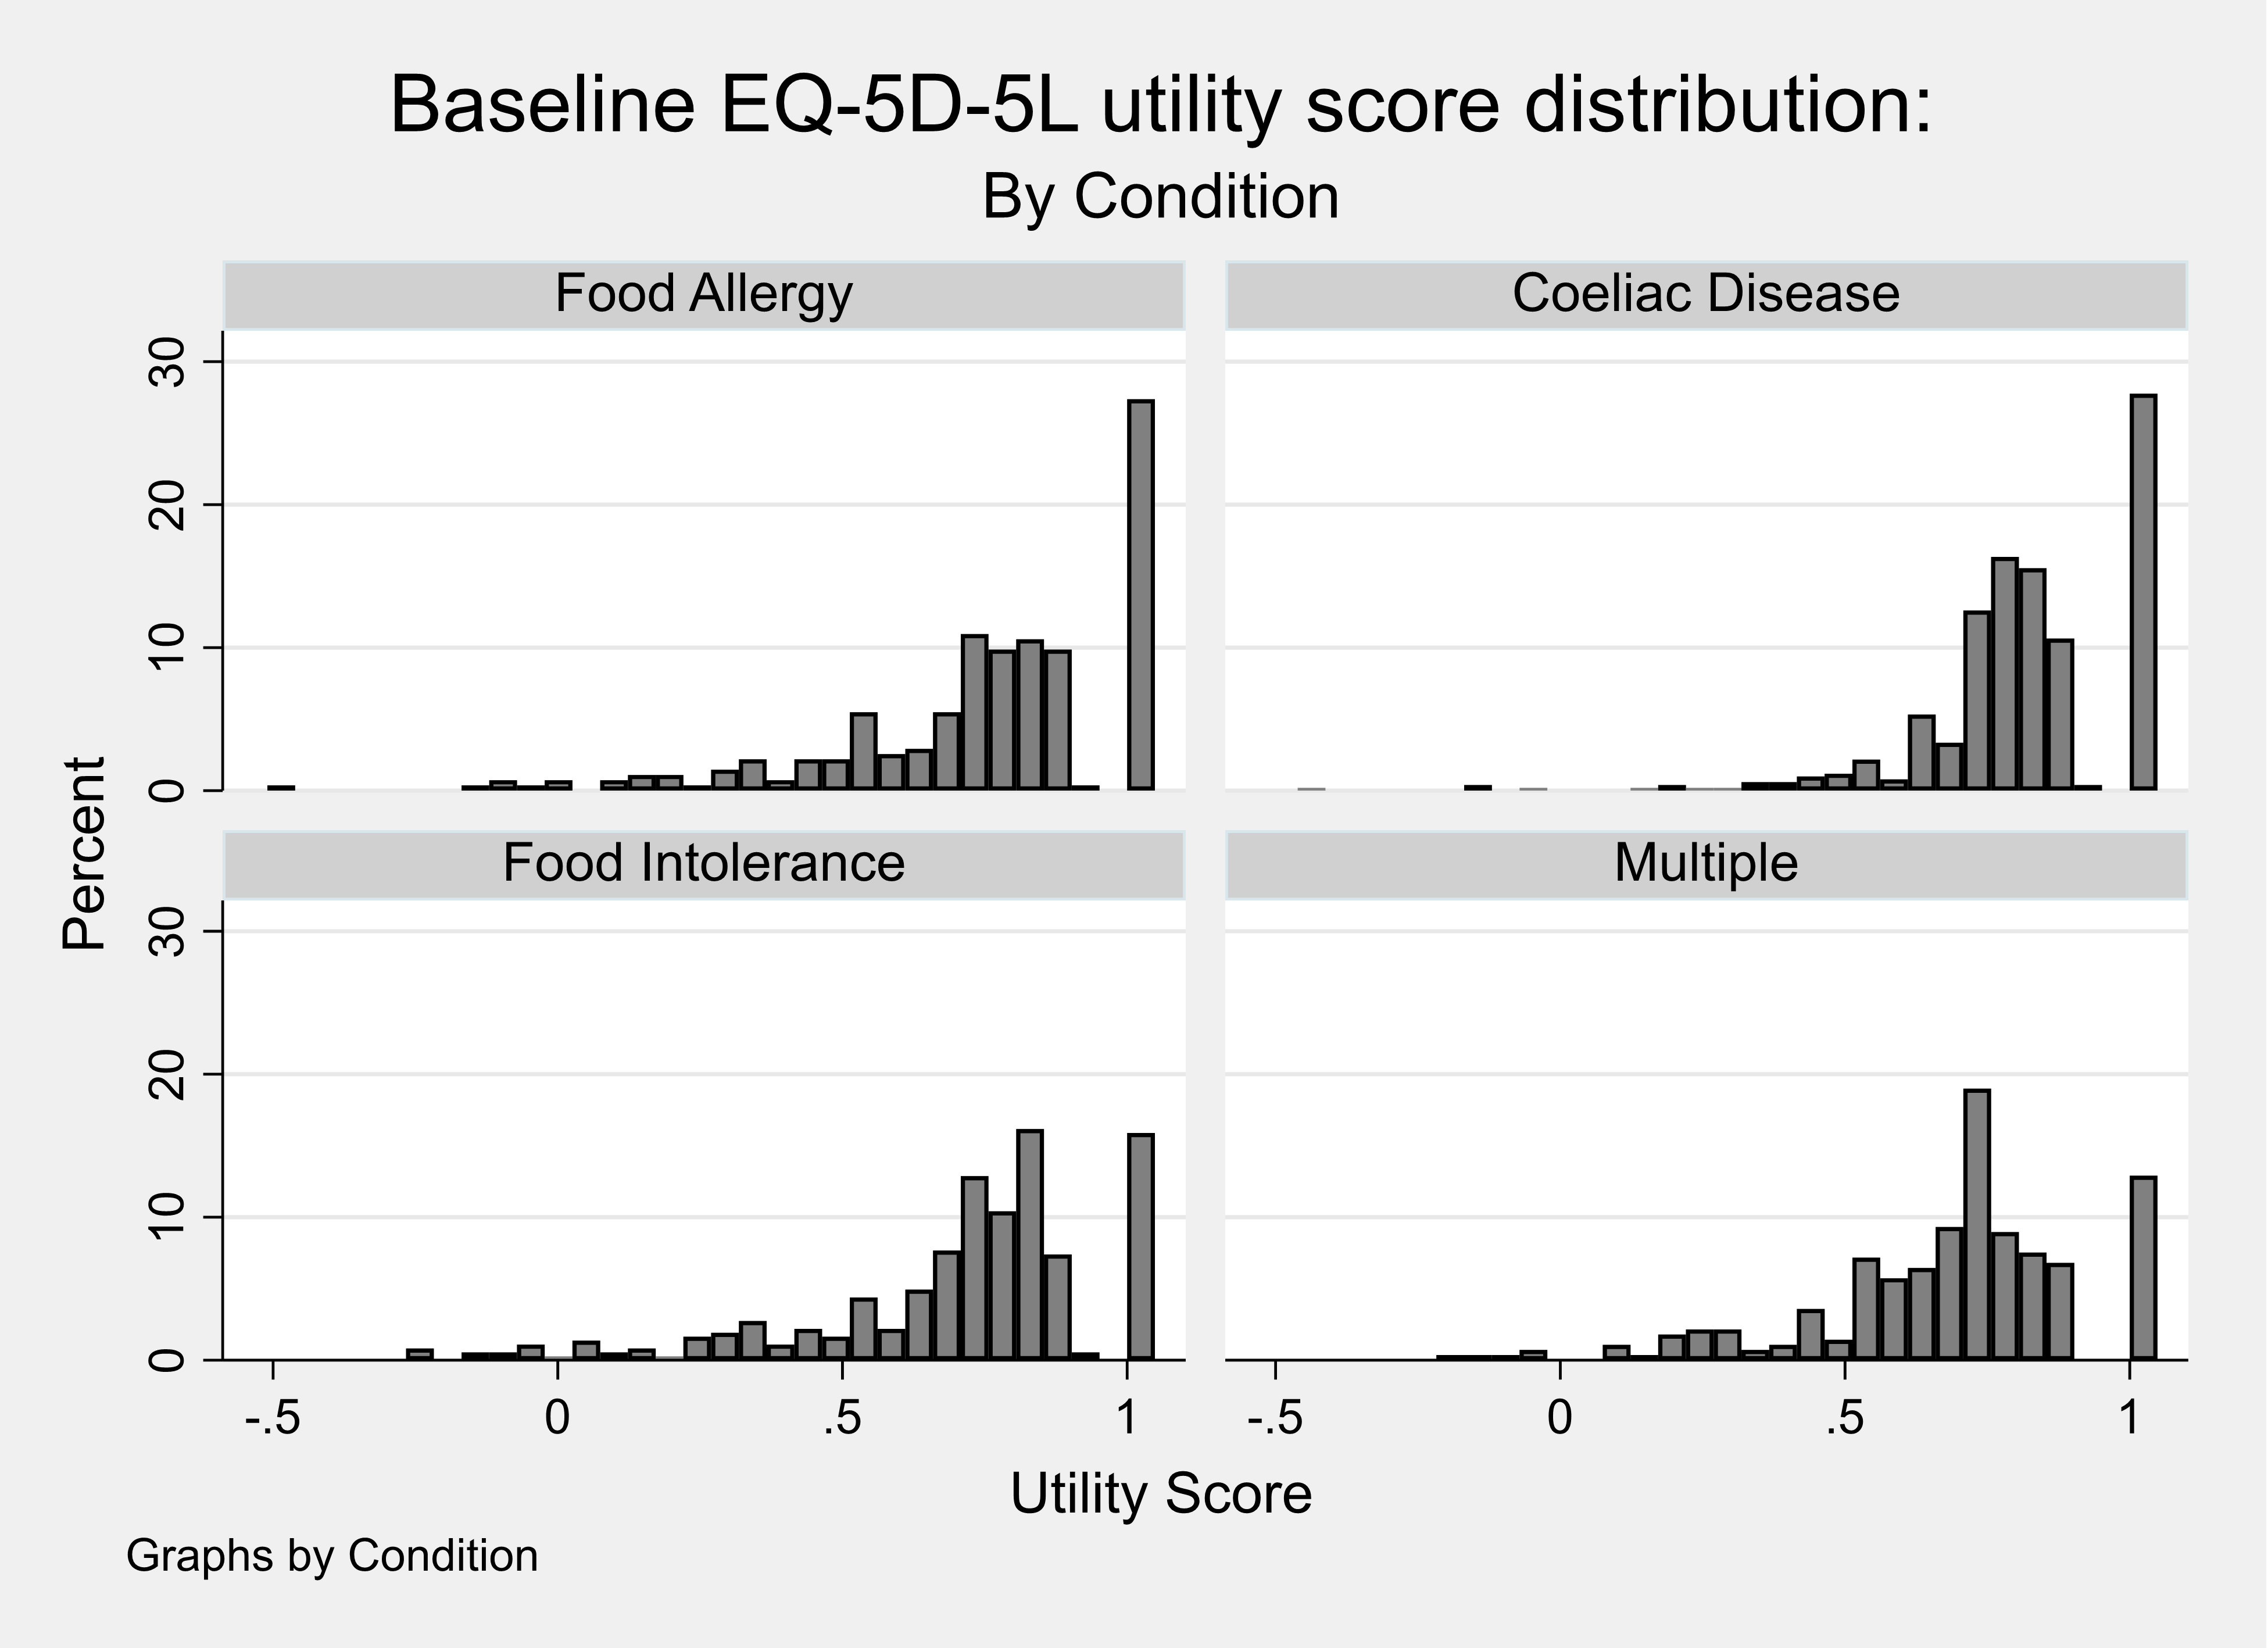
Figure 3 shows the distribution of the utility scores for the population of adult respondents living with one food hypersensitivity or multiple FHS. This Figure shows that a lower proportion (~12%) of adults living with multiple rather than one food hypersensitivity rated their health to be ‘perfect’ despite living with a FHS.
Figure 3. Distribution of utility scores representing the current health of adults with one or multiple conditions
Adult results: Contingent health status using EQ5D-5L
Respondents were asked to consider what their health would be using the EQ5D-5L if their food hypersensitivity were removed. The utility scores for each completed EQ5D-5L (baseline or current health) were then compared with the contingent EQ5D-5L (contingent health). Table 4 reports the calculated utility scores for the baseline health and contingent health and the mean difference between these two utility scores (= 0.06). These results show that the respondents did not feel that removing the food hypersensitivity would increase their health to a perfect score of one implying that other conditions were also affecting their self-reported current health status.
Table 4. Calculated baseline and contingent health utility score from the EQ5D-5L for adults
| Utility Score | Mean | Std. Dev. | N | min | p25 | Median | p75 | max |
|---|---|---|---|---|---|---|---|---|
| Baseline utility | 0.74 | .24 | 1426 | -.51 | .66 | .77 | .88 | 1 |
| Contingent utility | 0.8 | .24 | 1426 | -.51 | .71 | .85 | 1 | 1 |
| Difference in utility | 0.06 | .11 | 1426 | -.45 | 0 | 0 | .11 | .8 |
A small proportion of respondents (6%) reported a value for their contingent health using the EQ5D-5L that was lower than their baseline and over half of respondents reported that their health would stay the same if the FHS were removed (see Table 5).
Table 5. Percentage difference between Baseline and Contingent Health utility scores, adult EQ5D-5L
| Percentage difference | Frequency | Percent | Cum. |
|---|---|---|---|
| -100 to -50 percent | 5 | 0.35 | 0.35 |
| -50 to -25 percent | 14 | 0.99 | 1.34 |
| -25 to -10 percent | 15 | 1.06 | 2.39 |
| -10 to -0.1 percent | 52 | 3.66 | 6.06 |
| No change | 763 | 53.73 | 59.79 |
| 0.1 to 10 percent | 157 | 11.06 | 70.85 |
| 10 to 25 percent | 274 | 19.30 | 90.14 |
| 25 to 50 percent | 112 | 7.89 | 98.03 |
| 50 to 100 percent | 20 | 1.41 | 99.44 |
| +100 percent | 8 | 0.56 | 100.00 |
| Total | 1420 | 100.00 | - |
The calculated difference in utility score was also summarised when considering the values for the perceived worst or only food hypersensitivity (see Table 6). These results show that adult respondents with coeliac disease reported the biggest improvement in mean utility score when their condition was ‘removed’.
As with any economic evidence, it is up to the decision-maker using these data in their jurisdiction to make the judgement whether the magnitude of this change in health (measured on the utility scale where a value of zero represents death and one represents perfect health) is meaningful.
Table 6. Calculated difference between baseline and contingent health utility score from the EQ5D-5L for the only or worst condition for adults
| Only or Worst Condition | mean | sd | N | p25 | min | Median | p75 | max |
|---|---|---|---|---|---|---|---|---|
| Coeliac Disease | 0.06 | .11 | 601 | -.44 | 0 | 0 | .12 | .76 |
| Food Allergy | 0.05 | .11 | 385 | -.25 | 0 | 0 | .06 | .8 |
| Food Intolerance | 0.05 | .12 | 440 | -.45 | 0 | 0 | .1 | .63 |
Contingent health status using EQ-VAS
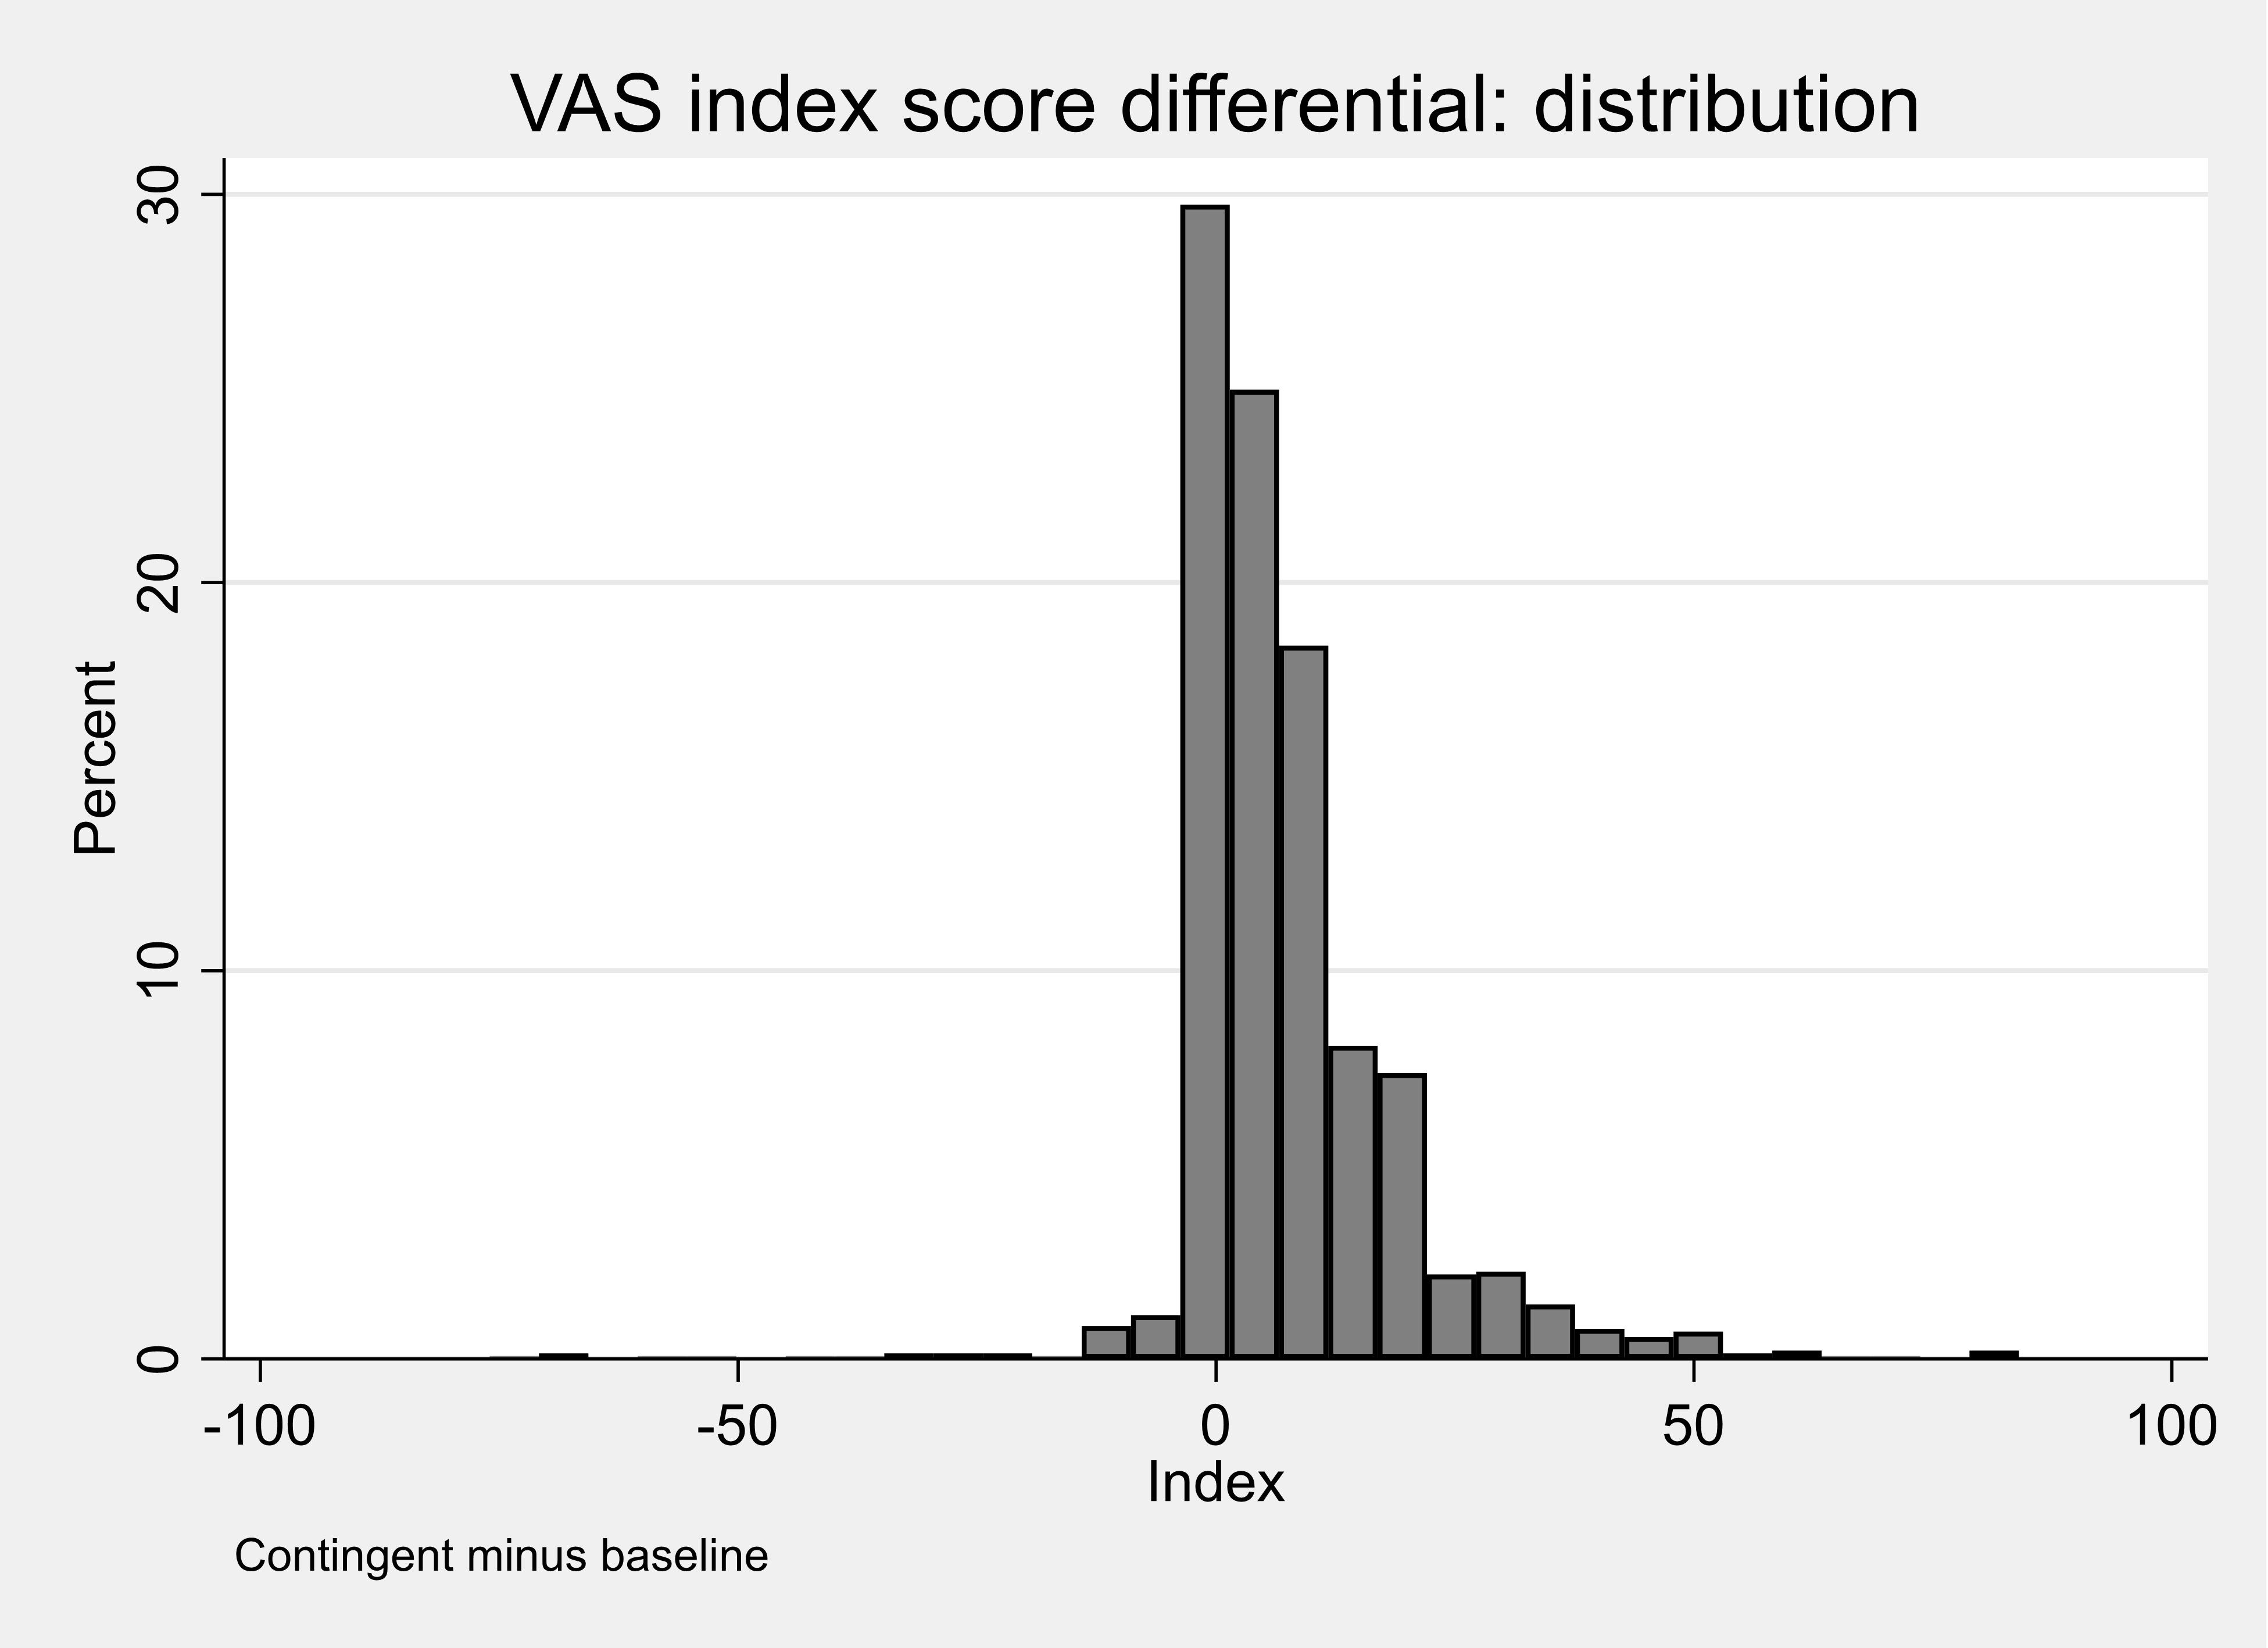
Respondents were asked to consider what their health would be using the EQ-VAS if their food hypersensitivity were removed (see Table 7). The observed mean difference in the EQ-VAS comparing contingent health with baseline health was 7.1. These scores had a highly skewed distribution (see Figure 4) and the observed median difference in the EQ-VAS comparing contingent health with baseline health was 4.
Table 7. Calculated baseline and contingent health utility score from the EQ-VAS for adults
| Utility score type | Mean | Std. Dev. | N | min | p25 | Median | p75 | max |
|---|---|---|---|---|---|---|---|---|
| Baseline VAS | 69.36 | 23.5 | 1426 | 0 | 59 | 75 | 88 | 100 |
| Contingent VAS | 77.22 | 23.49 | 1426 | 0 | 70 | 85 | 94 | 100 |
| VAS diff | 7.86 | 12.26 | 1426 | -76 | 0 | 5 | 11 | 84 |
Figure 4. Distribution of the difference in calculated baseline and contingent health utility score from the EQ-VAS for adults
A small proportion of respondents (5%) reported a value for their contingent health using the EQ5D-5L that was lower than their baseline and one fifth of respondents reported that their health would stay the same if the food hypersensitivity were removed (see Table 10.8).
It is not informative to compare the estimates obtained from the EQ5D-5L and the EQ-VAS because these two measurement tools use different scales and different mechanisms to capture the results. A respondent completing the EQ-VAS can see and record an explicit movement on the 100-point scale. In contrast, a respondent completing the EQ5D-5L will indicate the change in health by a movement between five levels for each domain that is then translated into a utility score. It is possible to ‘nudge’ the VAS score a little higher when scoring contingent health whereas for the EQ5D the steps between 5 or 3 levels are far greater.
Table 8. Percentage difference between Baseline and Contingent VAS score, adults
| Percentage difference | Frequency | Percent | Cum. |
|---|---|---|---|
| -100 to -50 percent | 8 | 0.57 | 0.57 |
| -50 to -25 percent | 8 | 0.57 | 1.13 |
| -25 to -10 percent | 13 | 0.92 | 2.05 |
| -10 to -0.1 percent | 40 | 2.83 | 4.88 |
| No change | 203 | 21.36 | 26.24 |
| 0.1 to 10 percent | 446 | 31.54 | 57.78 |
| 10 to 25 percent | 333 | 23.55 | 81.33 |
| 25 to 50 percent | 162 | 11.46 | 92.79 |
| 50 to 100 percent | 65 | 4.60 | 97.38 |
| +100 percent | 37 | 2.62 | 100.00 |
| Total | 1414 | 100.00 | - |
The calculated difference in score using the EQ-VAS was also estimated when considering the values for the perceived worst or only FHS (see Table 9). These results show that adult respondents with food intolerance reported the biggest improvement (8.25) in mean utility score when their condition was ‘removed’.
Table 9. Calculated difference between adults’ baseline and contingent health utility score from the EQ-VAS, by condition.
Coeliac Disease
| Utility score | mean | sd | N | min | p25 | Median | p75 | max |
|---|---|---|---|---|---|---|---|---|
| Baseline VAS | 72.53 | 23.91 | 601 | 0 | 65 | 80 | 90 | 100 |
| Contingent VAS | 80.53 | 24.05 | 601 | 0 | 79 | 90 | 95 | 100 |
| VAS diff | 8 | 12.2 | 601 | -76 | 0 | 5 | 11 | 84 |
Food Allergy
| Utility score | mean | sd | N | min | p25 | Median | p75 | max |
|---|---|---|---|---|---|---|---|---|
| Baseline VAS | 69.68 | 22.76 | 385 | 0 | 56 | 75 | 88 | 100 |
| Contingent VAS | 76.85 | 22.27 | 385 | 0 | 70 | 82 | 93 | 100 |
| VAS diff | 7.17 | 11.29 | 385 | -33 | 0 | 4 | 10 | 64 |
Food Intolerance
| Utility score | mean | sd | N | min | p25 | Median | p75 | max |
|---|---|---|---|---|---|---|---|---|
| Baseline VAS | 64.76 | 22.85 | 440 | 0 | 50 | 70 | 81 | 100 |
| Contingent VAS | 73.01 | 23.1 | 440 | 0 | 61 | 80 | 90 | 100 |
| VAS diff | 8.25 | 13.14 | 440 | -70 | 1 | 5 | 12 | 82 |
Appendix J Figures 2 and 3 are scatterplots of calculated baseline and contingent health utility score from the EQ5D-5 L for adults (Appendix J Figure 2) and from the EQ-VAS (Appendix J Figure 3). These plots suggest a stronger level of association between the VAS Scores than there is between the EQ-5D-5L Utility scores. For this reason, the contingent improvement in EQ-VAS scores were used in the estimated aggregate models, where a common measure of condition is required.
Child results: EQ5D-3L (proxy) and EQ-VAS
Table 10 reports the mean utility score representing the health of the child as reported by the parents estimated from the EQ5D-3L (proxy). These utility scores were generated from the levels for each completed EQ5D shown in Appendix J.
Table 10. Summary statistics for the calculated utility score from EQ5D-3L (proxy) for children.
| Utility Score | Mean | Std. Dev. | N | min | p25 | Median | p75 | Max |
|---|---|---|---|---|---|---|---|---|
| EQ5D index | 0.86 | .14 | 592 | .52 | .77 | .88 | 1 | 1 |
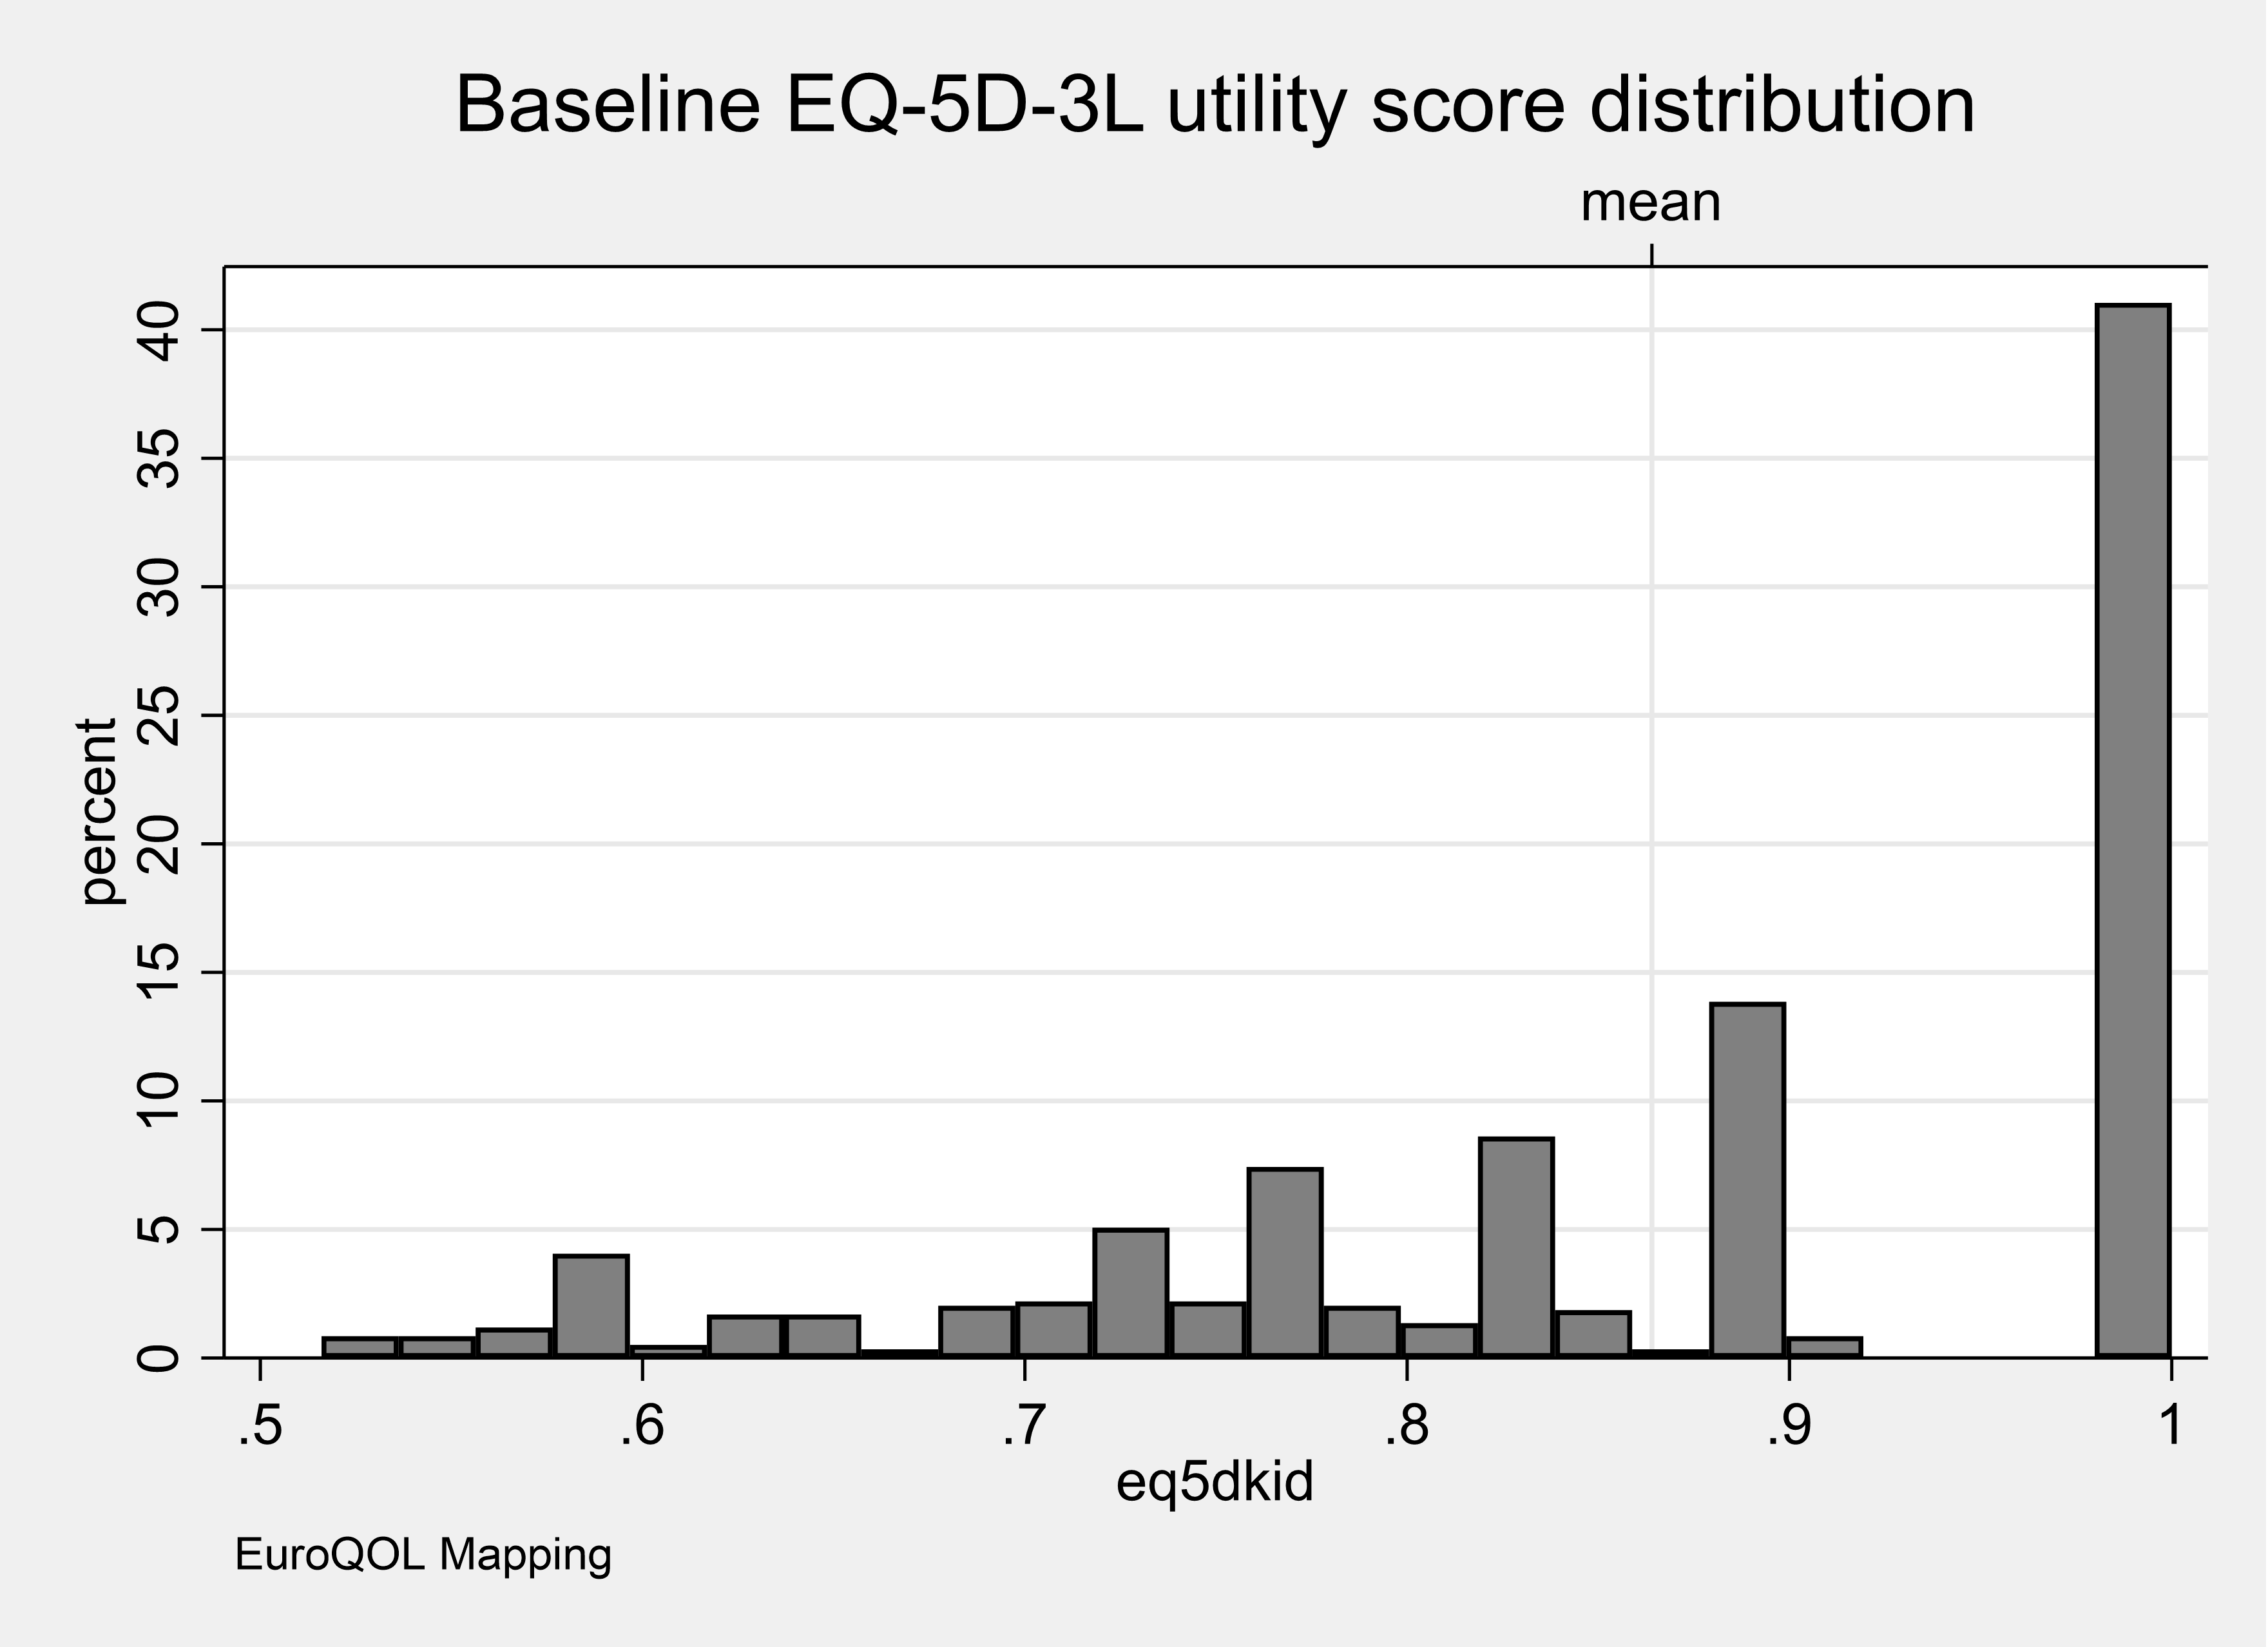
Figure 5 shows the distribution of the utility scores for the population of children as rated by their parents. This Figure shows that over two-fifths of parent’s rated the health of their child to be ‘perfect’ despite living with a FHS.
Figure 5. Distribution of utility scores representing the current health of children as valued by parents
Parents were asked to identify the FHS that had the most substantial impact on their child. Table 11 reports the mean utility score representing the health of the respondents estimated from the EQ5D-3L (proxy) for each category of FHS. These utility scores were generated from the levels for each completed EQ5D shown in Appendix J.
Table 11. Summary statistics for the calculated utility score from EQ5D-3L(proxy) for a child for the worst or only FHS
| Only or Worst Condition | mean | sd | N | min | p25 | Median | p75 | max |
|---|---|---|---|---|---|---|---|---|
| Coeliac Disease | 0.81 | .16 | 67 | .56 | .62 | .84 | 1 | 1 |
| Food Allergy | 0.88 | .13 | 400 | .52 | .78 | .88 | 1 | 1 |
| Food Intolerance | 0.84 | .13 | 125 | .52 | .77 | .84 | 1 | 1 |
Figure 6 shows the distribution of the utility scores for the values rated by the parents for each category of FHS for the worst condition only. This Figure shows that over two-fifths of parents rated the health of their child living with a food allergy to be ‘perfect’ despite living with a FHS. In contrast, only around one-quarter of parents rated their child’s health to be ‘perfect’ if they were living with coeliac disease or food intolerance. This supports the view that the EQ-5D instrument may not be capturing features of the condition that influence quality of life (see Jansson et al,. 2013).
Figure 6. Distribution of utility scores representing the current health of a child for the worst or only FHS as valued by a parent.
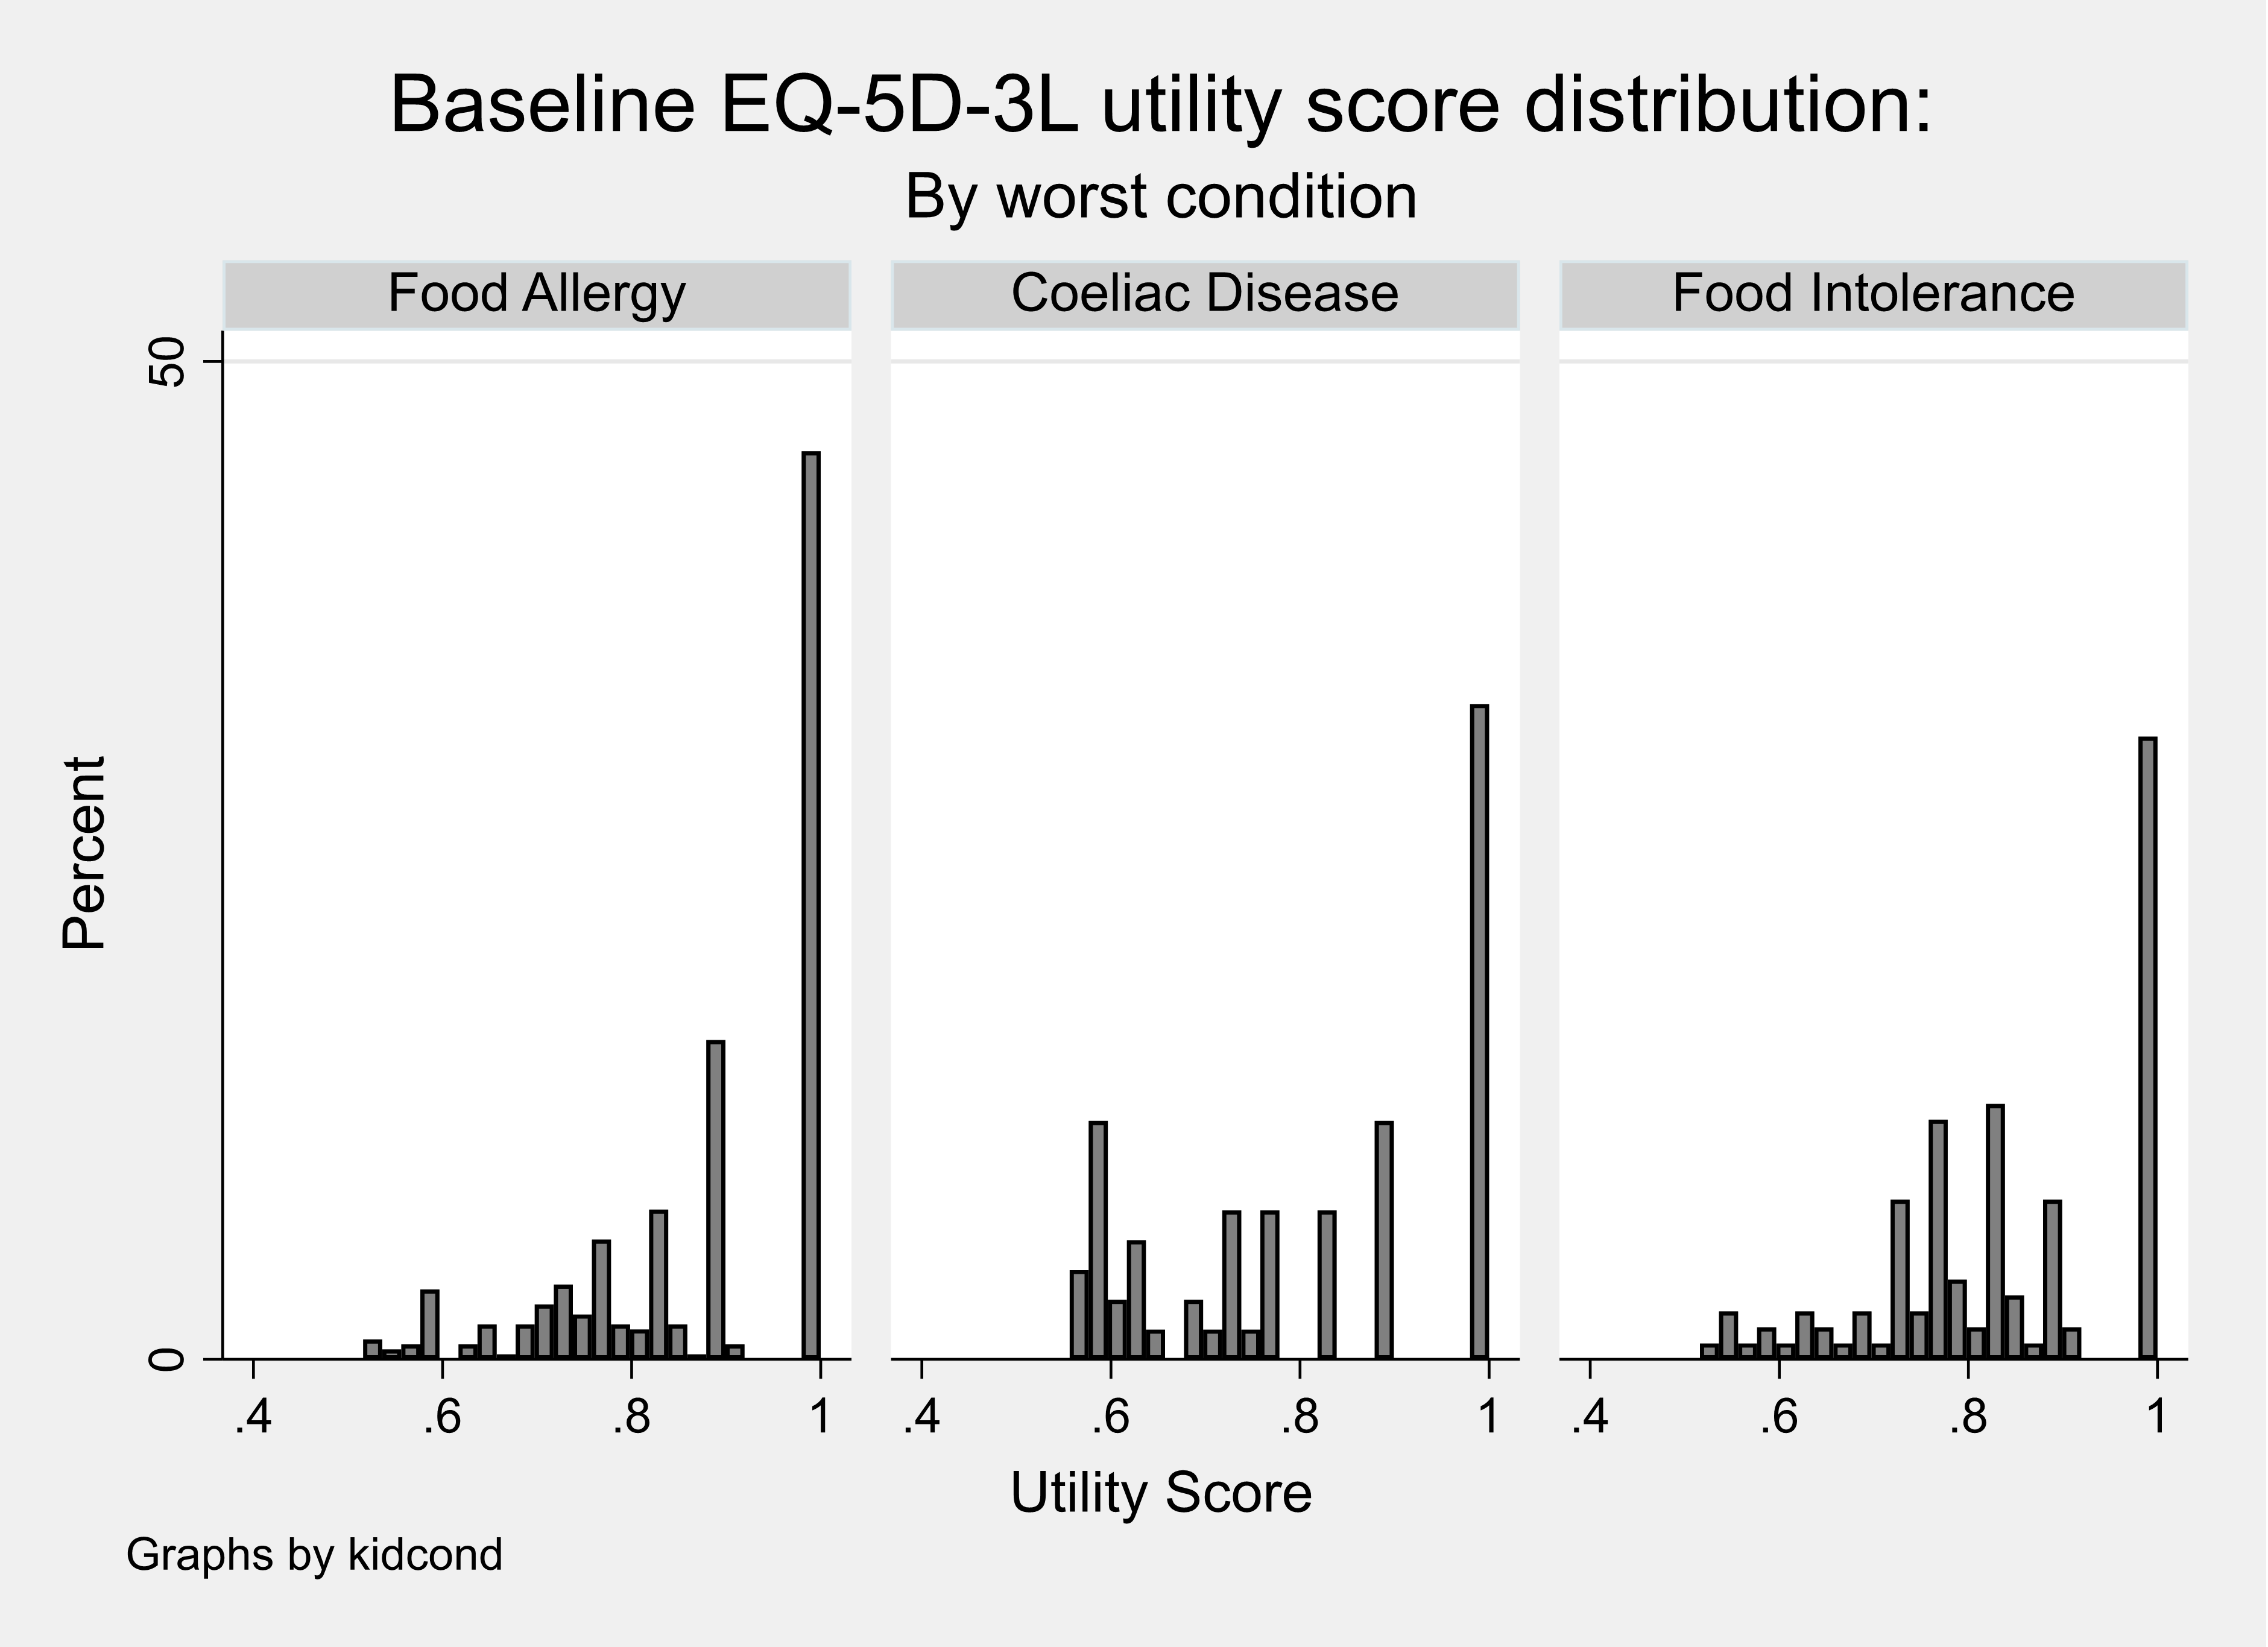
Table 12 reports the mean utility score representing the health of the child as rated by their parent estimated from the EQ5D-3L (proxy) living with one FHS and also multiple FHS.
Table 12. Summary statistics for the calculated utility score from EQ5D-3L (proxy) child with one or multiple conditions.
| Condition | Mean | sd | N | min | p25 | Median | p75 | max |
|---|---|---|---|---|---|---|---|---|
| Coeliac Disease | 0.81 | .17 | 56 | .52 | .62 | .84 | 1 | 1 |
| Food Allergy | 0.89 | .13 | 351 | .52 | .81 | .88 | 1 | 1 |
| Food Intolerance | 0.85 | .13 | 115 | .55 | .77 | .84 | 1 | 1 |
| Multiple | 0.79 | .14 | 70 | .55 | .71 | .78 | .88 | 1 |
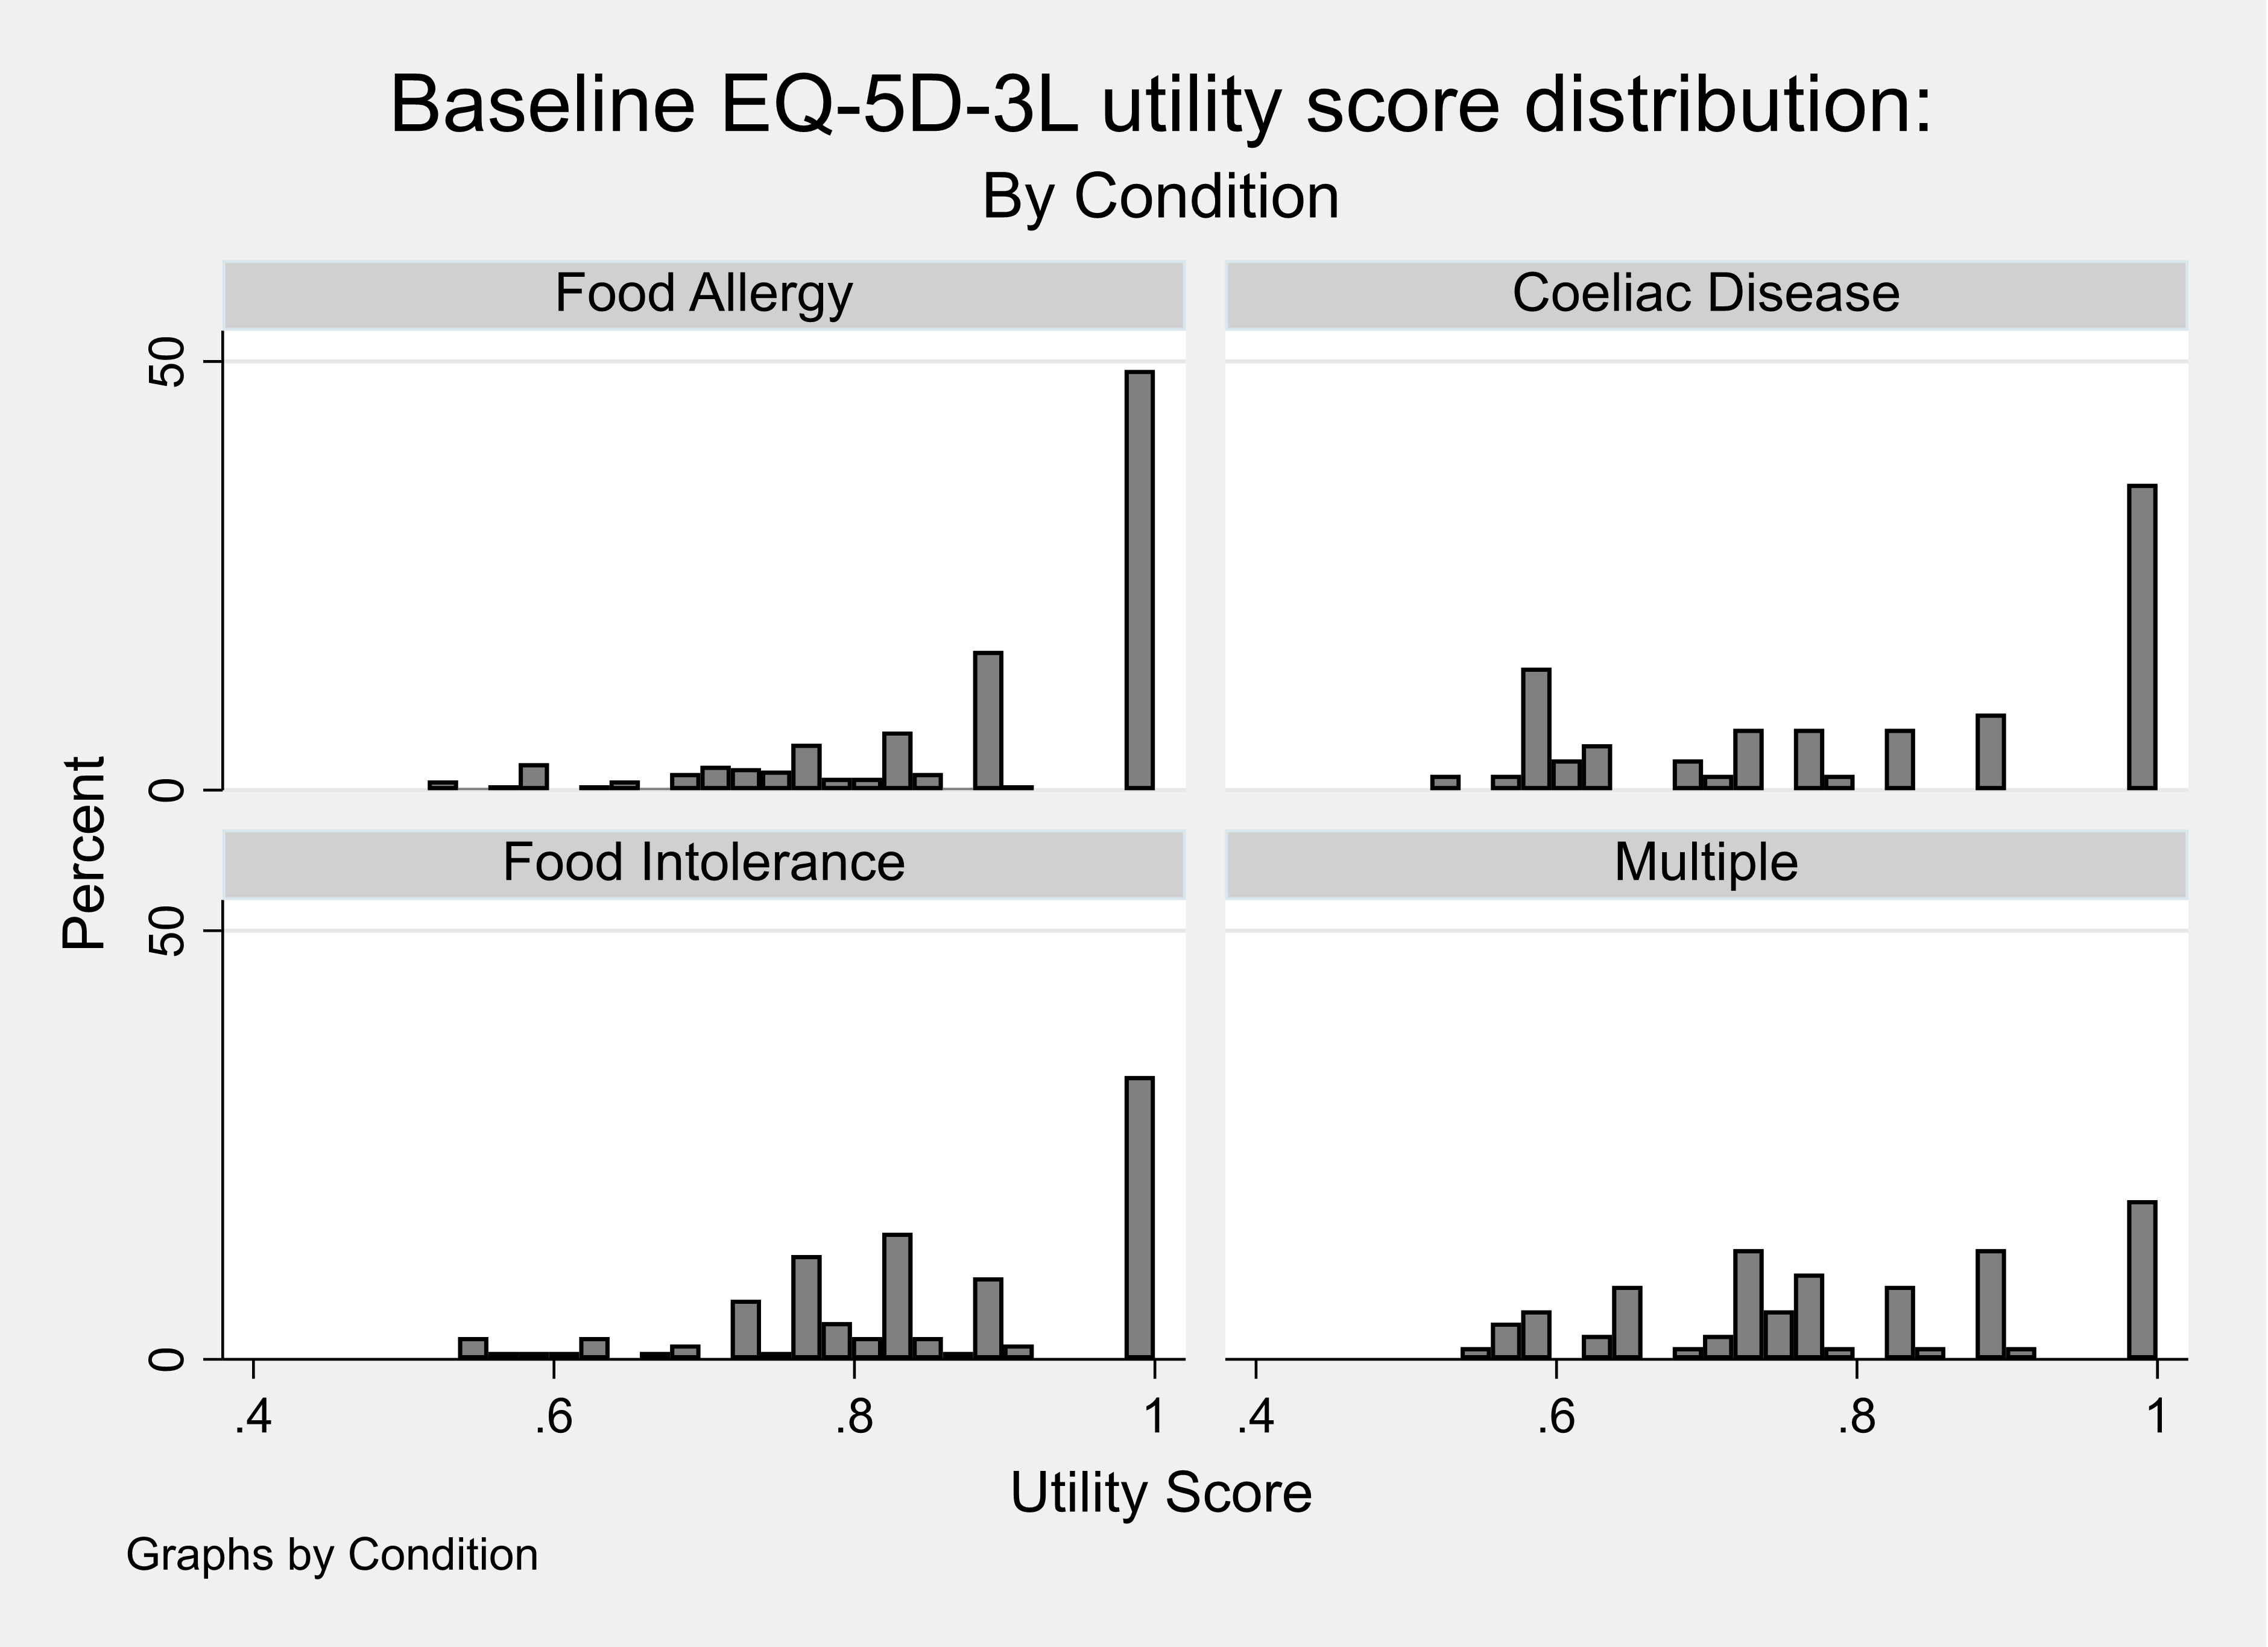
Figure 7 shows the distribution of the utility scores for a child living with one FHS or multiple FHS as rated by a parent. This Figure shows that a lower proportion (~20%) of parents of a child living with multiple rather than one FHS rated their health to be ‘perfect’ despite living with a FHS.
Figure 7. Distribution of utility scores representing the current health of a child with one or multiple conditions.
Child results: Contingent health status using EQ5D-3L (proxy)
Parents were asked to consider what the health of their child would be using the EQ5D-3L (proxy) if their FHS were removed. The utility scores for baseline and contingent EQ5D-3L scores, and the difference between them (‘EQ5D diff’), were calculated. Table 13 reports the calculated utility scores for the baseline health and contingent health. These results show that the parents did not feel that removing the FHS would increase their health to a perfect score of one implying that other conditions were also affecting the proxy reported current health status.
Table 13. Calculated baseline and contingent health utility score from the EQ5D-3L (proxy)
| Score Type | Mean | Std. Dev. | N | min | p25 | Median | p75 | max |
|---|---|---|---|---|---|---|---|---|
| Baseline Utility | 0.86 | .14 | 592 | .52 | .77 | .88 | 1 | 1 |
| Contingent Utility | 0.91 | .14 | 592 | .52 | .84 | 1 | 1 | 1 |
| EQ5D index | 0.04 | .1 | 592 | -.41 | 0 | 0 | .12 | .43 |
A proportion of parents (10%) reported a value for the contingent health of their child using the EQ5D-3L that was lower than their baseline and over half of parents reported that the health of their child would stay the same if the FHS were removed (see Table 14).
Table 14. Calculated Utility score for contingent health minus baseline health for a child from EQ5D-3L (proxy)
| Utility Score | Frequency | Percent | Cum. |
|---|---|---|---|
| -100 to -50 percent | 2 | 0.34 | 0.34 |
| -50 to -25 percent | 4 | 0.68 | 1.01 |
| -25 to -10 percent | 25 | 4.22 | 5.24 |
| -10 to -0.1 percent | 29 | 4.90 | 10.14 |
| No change | 318 | 53.72 | 63.85 |
| 0.1 to 10 percent | 43 | 7.26 | 71.11 |
| 10 to 25 percent | 144 | 24.32 | 95.44 |
| 25 to 50 percent | 27 | 4.56 | 100.00 |
| Total | 592 | 100.00 | - |
The calculated difference in utility score was also summarised when considering the values for the perceived worst or only FHS (see Table 15). These results show that children with coeliac disease were estimated to experience the biggest improvement in mean utility score when their condition was ‘removed’ although the values are very similar across the three conditions.
Table 15. Calculated difference between baseline and contingent health utility score from the EQ5D-3L for the only or worst condition for children
| Only or Worst Condition | mean | sd | N | min | p25 | Median | p75 | max |
|---|---|---|---|---|---|---|---|---|
| Coeliac Disease | 0.06 | .11 | 601 | -.44 | 0 | 0 | .12 | .76 |
| Food Allergy | 0.05 | .11 | 385 | -.22 | 0 | 0 | .06 | .8 |
| Food Intolerance | 0.05 | .12 | 440 | -.45 | 0 | 0 | .1 | .63 |
Child results: Contingent health status using EQ-VAS (proxy)
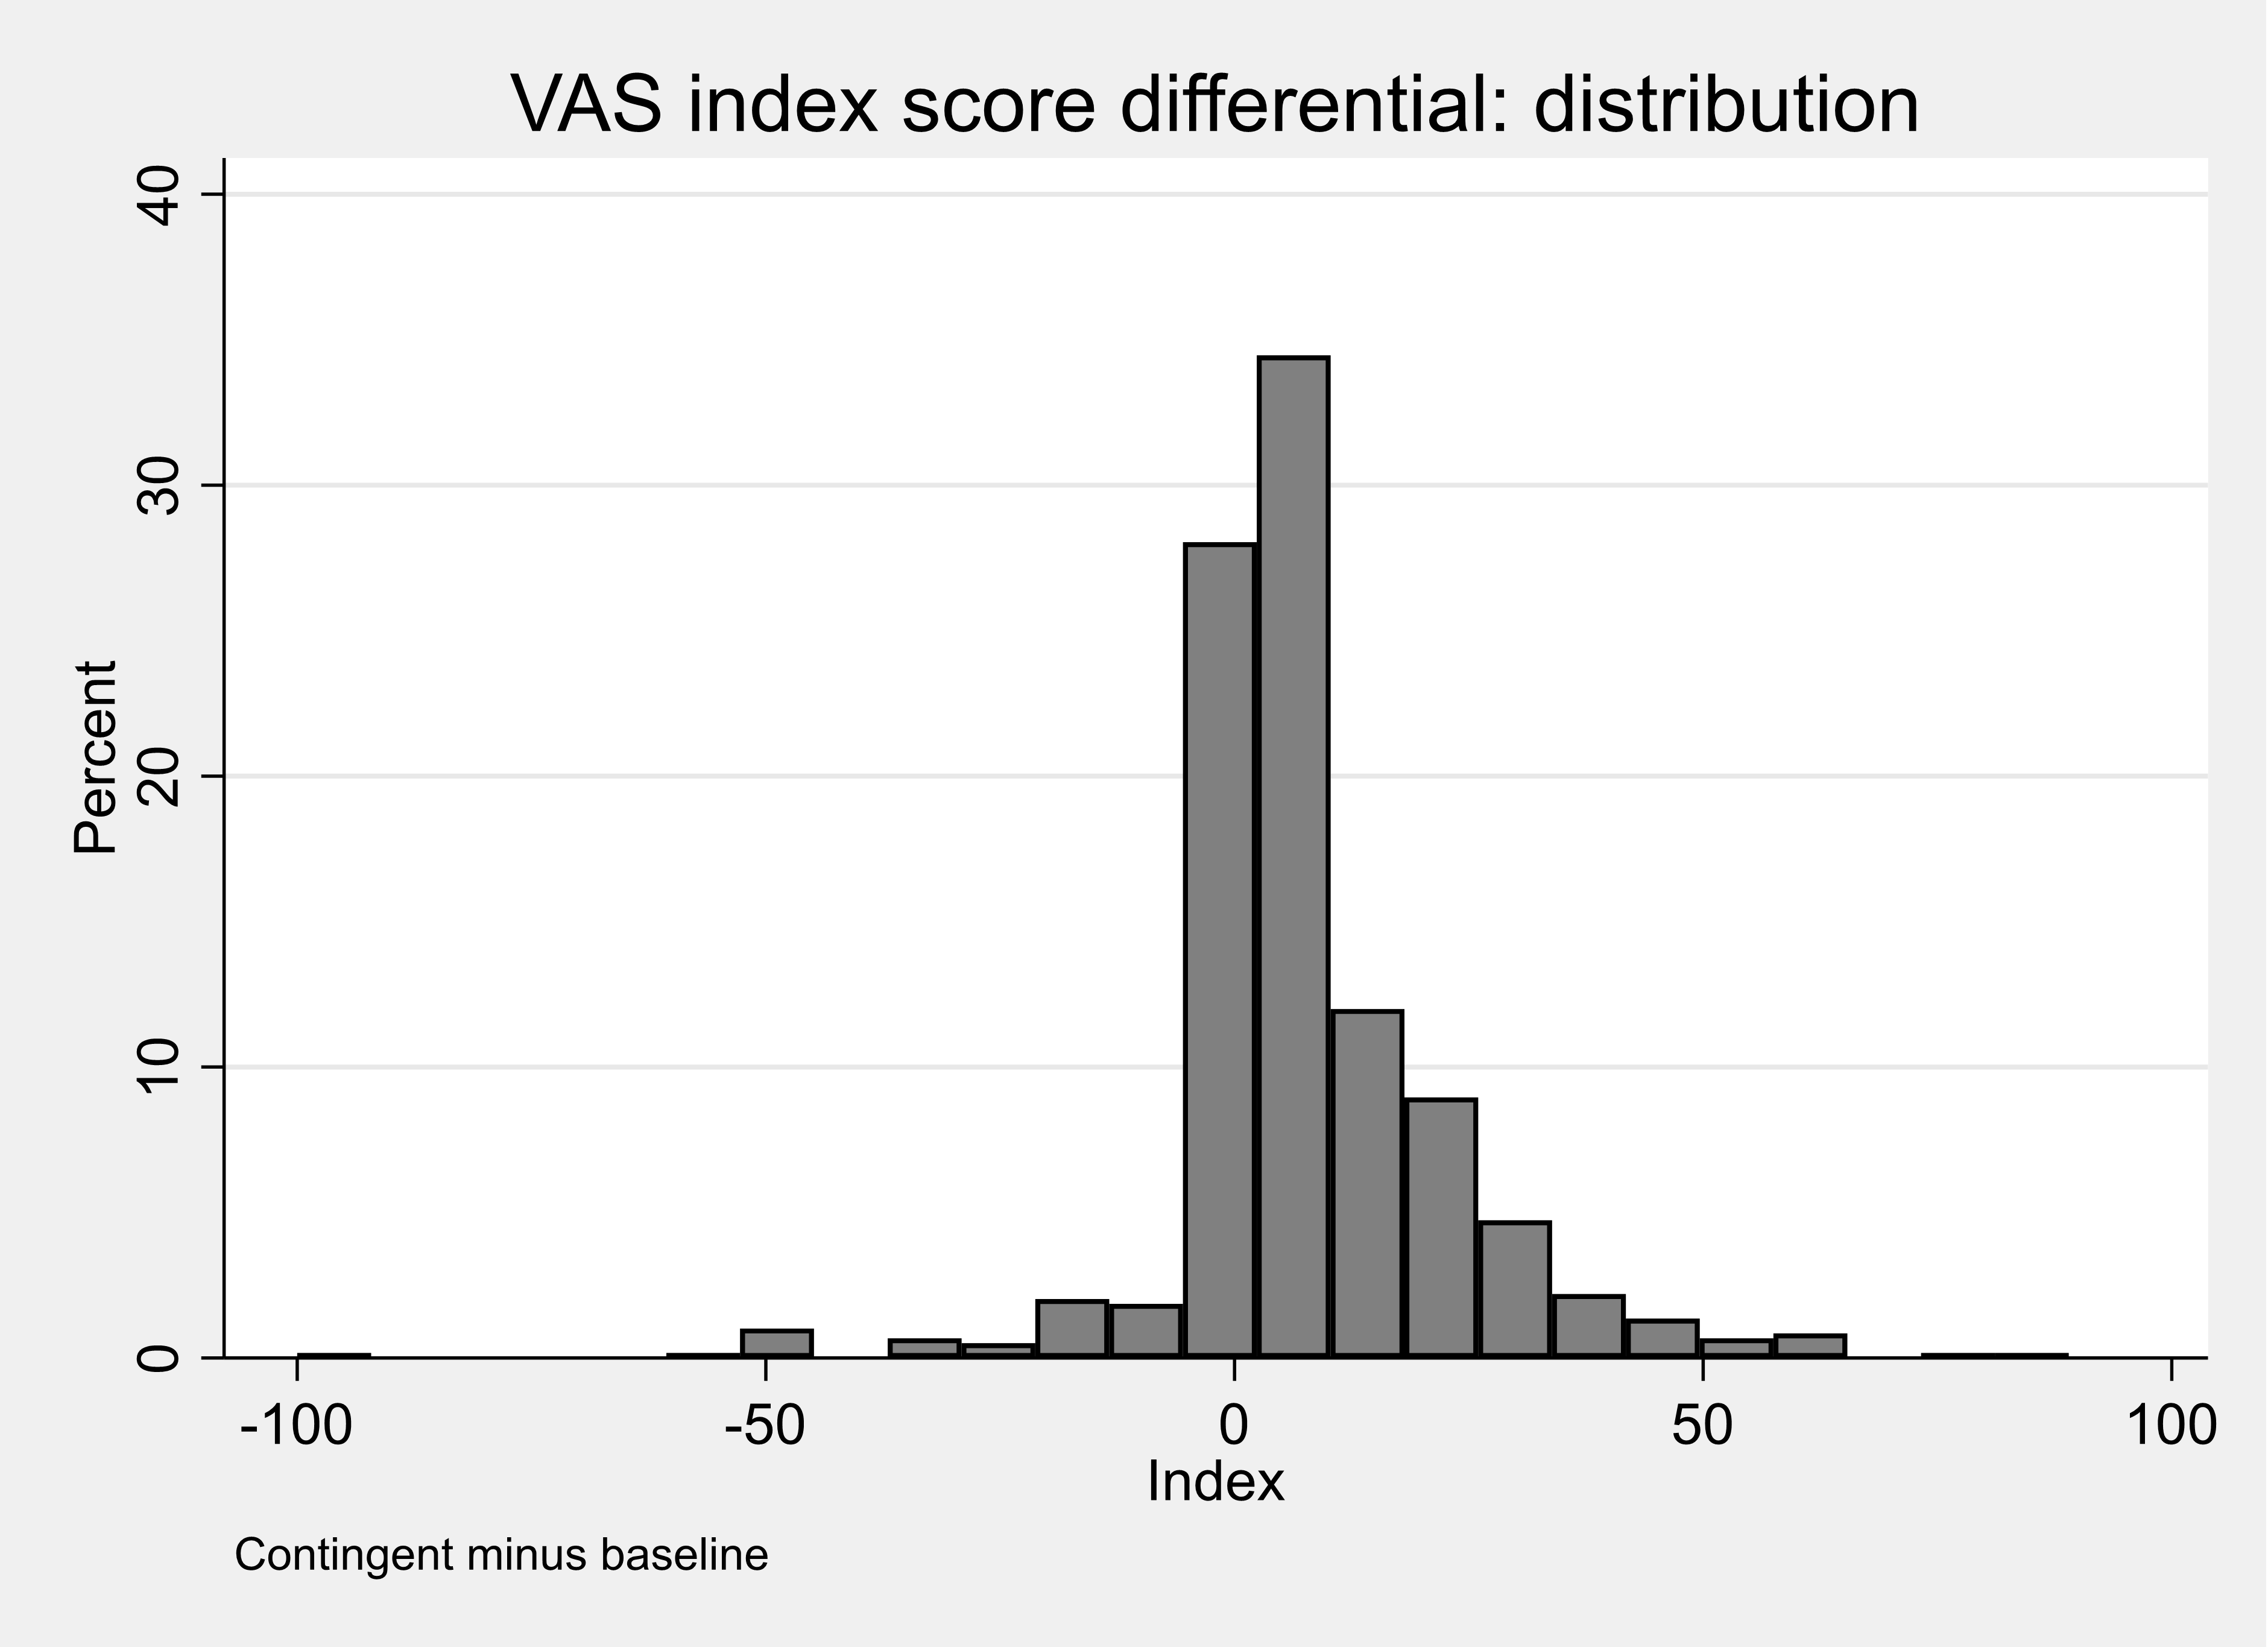
Parents were asked to consider what the health of their child would be using the EQ-VAS if their FHS were removed (see Table 16). The observed mean difference in the EQ-VAS comparing contingent health with baseline health was 8.4. These scores had a highly skewed distribution (see Figure 8) and the observed median difference in the EQ-VAS comparing contingent health with baseline health was 6.
Table 16. Calculated baseline and contingent health utility score from the EQ-VAS (proxy)
| Calculated Score | Mean | Std. Dev. | N | min | p25 | Median | p75 | max |
|---|---|---|---|---|---|---|---|---|
| Baseline VAS | 77.64 | 19.88 | 592 | 0 | 68 | 81 | 92 | 100 |
| Contingent VAS | 86 | 18.95 | 592 | 0 | 80 | 94 | 100 | 100 |
| VAS diff | 8.36 | 15.64 | 592 | -100 | 0 | 6 | 14 | 89 |
Figure 8. Distribution of the difference in calculated baseline and contingent health utility score from the EQ-VAS (proxy)
A proportion of parents (8%) reported a proxy value for the contingent health of their child using the EQ5D-3L that was lower than their baseline and less than one fifth of parents reported that the health of their child would stay the same if the FHS were removed (see Table 17).
Table 17. Percentage difference between baseline and contingent child health score from the VASEQ-VAS
| Percentage Difference | Frequency | Percent | Cum. |
|---|---|---|---|
| -100 to -50 percent | 9 | 1.53 | 1.53 |
| -50 to -25 percent | 10 | 1.70 | 3.23 |
| -25 to -10 percent | 15 | 2.55 | 5.78 |
| -10 to -0.1 percent | 13 | 2.21 | 7.99 |
| No change | 100 | 17.01 | 25.00 |
| 0.1 to 10 percent | 180 | 30.61 | 55.61 |
| 10 to 25 percent | 148 | 25.17 | 80.78 |
| 25 to 50 percent | 67 | 11.39 | 92.18 |
| 50 to 100 percent | 27 | 4.59 | 96.77 |
| +100 percent | 19 | 3.23 | 100.00 |
| Total | 588 | 100.00 | - |
The calculated difference in score using the EQ-VAS (proxy) was also summarised when parents considered the values for the perceived worst FHS or only FHS (see Table 18). These results show that parents of a child with coeliac disease reported the biggest improvement in mean utility score when their condition was ‘removed’.
Table 18. Baseline and contingent health utility scores from the EQ-VAS (proxy) for the only or worst condition
Coeliac Disease
| Utility score | mean | sd | N | min | p25 | Median | p75 | max |
|---|---|---|---|---|---|---|---|---|
| Baseline VAS | 75.09 | 20.02 | 67 | 34 | 60 | 77 | 93 | 100 |
| Contingent VAS | 87.51 | 20.39 | 67 | 3 | 85 | 96 | 100 | 100 |
| VAS diff | 12.42 | 15.42 | 67 | -31 | 1 | 8 | 20 | 60 |
Food Allergy
| Utility score | mean | sd | N | min | p25 | Median | p75 | max |
|---|---|---|---|---|---|---|---|---|
| Baseline VAS | 80.14 | 18.26 | 400 | 0 | 71.5 | 85 | 94 | 100 |
| Contingent VAS | 87.66 | 16.64 | 400 | 0 | 81.5 | 95 | 100 | 100 |
| VAS diff | 7.52 | 15.07 | 400 | -100 | 0 | 5 | 13 | 64 |
Food Intolerance
| Utility score | mean | sd | N | min | p25 | Median | p75 | max |
|---|---|---|---|---|---|---|---|---|
| Baseline VAS | 70.97 | 22.99 | 125 | 0 | 61 | 72 | 90 | 100 |
| Contingent VAS | 79.87 | 23.49 | 125 | 0 | 71 | 90 | 99 | 100 |
| VAS diff | 8.9 | 17.23 | 125 | -45 | 1 | 6 | 14 | 89 |
Appendix J Figures 5 and 6 are scatter plots of calculated baseline and contingent health utility score from the proxy EQ5D-3L for children (Appendix J Figure 5) and from the EQ-VAS (Appendix J Figure 6). These plots suggest a weaker level of association between the VAS Scores than there is between the EQ-5D-3L Utility scores.
Revision log
Published: 21 October 2022
Last updated: 23 October 2023