Impacts of Food Hypersensitivities on Quality of Life in the UK and Willingness to Pay (WTP) to remove those impacts
The Valuation tool - DCE design of Willingness to Pay
An explanation of the valuation tool used in the project.
3.1 DCE overview
A stated preference approach was employed to estimate the WTP values for the removal of all symptoms and limitations for a specified period.
The quality of any stated preference (SP) study’s results is contingent on the information provided to respondents when they make their choices.
The DCE involves making choices between discrete options which are defined in terms of attributes which vary in their levels. Monetary valuation requires a cost attribute (which needs to be clearly specified – what is being paid for and when).
The change in food hypersensitivity needed also to be conveyed in the DCE options. Various options were considered regarding this – for example specifying different options in terms of the levels of FHS-specific measures (FAQLQ/FIQLQ/CDQ) or generic measures of health such as the of EQ5D . This would have potentially yielded WTP to achieve changes in the levels that define those instruments.
The difficulties in this approach include:
- there not being an evidence base to map EQ5D levels to levels of food hypersensitivity severity (and indeed condition-specific QoL measures such as FAQLQ/FIQLQ/CDQ were in part developed because of the view that EQ5D did not capture food hypersensitivity impacts sufficiently well, [see Jansson et al., 2013]).
- the number of items in the FAQLQ (29), FIQLQ (22) and CDQ (20) were excessive to be included as DCE attributes, and many items/impacts are highly correlated which is problematic for DCE design in which attribute levels are typically designed to move independently of each other.
After considerable deliberation the decision was taken to specify the DCE in terms of a Status Quo (SQ) option (no change in food hypersensitivity, no cost) and an alternative: complete removal of food hypersensitivity, for specified (varying) duration and cost.
The extent of the improvement being offered (the gain from food hypersensitivity removal) would not be specified in the options but vary across individuals - given the distribution of FHS severity in the population.
The individual-level benefit from food hypersensitivity removal was captured in the survey via FAQLQ, FIQLQ, CDQ, EQ5D, VAS etc.
The structure of the choice sets is shown in Table 3.1 below:
| Option A: No change | Option B: Temporary removal of food hypersensitivity |
|---|---|
| No change in FHS | Removal of FHS for specified period |
| No cost | Cost |
3.2 DCE Framing – Deriving an Annual WTP value
A key issue when designing a DCE is in the framing of the valuation exercise. From the perspective of the COI model what is required is a value, expressed in monetary terms, of the additional costs, inconvenience and pain, suffering and anxiety associated with the FHS, for a year.
That value would then be applied to all who had the condition for a year to generate an aggregate measure of the burden in that year.
A direct and obvious approach would be to frame the question so respondents revealed what they would be prepared to pay to avoid a year with their FHS condition.
However, a finding from the focus groups (Section 6) was that many respondents were clear that there were ‘adjustment costs’ associated with moving from the current position (having the FHS) to not having the condition (for a year) and then the FHS returning.
The preference to reject zero-cost removal of the FHS for short periods of time (observed in the focus groups) is a manifestation of those costs of adjustment (associated with short term removal) exceeding the benefits of its removal.
Consequently, if the DCE was framed in terms of removal of the condition for a single year it is likely we would significantly underestimate the ongoing cost of the condition (we would estimate net benefits from removal for a year, and not be able to distinguish between benefits and adjustment costs).
An alternative approach would have been to offer complete removal, for the rest of the respondent’s life. This would address the adjustment cost issue but would raise other issues. We would have had to identify (either by asking respondents their expected life duration, or using life-tables ex post) what the expected length of remaining life was, in-order to identify the annual value.
Further, there could only be one DCE choice task per respondent which would severely limit the efficiency of the DCE design, especially for any conditions for which only small samples were recruited.
The approach adopted was to offer repeated choices in which the period of relief from the FHS condition was varied (from 1 to 20 years). Although choices will still be affected by respondents’ assessment of adjustment costs, statistically an annual value can be estimated, partitioned from those adjustment costs (see Appendix D utility function for more detail on this).
This monetary value (WTP for SQ) should not be included in the COI model, as it represents the value that is associated with a change in condition, whereas the COI model is concerned with costs of ongoing conditions. If, in contrast, one was interested in evaluating the market potential for a treatment that did indeed deliver relief from the FHS then this additional value should be included in the analysis, as it will modify the WTP value to transition from having, to not having, the condition.
For the COI model it is the economic value associated with the ongoing pain, suffering, inconvenience and cost that is relevant.
3.3 DCE Framing – means of food hypersensitivity removal
The choice sets involved an option in which food hypersensitivity was removed for a specified period, at a cost.
A decision was required as whether to specify how the food hypersensitivity was temporarily removed, for example via the taking of a pill, or leave the method unspecified.
Specifying a method (for example, pill or patch) could be regarded as more realistic (and hence induce more realistic choices from respondents), but any specified means of removal could potentially lead to many more questions – such as, pill or patch contents/ testing/safety etc. Leaving the means of food hypersensitivity removal unspecified avoided such questions - but could prompt questions about how the food hypersensitivity was being removed.
Two competing framings were developed (unspecified, a pill taken once) and tested in the focus groups. The strong preference of focus groups participants was to specify the means of food hypersensitivity removal by the pill – this was adopted in the main survey.
3.4 DCE Levels and Experimental Design
DCEs involve choices between discrete options defined by attributes which vary in their levels.
Levels for the Cost of food hypersensitivity removal (the cost of the pill) and the duration (years) of the removal were required. These levels were tested in the focus groups leading to the use of the cost and duration levels shown in Table 3.2.
Table 3.2: DCE Levels and experimental design
| Attribute | Levels |
|---|---|
| Duration (years) | 1, 5, 10, 15, 20 |
| Cost (£/year) | 50, 100, 250, 500, 1000, 1500, 5000 |
The DCE sets which respondents face are the outcome of an experimental design which combined attribute levels into options, and those options into pairs (sets). With 2 attributes each with 5 levels, a full factorial design was generated comprising 25 choice sets, divided into 3 blocks of 8, 8 and 9 sets. By adding a set (from the block of 9 choice sets) into the first two blocks a design of 27 choice sets in 3 blocks of 9 scenarios was achieved – each respondent saw (one of 3 blocks of) 9 choice sets.
3.5 Graphic Design
To increase respondent engagement and understanding of the choice tasks a graphic designer was employed to produce more intuitive representations of the DCE attribute levels. Competing designs were tested in the focus groups and a preferred design was arrived at.
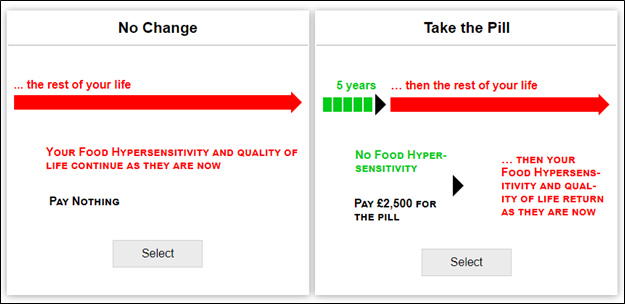
The choice sets for the Adult survey were of the form in Figure 3.1 below.
Figure 3.1. Example Choice Set: Adults
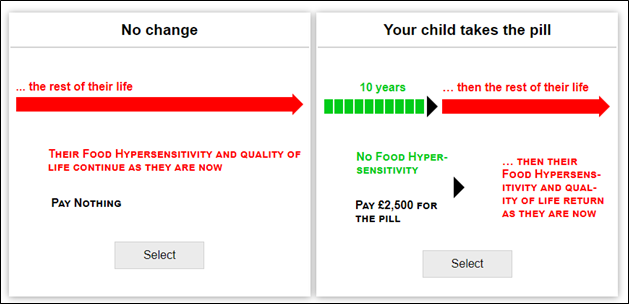
And in the Child survey they were of the form in Figure 3.2.
Figure 3.2. Example Choice Set: Parents
The arrows that convey duration need to be proportionate in their length (for example, 20 years needs to be 4 times as long as 5 years) which requires a screen width larger than most phones offer. Given that some respondents complete surveys on phones an alternative, narrow, graphic design was created – the survey software detects screen size and switched to that design when the respondents screen was suitably small. This design was tested in the focus groups and positively received by participants.