Impacts of Food Hypersensitivities on Quality of Life in the UK and Willingness to Pay (WTP) to remove those impacts
Best worst scaling results Willingness to Pay
Results of the best worst scaling element.
10.1 Overview of BWS research
The Importance Scores derived from estimation of the logit model on the BWS choice data are reported here.
Adult respondents completed the BWS exercise relevant to their condition – identifying the items comprising the FAQLQ, FIQLQ or CDQ which had the least and greatest impact on their quality of life (see example choice sets in Section 3.5).
The relative importance of the varying impacts of FHS were investigated in order to:
- investigate their relative importance (noting that each impact is given equal weight in the construction of the FAQLQ, FIQLQ and CDQ measures);
- aid identification of impacts which are (a) most important to people, and (b) within the FSA’s power to affect.
We now report and discuss the results for the BWS exercises undertaken for three FHS conditions.
In the discussion we focus on the Importance Score associated with each quality-of-life impact derived from logit models estimated on the BWS data. The advantage of Importance Scores (see Appendix E) is that they are ratio scaled - meaning that an item with a score of 6, for example, is regarded by the sample as 6 times more important than an item with a score of 1. This property makes for more intuitive assessment and interpretation of the results (it provides information on the magnitude of the differences in quality-of-life impacts rather than just a ranking).
In the discussion we pay particular attention to labelling and eating out since these are domains over which the FSA has some control. The FSA have responsibility for labelling in relation to allergens in food and have, for example, issued guidance for food businesses, allergen guidance for food business (food.gov) regarding such labelling.
10.2 BWS Results: Food Allergy
The Importance Scores derived from estimation of the logit model on the Allergy BWS choice data are displayed in Table 10.1.
Table 10.1. BWS Importance Scores: Food Allergy (FAQLQ)
| Impact | Mean | 95% lower | 95% upper |
|---|---|---|---|
| the fear of an allergic reaction | 7.20 | 6.93 | 7.47 |
| the fear of an allergic reaction when eating out | 6.85 | 6.59 | 7.11 |
| the trouble from always being alert as to what you are eating | 6.64 | 6.38 | 6.89 |
| the fear of accidentally eating the wrong food | 6.04 | 5.77 | 6.30 |
| the worry that the allergic reactions to foods will become increasingly severe | 5.71 | 5.40 | 6.03 |
| the trouble from having to personally check if you can eat something when eating out | 4.70 | 4.43 | 4.97 |
| the trouble from people underestimating the problems caused by your allergy | 4.62 | 4.33 | 4.91 |
| the apprehension you feel about eating something you’ve never eaten before | 4.36 | 4.15 | 4.57 |
| the trouble from having to hesitate eating a product when you doubt it | 4.20 | 4.02 | 4.38 |
| the trouble from the feeling that you have less control when eating out | 4.08 | 3.87 | 4.29 |
| the trouble from product ingredients changing | 3.77 | 3.56 | 3.97 |
| the discouragement you feel during an allergic reaction | 3.58 | 3.35 | 3.81 |
| the trouble from labels stating: “may contain (traces of)….” | 3.39 | 3.08 | 3.71 |
| the feeling of being a nuisance when eating out | 3.38 | 3.08 | 3.68 |
| the worry about your health | 3.08 | 2.83 | 3.33 |
| the trouble from having to explain that you have a food allergy | 2.84 | 2.57 | 3.10 |
| the trouble from labels being incomplete | 2.72 | 2.50 | 2.93 |
| the trouble from being less able to taste or try products when eating out | 2.46 | 2.26 | 2.66 |
| the trouble from being able to eat fewer products | 2.27 | 2.02 | 2.53 |
| the trouble from being limited as to the products you can buy | 2.20 | 1.98 | 2.43 |
| the trouble from being less able to spontaneously accept an invitation | 2.17 | 1.95 | 2.40 |
| the trouble from having to refuse many things during social activities | 2.16 | 1.98 | 2.34 |
| the trouble for your hosts should you have an allergic reaction | 2.13 | 1.95 | 2.31 |
| the trouble from sometimes frustrating people | 2.06 | 1.86 | 2.27 |
| the trouble from it being unclear to which foods you are allergic | 2.02 | 1.79 | 2.25 |
| the trouble from ingredients being different in other countries | 1.81 | 1.60 | 2.01 |
| the trouble from having to read labels | 1.45 | 1.25 | 1.65 |
| the trouble from lettering on labels being too small | 1.21 | 1.03 | 1.40 |
| the trouble from eating out less | 0.90 | 0.79 | 1.01 |
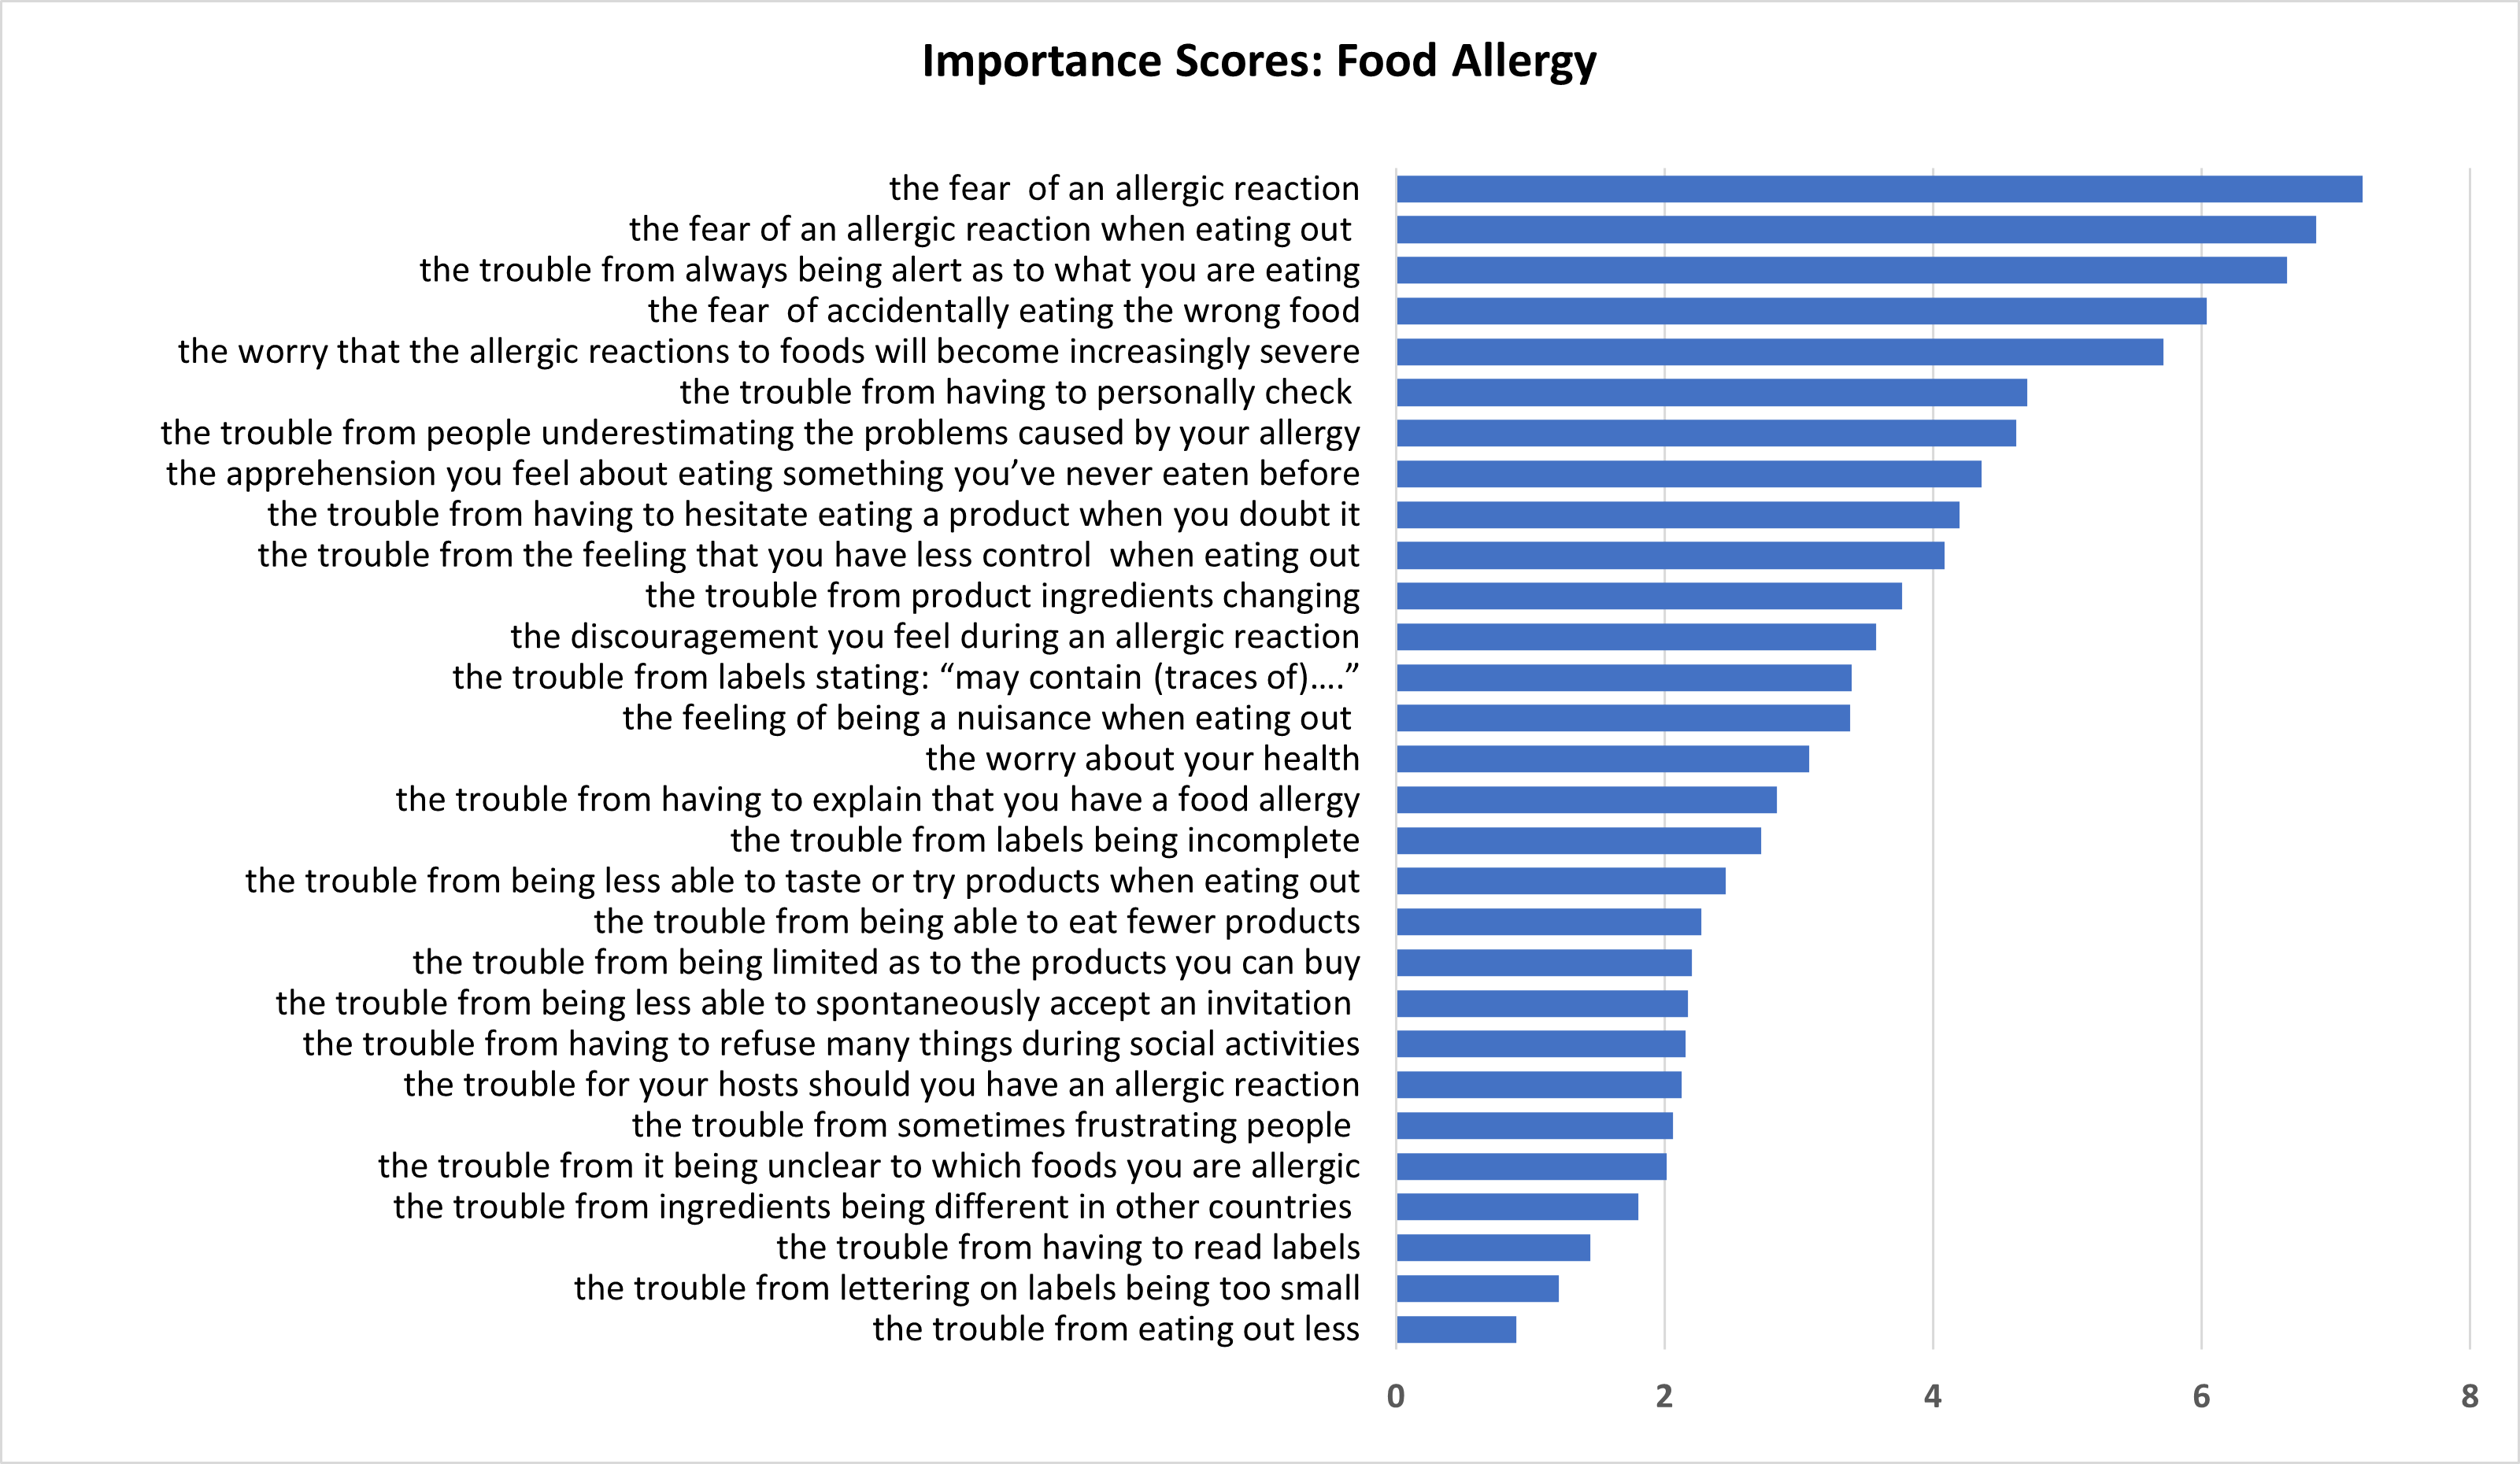
It is apparent from the Importance Scores displayed in Table 10.1 and in Figure 10.1 that there is great variation in the relative importance that the sample attach to the components of the FAQLQ. This contrasts with the equal weight the items are given in the calculation of the index.
The most important item (the fear of an allergic reaction) is 8 times as important as the least important impact (the trouble from eating out less).
The fear of having an allergic reaction when eating out is the second most important aspect of living with a food allergy. The impact of this on people’s quality of life is more than 3 times as great as the trouble people experience from it being unclear as to which foods they are allergic, and over 7 times as important as the trouble from eating out less.
The reactions and understanding of other people are also relatively important to people with food allergies - the trouble from people underestimating the problems caused by your allergy is twice as great as that from it being unclear as to which foods people are allergic.
Three of the 10 most important quality of life effects (ranked 2nd, 6th 10th) concern eating out:
- the fear of an allergic reaction when eating out
- the trouble from having to personally check if you can eat something when eating out
- the trouble from the feeling that you have less control when eating out
In contrast ‘the trouble from eating out less’ was ranked bottom of the 29 quality of life effects.
Quality of life impacts concerning labels were ranked 13th, 17th, 27th and 28th of the 29 effects:
- the trouble from labels stating: “may contain (traces of)….”
- the trouble from labels being incomplete
- the trouble from having to read labels
- the trouble from lettering on labels being too small
Figure 10.1. BWS Importance Scores: Food Allergy (FAQLQ)
10.3 BWS Results: Food Intolerance
The Importance Scores derived from estimation of the logit model on the Food Intolerance BWS choice data are displayed in Table 10.2.
Table 10.2. BWS Importance Scores: Food Intolerance (FIQLQ)
| Impact | Mean | 95% lower | 95% upper |
|---|---|---|---|
| the worry that you experience physical distress because of symptoms during a reaction | 10.65 | 10.15 | 11.16 |
| the trouble from having to always be alert as to what you are eating | 9.15 | 8.78 | 9.53 |
| the worry that you will be embarrassed by the symptoms of a reaction in social situations | 9.00 | 8.40 | 9.59 |
| the worry about the impact on your health | 7.66 | 7.16 | 8.16 |
| the discouragement you feel during an intolerant reaction | 7.27 | 6.79 | 7.74 |
| the trouble from having to be cautious about eating a product when you have doubts about it | 6.82 | 6.58 | 7.06 |
| the trouble from having to personally check whether you can eat something when eating out | 6.03 | 5.61 | 6.44 |
| the trouble from people underestimating the impact of food intolerance | 5.46 | 5.02 | 5.91 |
| the trouble from feeling that you have less control of what you eat when eating out | 4.96 | 4.72 | 5.19 |
| the feeling of being a nuisance when eating out because you have a food intolerance | 4.90 | 4.41 | 5.40 |
| the concern you feel about eating something you have never eaten before | 4.40 | 4.14 | 4.66 |
| the trouble from having less variety in the products that you can buy | 4.10 | 3.66 | 4.53 |
| the trouble from having less variety in the food that you can eat | 4.03 | 3.58 | 4.48 |
| the trouble from being less able to spontaneously accept an invitation to stay for a meal | 3.86 | 3.45 | 4.27 |
| the trouble from the ingredients of a product changing | 3.84 | 3.54 | 4.15 |
| the trouble from the quality and clarity of labelling is poor, in general | 3.30 | 2.96 | 3.64 |
| the trouble from being less able to taste or try various foods when eating out | 3.19 | 2.92 | 3.47 |
| the trouble from having to read labels | 1.37 | 1.15 | 1.60 |
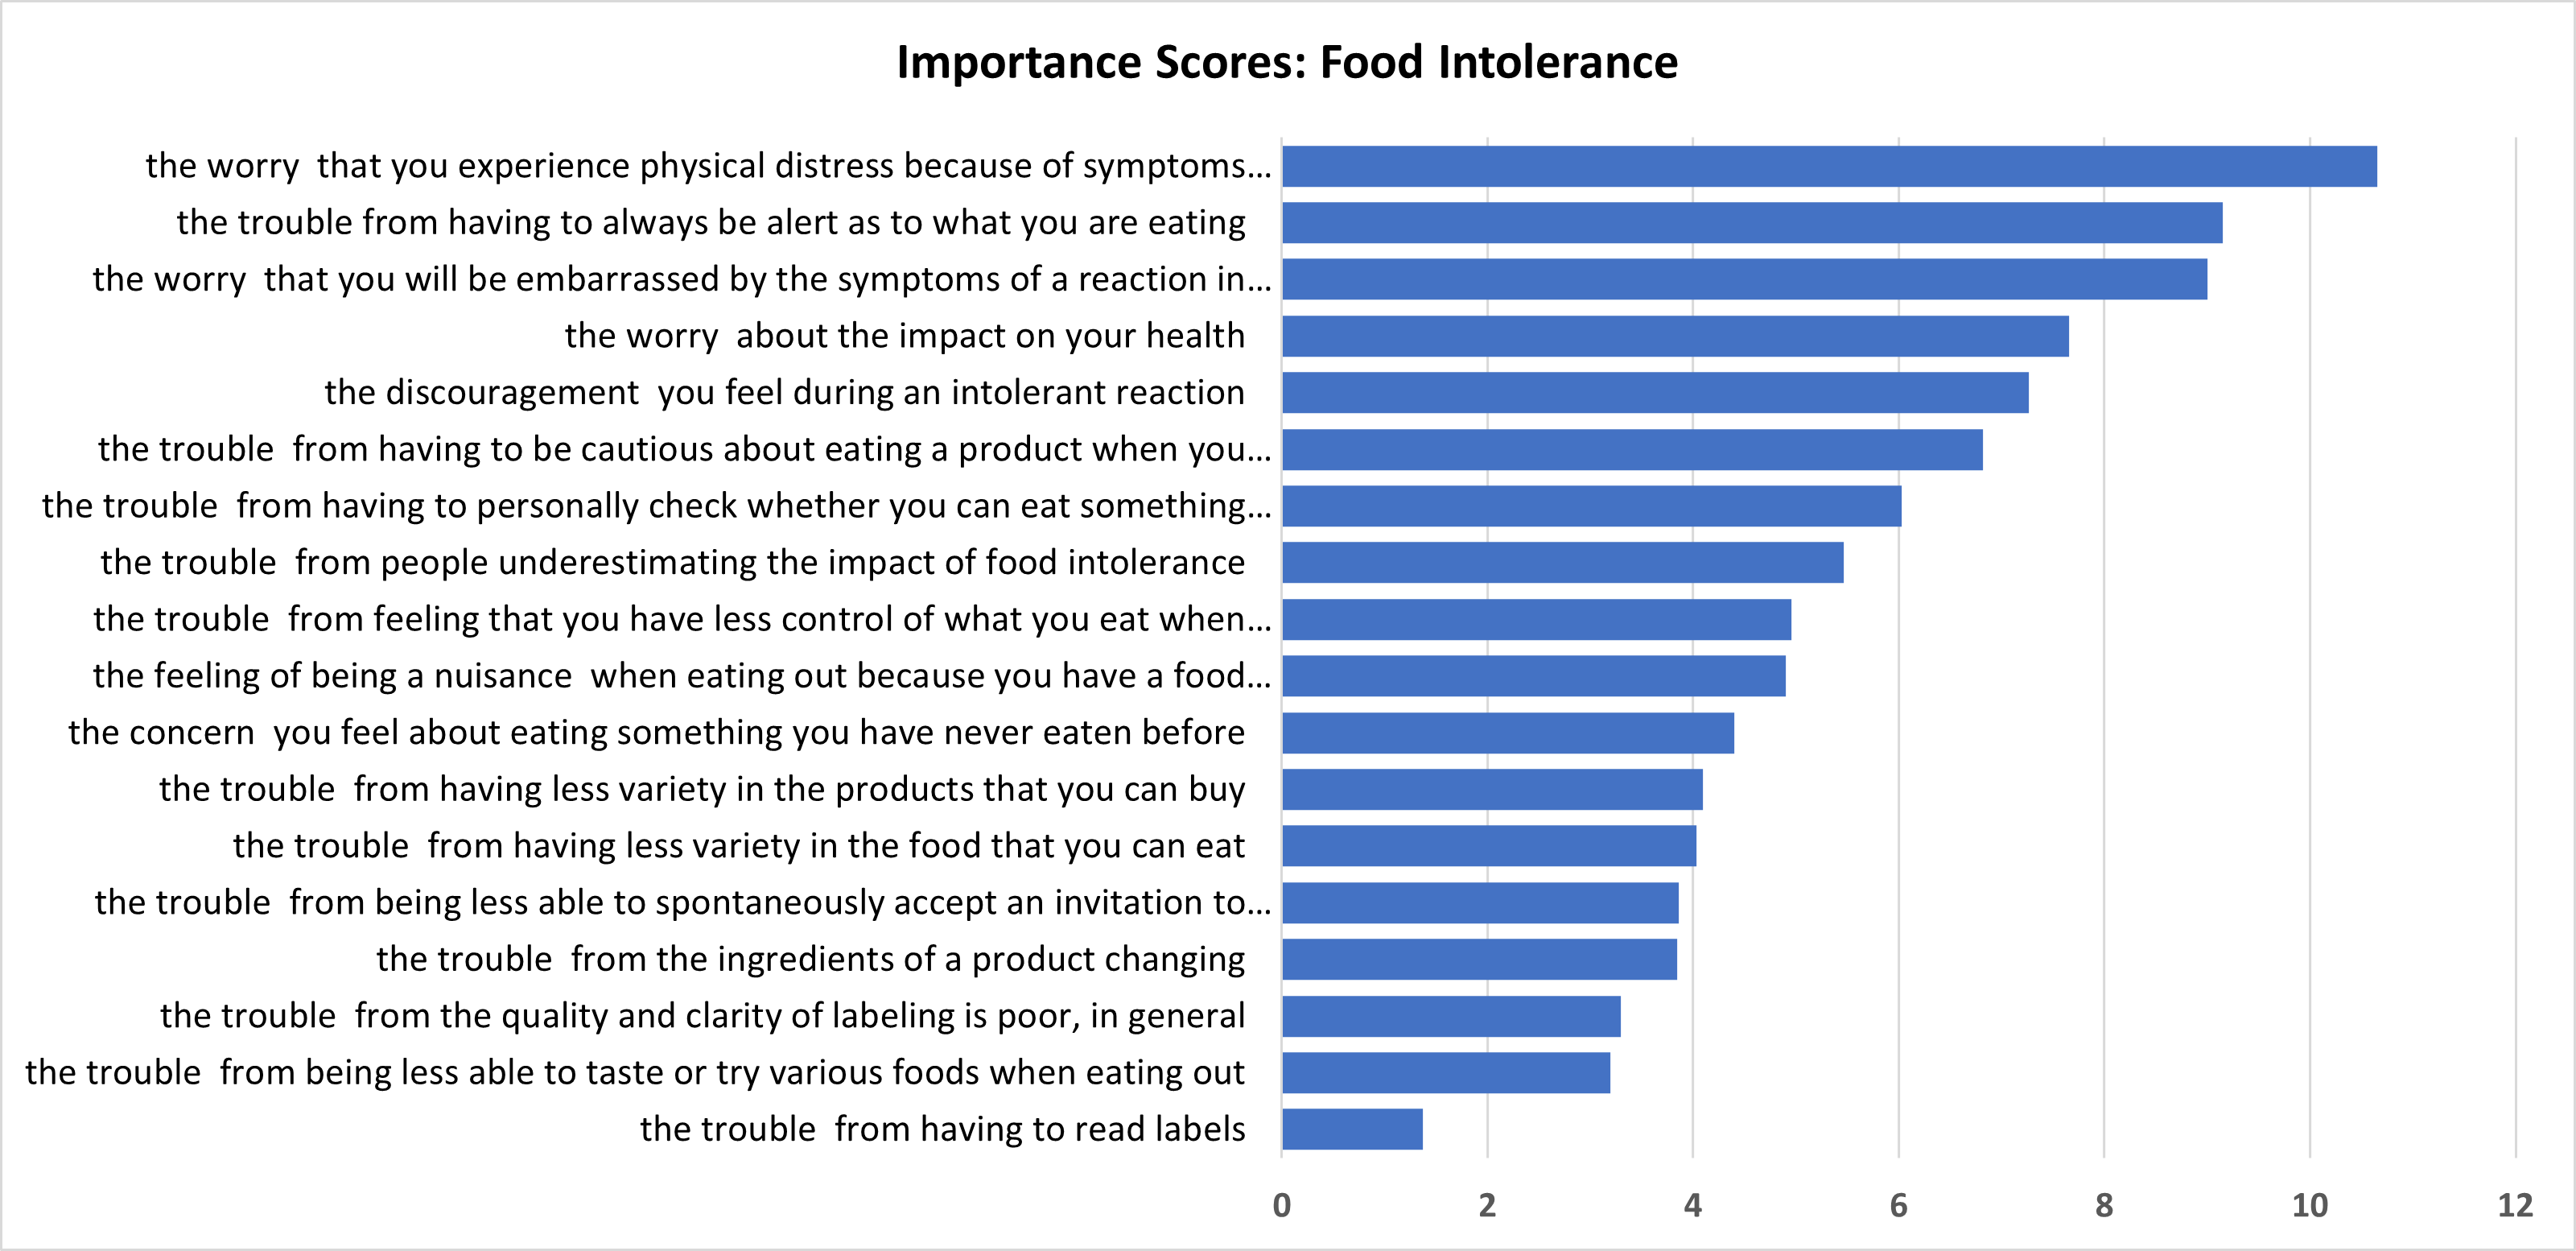
As with the results from the Food Allergy BWS, there is great variation in the relative importance of the quality-of-life impacts included in the CDQ instrument.
The impact which people regarded as having the greatest effect on their quality of life (the worry that you experience physical distress because of symptoms during a reaction) is 7.8 times more important to them than the lowest ranked impact (the trouble from having to read labels).
The worry that one will be embarrassed by the symptoms of a reaction in social situations is the 3rd most important impact; it is more than 2.5 times as important as the trouble from other people underestimating the impact of food intolerance.
The effect of people underestimating the impact of one’s food intolerance is the 8th most important item (out of 18) and is 1.7 times as important as the trouble from the quality and clarity of labelling being poor.
The 4 items explicitly concerned with eating out:
- the trouble from having to personally check whether you can eat something when eating out
- the trouble from feeling that you have less control of what you eat when eating out
- the feeling of being a nuisance when eating out because you have a food intolerance
- the trouble from being less able to taste or try various foods when eating out
were ranked 7th, 9th 10th and 17th respectively in terms of their impact on quality of life.
The two impacts concerning labels were ranked in the bottom three of quality of life effects:
- the trouble from the quality and clarity of labelling is poor, in general
- the trouble from having to read labels
Figure 10.2. BWS Importance Scores: Food Intolerance (FIQLQ)
10.4 BWS Results: Coeliac Disease
The Importance Scores derived from estimation of the logit model on the Coeliac coeliac Disease disease BWS choice data are displayed in Table 10.3.
Table 10.3: BWS Importance Scores: Coeliac Disease (CDQ)
| Impact | Mean | 95% lower | 95% upper |
|---|---|---|---|
| feeling afraid to eat out because my food may be contaminated | 10.442 | 10.125 | 10.759 |
| the concern that my long-term health will be affected | 9.201 | 8.812 | 9.589 |
| the concern that this disease will cause other health problems | 9.133 | 8.739 | 9.527 |
| the difficulty of traveling or taking long trips because of my disease | 8.823 | 8.432 | 9.214 |
| feeling limited by this disease | 8.390 | 8.049 | 8.732 |
| feeling I cannot live a normal life because of my disease | 6.752 | 6.376 | 7.128 |
| the trouble I have socializing because of my disease | 6.565 | 6.180 | 6.950 |
| the worry about an increased risk of cancer from this disease | 6.340 | 5.921 | 6.760 |
| feeling limited in eating meals with co workers | 5.767 | 5.387 | 6.146 |
| feeling there are not enough choices for treatment | 4.965 | 4.645 | 5.285 |
| the worry about increased risk of family members having coeliac disease | 4.745 | 4.385 | 5.105 |
| feeling unable to have special foods like birthday cake and pizza | 3.847 | 3.487 | 4.208 |
| the worry that I will suffer from this disease | 3.650 | 3.410 | 3.889 |
| feeling I think about food all the time | 3.408 | 3.095 | 3.721 |
| feeling socially stigmatized for having this disease | 3.239 | 2.920 | 3.558 |
| feeling depressed because of my disease | 1.779 | 1.574 | 1. |
| feeling overwhelmed about having this disease | 1.181 | 1.065 | 1.297 |
| feeling I don't know enough about the disease | 1.144 | 1.000 | 1.287 |
| feeling frightened by having this disease | 0.629 | 0.549 | 0.710 |
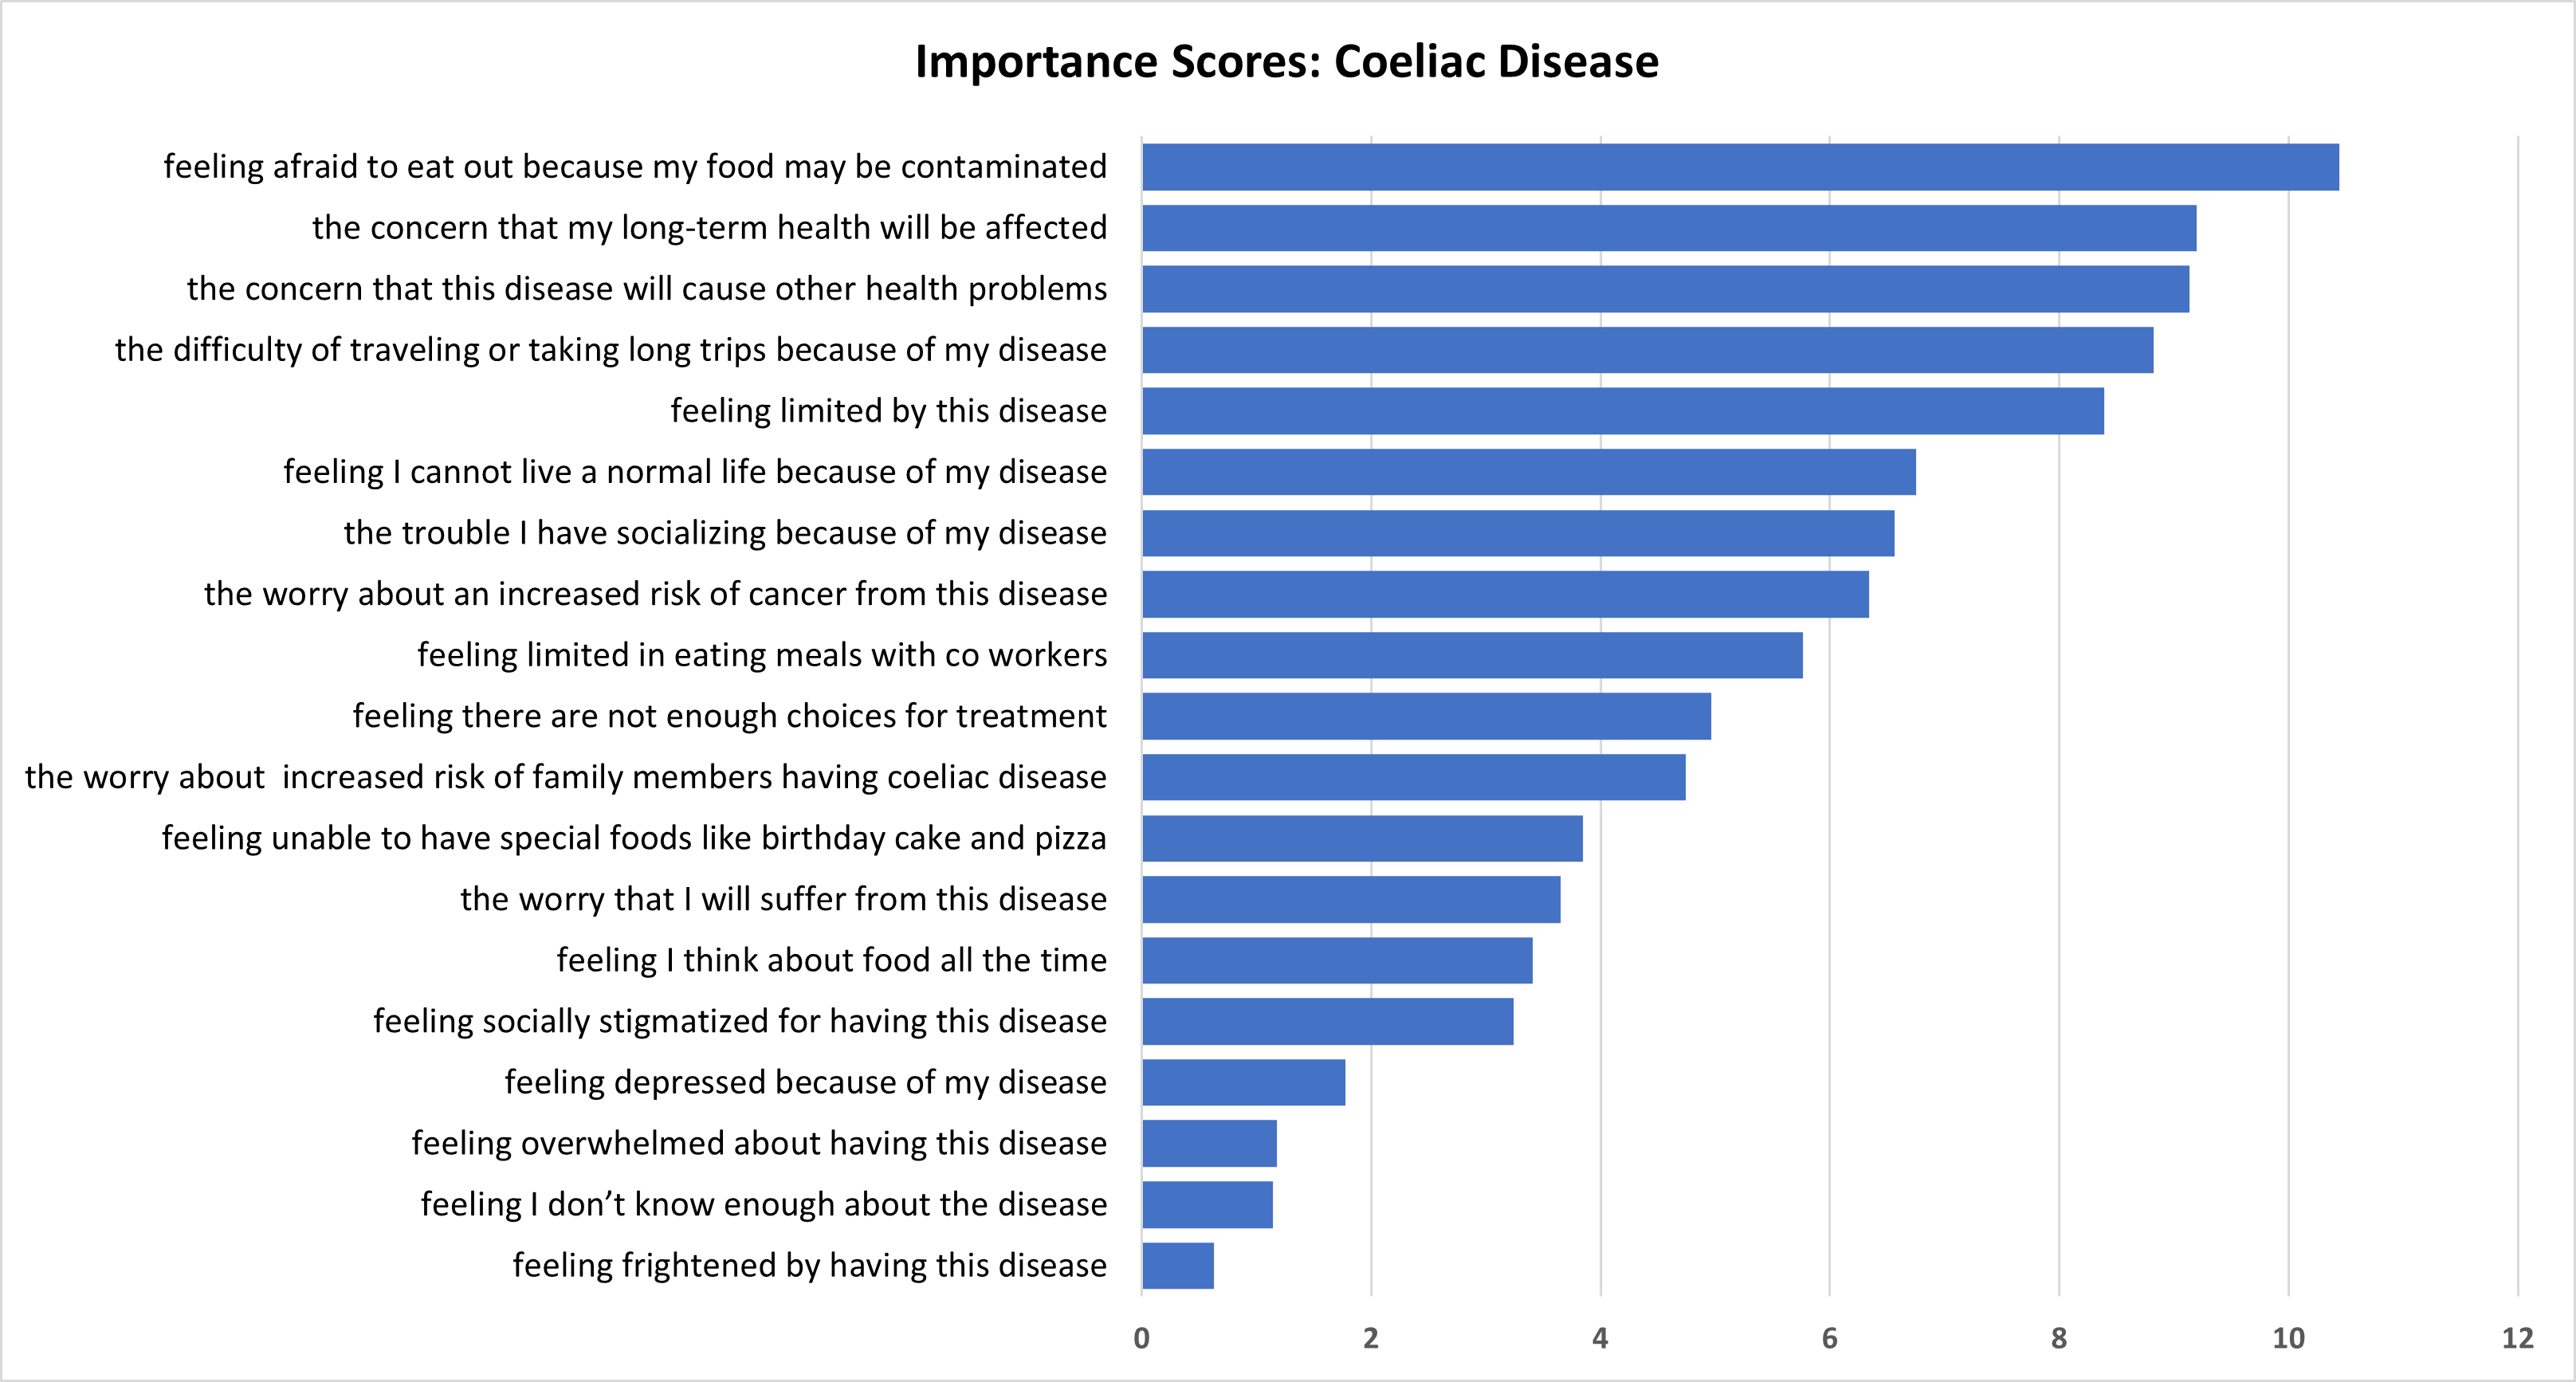
The range of importance of the items in the CDQ measure of QoL is the greatest of the 3 condition-specific scales: the most important item (feeling afraid to eat out because my food may be contaminated) is more than 16 times as important to people with coeliac disease than the lowest ranked impact (feeling frightened by having this disease).
Indeed, four of the five lowest ranked items concern the psychological impacts of having the condition: feeling socially stigmatized, depressed, overwhelmed, or frightened by having coeliac disease.
No impacts relating to labels are included in the CDQ. There is only one item explicitly concerning eating out (feeling afraid to eat out because my food may be contaminated), and it has the greatest impact on quality of life.
Figure 10.3. BWS Importance Scores: Coeliac coeliac Disease (CDQ)
Revision log
Published: 5 September 2022
Last updated: 12 September 2023