Impacts of Food Hypersensitivities on Quality of Life in the UK and Willingness to Pay (WTP) to remove those impacts
Discrete choice experiment results willingness to pay
Results of the discrete choice experiment.
WTP results are derived from estimation of mixed logit models on the choice data, with inferences drawn based on random utility theory.
9.1 Protest Behaviour
Respondents whose choice behaviour was regarded as protest behaviour were excluded from the estimation process. For example, those who indicated they always chose to pay for the pill because they did not take the price seriously, or those who said they did not trust the pill would work and so never chose to buy it.
Of those who completed the priced choice sets, 4.5% of adults and 2% of parents were excluded for such protest behaviour (for more details see Section 17). We regard these rates of protest behaviour as low, particularly given the context of trading off money against (a child’s) health.
9.2 Aggregate Models
9.2.1 Aggregate Models: Adults
The first two models on the adult DCE data are aggregated models, with the data pooled over all 3 conditions.
We estimate a model (AM1, see Table 9.1) in which choices are potentially affected by the duration of symptom removal (“years”) and the cost of the pill (“cost”).
We include an alternative specific constant (ASC) to account for the nature of the status quo “SQ” option over and above its levels of duration and cost. The ASC term on the status quo option is specified as a normally distributed random parameter with the parameters of that distribution estimated.
In this model (AM1) the signs of the Cost and Years terms are as expected – people prefer longer periods of symptom removal and lower costs.
The mean value of the SQ term is positive, implying people positively value the status quo option; they have an aversion to the change associated with taking the pill. The SQ term enters the model as a random term – the estimate of the standard deviation of the SQ term is positive - meaning that there is significant variation in the value placed on it. This means some people will have an aversion to it, that is, they positively value the change associated with taking the pill.
The WTP value for a year without a FHS, from model AM1, is £718.
Aggregate Model AM2 (reported in Table 9.1) is more complex in that the duration of the period of removal of FHS is entered as a quadratic expression, to allow for declining marginal utility from additional years, further in the future. Lower utility from additional years of FHS absence could be the result of diminishing marginal utility or the discounting of gains further in the future.
Model AM2 also accommodates heterogeneity in the severity of the FHS condition.
Two interaction terms are introduced which allow for differences in utility functions according to the VAS change people reported they anticipate from removal of their FHS. We use VAS difference because we need a measure that applies over all conditions (unlike FAQLQ etc which are specific to FHS conditions).
Interaction terms are specified between anticipated VAS change and:
- years of FHS removal
- the mean of the SQ ASC term.
Model AM2 results indicate that years without FHS are positive, cost is negative and the SQ ASC is again positive although there is significant heterogeneity in the marginal utility of the SQ term.
The Years2 term is negative, consistent with declining marginal utility from additional years of FHS, further in the future.
The VASdif*years term is positive (people who expect a bigger improvement in their QoL from removal of their FHS value years without that FHS more highly) but is not significant.
The VASdif*SQ term is negative and significant - people who expect a bigger improvement in their QoL from removal of their FHS value are less averse to moving away from the SQ (taking the pill). This is an intuitive result.
Table 9.1: Models AM1 and AM2 - Adults, aggregate model
| Category | Aggregate Model (AM1) | signif | Aggregate Model (AM2) | signif |
|---|---|---|---|---|
| years | 0.0919 | *** | 0.159 | *** |
| (s.error) | (0.00781) | - | (0.0223) | |
| years2 | - | - | -0.00331 | *** |
| (s.error) | - | - | (0.000902) | - |
| cost | -0.000128 | *** | -0.000129 | *** |
| (s.error) | (1.17e-05) | - | (1.18e-05) | - |
| VASdif x years | - | - | 0.000183 | - |
| (s.error) | - | - | (0.000400) | - |
| SQ (mean) | 1.206 | *** | 1.710 | *** |
| (s.error) | (0.100) | - | (0.144) | - |
| SQ (SD) | 2.937 | *** | 2.900 | *** |
| (s.error) | (0.208) | - | (0.207) | - |
| VAS dif x SQ | - | - | -0.0357 | *** |
| (s.error) | - | - | (0.0094) | - |
| Choices | 10,809 | - | 10,809 | - |
| Individuals | 1201 | - | 1201 | - |
The WTP values from AM2 (see Table 9.2) are moderated by the year (the first year is valued more highly than the 10th or 20th year) and by the person’s expected VAS improvement from removal of their FHS.
For someone anticipating a 5-point improvement in their VAS score (which is the median change in VAS between current and no-FHS score), the first year is valued at £1191, the 10th year is valued at £727, and the decline in value over time is such that a 20th year is not valued.
For someone anticipating a 21-point improvement in their VAS score (which is the 90th percentile change in VAS between current and no-FHS score), the first year is valued at £1214, the 10th year is valued at £750, and the decline in value over time is such that a 20th year is not valued.
Table 9.2 Marginal WTP for a single year removal. Adult aggregate results with quadratic duration term and VAS change interactions
| Category | WTP (£/year) | s.error | z | P | 95% CI lower | 95% CI upper |
|---|---|---|---|---|---|---|
| Years =1 dif=5 | 1191 | 144 | 8.29 | <0.001 | 909 | 1472 |
| Years=10 dif=5 | 727 | 50 | 14.45 | <0.001 | 629 | 826 |
| Years=20 dif=5 | 212 | 134 | 1.58 | 0.113 | -50 | 475 |
| Years=1 dif=21 | 1214 | 147 | 8.25 | <0.001 | 925 | 1502 |
| Years=10 dif=21 | 750 | 61 | 12.3 | <0.001 | 630 | 869 |
| Years=20 dif=21 | 234 | 139 | 1.69 | 0.091 | -37 | 507 |
9.2.2 Aggregate Models: Children
The first model reported is an aggregate model, over all 3 conditions.
We estimate a model (PAM1, see Table 9.3) in which choices are potentially affected by the duration of child’s symptom removal (“years”) and the cost of the pill. As with the adult models we include a normally distributed random term for the status quo ASC.
In this model (PAM1) the signs of the Cost and Years terms are as expected – people prefer longer periods of symptom removal and lower costs.
SQ is positive, implying people value the status quo option, they have an aversion to the change associated with their child taking the pill, although there is significant heterogeneity in the marginal utility of the SQ term.
Table 9.3 Base Aggregate Model
| Category | Child Aggregate Model (PAM1) | significance |
|---|---|---|
| years | 0.105 | *** |
| (s.error) | (0.00689) | - |
| cost | -0.000042 | *** |
| (s.error) | (2.43e-06) | - |
| SQ (mean) | 0.609 | *** |
| (s.error) | (0.120) | - |
| SQ (SD) | 2.265 | *** |
| (s.error) | (0.107) | - |
| Choices | 5,202 | - |
| Individuals | 578 | - |
The WTP value is the ratio of the Years and Cost terms giving values reported in Table 9.4.
Child, base aggregate model: Marginal WTP for a single year of removal of child’s FHS.
Table 9.4: Marginal WTP for year of removal of child's condition, base aggregate model
| Category | WTP (£/year) | s.error | z | P | 95% CI lower | 95% CI upper |
|---|---|---|---|---|---|---|
| Aggregate | 2501 | 155.97 | 16.04 | <0.001 | 2195 | 2807 |
The average WTP for a year of removal of their child’s FHS is £2501
9.3 Disaggregated Base Models
We now consider results for the 3 individual conditions.
9.3.1 Disaggregated Base Models: Adults
For each condition an initial, base, specification replicates that of model AM1: choices are potentially affected by the duration of symptom removal and the cost of the pill.
We include an alternative specific constant (ASC) to account for the nature of the option over and above its levels of duration and cost. The ASC term on the status quo option is specified as a normally distributed random parameter with the parameters of that distribution estimated.
Model results for each condition are shown in Table 9.5.
Table 9.5: Disaggregated Adult models by condition (models A1, C1, I1)
| Category | Allergy Model A1 | signif | Coeliac Model C1 | Signif | Intolerance Model I1 | Signif |
|---|---|---|---|---|---|---|
| years | 0.0671 | *** | 0.126 | *** | 0.0638 | *** |
| (s.error) | (0.0149) | - | (0.014) | - | (0.0131) | - |
| cost | -0.00108 | *** | -0.000165 | *** | -0.000106 | *** |
| (s.error) | (2.15E-05) | - | (0.0000243) | - | (1.59E-05) | - |
| SQ (mean) | 1.199 | *** | 0.790 | *** | 1.985 | *** |
| (s.error) | (0.184) | - | (0.141) | - | (0.215) | - |
| SQ (SD) | 2.610 | *** | 2.570 | *** | 3.458 | *** |
| (s.error) | (0.288) | - | (0.215) | - | (0.395) | - |
| Choices | 2736 | - | 4752 | - | 3321 | - |
| Individuals | 304 | - | 528 | - | 369 | - |
Models A1, C1 and I1 yield the WTP estimates for a year of FHS removal shown in Table 9.6.
Table 9.6 Marginal WTP for a year with condition removed
| Model type | WTP (£/year) | s.error | z | P | 95% CI lower | 95% CI upper |
|---|---|---|---|---|---|---|
| Allergy | 620 | 89 | 6.96 | <0.001 | 445 | 795 |
| Coeliac | 760 | 67 | 11.37 | <0.001 | 629 | 891 |
| Intolerance | 603 | 99 | 6.07 | <0.001 | 408 | 797 |
The WTP for FHS removal for people with coeliac disease (£760) is higher than that for people with Food Allergies (£620) and Intolerances (£603).
9.3.2 Disaggregated Base Models: Children
For each condition an initial, base, mixed logit specification replicates that of model PAM1: choices are affected by the duration of child’s symptom removal and the cost of the pill.
The ASC term on the status quo option is again specified as a normally distributed random parameter. Model results for each condition are shown in Table 9.7 and the resulting WTP values are displayed in Table 9.8.
Table 9.7. Disaggregated Models, Children (models: PA1, PC1, PI1)
| Category | Child Allergy Model PA1 | signif | Child Coeliac Model PC1 | Signif | Child Intolerance model PI1 | Signif |
|---|---|---|---|---|---|---|
| years | 0.115 | *** | ).0731 | *** | 0.0874 | *** |
| s.error | (0.00824) | - | (0.0216) | - | (0.0158) | - |
| cost | -0.0000397 | *** | -0.0000453 | *** | -0.0000516 | *** |
| s.error | (2.73e-06) | - | (8.41e-06) | - | (6.53e-06) | - |
| SQ (Mean) | 0.455 | *** | 0.724 | *** | 1.068 | *** |
| s.error | (0.138) | - | (0.404) | - | (0.291) | - |
| SQ (SD) | 2.142 | *** | 2.648 | *** | 2.449 | *** |
| s.error | (0.122) | - | (0.381) | - | (0.267) | - |
| Choices | 3573 | - | 576 | - | 1053 | - |
| Individuals | 397 | - | 64 | - | 117 | - |
Table 9.8. Children, base models: Marginal WTP for a single year increase
| Category | WTP (£/year) | s.error | z | P | 95 CI lower | 95% CI upper |
|---|---|---|---|---|---|---|
| Allergy | 2902 | 204 | 14.21 | <0.001 | 2502 | 3302 |
| Coeliac | 1611 | 422 | 3.81 | <0.001 | 783 | 2439 |
| Intolerance | 1695 | 274 | 6.18 | <0.001 | 1157 | 2232 |
The average WTP for a year of removal of their child’s food allergy is £2902, for coeliac disease it is £1611 and for Food Intolerance it is £1695.
9.4 Disaggregated Models using Condition-Specific QoL Measures
9.4.1 Models using Condition-Specific QoL Measures: Adults
In the next 3 adult models, reported in Table 9.9, condition-specific health effects are included. Unlike the aggregate model which uses the generic VAS score, the disaggregated models make use of condition-specific measures of condition severity (FAQLQ, FIQLQ, CDQ). Insignificant interactions are removed from the model.
We include interaction terms between the severity of the condition (FAQLQ, FIQLQ, CDQ) and:
- the value of additional years of FHS removal
- the value of the status quo.
Table 9.9. Models Disaggregated by Condition, Adults
| Category | Allergy model A2 | signif | Coeliac Model C2 | Signif | Intolerance Model I2 | Signif |
|---|---|---|---|---|---|---|
| years | -0.0484 | - | 0.126 | *** | -0.0461 | ** |
| s.error | (0.0401) | - | (0.0140) | - | (0.0386) | - |
| cost | -0.000109 | *** | -0.000166 | *** | -0.000105 | *** |
| s.error | (2.11e-05) | - | (2.47e-05) | - | (1.73e-05) | - |
| FIQ x years | - | - | - | - | 0.0220 | *** |
| s.error | - | - | - | - | (0.00760) | - |
| FAQ x years | 0.0221 | *** | - | - | - | - |
| s.error | (0.00746) | - | - | - | - | - |
| FIQ x SQ | - | - | - | - | -0.667 | *** |
| s.error | - | - | - | - | (0.150) | - |
| CDQ x SQ | - | - | -0.0281 | *** | - | - |
| s.error | - | - | (0.00771) | - | - | - |
| FAQ x SQ | -0.697 | *** | - | - | - | - |
| s.error | (0.141) | - | - | - | - | - |
| SQ (mean) | 4.587 | *** | 2.169 | *** | 5.021 | *** |
| s.error | (0.731) | - | (0.396) | - | (0.771) | - |
| SQ (SD) | 2.346 | *** | 2.517 | *** | 3.070 | *** |
| s.error | (0.246) | - | (0.216) | - | (0.362) | - |
| Choices | 2736 | - | 4752 | - | 3321 | - |
| Individuals | 304 | - | 528 | - | 369 | - |
Robust standard errors in parentheses
significance:*** p<0.01, ** p<0.05, * p<0.1
Food Allergy model A2
In this model the sign of Cost is as expected – people prefer lower costs. SQ is positive, implying people value the status quo option, they have an aversion to the change associated with taking the pill, although there is variation in that preference parameter.
The value of additional years without the food intolerance only becomes positive when the condition (the value of FAQLQ) is sufficiently severe (large) - the more severe the individuals’ FHS condition (higher FAQLQ score) the higher the value attached to an additional year of FHS removal.
The more severe the individuals’ FHS condition (higher FAQLQ score) the lower the value attached to the status quo – the less averse to change (taking the pill) people are.
Food Intolerance model I2
In this model the sign of Cost is as expected – people prefer lower costs. SQ is positive, implying people value the status quo option, they have an aversion to the change associated with taking the pill, although there is variation in that preference parameter.
The value of additional years without the food allergy only becomes positive and significant when the condition (the value of FIQLQ) is sufficiently severe (large) - the more severe the individuals’ FHS condition (higher FIQLQ score) the higher the value attached to an additional year of FHS removal.
The more severe the individuals’ FHS condition (higher FIQLQ score) the lower the value attached to the status quo – the less averse to change (taking the pill) people are.
Coeliac Disease model C2
In this model the sign of Cost is as expected – people prefer lower costs. SQ is positive, implying people value the status quo option, they have an aversion to the change associated with taking the pill, although there is variation in that preference parameter.
The utility increase from years without coeliac disease is positive and significant. The interaction term between severity (CDQ score) and years without FHS is not significant (excluded from model).
The more severe the individuals’ FHS condition (higher CDQ score) the lower the value attached to the status quo – the less averse to change (taking the pill) people are.
WTP estimates from the three disaggregated models are reported in Table 9.10.
For Food Allergy and Food Intolerance, the WTP for years of FHS removal are moderated by severity of condition (FAQLQ and FIQLQ score) – the WTP values in the table are for the sample median value of FAQLQ and FIQLQ.
Table 9.10: Marginal WTP for a year with FHS removed (calculated at median score of FAQLQ and FIQLQ)
| Category | WTP (£/year) | s.error | z | P | 95% CI lower | 95% CI upper |
|---|---|---|---|---|---|---|
| Allergy | 500 | 94 | 5.34 | <0.001 | 317 | 684 |
| Coeliac | 760 | 67 | 11.34 | <0.001 | 629 | 891 |
| Intolerance | 633 | 104 | 4.7 | <0.001 | 429 | 837 |
9.5 Preferred Model Results: Adults
9.5.1 Preferred Model Specifications: Adults
In addition to individual-level measures of health impacts of the conditions (VAS, EQ5D, FAQLQ, FIQLQ and CDQ) a range of characteristics were included in the models estimated.
One of the findings from the Focus groups was that age played a role – in terms of some (older) adults reporting that they had become used to their FHS, or parents indicating a difference in how they regarded temporary FHS removal for children of different ages.
Age effects were tested for and found to be present in the Allergy model: older people were more averse to moving from away the status quo (taking the pill and temporarily removing their FHS).
In addition, quadratic duration effects were tested for and found to be present in the allergy and coeliac model: additional years of FHS removal yielded smaller utility gains the further into the future they occurred.
These effects are retained in the preferred adult models A3, C3 and I3 reported in Table 9.11.
Table 9.11: Preferred Specifications of Disaggregated Models, Adults
| Category | Allergy model A3 | signif | Coeliac Model C3 | Signif | Intolerance Model I3 | Signif |
|---|---|---|---|---|---|---|
| years | - | - | 0.235 | *** | -0.0461 | * |
| s.error | - | - | (0.0327) | - | (0.0386) | - |
| years2 | -0.00283 | ** | -0.00527 | *** | - | - |
| s.error | (0.00132) | - | (0.00129) | - | - | - |
| cost | -0.000110 | *** | -0.000167 | *** | -0.000104 | *** |
| s.error | (2.09e-05) | - | (2.50e-05) | - | (1.73e-05) | - |
| FIQ x years | - | - | - | - | 0.0220 | *** |
| s.error | - | - | - | - | (0.00760) | - |
| FAQ x years | 0.0241 | *** | - | - | - | - |
| s.error | (0.0058) | - | - | - | - | - |
| FIQ x SQ | - | - | - | - | -0.667 | *** |
| s.error | - | - | - | - | (0.150) | - |
| CDQ x SQ | - | - | -0.0283 | *** | - | - |
| s.error | - | - | (0.00779) | - | - | - |
| FAQ x SQ | -0.663 | *** | - | - | - | - |
| s.error | (0.135) | - | - | - | - | - |
| SQ (mean) | 0.0288 | ** | 2.506 | *** | 5.021 | *** |
| s.error | (0.740) | - | (0.405) | - | (0.771) | - |
| SQ (SD) | 2.318 | *** | 2.536 | *** | 3.069 | *** |
| s.error | (0.239) | - | (0.217) | - | (0.362) | - |
| Choices | 2727 | - | 4752 | - | 3321 | - |
| Individuals | 303 | - | 528 | - | 369 | - |
Robust standard errors in parentheses
significance:*** p<0.01, ** p<0.05, * p<0.1
Note: in model A3 the coefficient on years was not significant, and hence the variable has been dropped from the model – but duration effects are still included via the term interacting years with FAQLQ score
9.6 WTP Values from Preferred Specifications: Adults
9.6.1 Adult WTP values: Food Allergy
The WTP values reported in Table 9.12 depend on the severity of the condition’s impacts (FAQLQ score) and the year in which the allergy’s effects are removed. They are reported here for 10th, 50th and 90th percentile values of FAQLQ and in years 1, 10 and 20.
At a FAQLQ score of 2.44 (10th percentile value) the WTP of £482 in year 1 falls to zero in year 10. At the sample median FAQLQ value (5.1) the WTP of £1064 falls to zero by year 16.
Table 9.12: Marginal WTP for removal of food allergy, at 3 levels of FAQLQ and year of removal
| Category | WTP (£/year) | s.error | z | P | 95% CI lower | 95% CI upper |
|---|---|---|---|---|---|---|
| FAQLQ=2.44 years=1 | 428 | 102 | 4.72 | <0.001 | 282 | 683 |
| FAQLQ=5.10 years=1 | 1064 | 239 | 4.45 | <0.001 | 596 | 1532 |
| FAQLQ=6.45 years=1 | 1359 | 308 | 4.41 | <0.001 | 755 | 1964 |
| FAQLQ=2.44 years=10 | 18 | 139 | 0.13 | 0.895 | -255 | 292 |
| FAQLQ=5.10 years=10 | 600 | 87 | 6.89 | <0.001 | 429 | 771 |
| FAQLQ=6.45 years=10 | 896 | 126 | 7.10 | <0.001 | 648 | 1143 |
| FAQLQ=2.44 years=20 | -497 | 387 | -1.28 | 0.199 | -1255 | 261 |
| FAQLQ=5.10 years=20 | 85 | 270 | 0.31 | 0.753 | -444 | 614 |
| FAQLQ=6.45 years=20 | 380 | 220 | 1.73 | 0.083 | -50 | 810 |
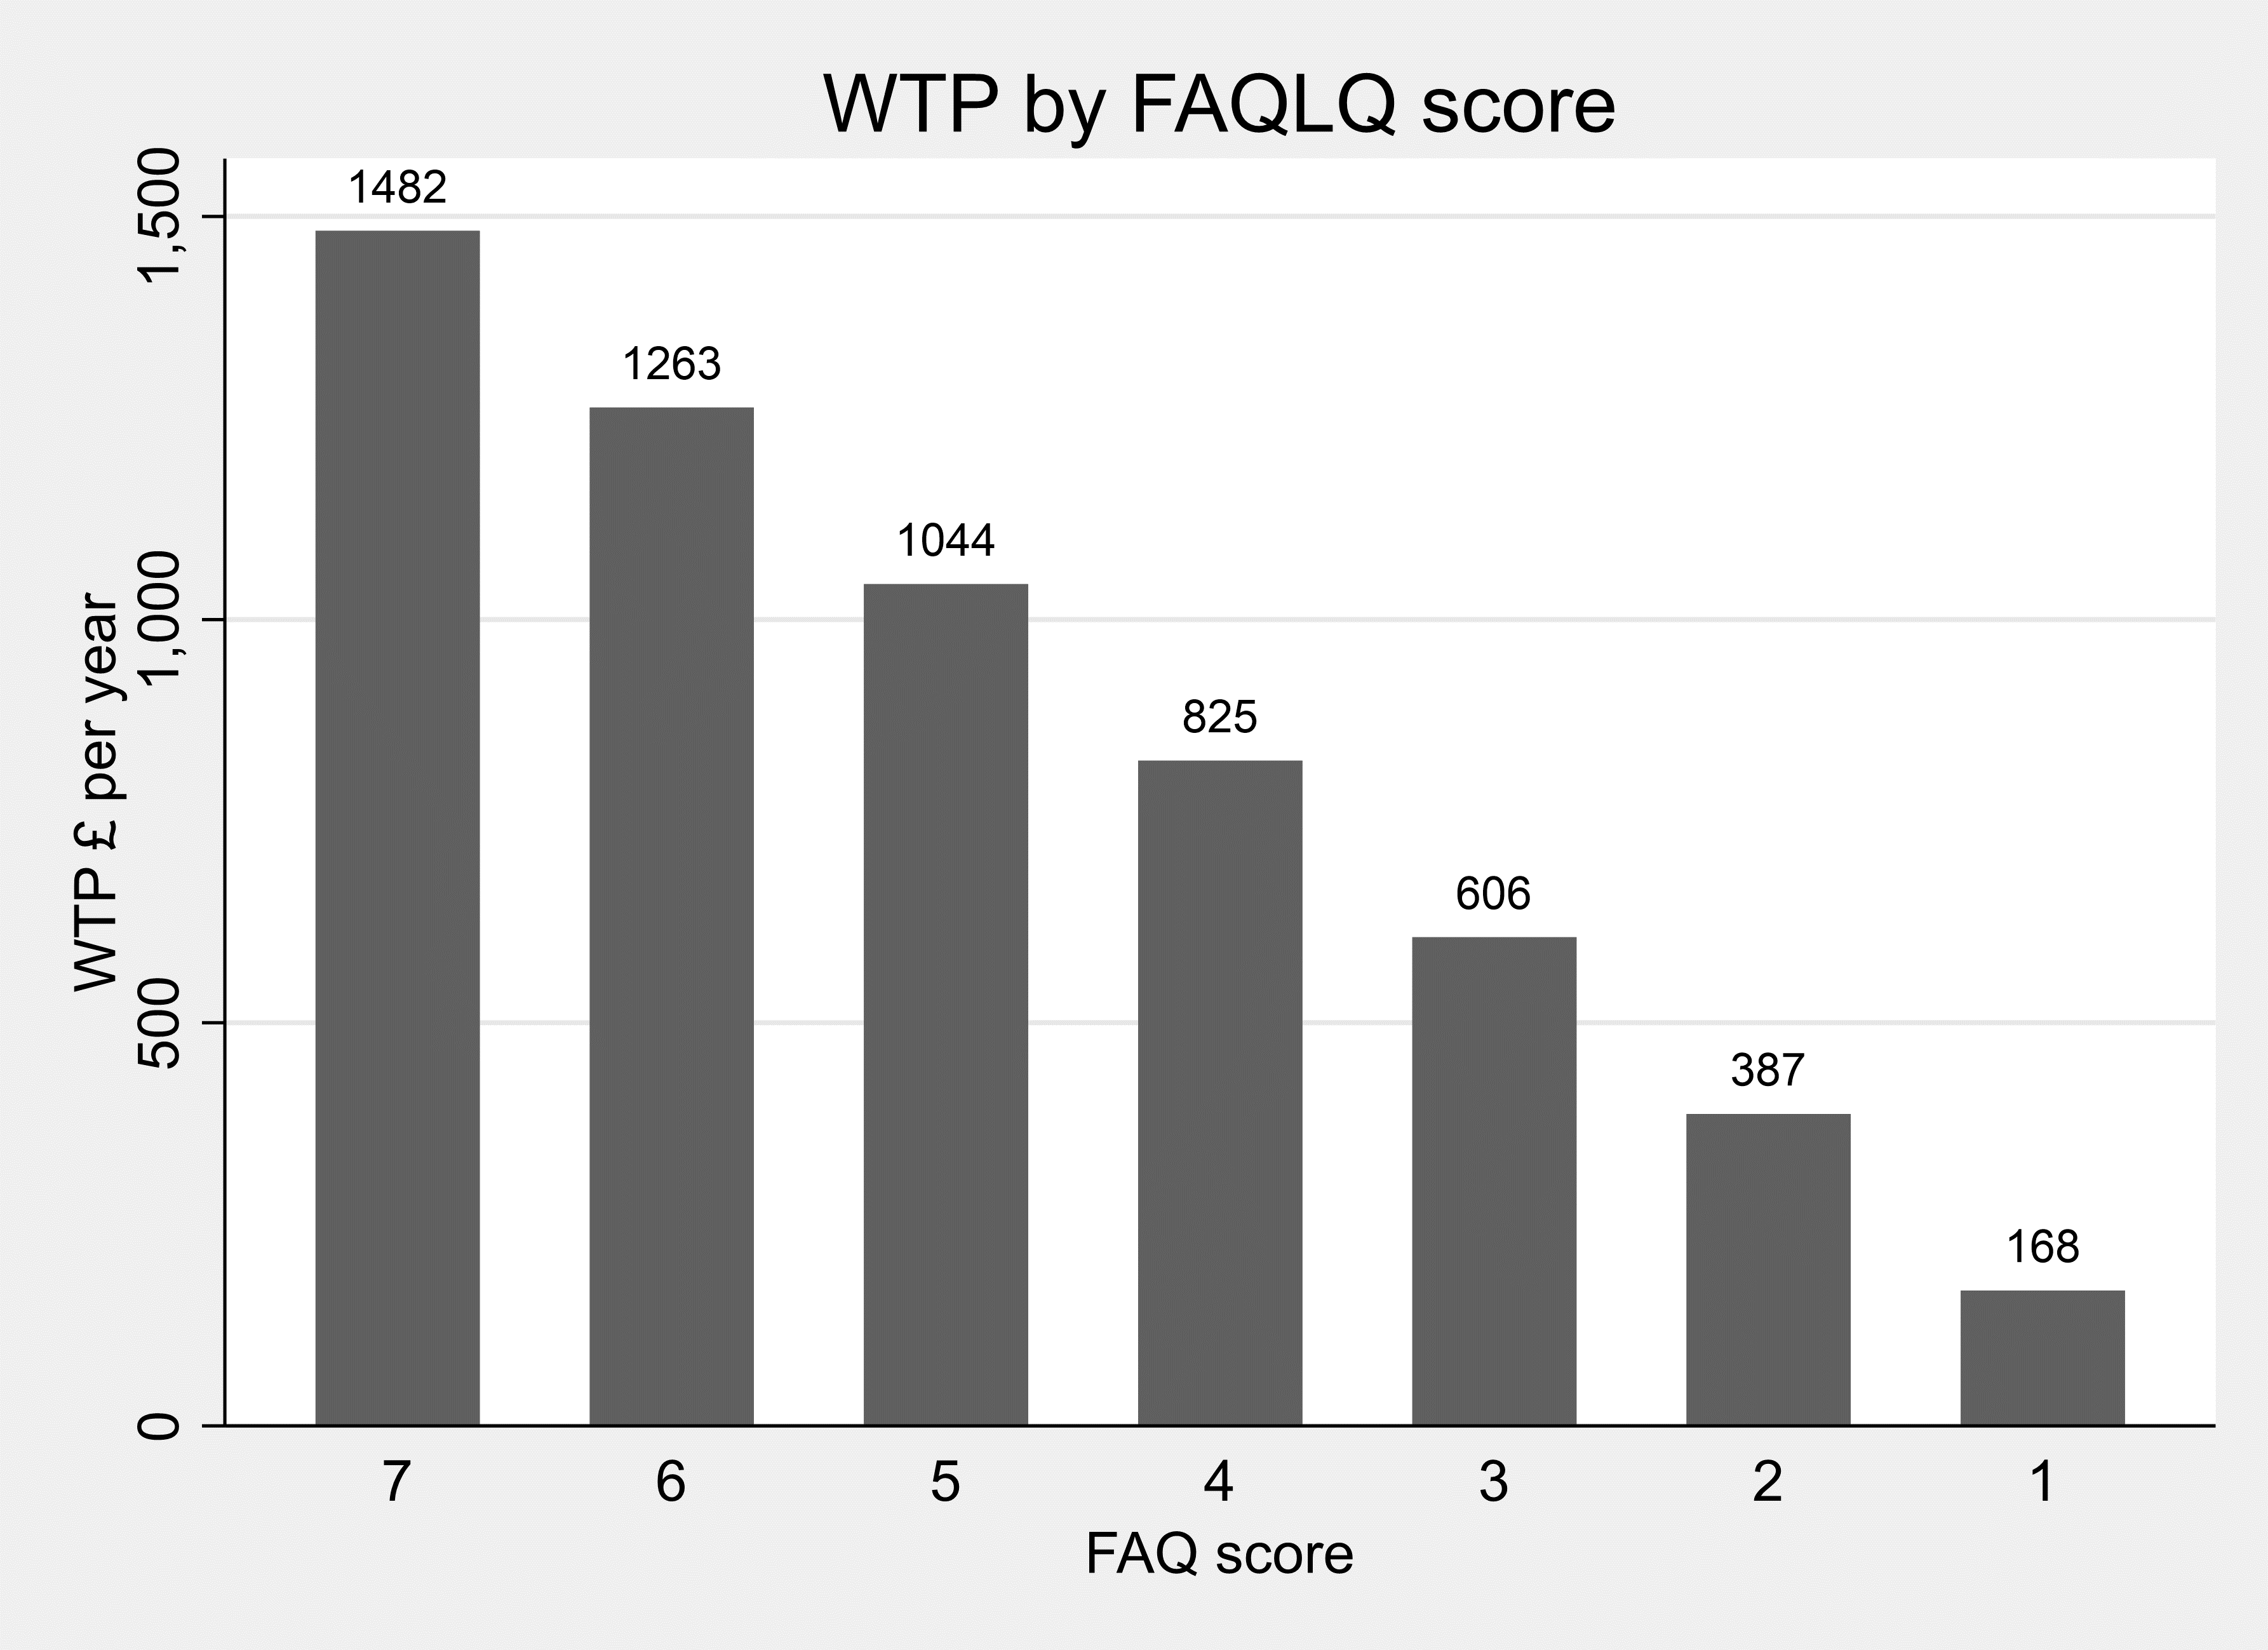
Figure 9.1 below reports the marginal WTP for an additional year of health improvement, evaluated at the initial year. This is significant at all levels of FAQLQ, although it falls to a relatively low level (£168) for a FAQLQ score of 1.
Figure 9.1. WTP for one year without food allergy, by FAQLQ score
9.6.2 Adult WTP values: Coeliac Disease
WTP values, displayed in Table 9.13, are invariant over CDQ scores (although the higher the CDQ score the less averse people are to moving away from the SQ option people) but vary over time.
Table 9.13. Marginal WTP for a year without FHS, at 3 different levels of year of improvement
| Category | WTP (£/year) | s.error | z | P | 95% CI lower | 95% CI upper |
|---|---|---|---|---|---|---|
| Years=1 | 1342 | 188 | 7.16 | <0.001 | 975 | 1710 |
| Years=10 | 775 | 71 | 10.94 | <0.001 | 636 | 914 |
| Years=20 | 144 | 151 | 0.95 | 0.340 | -152 | 440 |
The marginal value of an additional year without coeliac disease is not significantly different from zero by Year 19 (which is evident in Figure 9.2).
Figure 9.2. WTP per year without coeliac disease
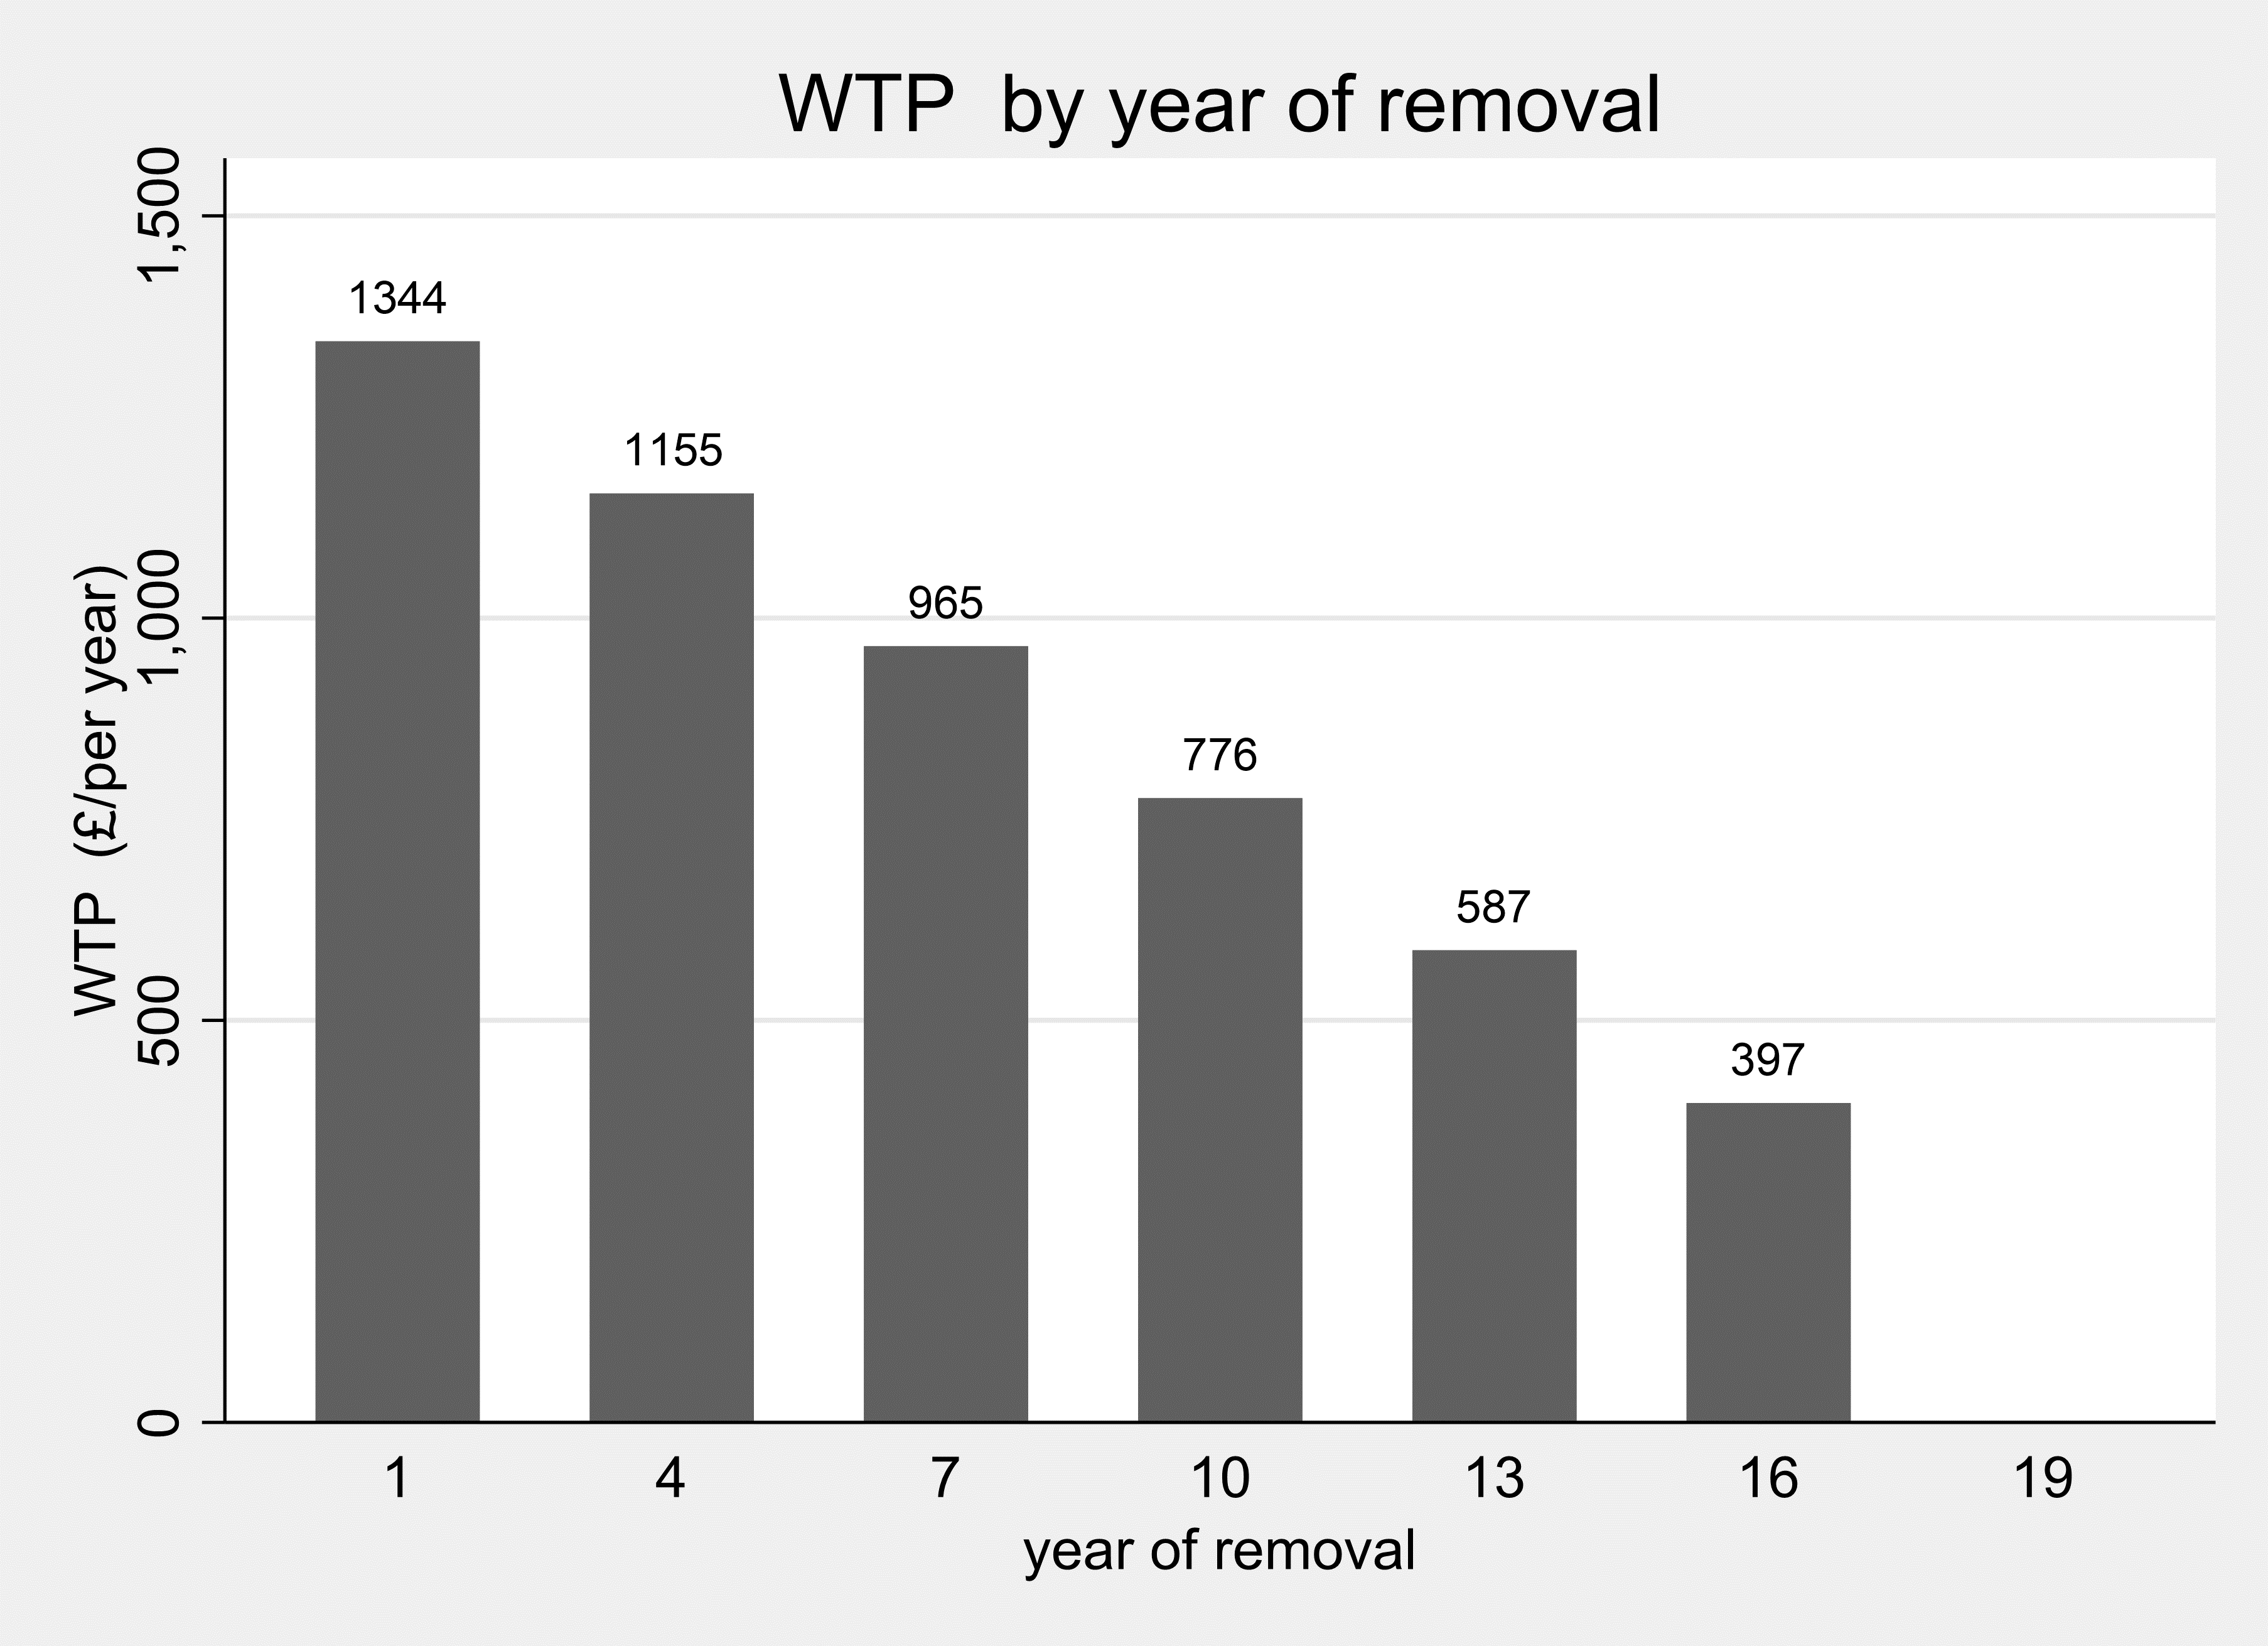
The WTP for a year without coeliac disease falls to zero at Year 19.
9.6.3 Adult WTP values: Food Intolerance
The WTP to remove food intolerance depend on the severity of the condition’s impacts (FIQLQ score) but not the year of removal. The WTP estimates reported in Table 9.14 are for the 10th, 50th and 90th percentile values of FIQLQ.
Table 9.14. Marginal WTP for a single year increase. Intolerance, at 3 different levels of FIQLQ
| Category | WTP (£/year) | s.error | z | P | 95% CI lower | 95% CI upper |
|---|---|---|---|---|---|---|
| FIQ=2.38 | 61 | 211 | 0.29 | 0.773 | -353 | 474 |
| FIQ=4.66 | 540 | 97 | 5.56 | <0.001 | 349 | 731 |
| FIQ=6.44 | 915 | 177 | 5.17 | <0.001 | 568 | 1262 |
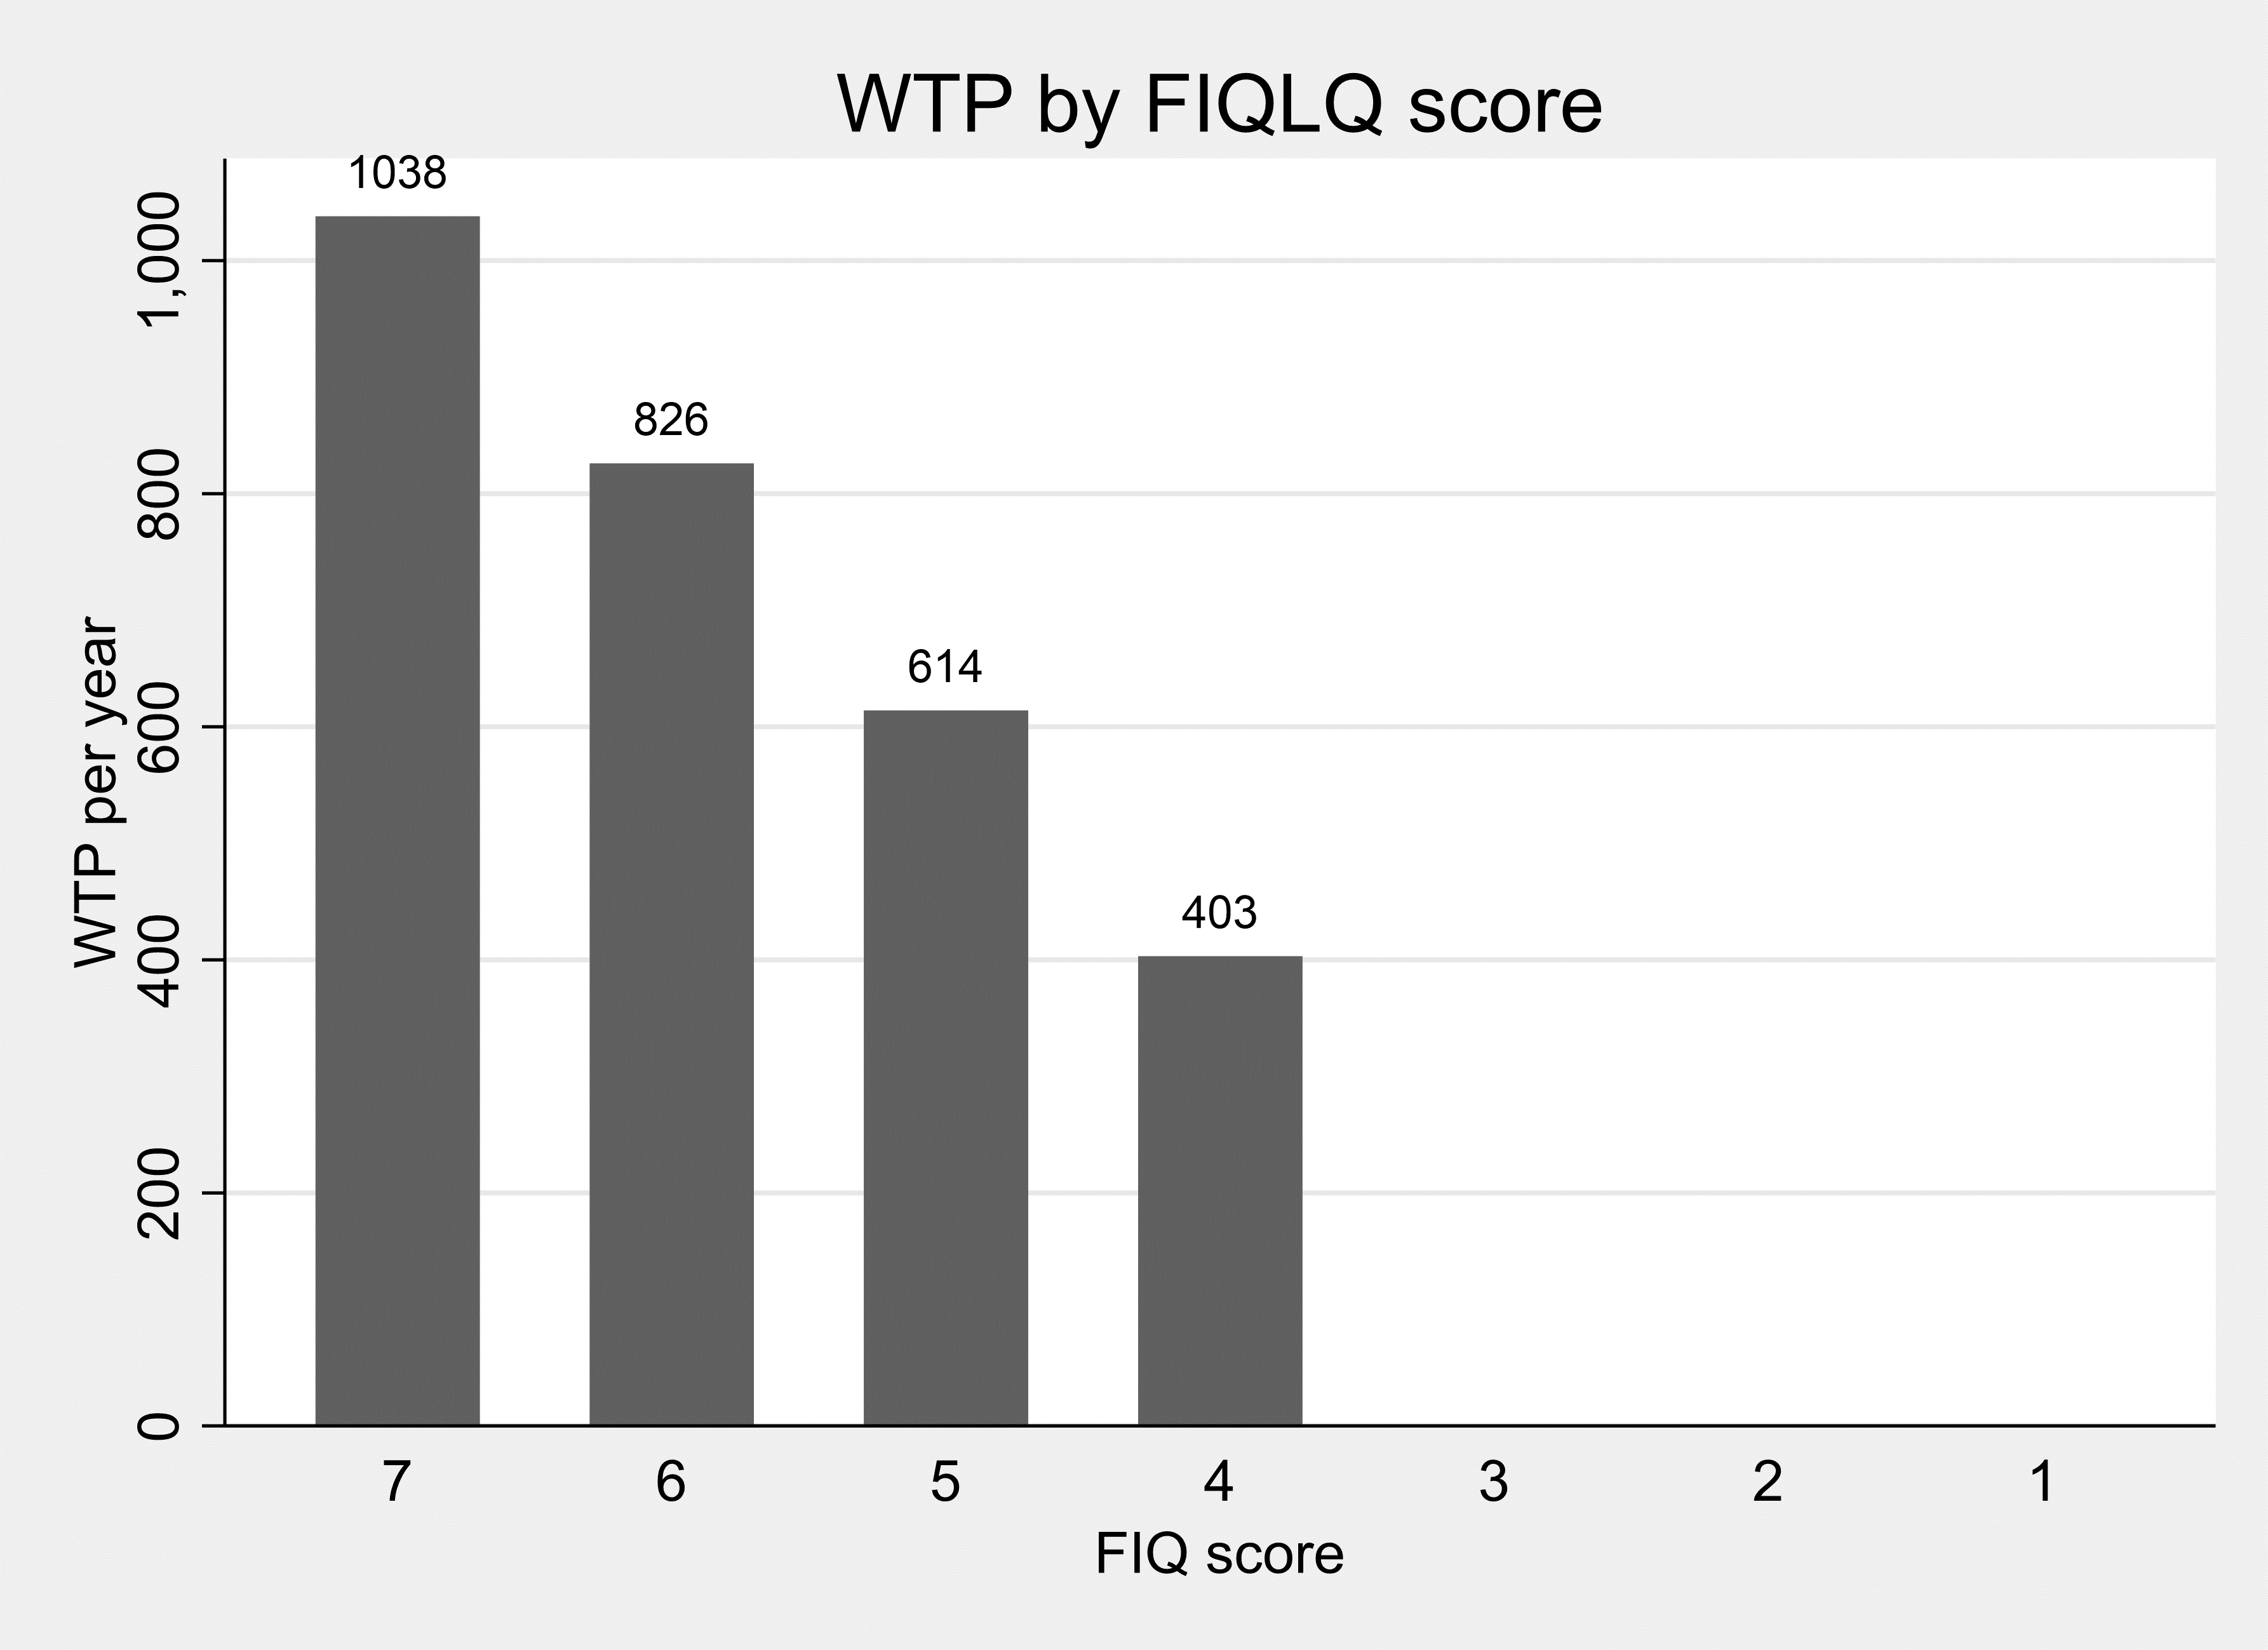
A FIQLQ score of 3 or below implies that the WTP for removal of the Food Intolerance is not significantly different from zero (which is evident in Figure 9.3).
Figure 9.3. WTP for one year without food intolerance, by FIQLQ score
9.7 Preferred Model Results: Children
9.7.1 Preferred Model Specifications: Children
In these preferred mixed logit model specifications, the marginal utility of additional years with the child’s FHS removed, and/or the SQ ASC, are conditioned by the child’s age and the predicted improvement in the child’s health condition score. The three sets of model results are reported in Table 9.15.
In the Allergy model (PA2) the younger the child the lower the value derived from years with the allergy removed and the less averse the parent is to change (their child taking the pill). Also, the higher the condition score (FAQLQ) the less averse the parent is to change (their child taking the pill)
In the coeliac model (PC2) no child age effects are significant but the greater the anticipated improvement in CCDUX score, the greater the value the parent places on reducing a year of the condition.
In the Intolerance model (PI2) there are no significant effects of child age but the higher the FIQLQ score (for example, the worse the condition) the more likely they are to take the pill.
Table 9.15. Preferred Specifications of Disaggregated Models, Child sample
| Category | Child Allergy model PA2 | signif | Child Coeliac Model PC2 | Signif | Child Intolerance Model PI2 | Signif |
|---|---|---|---|---|---|---|
| years | 0.140 | *** | -0.110 | - | 0.0873 | *** |
| s.error | (0.0155) | - | (0.0810) | - | (0.0158) | - |
| years x childage | -0.00313 | * | - | - | - | - |
| s.error | (0.00161) | - | - | - | - | - |
| Years x CCDUX | - | - | 0.00438 | ** | - | - |
| s.error | - | - | (0.00188) | - | - | - |
| cost | -0.0000395 | *** | 0.0000454 | *** | -0.0000517 | *** |
| s.error | (2.72e-06) | - | (2.70e-05) | - | (6.54e-06) | - |
| SQ (mean) | 2.953 | *** | 0.714 | * | 4.252 | *** |
| s.error | (0.422) | - | (0.398) | - | (0.751) | - |
| SQ (SD) | 2.106 | *** | 2.6768 | *** | 2.219 | *** |
| s.error | (0.116) | - | (0.386) | - | (0.244) | - |
| childage x SQ | -0.0578 | * | - | - | - | - |
| s.error | (0.0307) | - | - | - | - | - |
| FIQ x SQ | - | - | - | - | -0.844 | *** |
| s.error | - | - | - | - | (0.176) | - |
| FAQ x SQ | -0.486 | *** | - | - | - | - |
| s.error | (0.086) | - | - | - | - | - |
| Choices | 3573 | - | 576 | - | 1053 | - |
| Individuals | 397 | - | 64 | - | 117 | - |
Robust standard errors in parentheses
significance:*** p<0.01, ** p<0.05, * p<0.1.
9.8 WTP Values from Preferred Specifications: Children
9.8.1 Child WTP values: Food Allergy
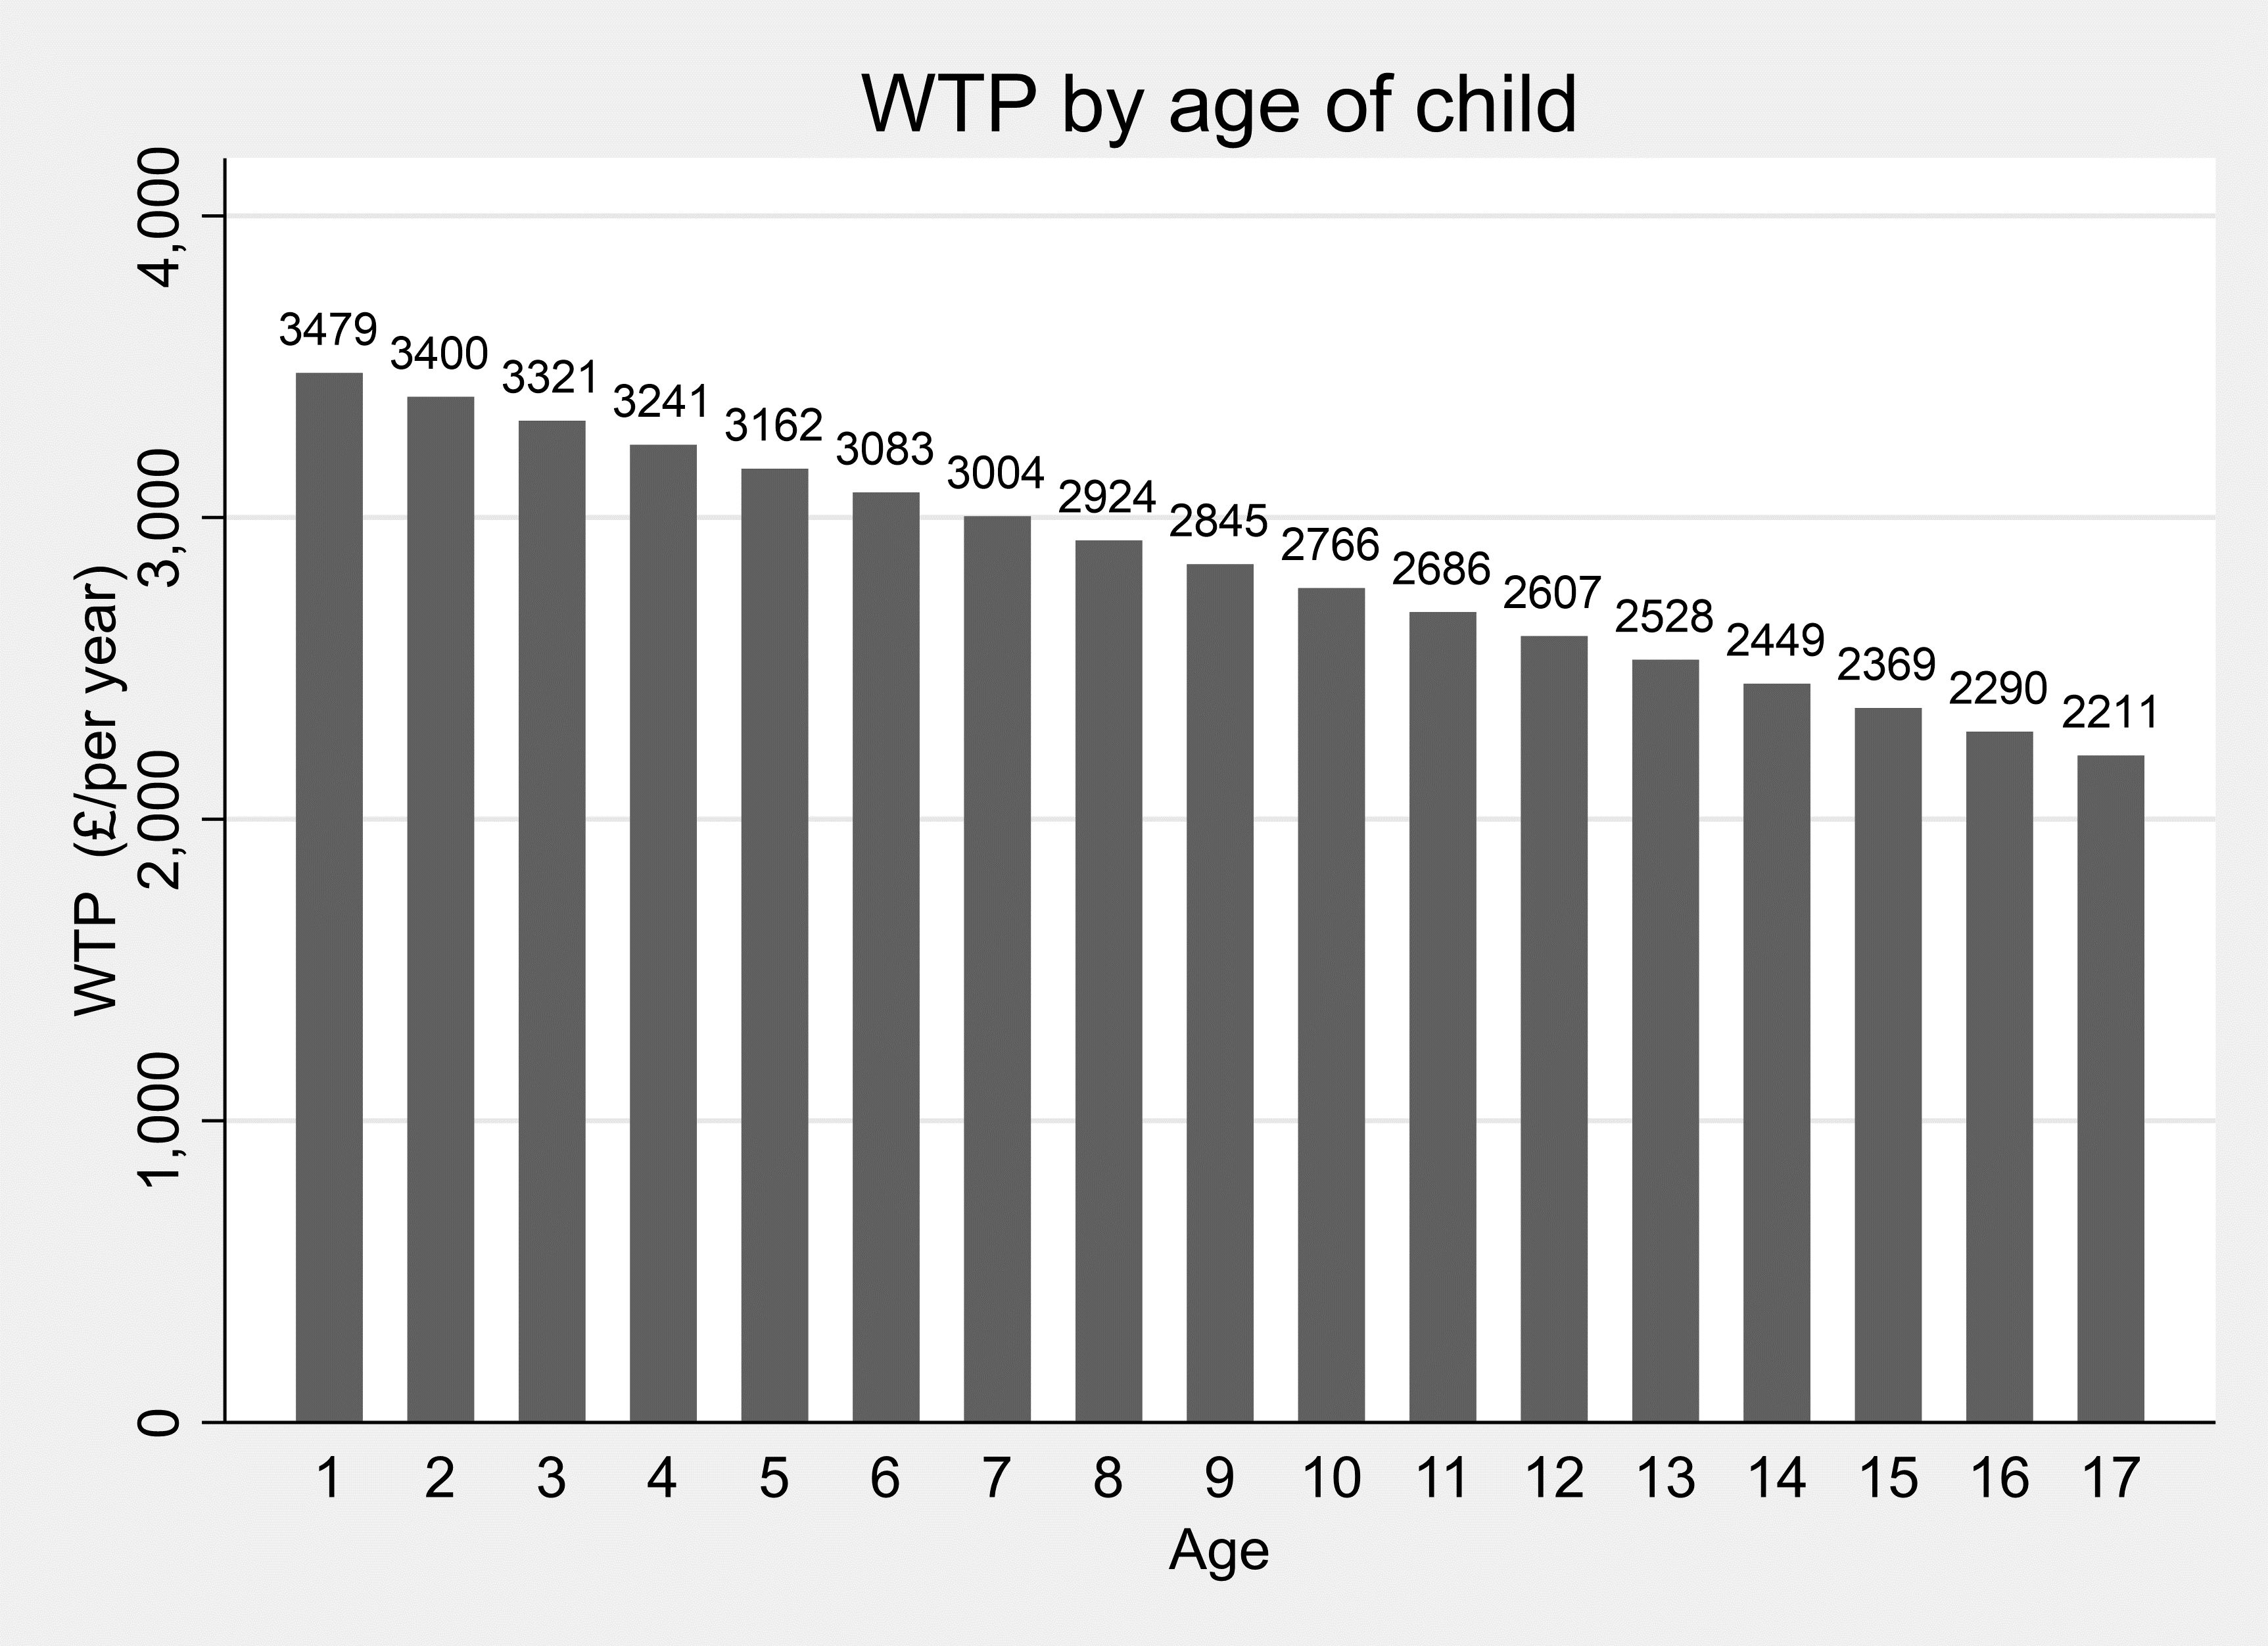
The age of the child with the allergy moderates WTP estimates in the food allergy model – the younger the child the more people are on average prepared to pay per year. The WTP estimates shown in Table 9.16 indicate that for a one-year-old the mean WTP is £3479/ year whilst for a ten-year-old the WTP is £2766/year.
Table 9.16. Child Food Allergies: Marginal WTP for a single year removal, at different ages of the child
| Category | WTP (£/year) | s.error | z | P | 95% CI lower | 95% CI upper |
|---|---|---|---|---|---|---|
| Age=1 | 3479 | 368 | 9.47 | <0.001 | 2759 | 4200 |
| Age=10 | 2766 | 215 | 12.85 | <0.001 | 2344 | 3188 |
| Age=17 | 2211 | 409 | 5.41 | <0.001 | 1410 | 3012 |
Figure 9.4. WTP for one year without food allergy, by age of child
9.8.2 Child WTP values: Coeliac Disease
In the preferred child coeliac disease model (PC2) the severity of the child’s condition, measured via parents scoring on the CCDUX health related QoL instrument, moderates WTP. The greater the disease impacts (the higher the CCDUX score) the higher is WTP for a year without coeliac disease.
The CCDUX score takes values between 12 and 60 (12 items scored 1 to 5). The WTP is not significantly different from zero for children whose CCDUX score is below 36. A CCDUX score of 36 corresponds to a WTP value of £1049. The maximum CCDUX score (60) generates a WTP value of £3366/year. At the sample median CCDUX value of 42, the WTP for a year without the condition is £1628.
Table 9.17. Child Coeliac Disease: Marginal WTP for a year of removal, evaluated at 10th , 50th and 90th percentiles of CCDUX
| Category | WTP (£/year) | s.error | z | P | 95% CI lower | 95% CI upper |
|---|---|---|---|---|---|---|
| CCDUX=29 | 374 | 690 | 0.54 | 0.588 | -978 | 1727 |
| CCDUX=42 | 1628 | 428 | 3.81 | <0.001 | 789 | 2466 |
| CCDUX=53 | 2689 | 671 | 4.01 | <0.001 | 1374 | 4003 |
Figure 9.5. WTP for one year without coeliac Disease, by severity of condition (CCDUX score)
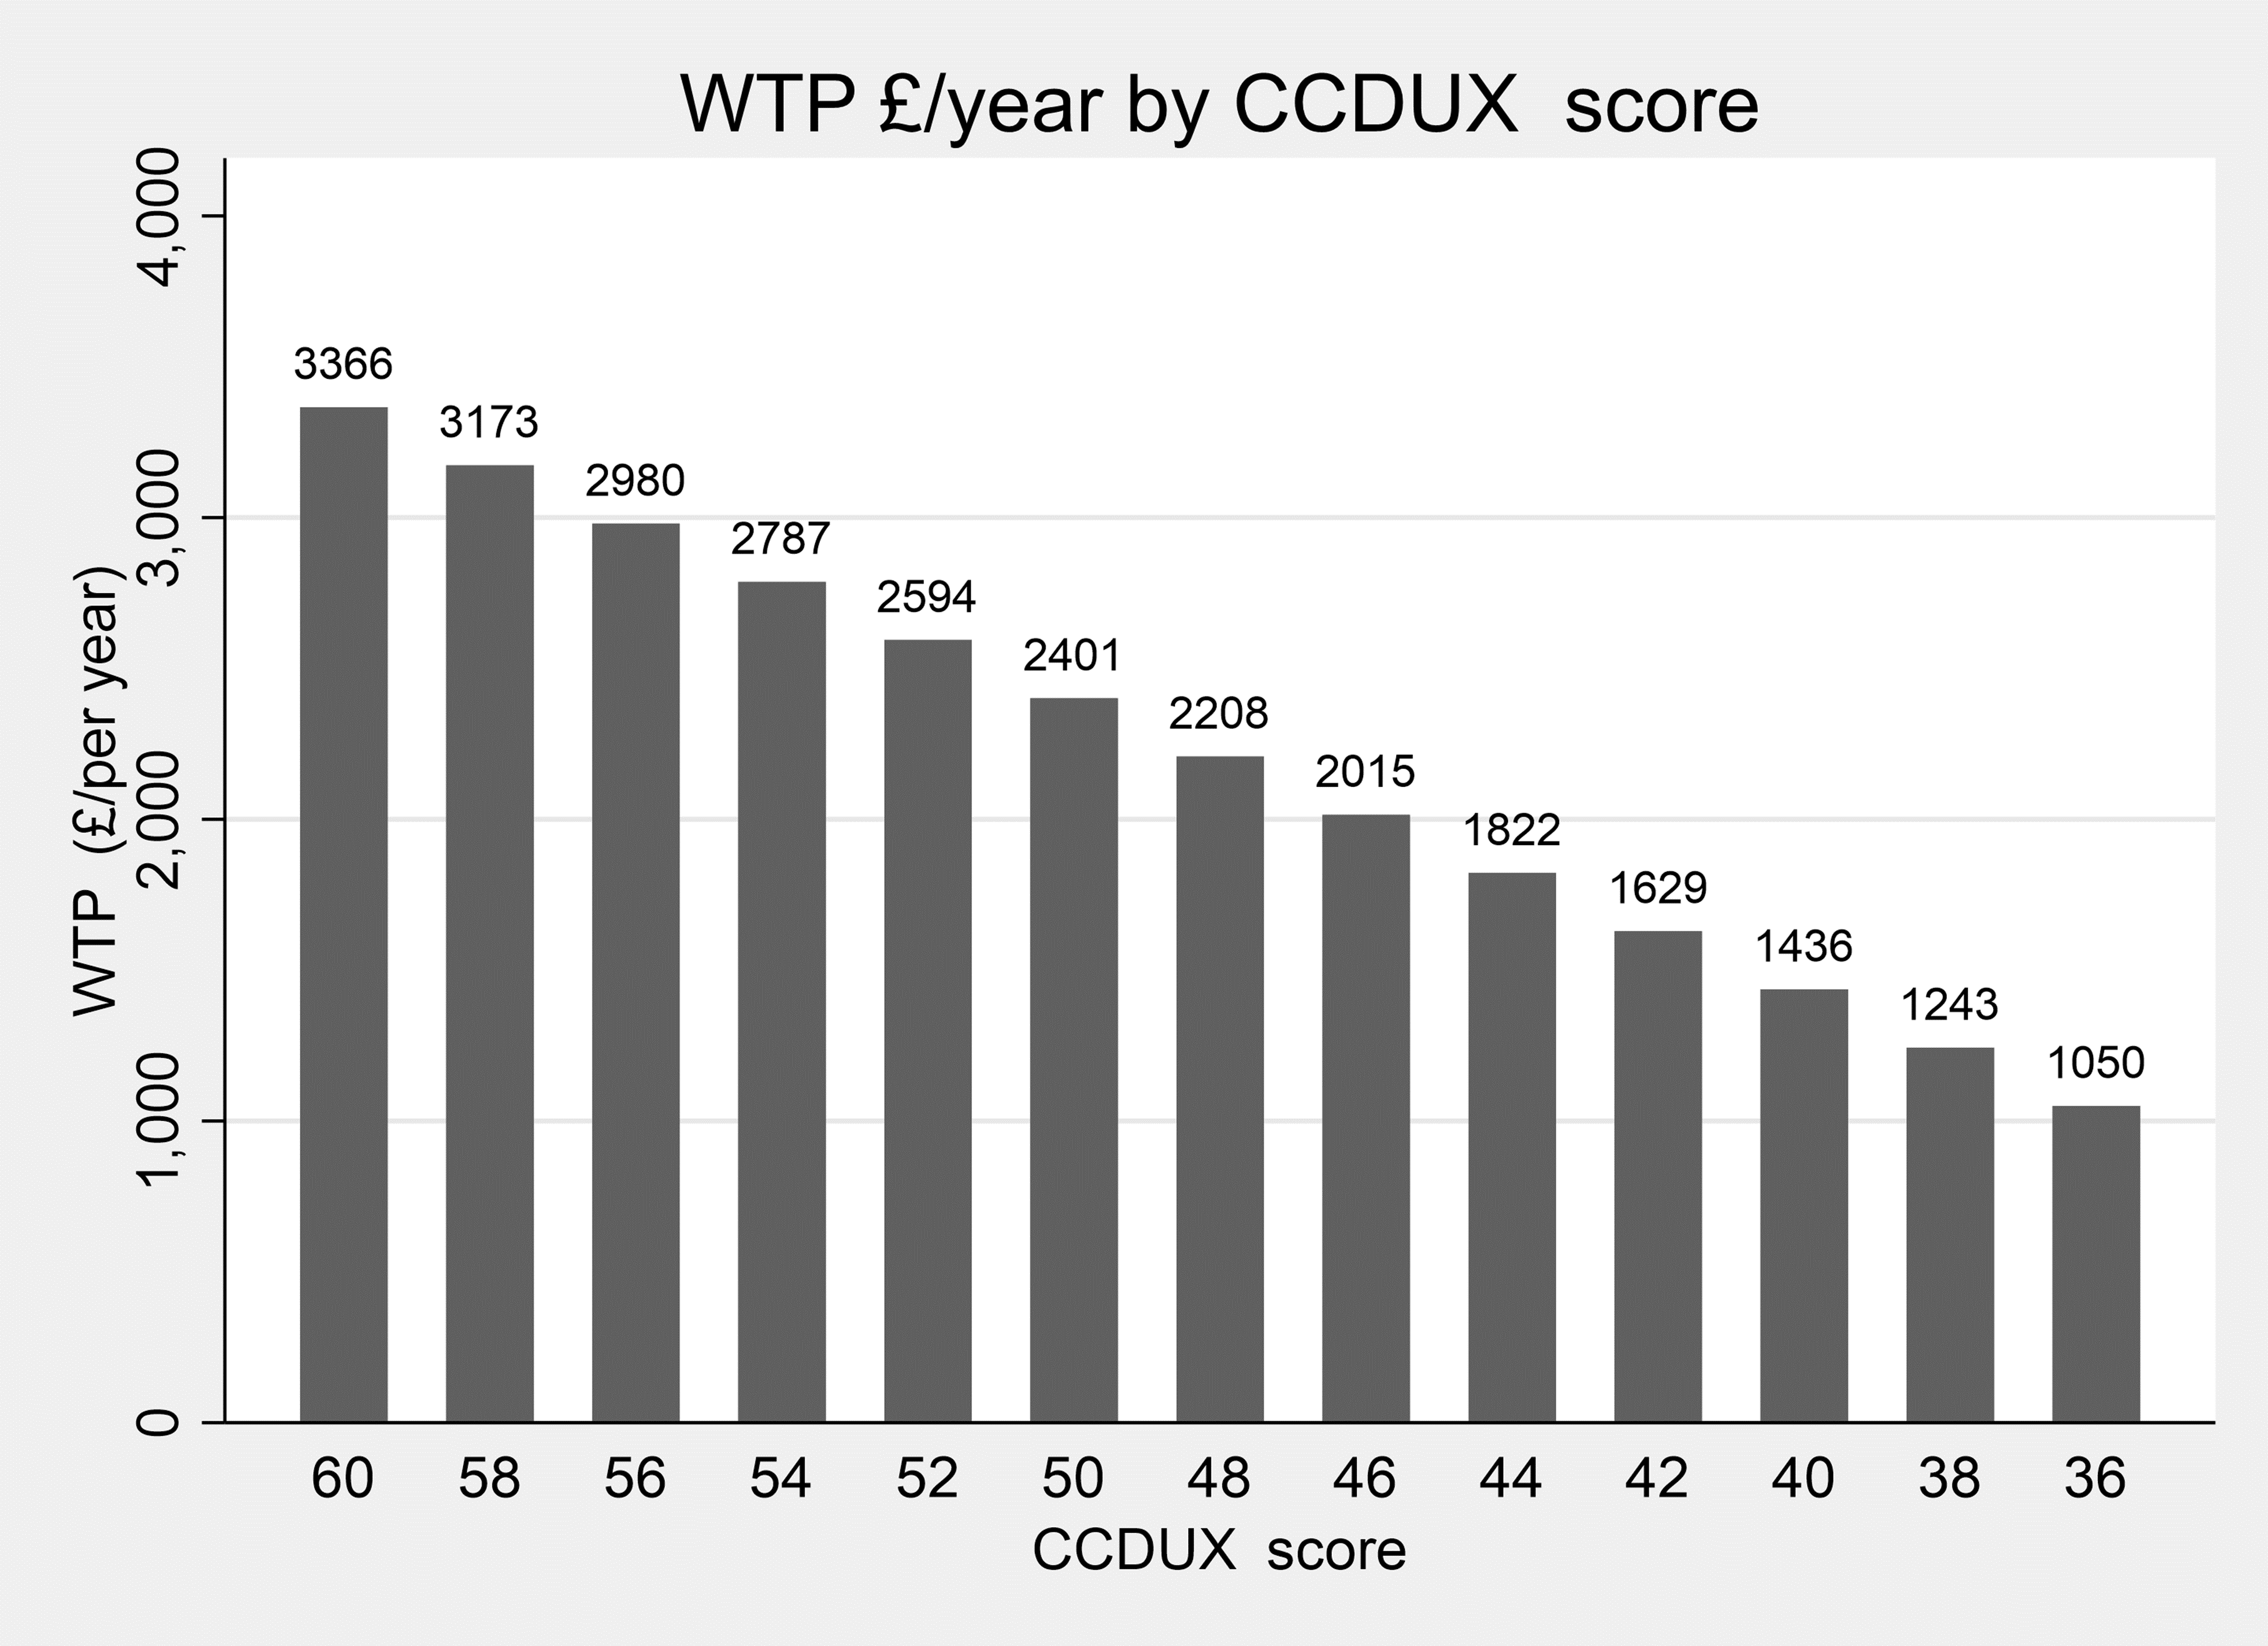
WTP is not significantly different from zero for children whose CCDUX score is below 36, which is evident in Figure 9.5.
9.8.3 Child WTP values: Food Intolerance
There are no effects of child age, or severity of condition (FIQLQ) on WTP values for parents of children with a food intolerance: the WTP value for removal of a child’s food intolerance is £1689/ year.
Table 9.18. Child Food Intolerance: Marginal WTP for a single year removal
| Category | WTP (£/year) | s.error | z | P | 95% CI lower | 95% CI upper |
|---|---|---|---|---|---|---|
| Intolerances | 1689 | 274 | 6.17 | <0.001 | 1153 | 2226 |
The Adult results are summarised in Table 9.19 and the child results in Table 9.20. The results and the uses to which they can be put, in particular in relation to the FSA COI model are discussed in Section 11.
Table 9.19. WTP Summaries, Adult conditions, In Aggregate and Disaggregated by FHS Condition
| Adults | Adult condition | WTP (£/year) |
|---|---|---|
| - | Aggregate | 718 (627-810) |
| Base models | Allergy | 620 (445-795) |
| Base models | Coeliac | 760 (629-891) |
| Base models | Intolerance | 603 (408-797) |
| Preferred models | Allergy | 1064 (596-1532) (for first year) |
| Preferred models | Coeliac | 1342 (975-1710) (for first year) |
|
Preferred models |
Intolerance | 540 (349-731) (at median values of relevant condition score) |
95% CI in parentheses.
Table 9.20. WTP Summaries, Child conditions, In Aggregate and Disaggregated by Condition
| Children | Child condition | WTP (£/year) |
|---|---|---|
| - | Aggregate | 2501 (2195-2807) |
| Base models | Allergy | 2902 (2502-3302) |
| Base models | Coeliac | 1611 (783-2439) |
| Base models | Intolerance | 1695 (1157-2232) |
| Preferred models | Allergy | 2766 (2344-3188) (At child age of 10; WTP = £3479 for a one-year-old child, WTP = £2211 for 17-year-old.) |
| Preferred models | Coeliac | 1628 (789-2466) (at median values of relevant condition score) |
|
Preferred models |
Intolerance | 1689 (1153-2226) |
95% CI in parentheses.
Revision log
Published: 5 September 2022
Last updated: 12 September 2023