Impacts of Food Hypersensitivities on Quality of Life in the UK and Willingness to Pay (WTP) to remove those impacts
Appendix K. Sample Descriptives – Condition-Specific Measures of Quality of Life - Adults and Children
How the impact of living with a food hypersensitivity, and the gain to be valued if it was removed was captured.
The impact of living with a food hypersensitivity, and hence the gain to be valued if it was removed, was captured using three approaches:
• Baseline and contingent EQ-5D;
• Baseline and contingent Visual Analogue Scale (VAS);
• Condition-specific measures (FAQLQ, FIQLQ, or CDQ) for children.
This section of the report covers condition-specific measures (FAQLQ, FIQLQ, and CDQ).
Adult Results: FAQLQ, FIQLQ, and CDQ
Food Allergy: FAQLQ
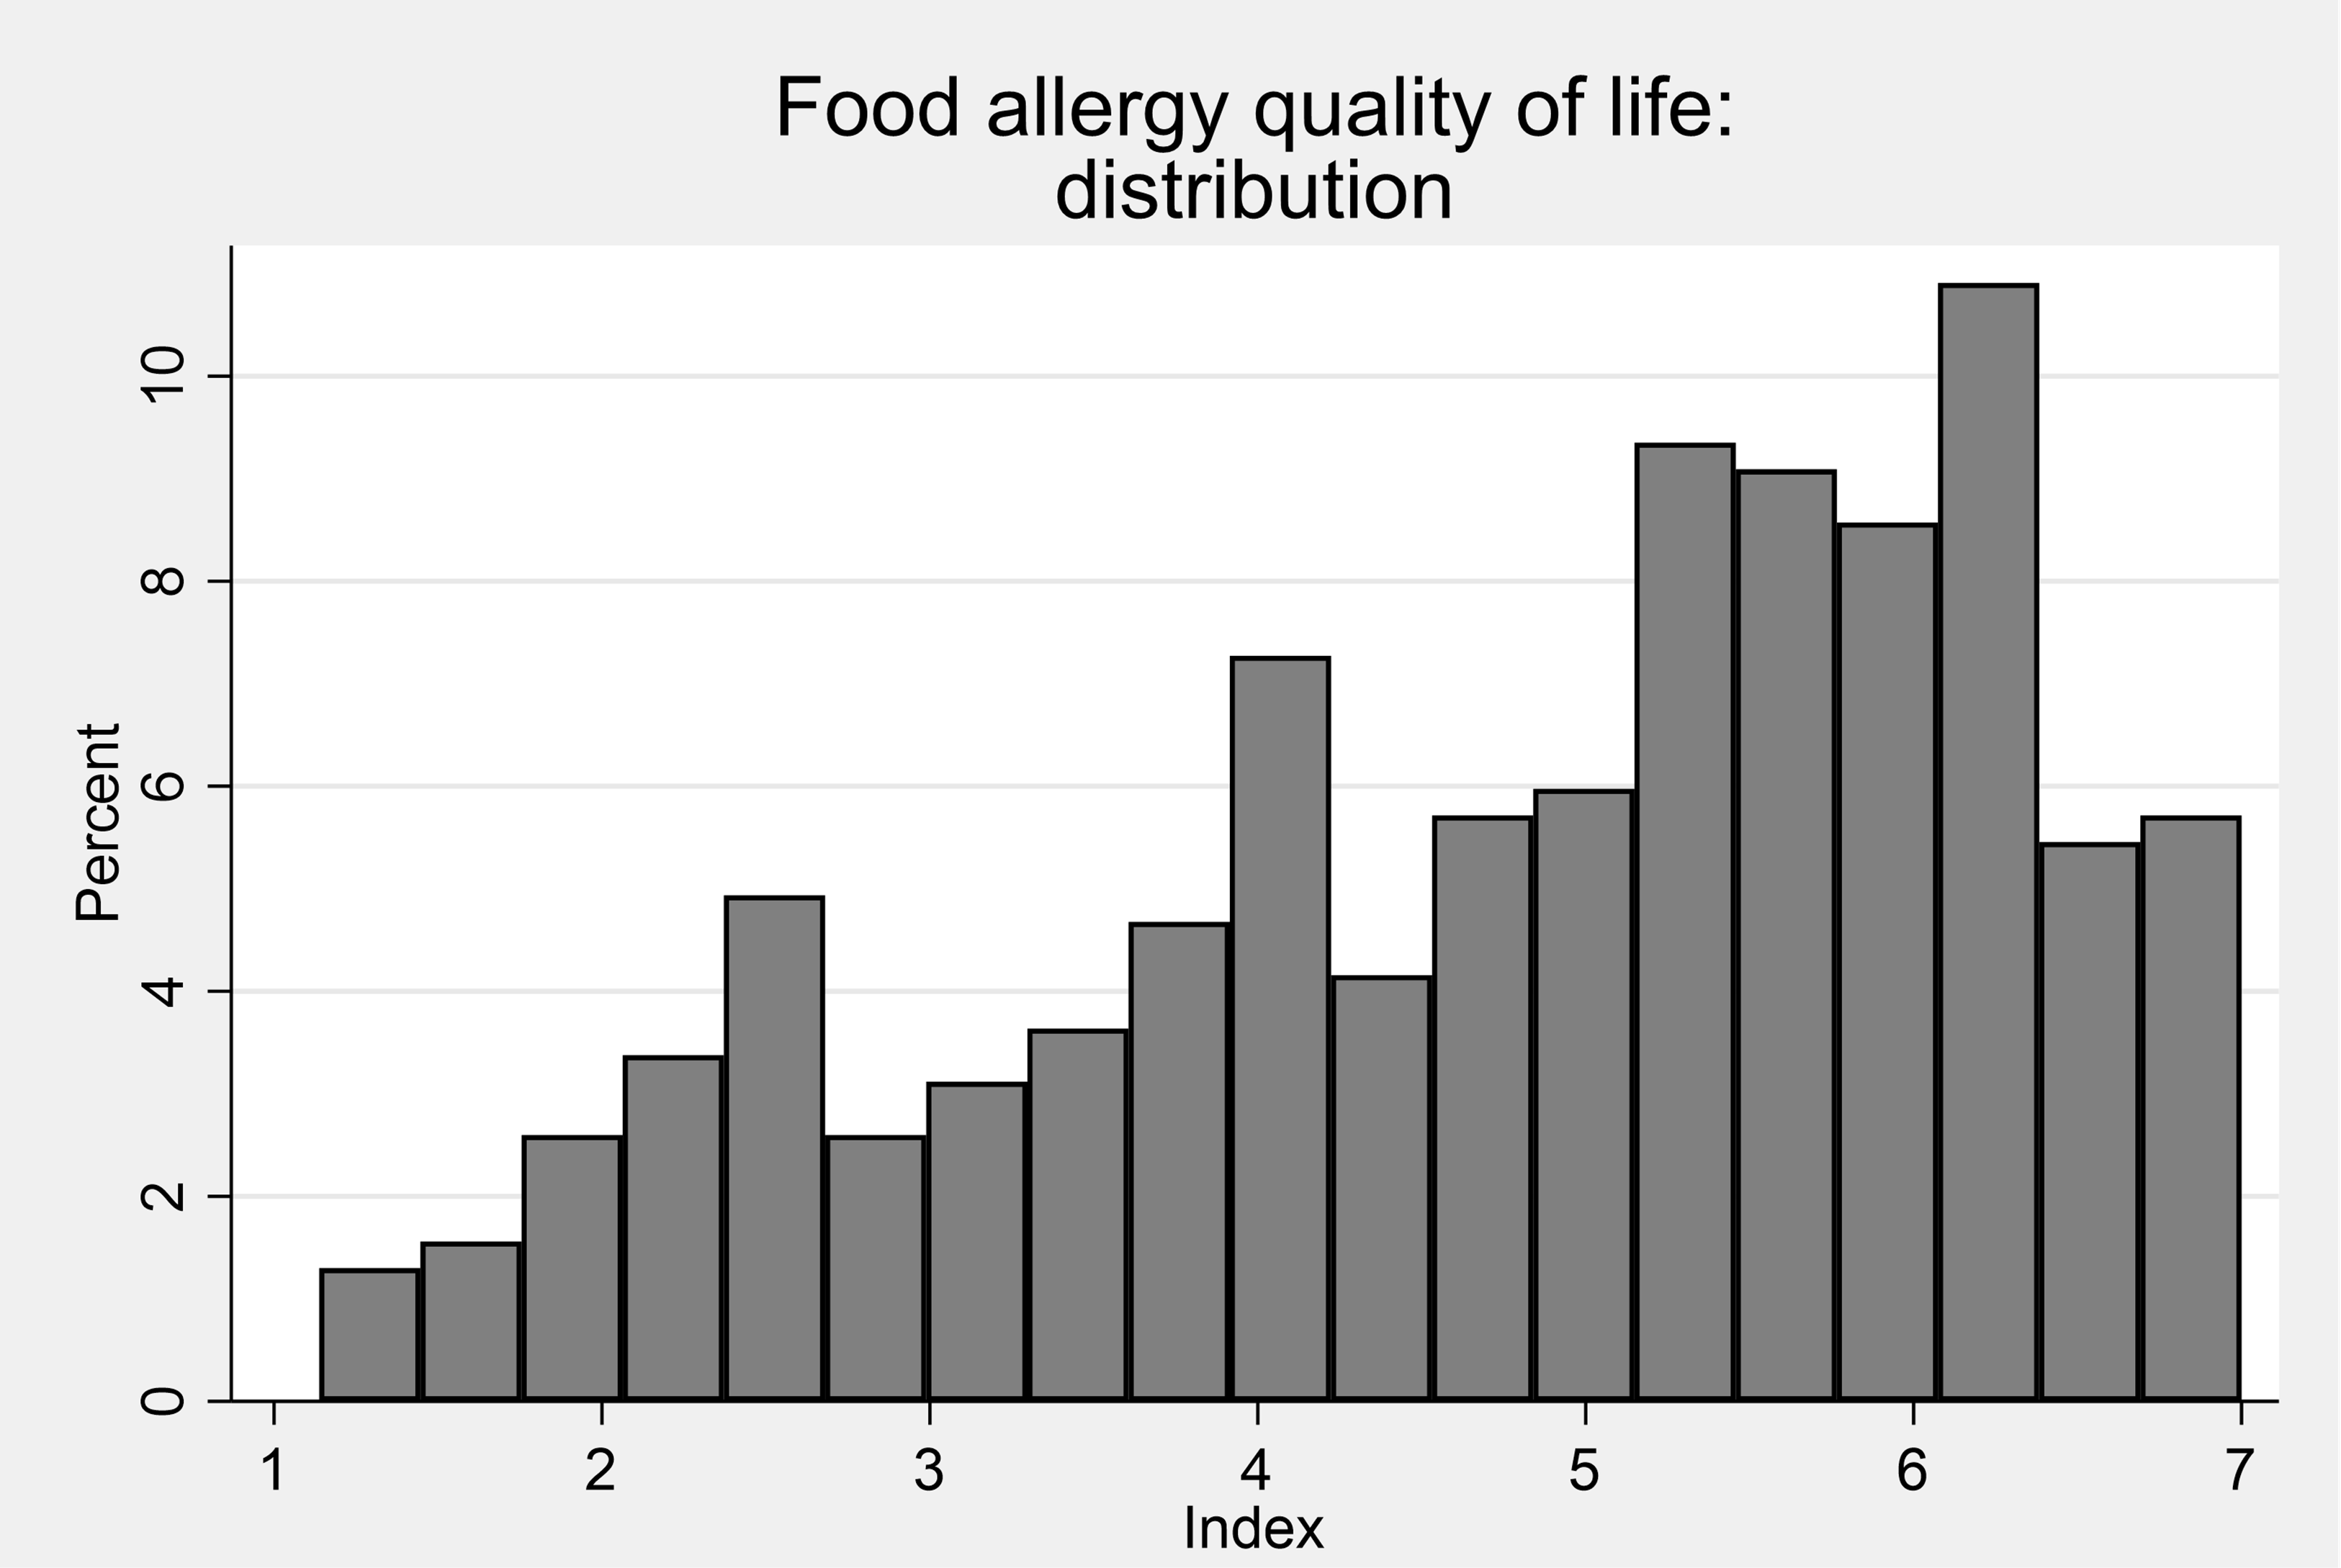
The FAQLQ is scored between 1 and 7 - the mean score in the adult sample was 4.8 and the median score was 5.1.
Table 1. Summary statistics: FAQLQ index
| - | Mean | Std. Dev | N | min | p25 | Median | p75 | max |
|---|---|---|---|---|---|---|---|---|
| FAQ total | 4.76 | 1.49 | 385 | 1.14 | 3.66 | 5.1 | 6 | 7 |
The adult distribution of FAQLQ scores is shown in Figure 1
Figure 1 Distribution of FAQLQ scores (adult allergy)
Women’s FAQLQ scores were on average than men’s, mean their allergy impacts were greater than those for men.
Table 2. Summary statistics: FAQLQ Index by sex
| Sex | mean | sd | N | min | p25 | Median | p75 | max |
|---|---|---|---|---|---|---|---|---|
| Female | 4.96 | 1.44 | 226 | 1.31 | 3.93 | 5.38 | 6.1 | 7 |
| Male | 4.18 | 1.47 | 85 | 1.21 | 3.17 | 4.24 | 5.28 | 7 |
The FAQLQ scores were similar across age groups except for those over 65 whose scores were lower than the younger age groups.
Table 3 Summary statistics: FAQLQ Index by age
| Age | mean | sd | N | min | p25 | Median | p75 | max |
|---|---|---|---|---|---|---|---|---|
| Below 35 years old | 4.9 | 1.3 | 104 | 1.79 | 3.91 | 5.22 | 5.97 | 7 |
| 35-54 years old | 4.87 | 1.59 | 140 | 1.21 | 3.62 | 5.38 | 6.12 | 7 |
| 55-64 years old | 1.9 | 1.41 | 71 | 1.76 | 3.97 | 5.07 | 6.21 | 6.97 |
| 65 years old and above | 4.23 | 1.56 | 69 | 1.14 | 2.83 | 4.59 | 5.45 | 7 |
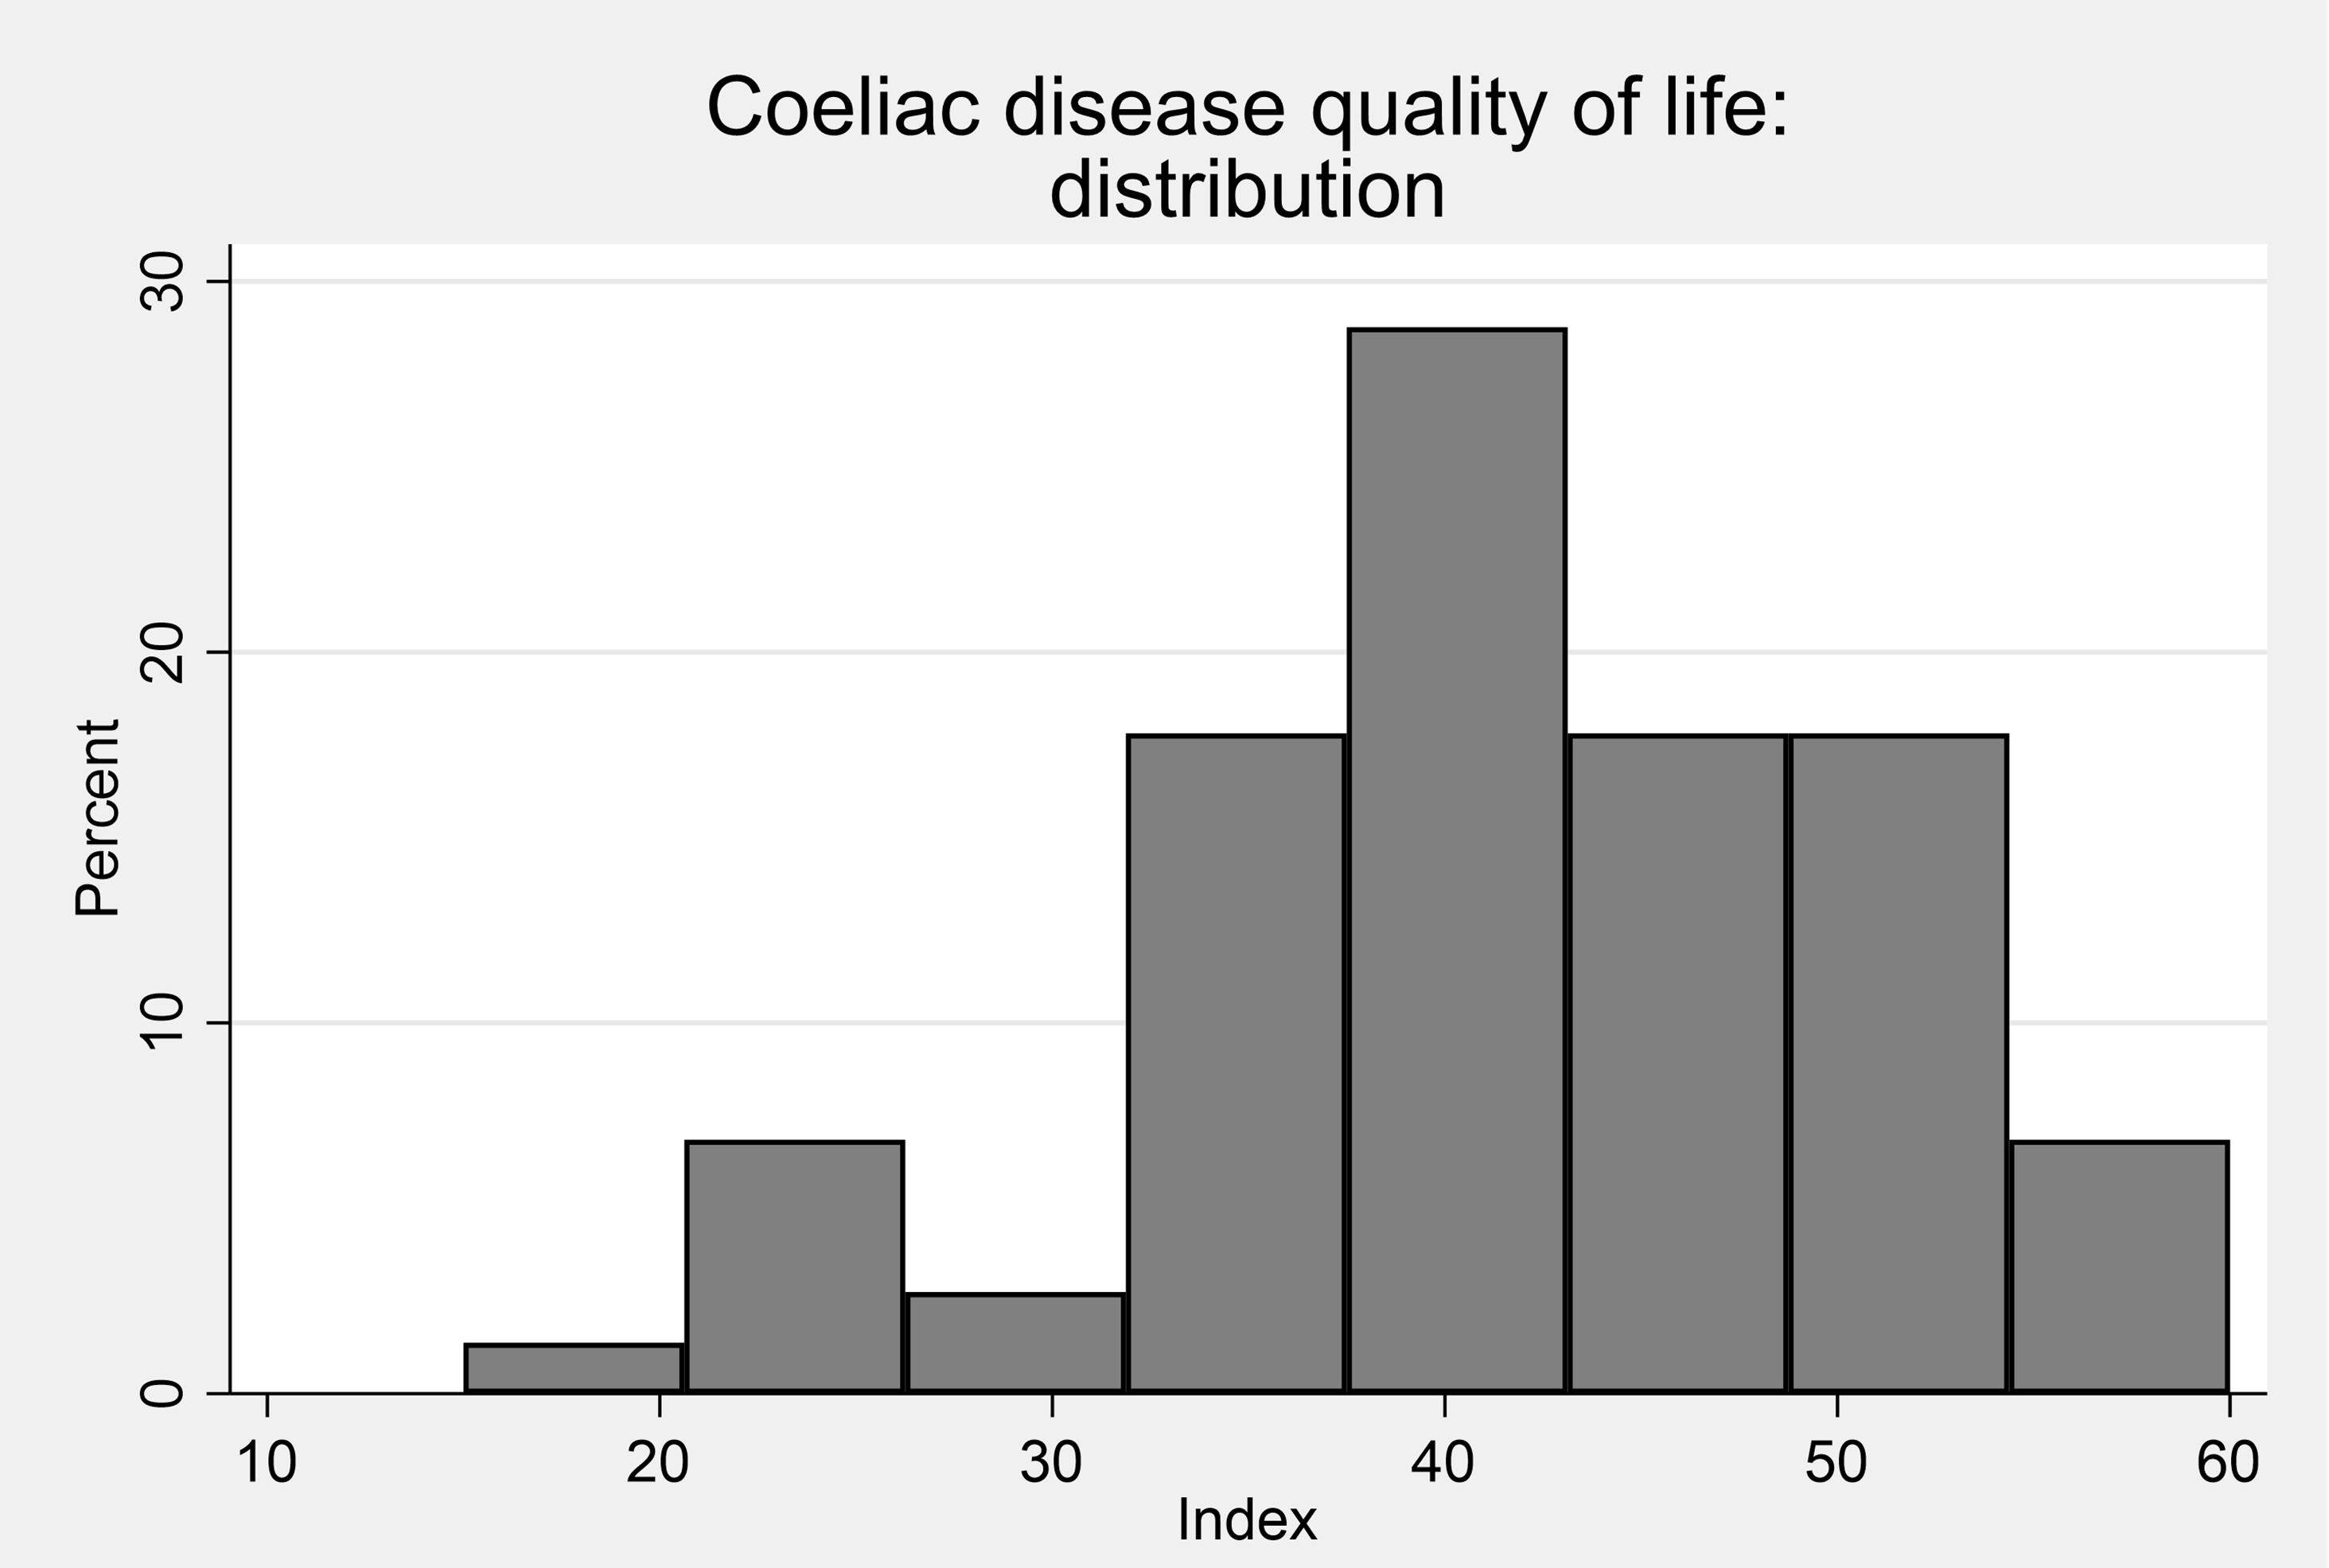
Coeliac Disease: CDQ
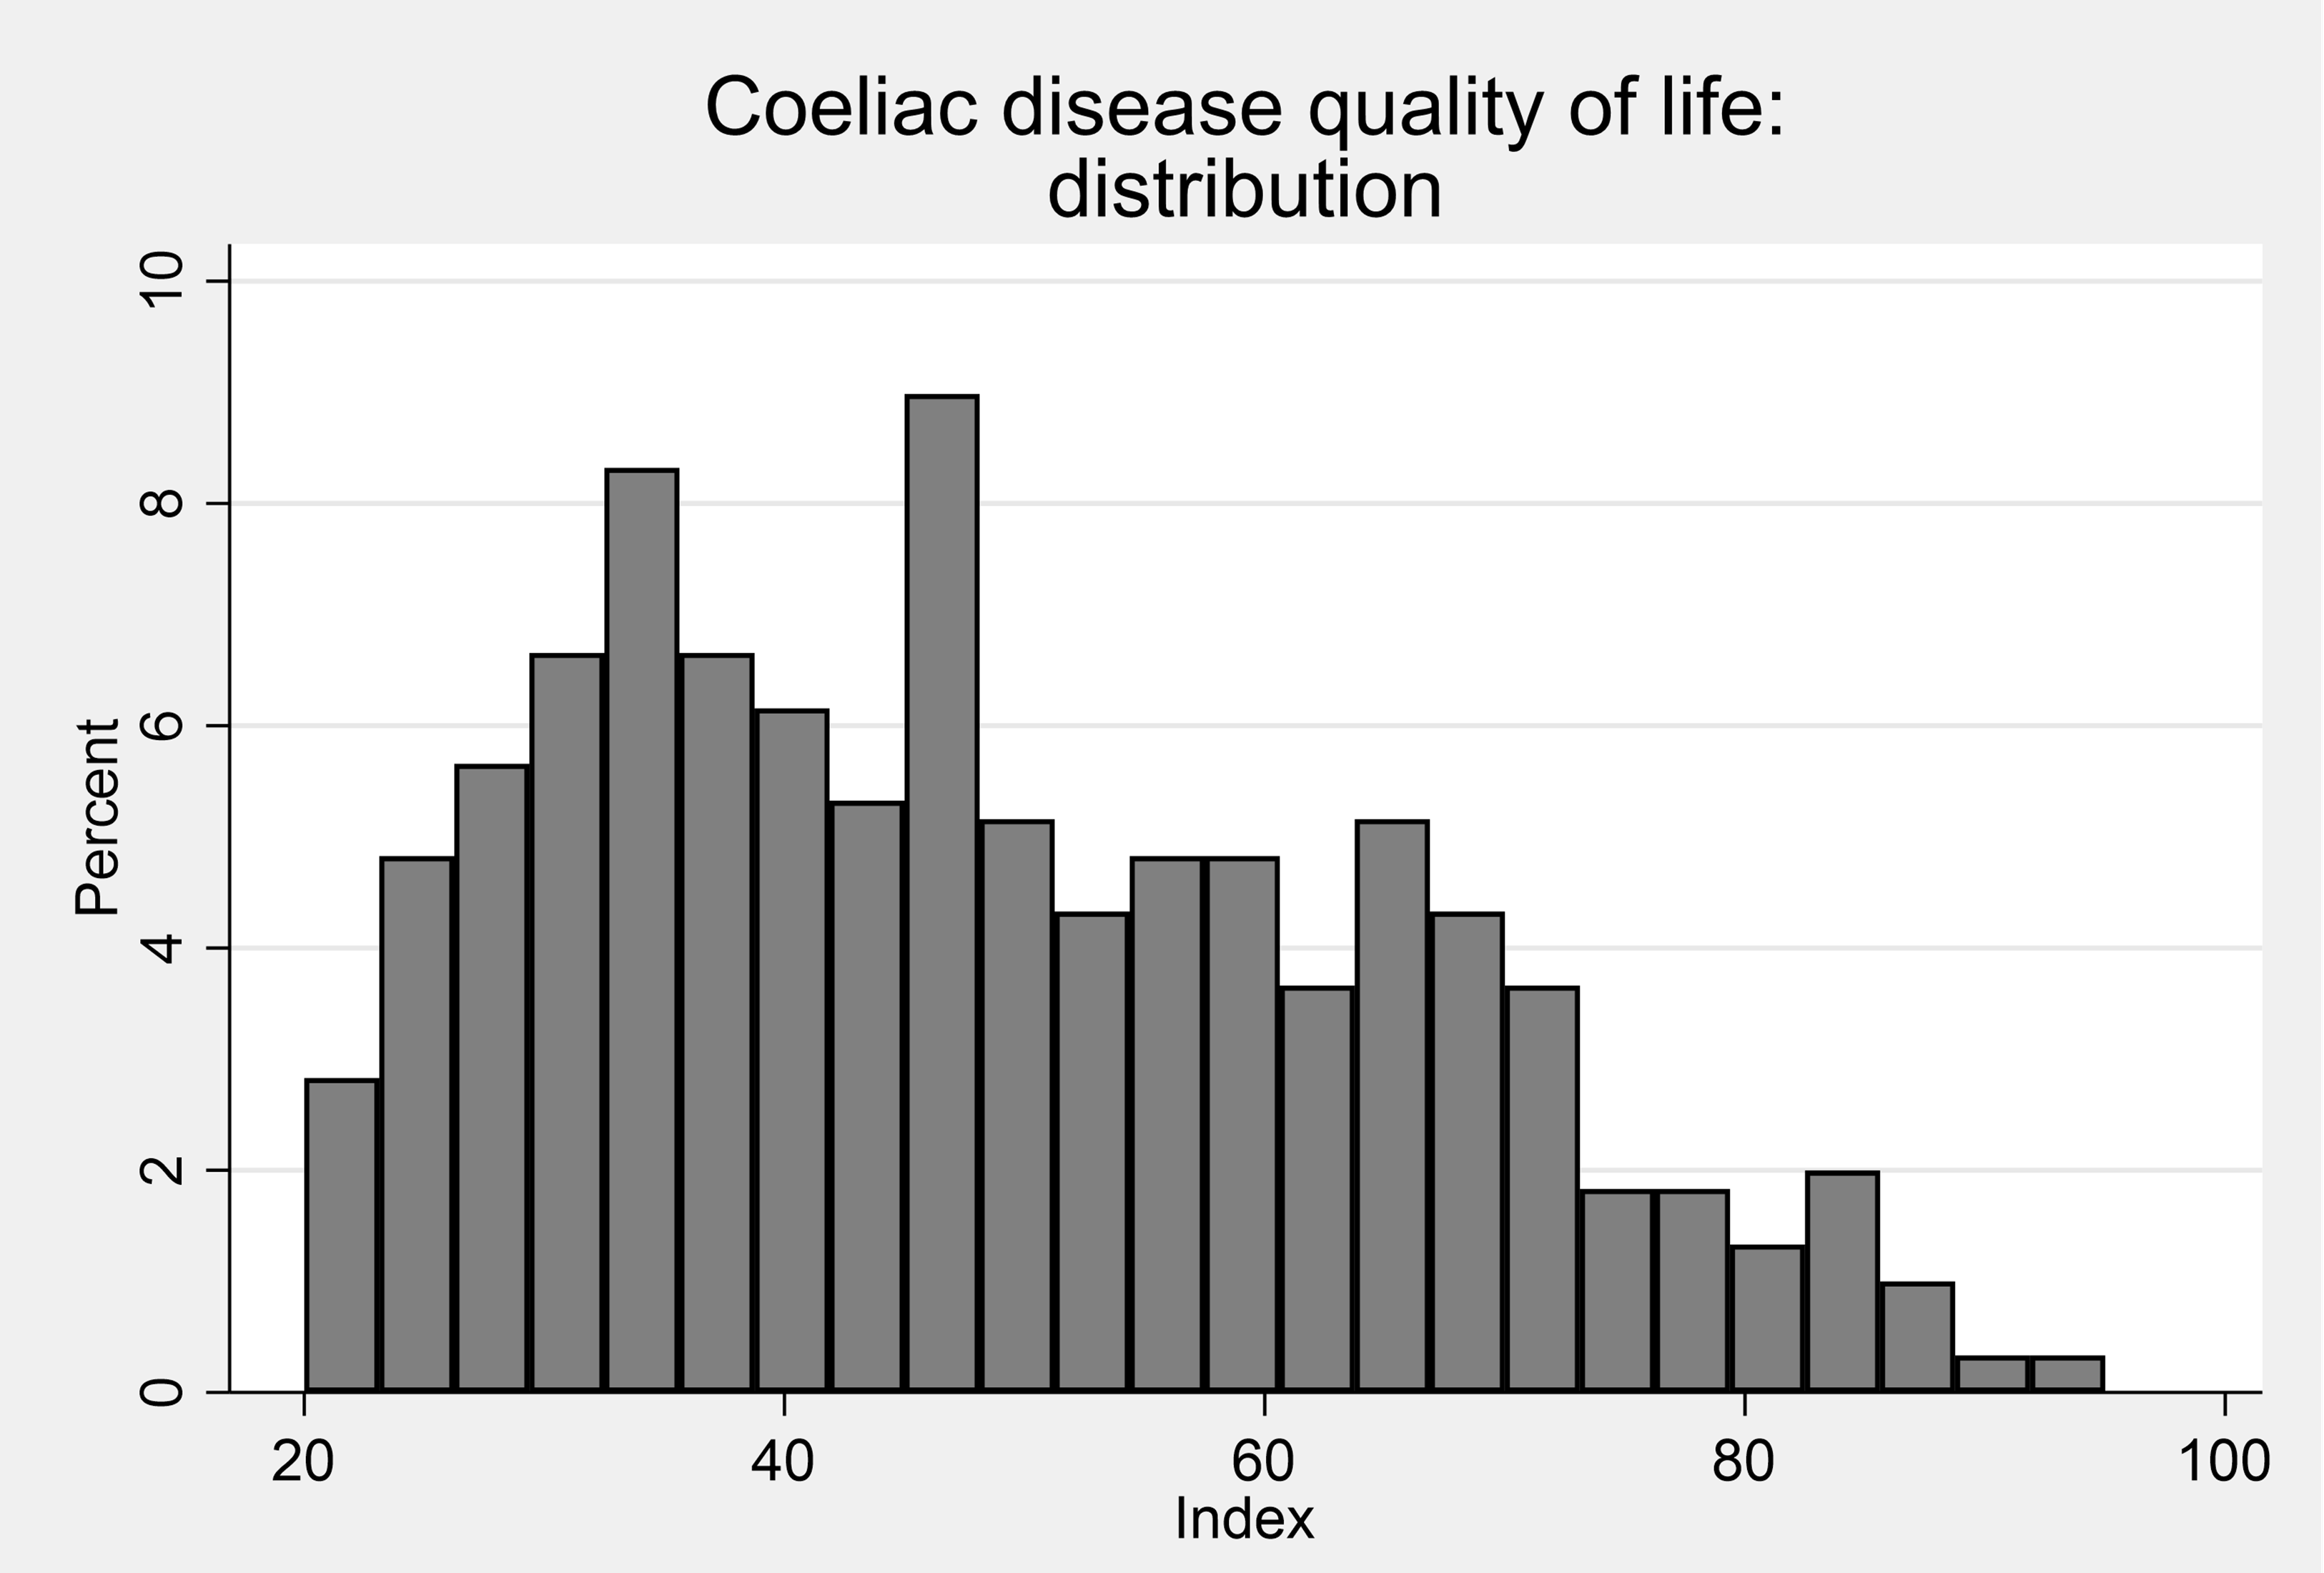
The 20 items of the CDQ are scored 1 to 5 meaning that the instrument can takes values between 20 and 100. The mean CDQ score in the sample was 48 and the median score was 47.
Table 4. Summary statistics: CDQ index
| - | Mean | Std. Dev. | N | min | p25 | Median | p75 | max |
|---|---|---|---|---|---|---|---|---|
| CDQ total | 48.35 | 16.91 | 601 | 20 | 34 | 47 | 61 | 95 |
The distribution of CDQ scores is shown in Figure 2.
Figure 2 Distribution of CDQ scores (adult coeliacs)
Male and female CDQ scores are very similar
Table 5. Summary statistics: CDQ Index by sex
| Sex | mean | sd | N | min | p25 | Median | p75 | max |
|---|---|---|---|---|---|---|---|---|
| Female | 50.263 | 16.648 | 293 | 21 | 37 | 48 | 63 | 89 |
| Male | 49.355 | 17.139 | 76 | 20 | 35 | 48 | 61.5 | 88 |
The CDQ scores declined as age increases- older people typically report less severe impacts of coeliac disease on their life. Epidemiological studies support that coeliac disease can develop at any age in the lifecourse [Dube et al (2005)]. The non-specific symptoms and/or asymptomatic nature of coeliac disease mean it is often diagnosed later (~ 40 to 50 years of age) in life but as people age they may adjust to living with their diagnosis such that it impacts less on day-to-day activities and wellbeing (see Table 6) [Paez et al (2017); Zipser et al (2003); Ludvigsson et al (2014)].
Table 6. Summary statistics: CDQ Index by age
| Age | mean | sd | N | min | p25 | Median | p75 | max |
|---|---|---|---|---|---|---|---|---|
| Below 35 years old | 57 | 15.42 | 79 | 27 | 44 | 58 | 67 | 89 |
| 35-54 years old | 51.31 | 17.36 | 164 | 21 | 37 | 51 | 65 | 95 |
| 55-64 years old | 46.65 | 15.99 | 177 | 20 | 34 | 44 | 55 | 90 |
| 65 years old and above | 43.42 | 16.06 | 180 | 20 | 30 | 41 | 54 | 88 |
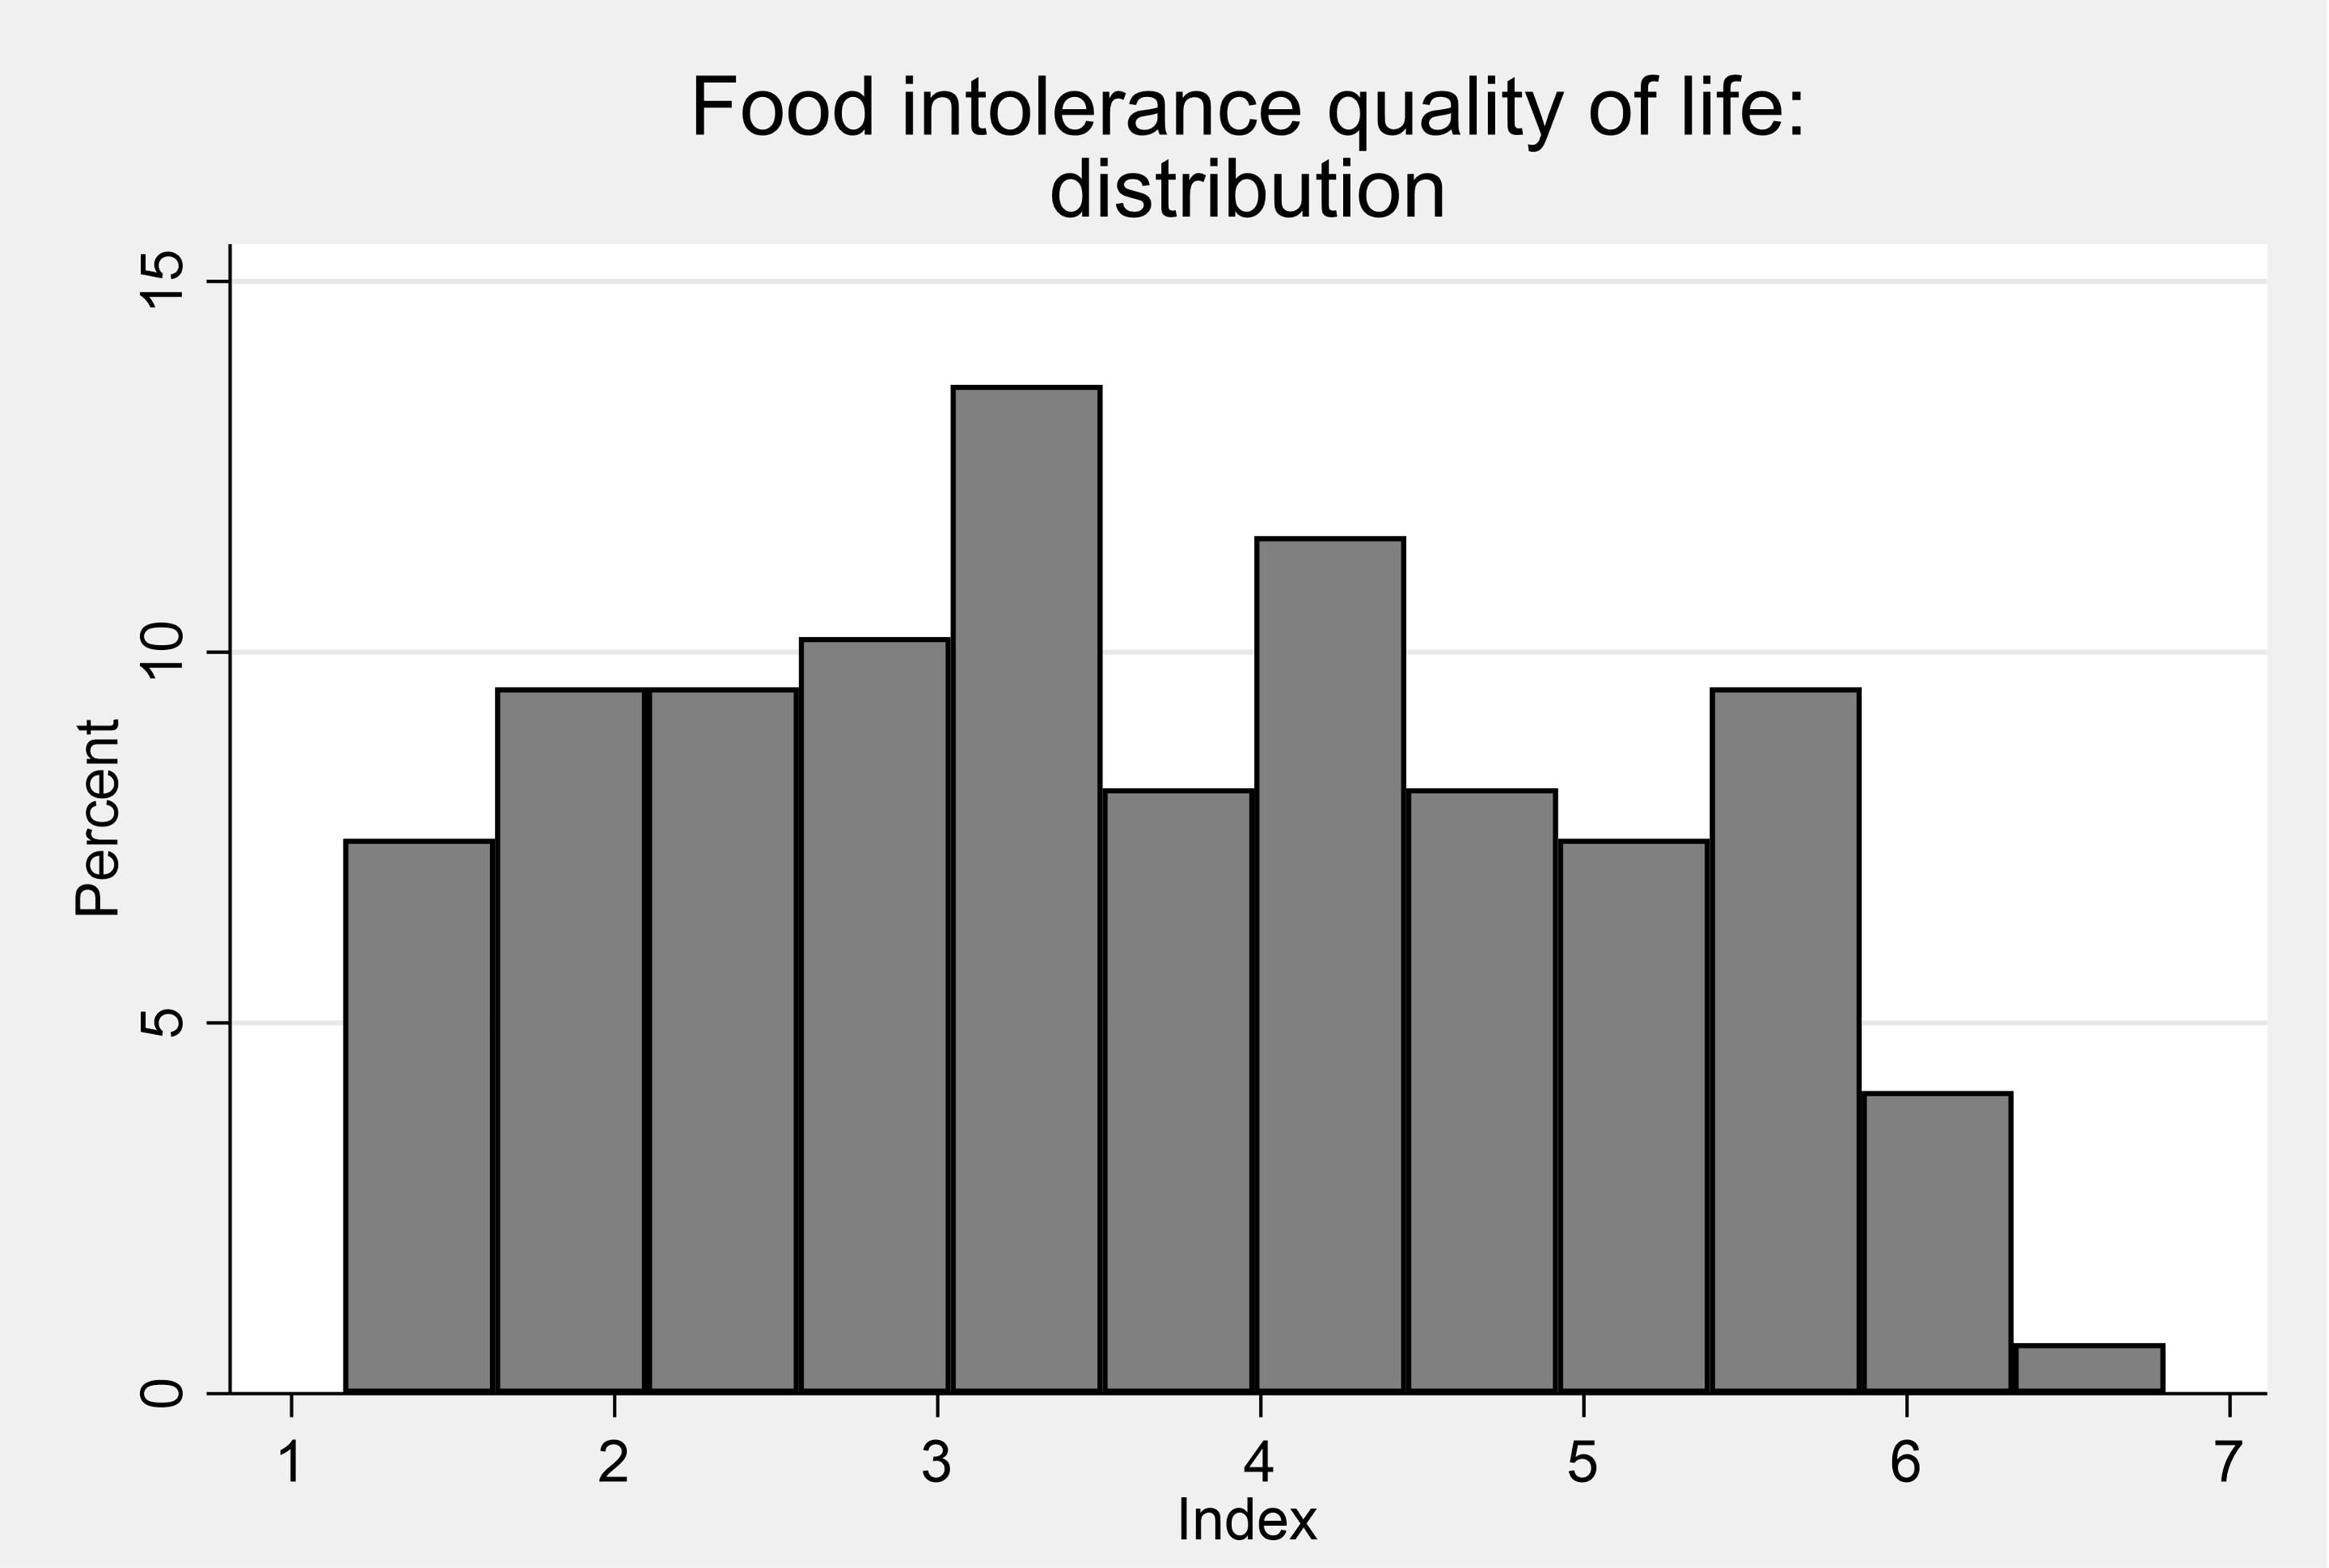
Food Intolerance: FIQLQ
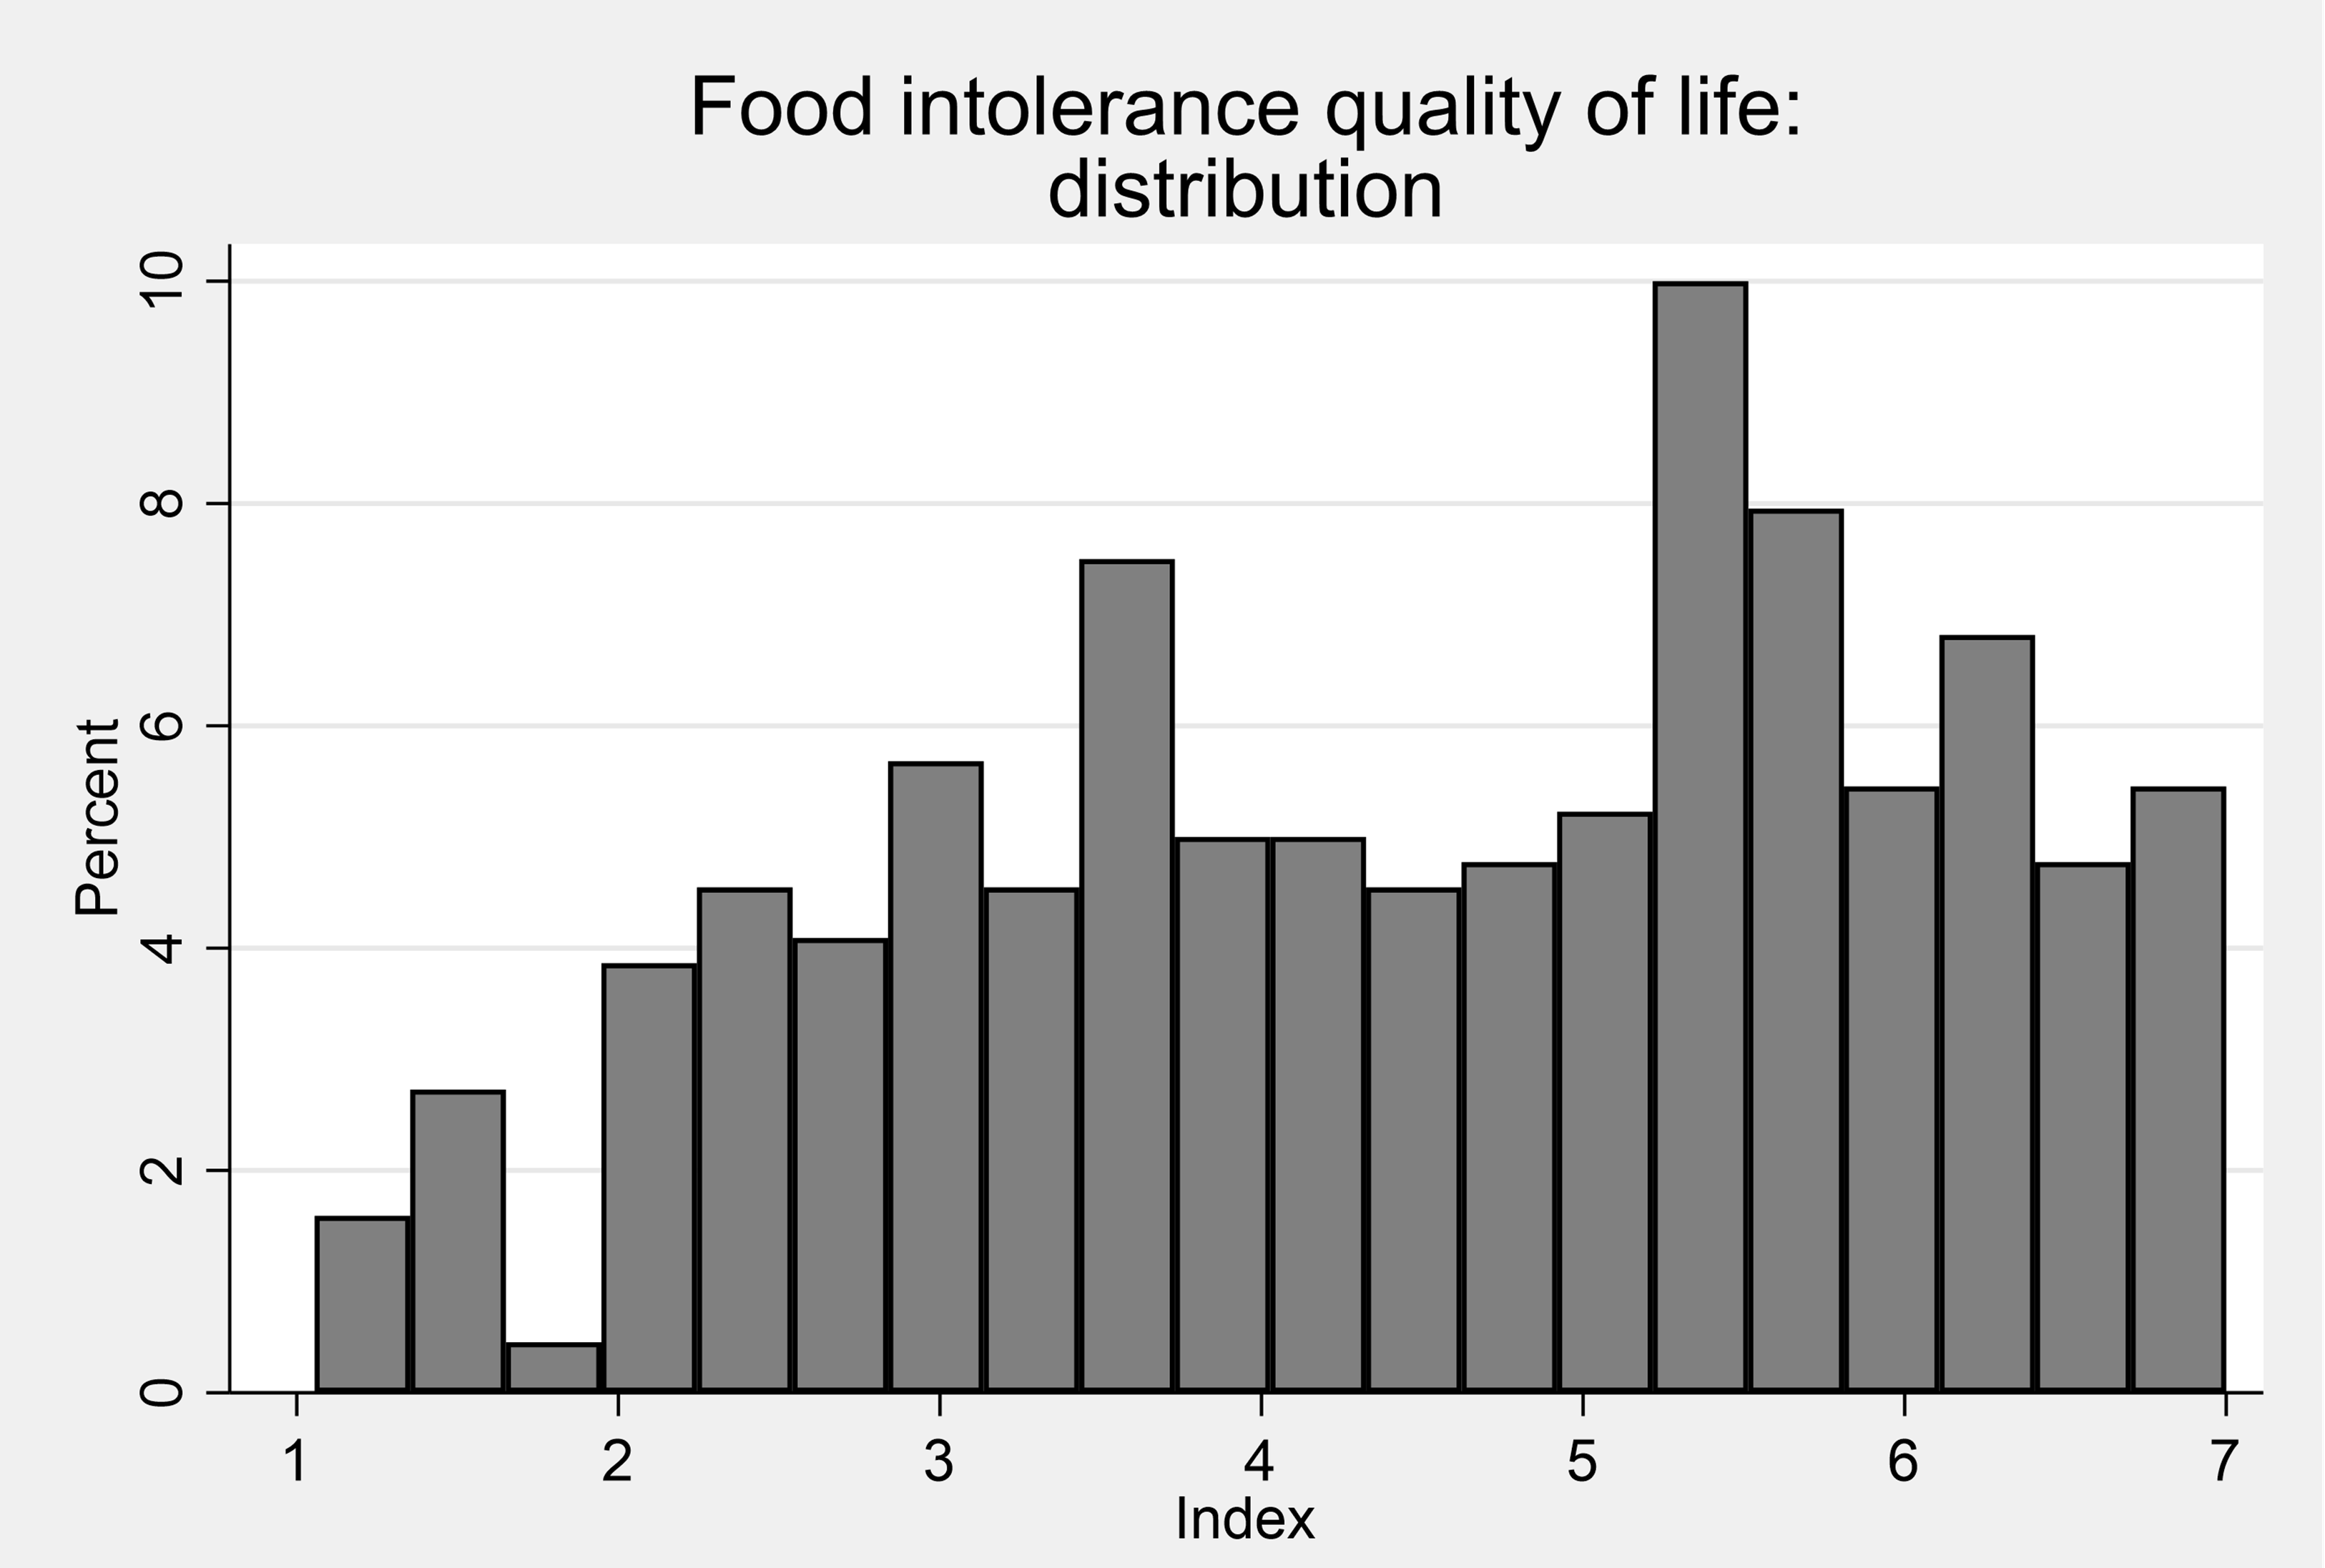
The FIQLQ is scored between 1 and 7 - the mean score in the adult sample was 4.5 and the median score was 4.7.
Table 7 Summary statistics: FIQLQ Index
| - | Mean | Std. Dev. | N | min | p25 | Median | p75 | max |
|---|---|---|---|---|---|---|---|---|
| FIQ total | 4.49 | 1.53 | 440 | 1.06 | 3.28 | 4.67 | 5.72 | 7 |
Figure 3 Distribution of FIQLQ scores (adult intolerance)
Women’s FIQLQ scores were on average higher than men’s, mean their food intolerance impacts were greater than those for men.
Table 8. Summary statistics: FIQLQ Index by sex
| Sex | mean | sd | N | min | p25 | Median | p75 | max |
|---|---|---|---|---|---|---|---|---|
| Female | 4.46 | 1.46 | 276 | 1.17 | 3.39 | 4.56 | 5.61 | 7 |
| Male | 4.18 | 1.56 | 92 | 1.06 | 2.97 | 4.33 | 5.47 |
6.72 |
The scores were similar across age groups except for those over 65 whose scores were lower than the younger age groups.
The FIQLQ scores increased as age increases - older people typically report more severe impacts of their food intolerance.
Table 9. Summary statistics: FIQLQ Index by age
| Age | mean | sd | N | min | p25 | Median | p75 | max |
|---|---|---|---|---|---|---|---|---|
| Below 35 years old | 4.27 | 1.49 | 62 | 1.56 | 3.06 | 4.17 | 5.5 | 6.94 |
| 35-54 years old | 4.46 | 1.5 | 158 | 1.06 | 3.22 | 4.72 | 5.61 | 7 |
| 55-64 years old | 4.51 | 1.49 | 124 | 1.17 | 3.39 | 4.69 | 5.67 | 7 |
| 65 years old and above | 4.66 | 1.68 | 93 | 1.06 | 3.56 | 5.11 | 6.11 | 7 |
Child Results:
Child Food Allergy: FAQLQ-PF and FAQLQ-PFT
The Food Allergy Quality of Life Questionnaire-Parent Form (FAQLQ-PF) was used for children aged 0-12 and the Food Allergy Quality of Life Questionnaire – Parent Form – for Adolescents (FAQLQ-PFT) was used for adolescents aged 13-17. These forms were completed by parents.
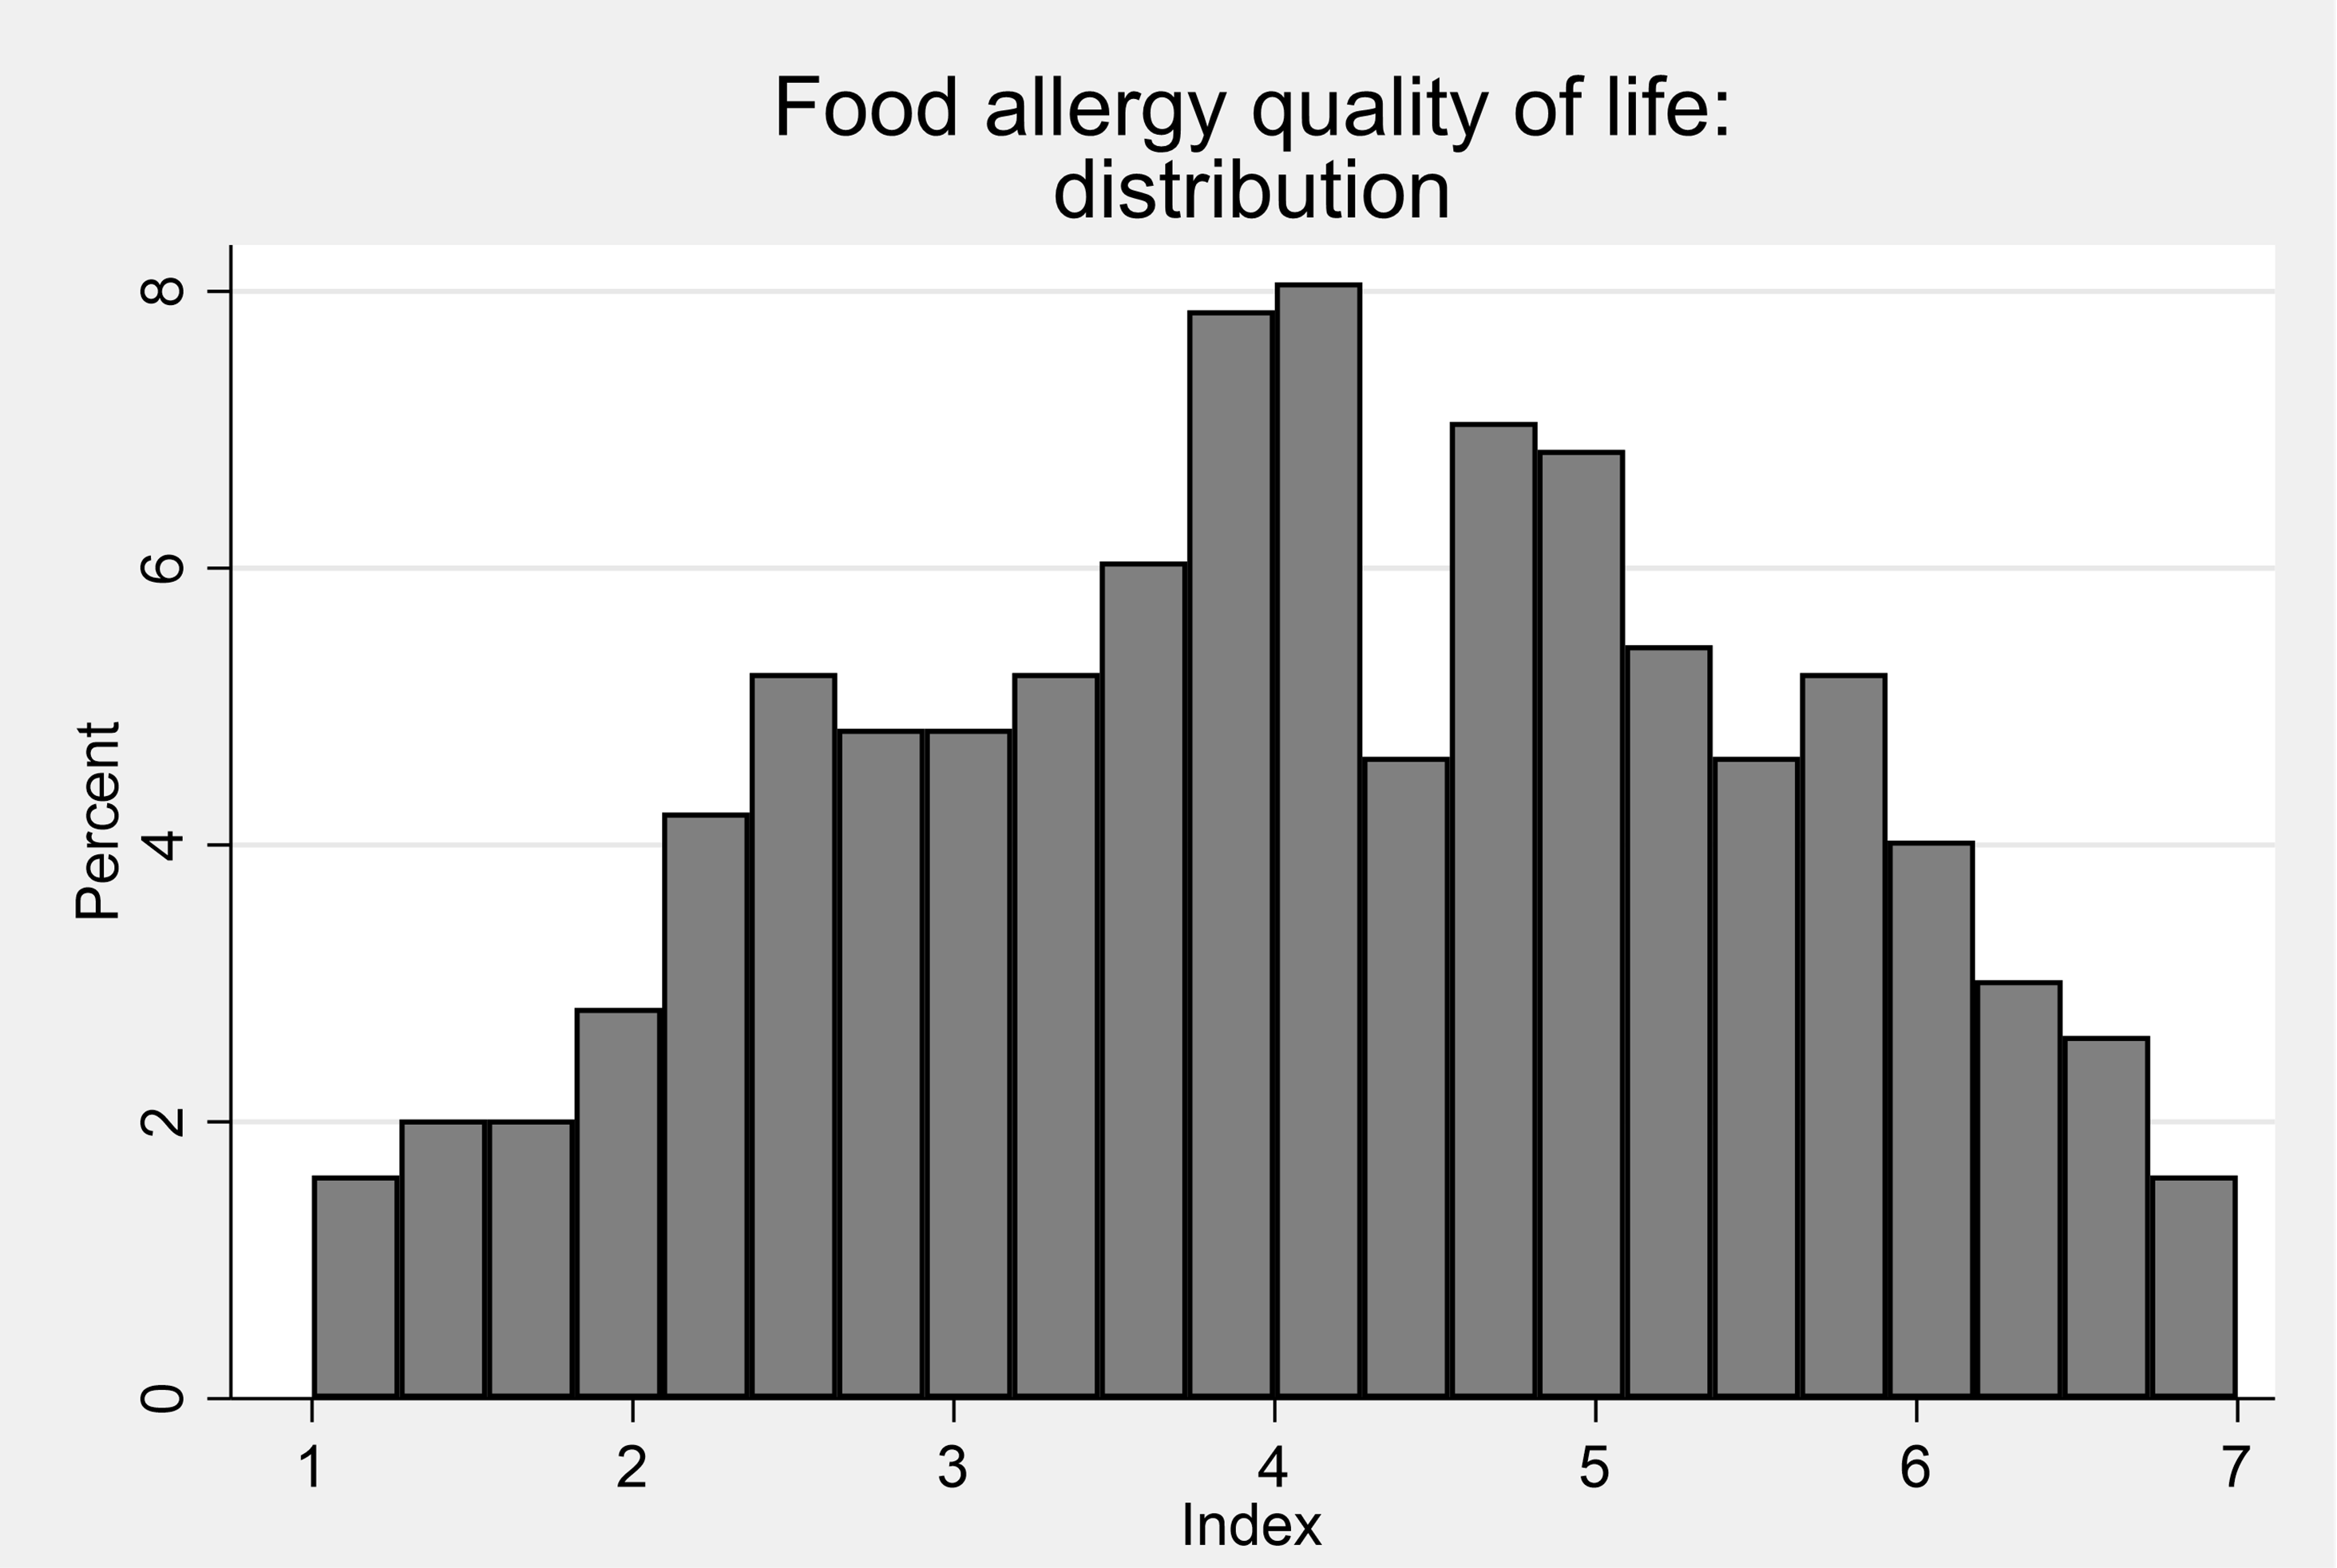
Both instruments, like the adult FAQLQ, comprises multiple items scored 1 to 7. The scores are averaged across the items to generate an individual-level score between 1 and 7.
The child/youth mean and median FAQLQ scores was 4.1.
Table 10. Summary statistics: child/youth FAQLQ index
| - | Mean | Std. Dev. | N | min | p25 | Median | p75 | max |
|---|---|---|---|---|---|---|---|---|
| FAQ | 4.1 | 1.41 | 496 | 1 | 3.04 | 4.07 | 5.15 | 7 |
Figure 4. Distribution of FAQLQ scores (child, allergy)
Child Food Intolerance: FIQLQ-PF
The Food Intolerance Quality of Life Questionnaire- Parent Form (FIQLQ-PF) was used for all children (although the questions used differ according to the age of the child). These assessments were completed by parents. The mean FIQLQ-PF score was 3.6 and the distribution of scores is shown in Figure 5.
Table 11. Summary statistics: FIQLQ-PF Index
| - | Mean | Std. Dev. | N | min | p25 | Median | p75 | max |
|---|---|---|---|---|---|---|---|---|
| FIQ | 3.63 | 1.4 | 147 | 1.16 | 2.55 | 3.5 | 4.68 | 6.8 |
Figure 5. Distribution of FIQLQ scores (child, intolerance)
Child Coeliac Disease: Celiac Disease DUX (CCDUX)
The Coeliac Disease DUX (CCDUX) is a validated HRQOL proxy questionnaire that parents complete about their children's condition. Responses are rated on a five-picture facial expression Likert scale on which a higher score indicates a worse quality of life.
Table 12. Summary statistics: CCDUX index
| - | Mean | Std. Dev. | N | min | p25 | Median | p75 | max |
|---|---|---|---|---|---|---|---|---|
| CCDUX | 41.66 | 9.18 | 73 | 15 | 36 | 42 | 48 | 60 |
Figure 6. Distribution of CCDUX scores (child, coeliac)
Revision log
Published: 21 October 2022
Last updated: 23 October 2023