Impacts of Food Hypersensitivities on Quality of Life in the UK and Willingness to Pay (WTP) to remove those impacts
Appendix J. Current and Contingent EQ5D and VAS, additional analysis
Additional analysis of Current and Contingent EQ5D and VAS
Table 1. Adult respondents reporting the domain level for each FHS and for multiple FHS
| Domain | Level | % of respondents reporting: Food Allergy | % of respondents reporting: Coeliac Disease | % of respondents reporting: Food Intolerance | % of respondents reporting: Multiple | % of respondents reporting: Total |
|---|---|---|---|---|---|---|
| Mobility | 1 | 69.34 | 77.36 | 60.55 | 52.33 | 66.62 |
| Mobility | 2 | 17.15 | 15.94 | 19.45 | 27.60 | 19.35 |
| Mobility | 3 | 7.66 | 4.13 | 13.42 | 12.54 | 8.84 |
| Mobility | 4 | 5.47 | 2.36 | 6.30 | 7.17 | 4.91 |
| Mobility | 5 | 0.36 | 0.20 | 0.27 | 0.36 | 0.28 |
| Selfcare | 1 | 85.04 | 94.88 | 78.08 | 77.06 | 85.20 |
| Selfcare | 2 | 5.47 | 3.15 | 13.15 | 13.62 | 8.20 |
| Selfcare | 3 | 7.66 | 1.57 | 6.85 | 8.24 | 5.40 |
| Selfcare | 4 | 1.09 | 0.39 | 1.92 | 1.08 | 1.05 |
| Selfcare | 5 | 0.73 | 0.00 | 0.00 | 0.00 | 0.14 |
| Usual Activity | 1 | 65.33 | 71.65 | 56.44 | 43.01 | 60.94 |
| Usual Activity | 2 | 17.15 | 19.29 | 23.84 | 29.03 | 21.95 |
| Usual Activity | 3 | 10.95 | 6.89 | 12.60 | 18.28 | 11.36 |
| Usual Activity | 4 | 4.01 | 2.17 | 6.85 | 8.96 | 5.05 |
| Usual Activity | 5 | 2.55 | 0.00 | 0.27 | 0.72 | 0.70 |
| Pain | 1 | 55.84 | 66.34 | 47.95 | 44.80 | 55.40 |
| Pain | 2 | 23.36 | 25.00 | 29.04 | 29.39 | 26.58 |
| Pain | 3 | 14.60 | 6.50 | 15.34 | 16.85 | 12.34 |
| Pain | 4 | 4.74 | 1.57 | 4.93 | 7.17 | 4.14 |
| Pain | 5 | 1.46 | 0.59 | 2.74 | 1.79 | 1.54 |
| Anxiety | 1 | 43.43 | 52.56 | 42.74 | 35.13 | 44.88 |
| Anxiety | 2 | 27.74 | 33.27 | 28.49 | 37.63 | 31.84 |
| Anxiety | 3 | 18.61 | 11.02 | 17.26 | 21.15 | 16.06 |
| Anxiety | 4 | 8.03 | 2.56 | 7.40 | 5.38 | 5.40 |
| Anxiety | 5 | 2.19 | 0.59 | 4.11 | 0.72 | 1.82 |
Table 2. Adult respondents reporting the domain level for the worst FHS or only FHS
| Domain | Level | % of respondents reporting: Food Allergy | % of respondents reporting: Coeliac Disease | % of respondents reporting: Food Intolerance | % of respondents reporting: Multiple |
|---|---|---|---|---|---|
| Mobility | 1 | 65.19 | 73.88 | 57.95 | 66.62 |
| Mobility | 2 | 20.00 | 17.97 | 20.68 | 19.35 |
| Mobility | 3 | 8.05 | 5.32 | 14.32 | 8.84 |
| Mobility | 4 | 6.49 | 2.50 | 6.82 | 4.91 |
| Mobility | 5 | 0.26 | 0.33 | 0.23 | 0.28 |
| Selfcare | 1 | 83.64 | 93.01 | 75.91 | 85.20 |
| Selfcare | 2 | 7.27 | 4.33 | 14.32 | 8.20 |
| Selfcare | 3 | 7.27 | 2.16 | 8.18 | 5.40 |
| Selfcare | 4 | 1.30 | 0.50 | 1.59 | 1.05 |
| Selfcare | 5 | 0.52 | 0.00 | 0.00 | 0.14 |
| Usual Activity | 1 | 60.52 | 67.22 | 52.73 | 60.94 |
| Usual Activity | 2 | 20.00 | 21.30 | 24.55 | 21.95 |
| Usual Activity | 3 | 12.47 | 8.99 | 13.64 | 11.36 |
| Usual Activity | 4 | 5.19 | 2.33 | 8.64 | 5.05 |
| Usual Activity | 5 | 1.82 | 0.17 | 0.45 | 0.70 |
| Pain | 1 | 53.25 | 63.06 | 46.82 | 55.40 |
| Pain | 2 | 25.71 | 26.62 | 27.27 | 26.58 |
| Pain | 3 | 14.55 | 7.82 | 16.59 | 12.34 |
| Pain | 4 | 4.68 | 2.00 | 6.59 | 4.14 |
| Pain | 5 | 1.82 | 0.50 | 2.73 | 1.54 |
| Anxiety | 1 | 40.26 | 50.42 | 41.36 | 44.88 |
| Anxiety | 2 | 31.43 | 34.11 | 29.09 | 31.84 |
| Anxiety | 3 | 19.22 | 12.48 | 18.18 | 16.06 |
| Anxiety | 4 | 7.53 | 2.50 | 7.50 | 5.40 |
| Anxiety | 5 | 1.56 | 0.50 | 3.86 | 1.82 |
Figure 1. Reported domain levels for the adult respondents compared with the UK population
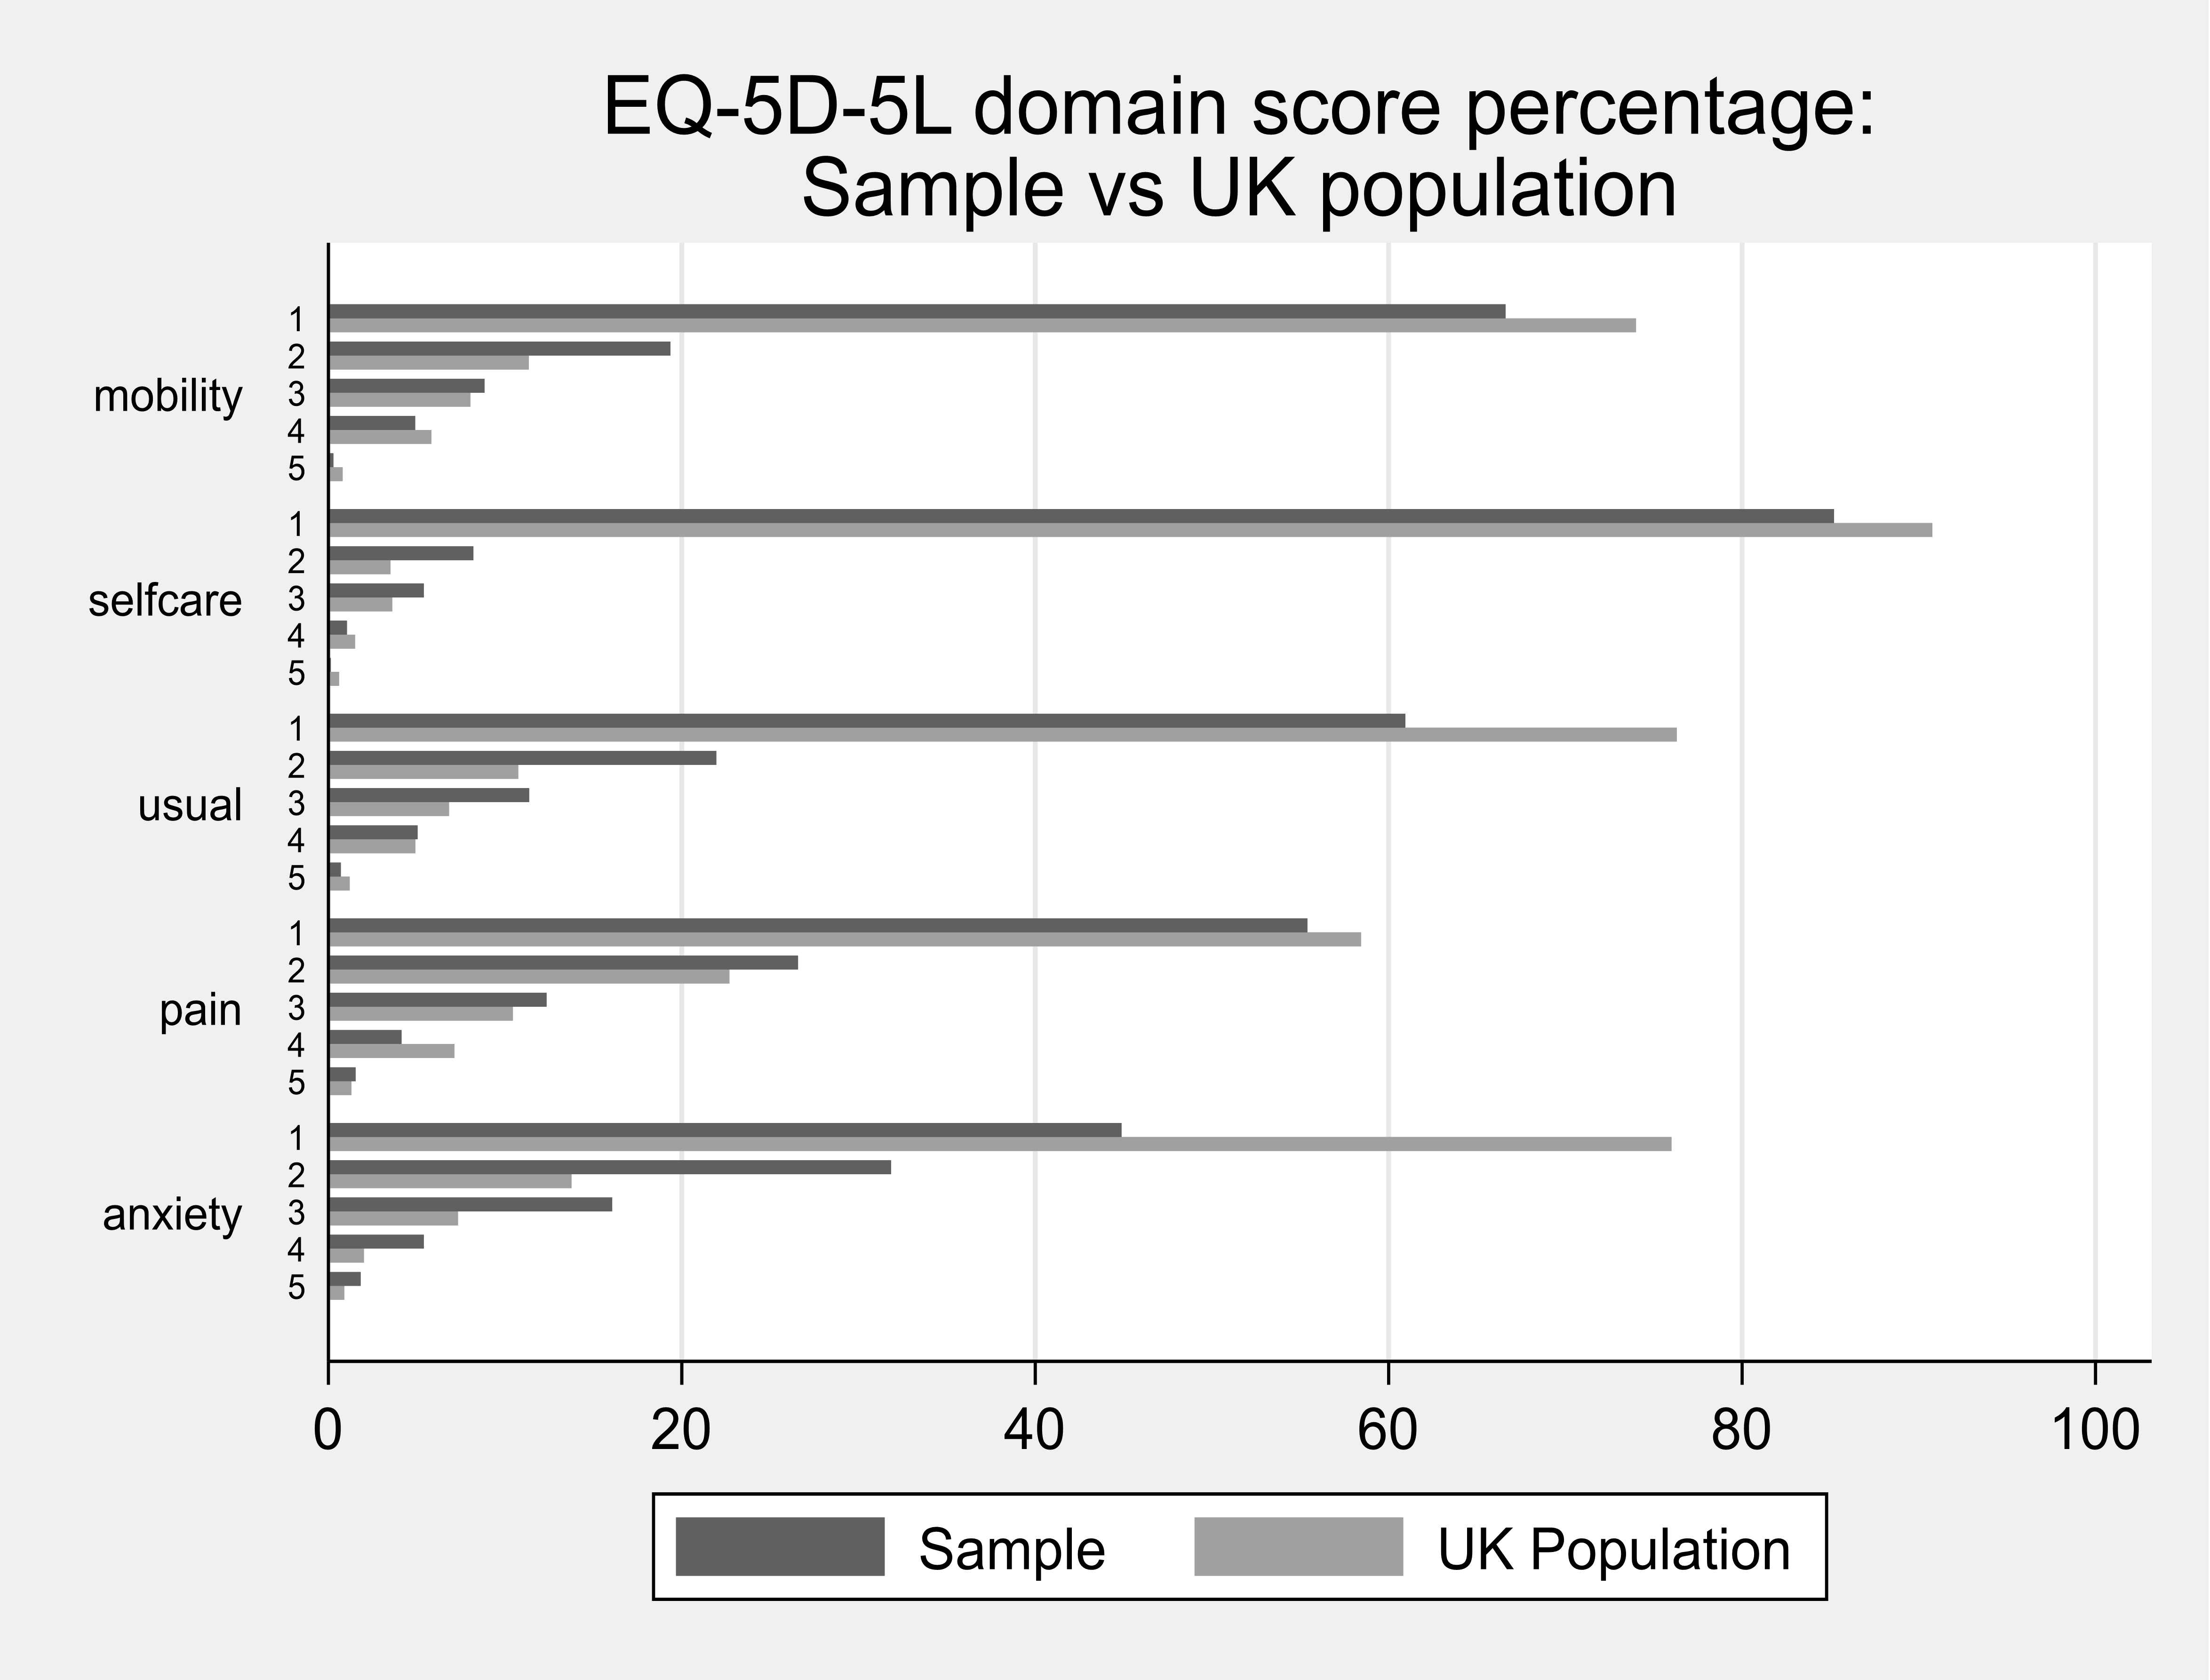
Table 3. Reported domain levels for the adult respondents compared with the UK population
| Domain | Level | Sample: Frequency | Sample: Percent | UK Population: Frequency | UK Population: Percent |
|---|---|---|---|---|---|
| Mobility | 1 | 950 | 66.6 | 737 | 74.0 |
| Mobility | 2 | 276 | 19.4 | 113 | 11.3 |
| Mobility | 3 | 126 | 8.8 | 80 | 8.0 |
| Mobility | 4 | 70 | 4.9 | 58 | 5.8 |
| Mobility | 5 | 4 | 0.3 | 8 | 0.8 |
| Selfcare | 1 | 1215 | 85.2 | 861 | 92.1 |
| Selfcare | 2 | 117 | 8.2 | 39 | 4.2 |
| Selfcare | 3 | 77 | 5.4 | 26 | 2.8 |
| Selfcare | 4 | 15 | 1.1 | 7 | 0.7 |
| Selfcare | 5 | 2 | 0.1 | 2 | 0.2 |
| Usual Activity | 1 | 869 | 60.9 | 708 | 75.7 |
| Usual Activity | 2 | 313 | 21.9 | 122 | 13.0 |
| Usual Activity | 3 | 162 | 11.4 | 77 | 8.2 |
| Usual Activity | 4 | 72 | 5.0 | 22 | 2.4 |
| Usual Activity | 5 | 10 | 0.7 | 6 | 0.6 |
| Pain | 1 | 526 | 36.9 | 426 | 45.5 |
| Pain | 2 | 526 | 36.9 | 293 | 31.3 |
| Pain | 3 | 272 | 191.1 | 159 | 17.0 |
| Pain | 4 | 76 | 5.3 | 45 | 4.8 |
| Pain | 5 | 26 | 1.8 | 13 | 1.4 |
| Anxiety | 1 | 640 | 44.9 | 442 | 47.2 |
| Anxiety | 2 | 454 | 31.8 | 266 | 28.4 |
| Anxiety | 3 | 229 | 16.1 | 162 | 17.3 |
| Anxiety | 4 | 77 | 5.4 | 47 | 5.0 |
| Anxiety | 5 | 26 | 1.8 | 20 | 2.1 |
Source: UK population values taken from Feng, Y., Devlin, N., & Herdman, M. (2015). Assessing the health of the general population in England: how do the three- and five-level versions of EQ-5D compare?. Health and quality of life outcomes, 13, 171.
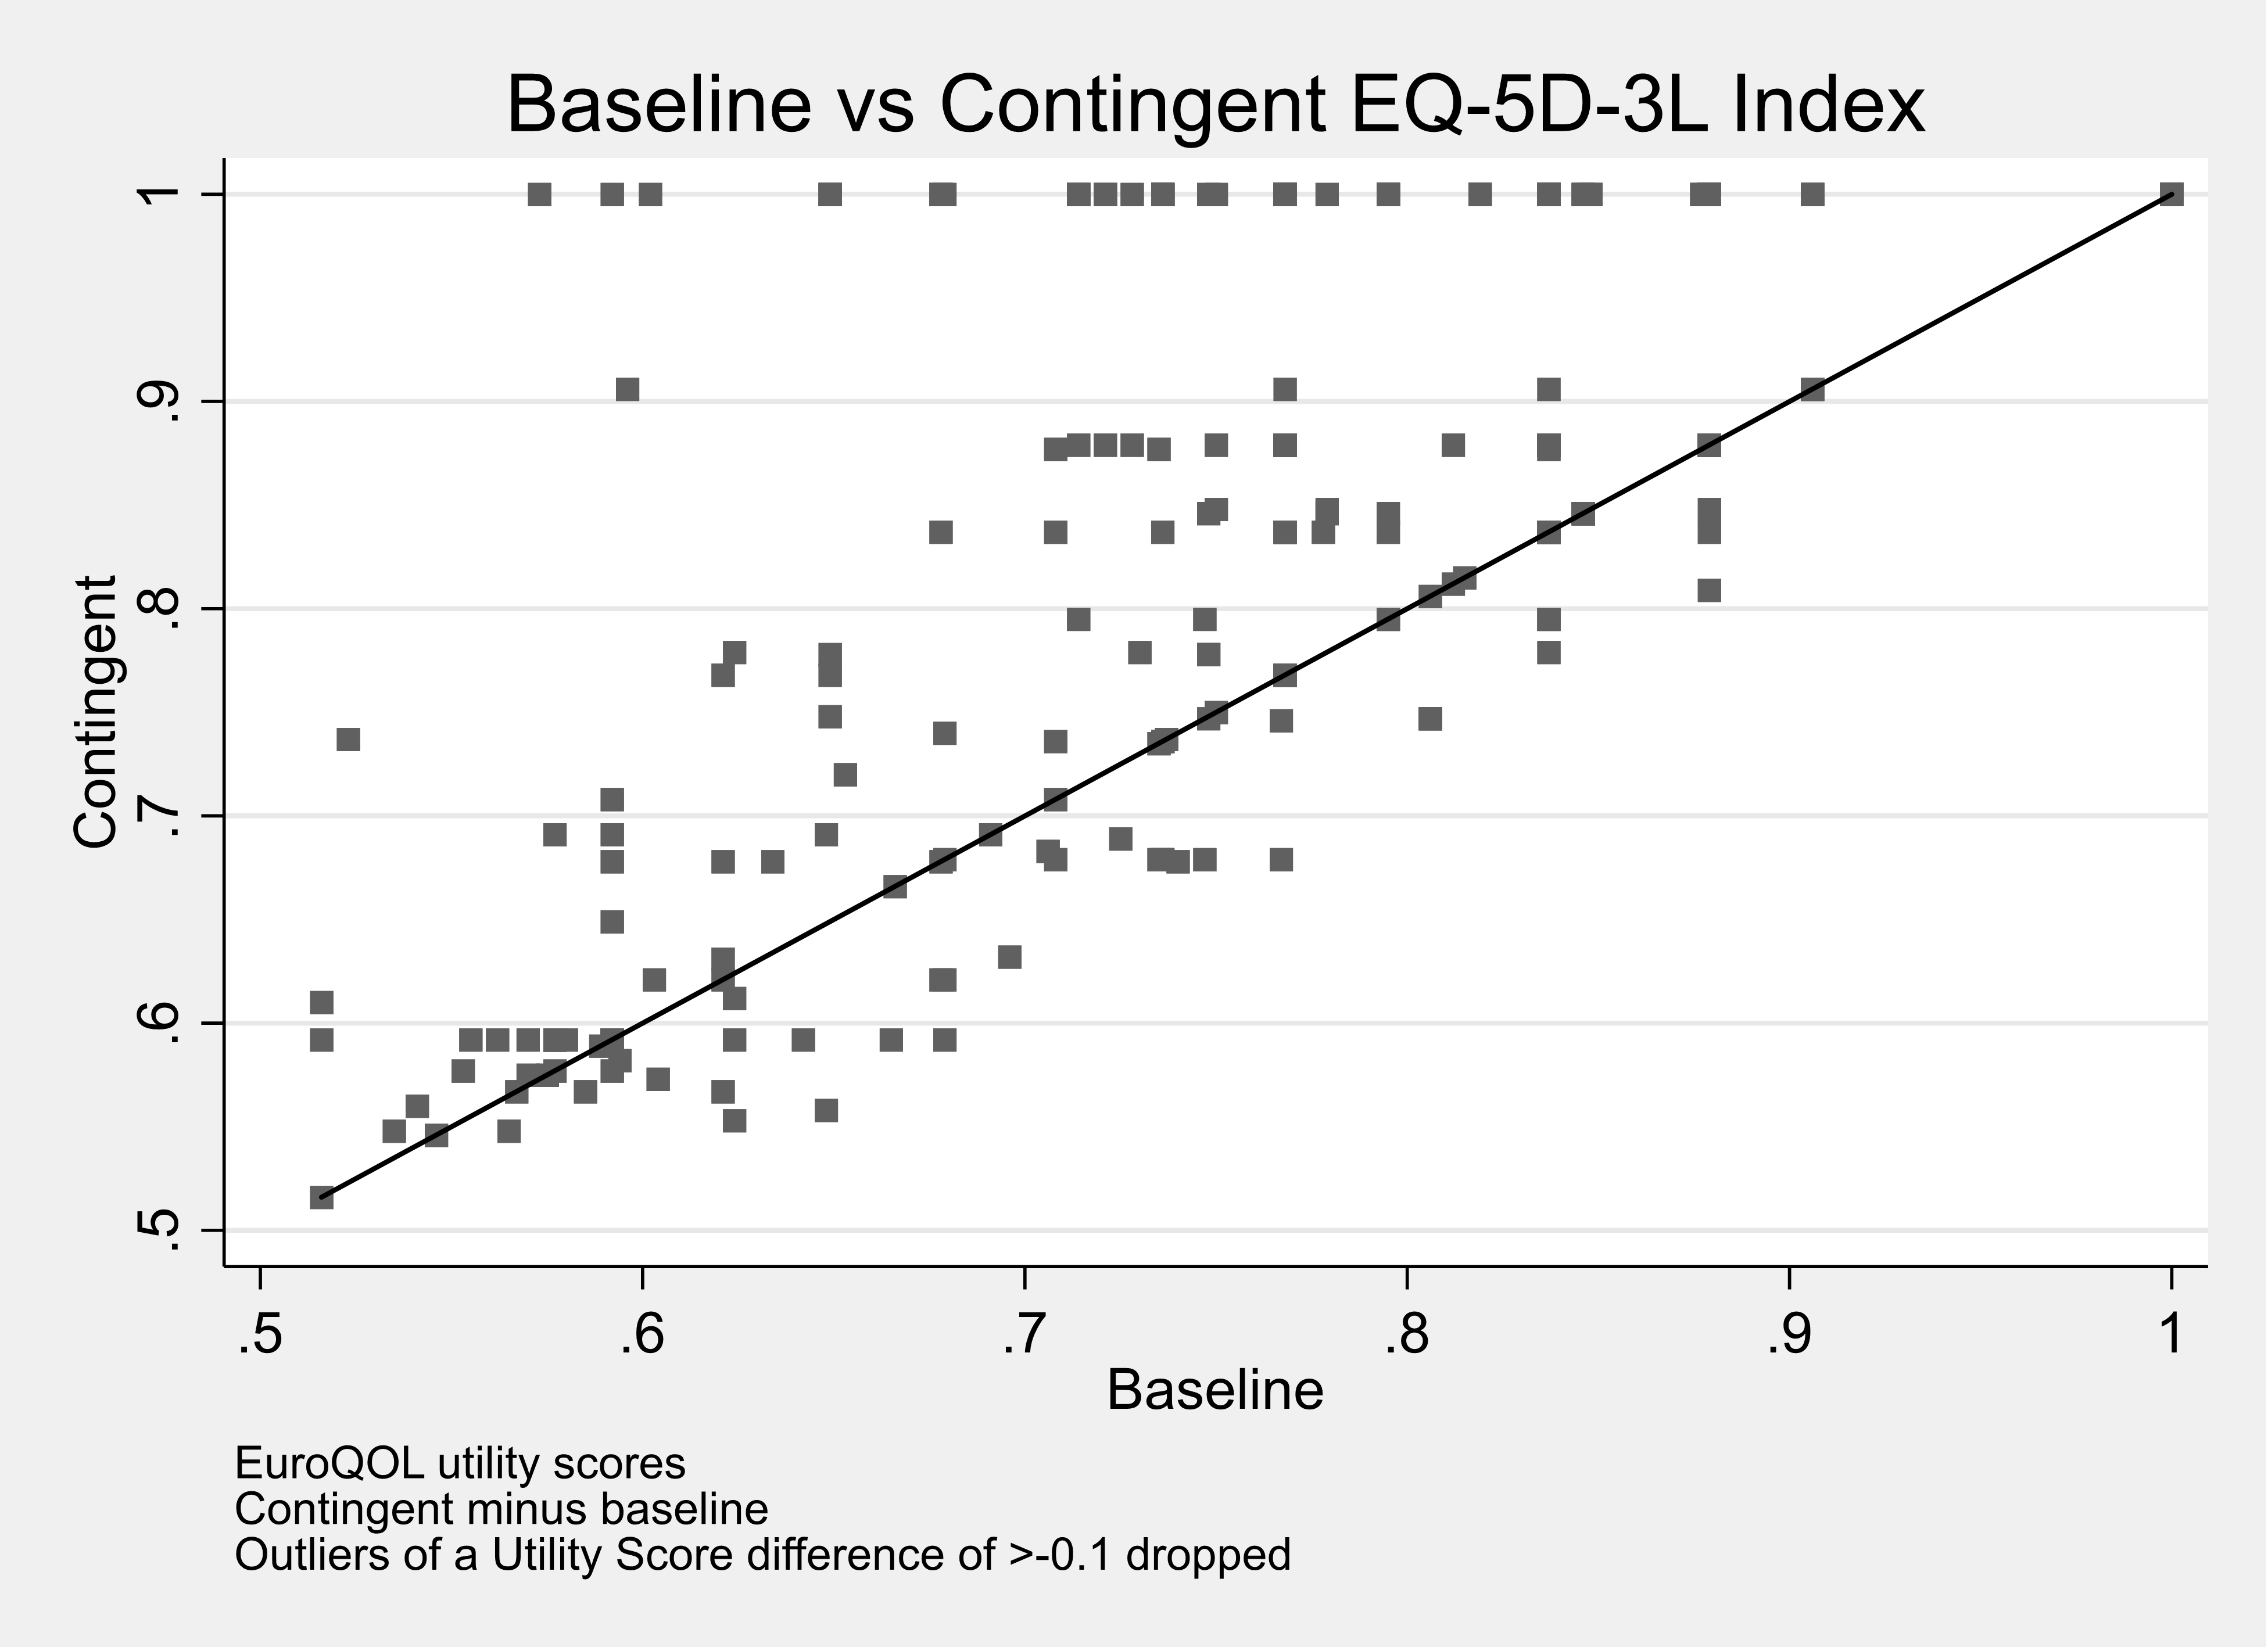
Figure 2. Scatter plot of calculated baseline and contingent health utility score from the EQ5D-5 L for adults
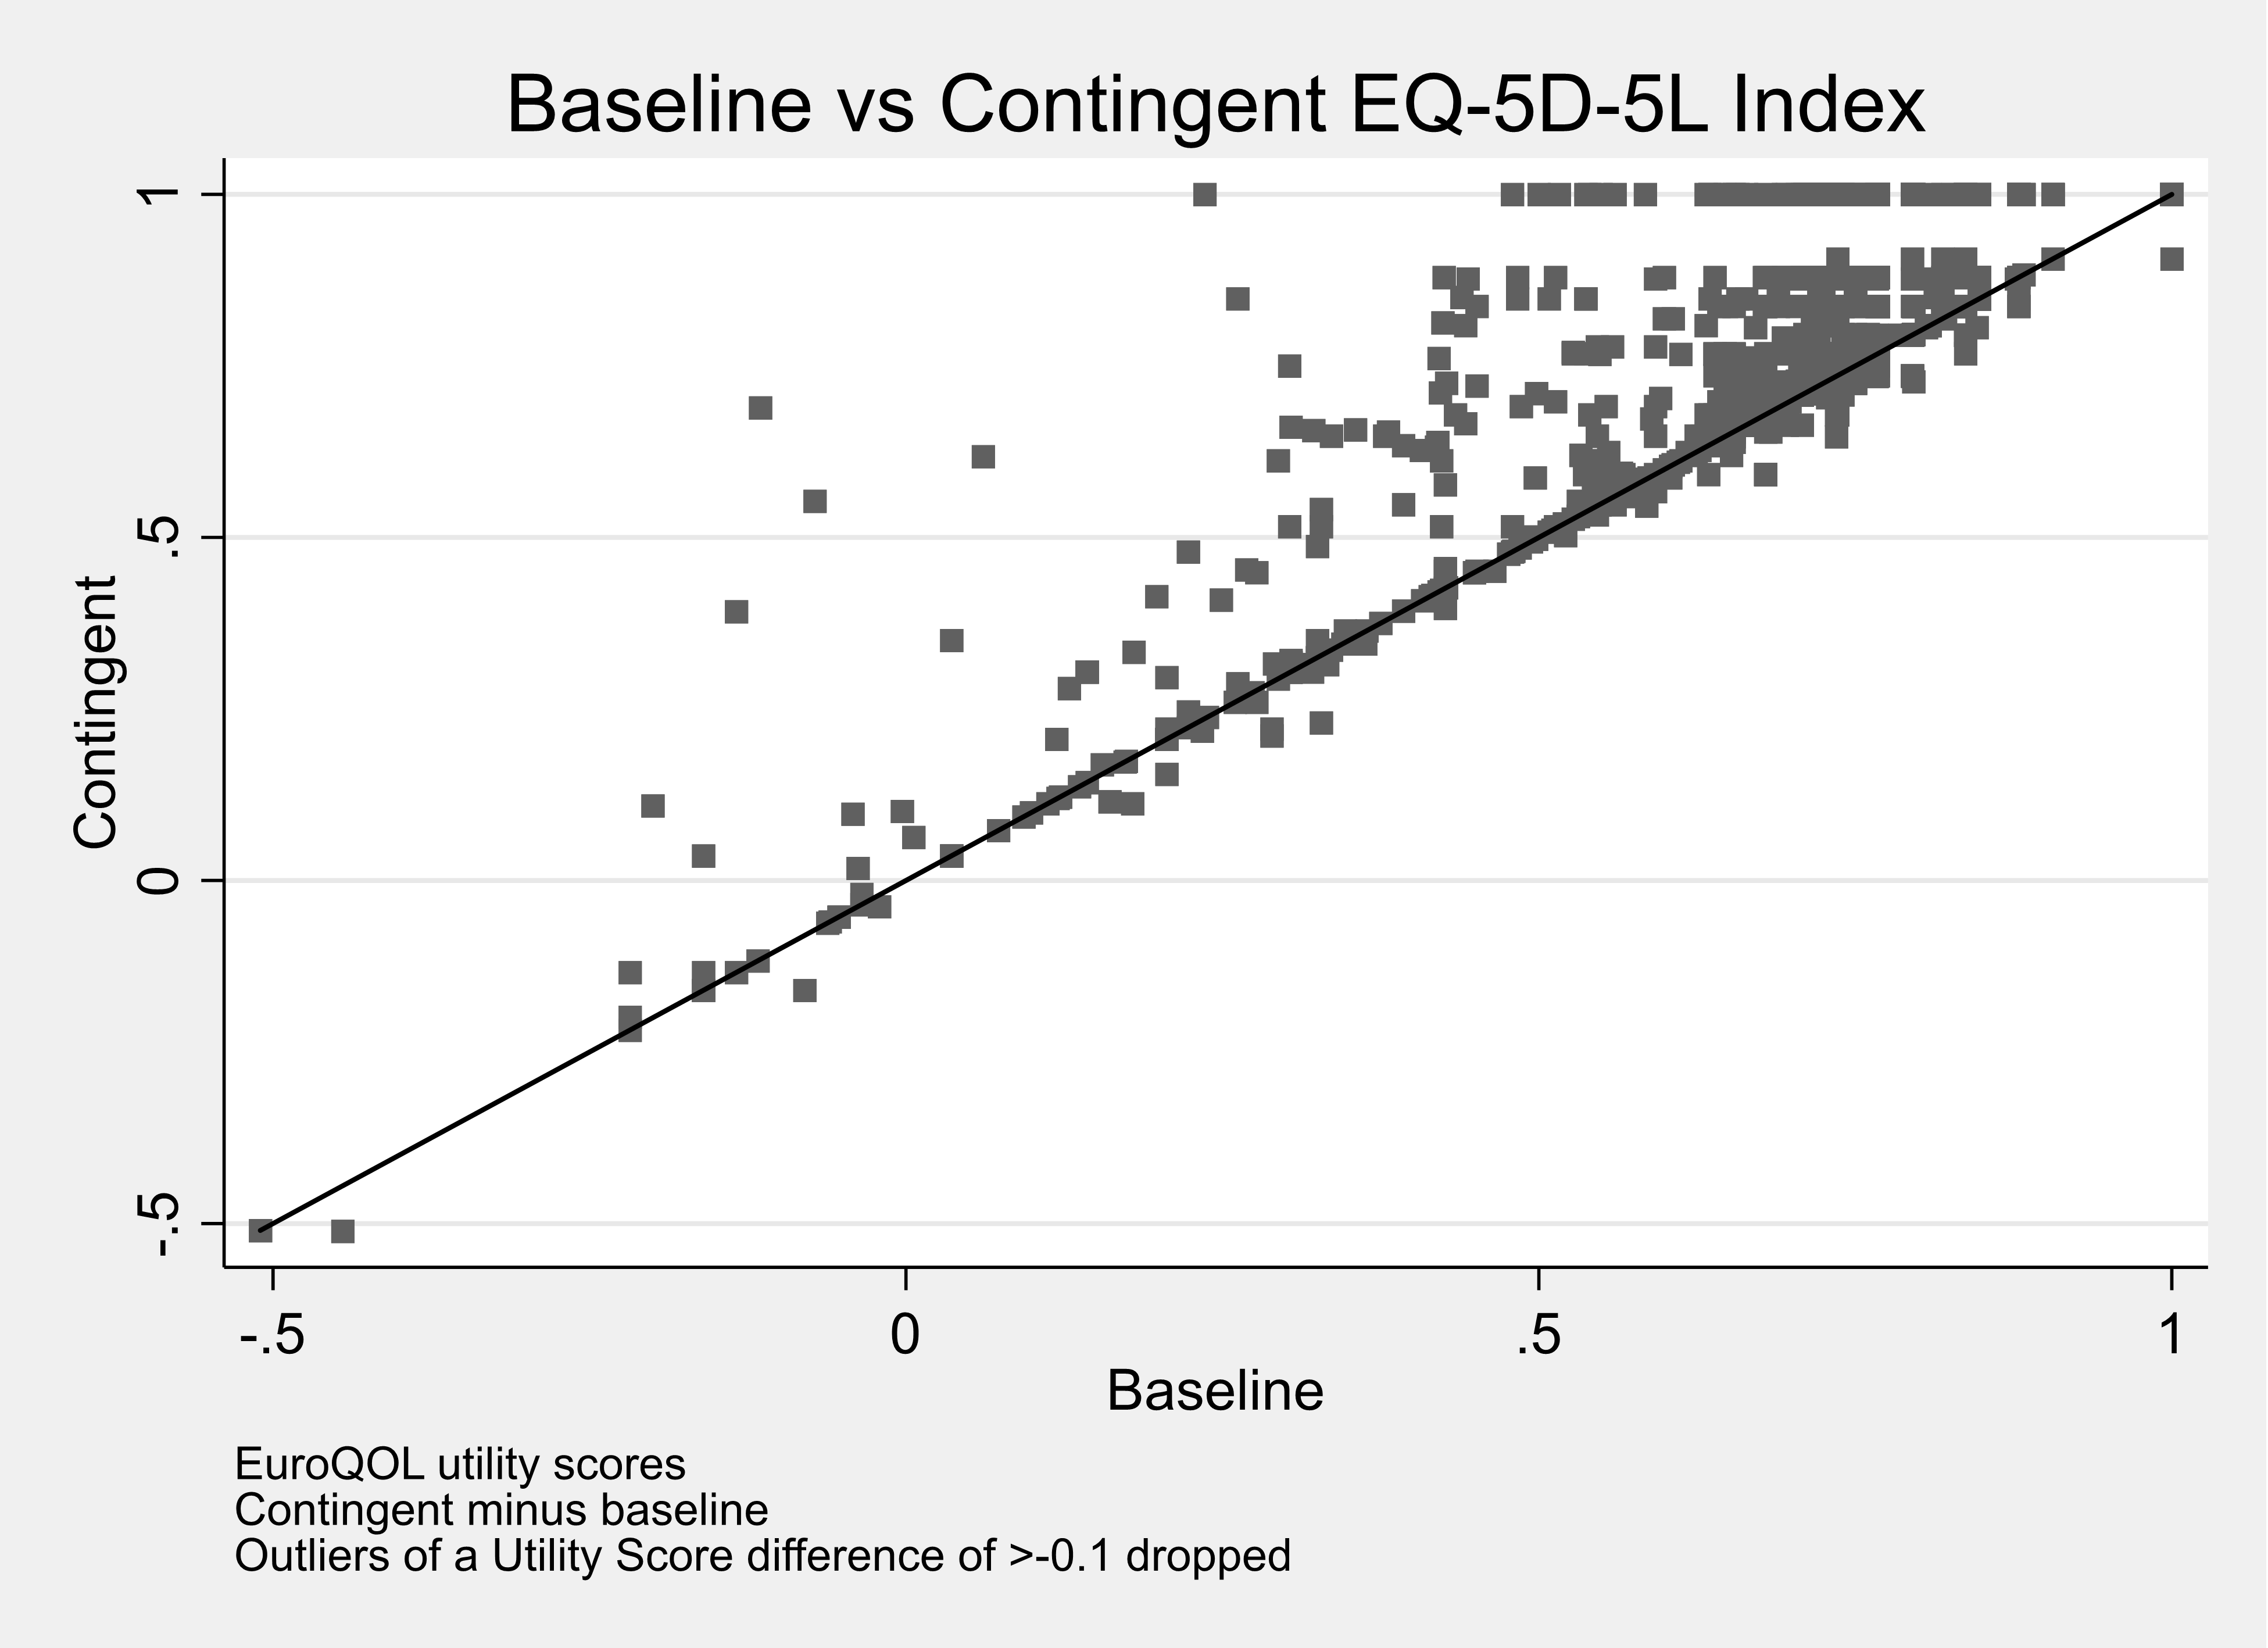
Footnote: Matrix of correlations
| Variables | (1) baseline health | (2) contingent health |
|---|---|---|
| (1) baseline health | 1.000 | - |
| (2) contingent health | 0.889 | 1.000 |
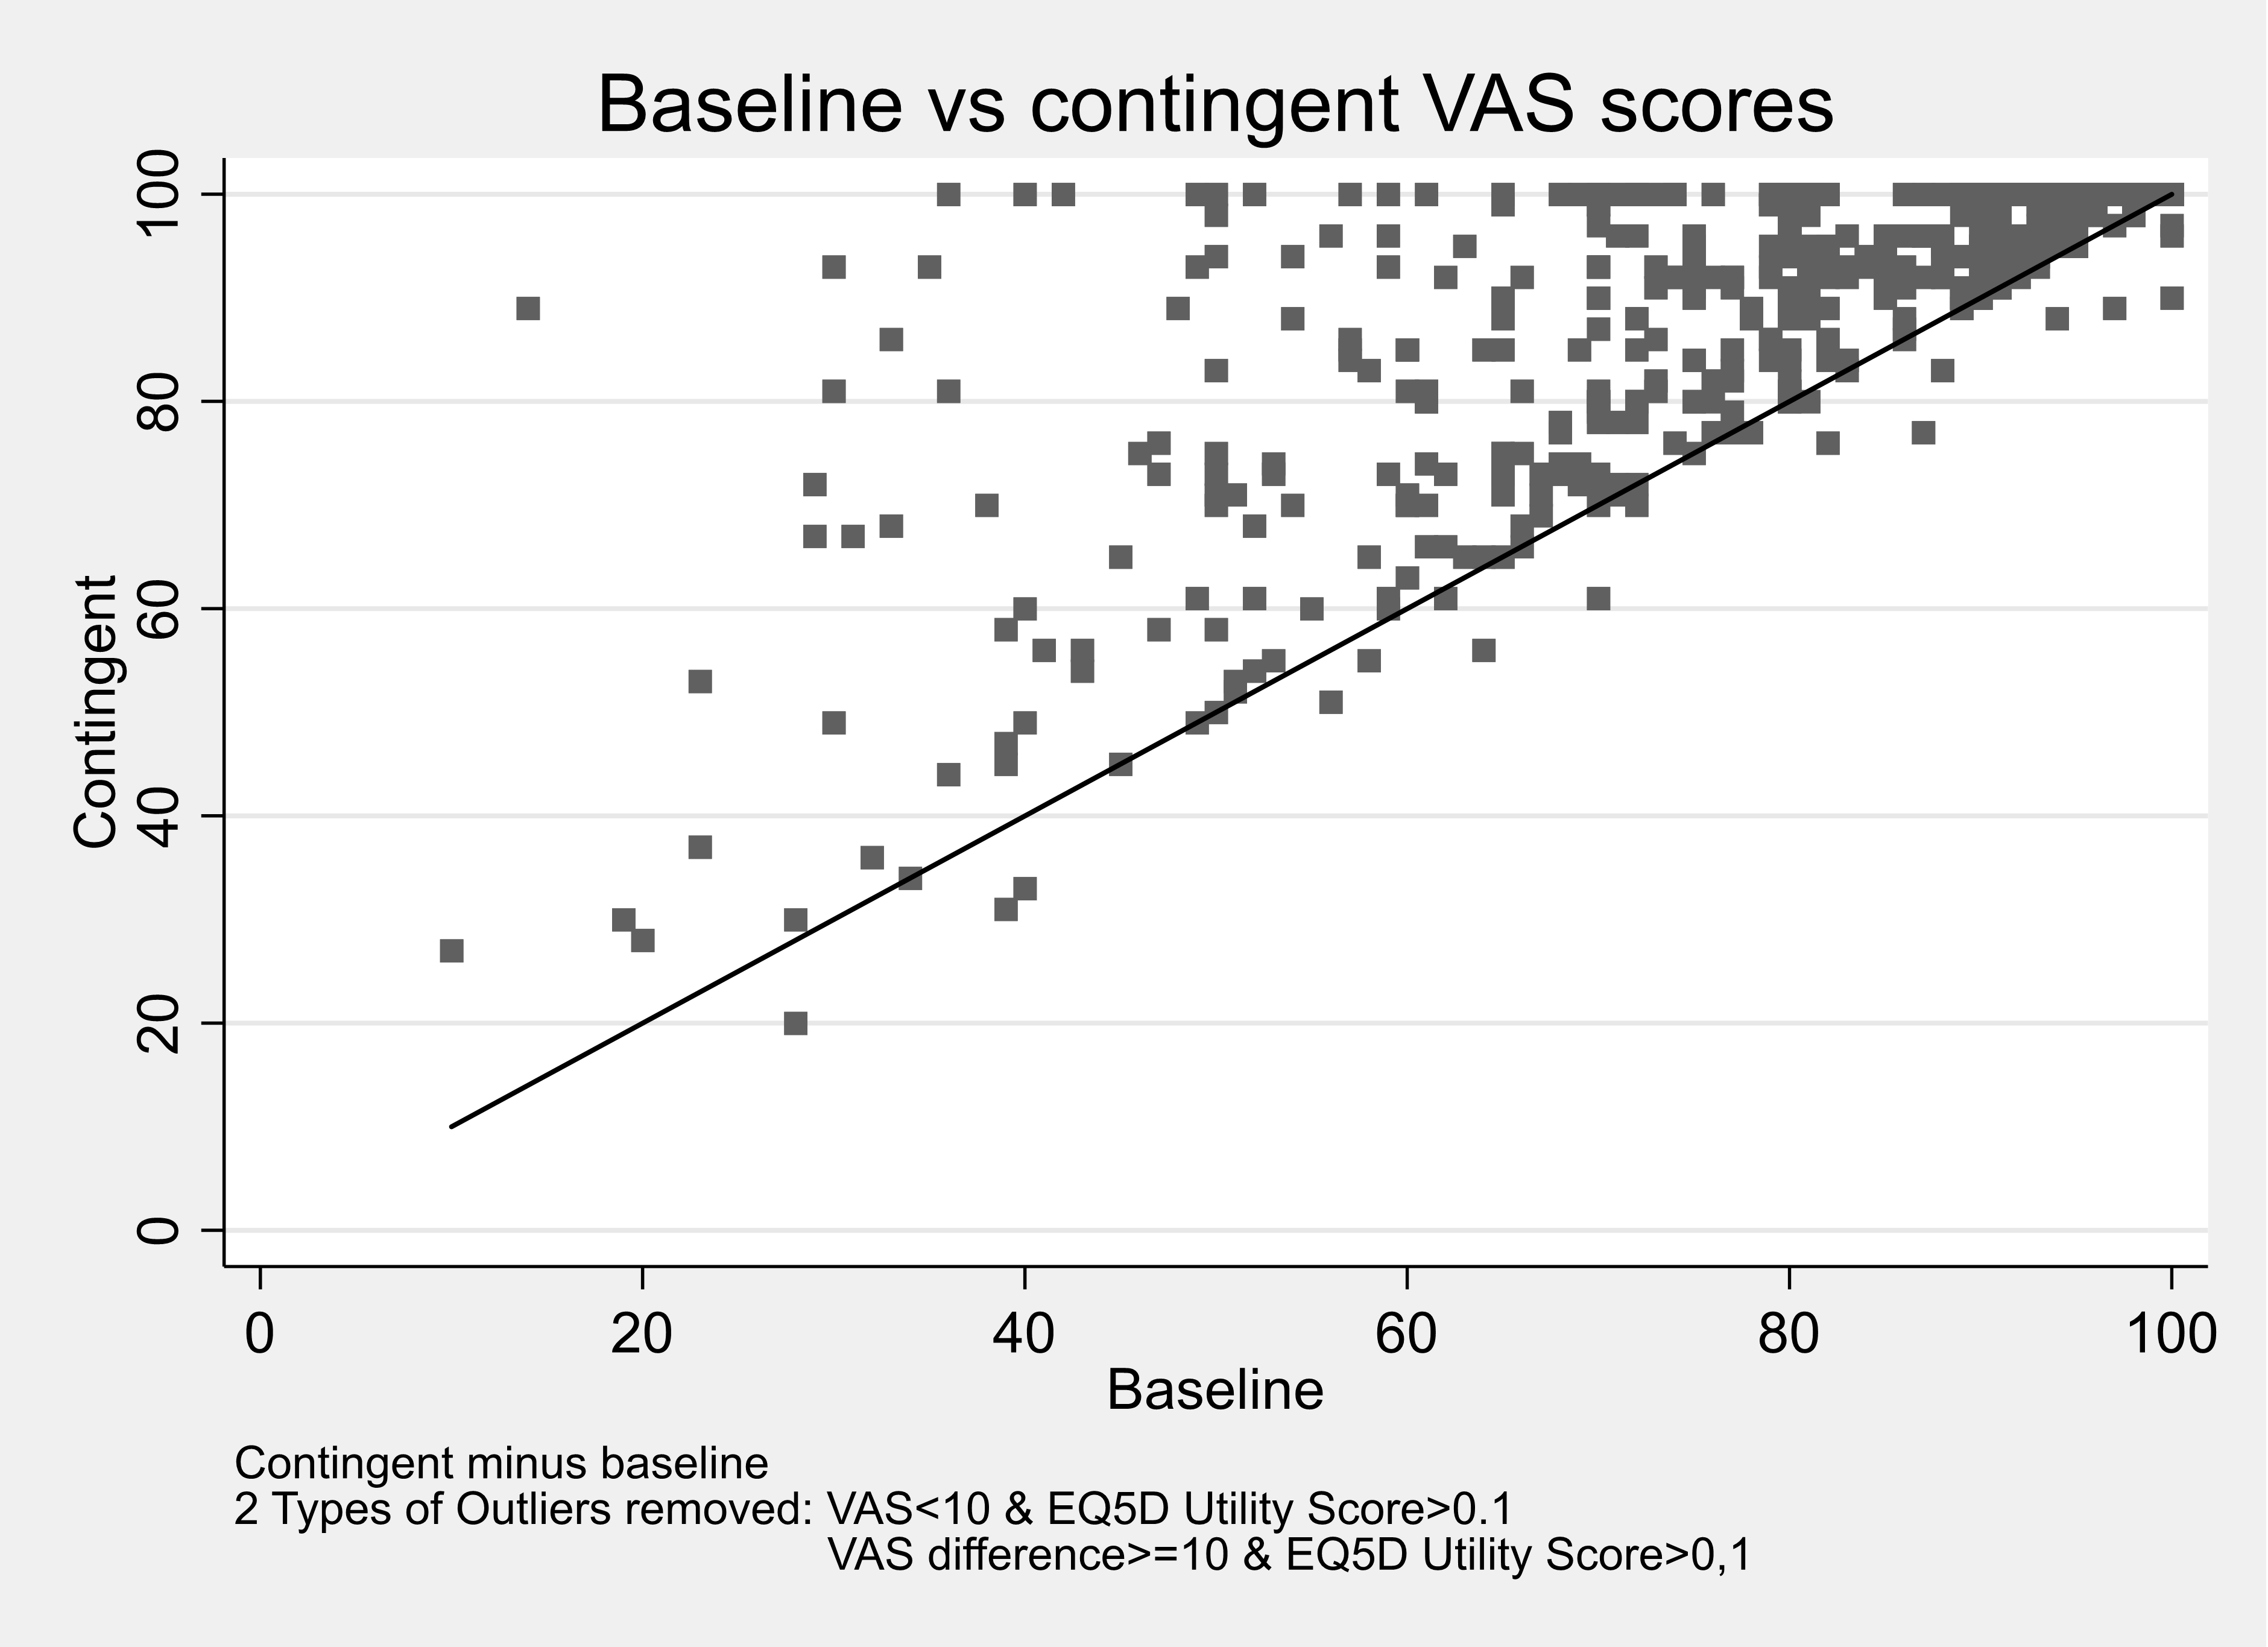
Figure 3. Scatter plot of calculated baseline and contingent health utility score from the EQ-VAS for adults
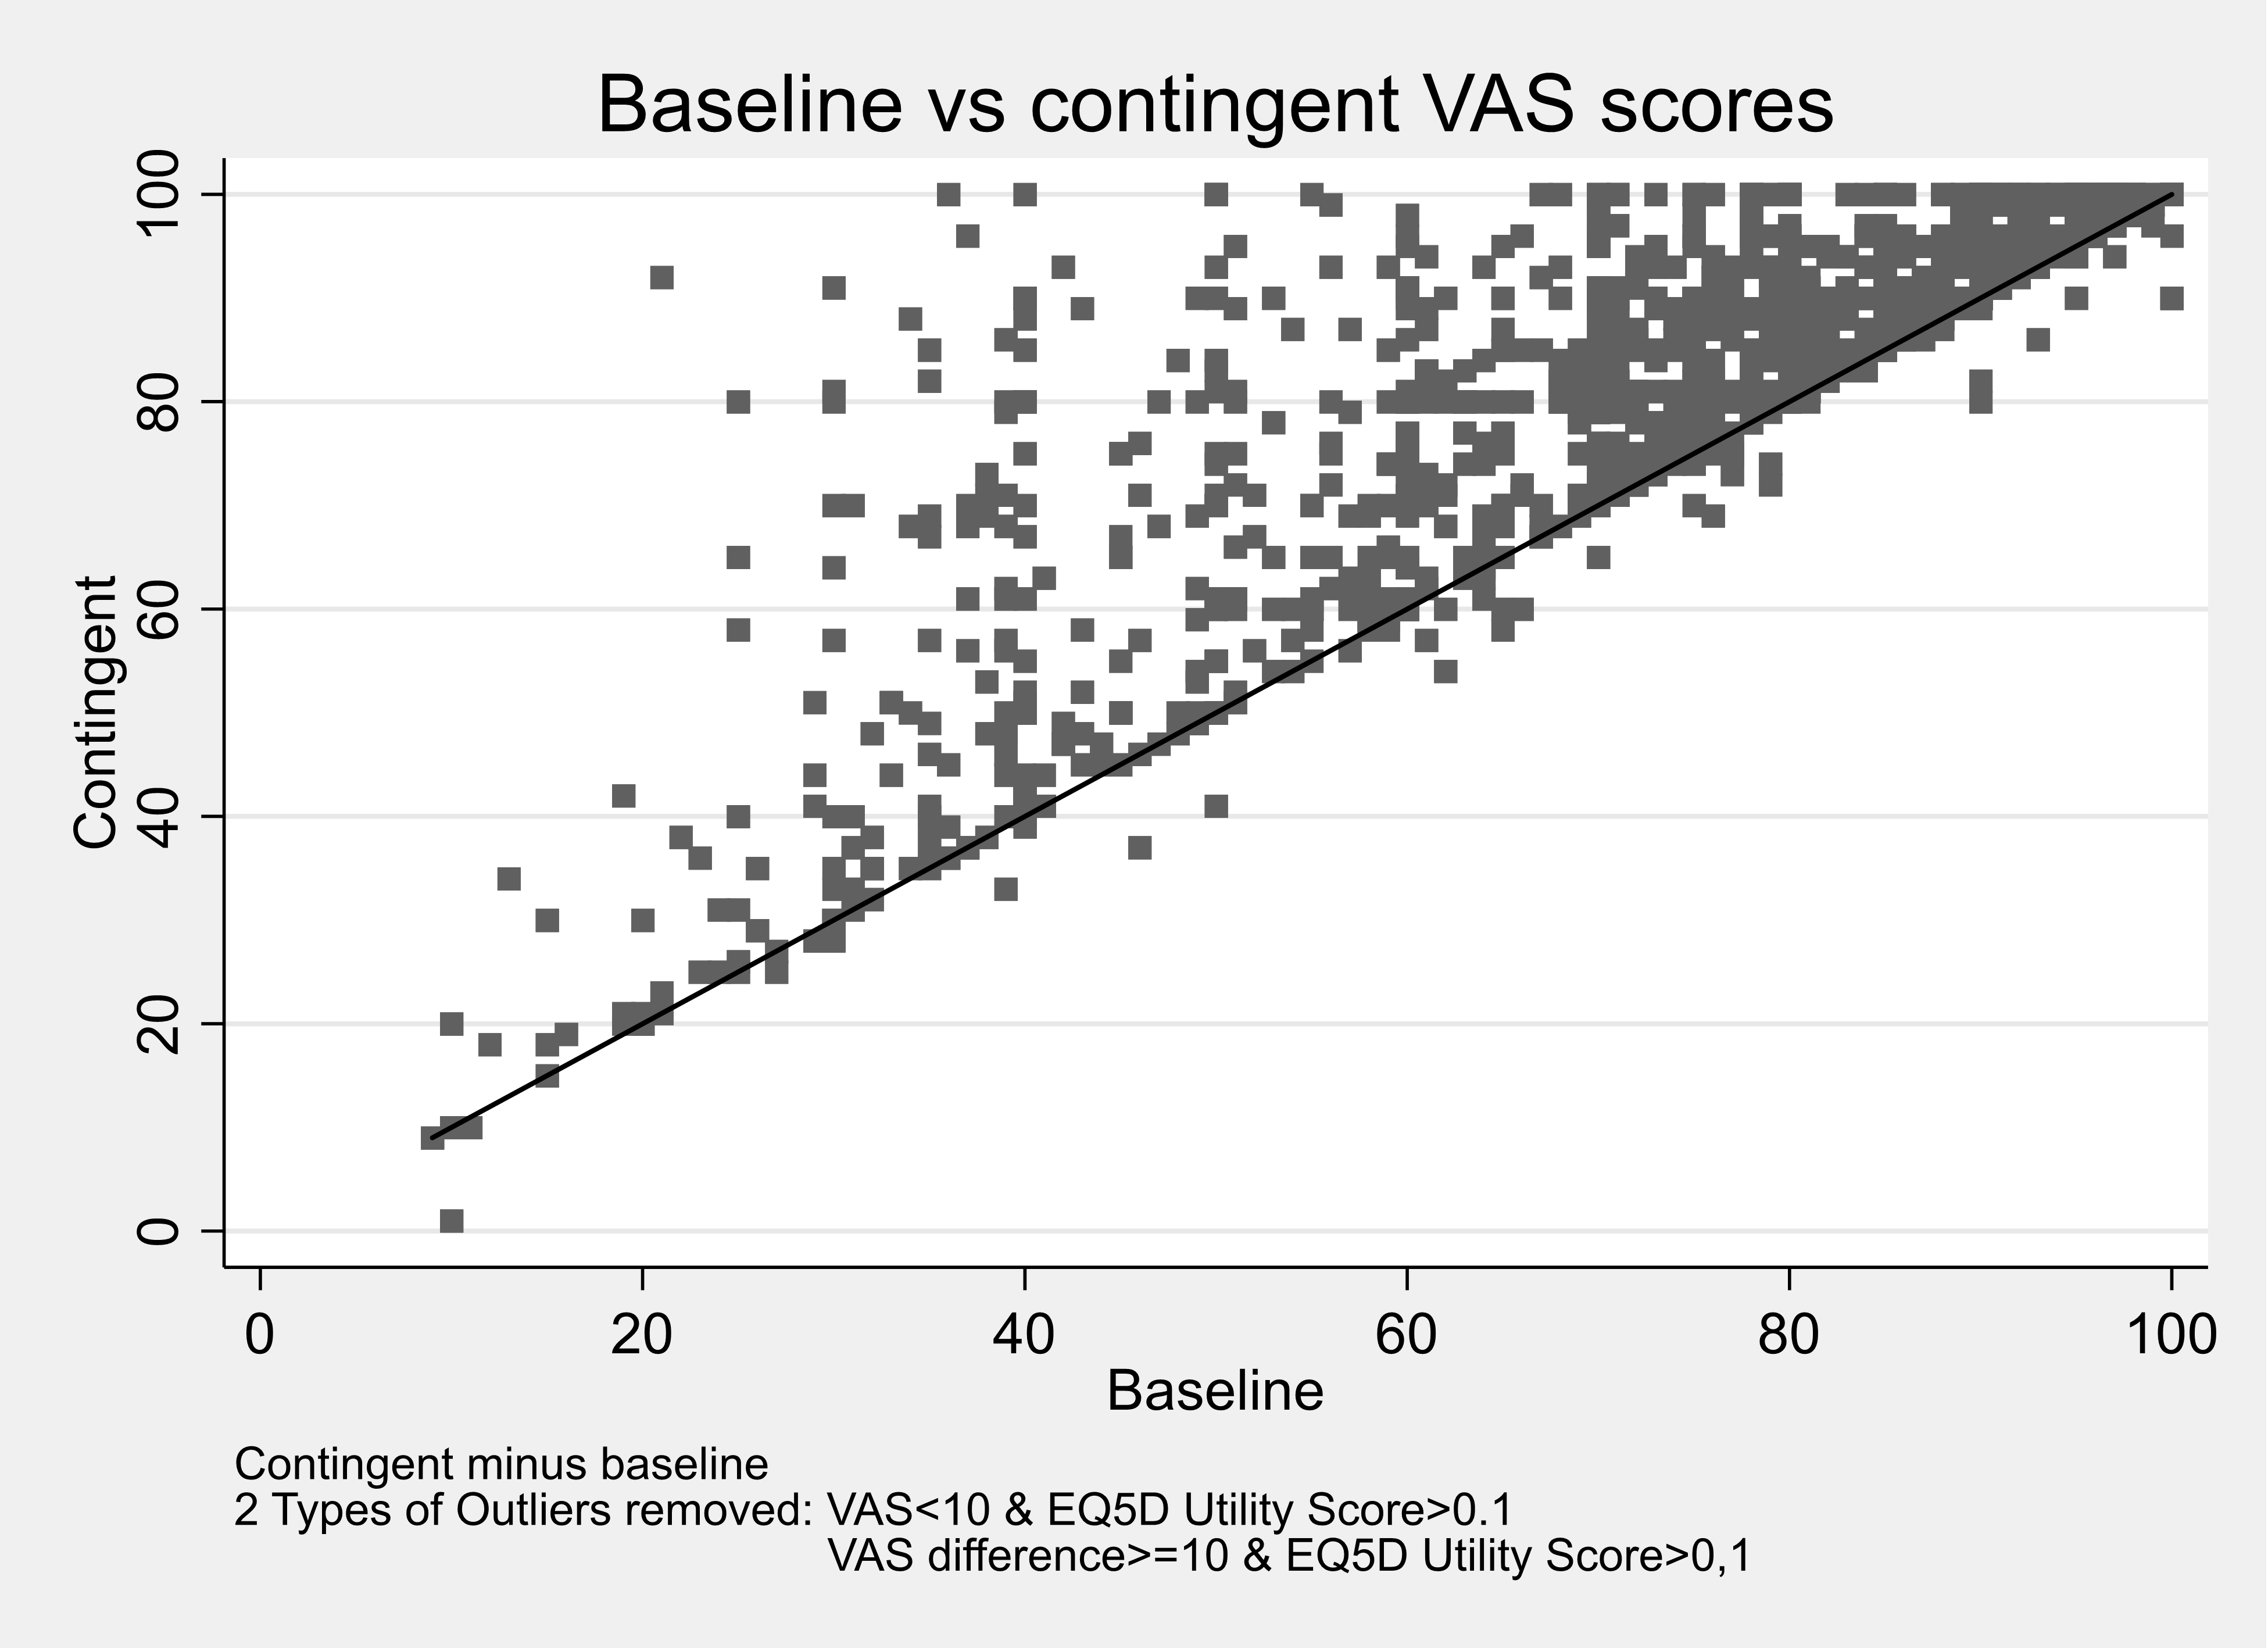
Footnote: Matrix of correlations
| Variables | (1) baseline health | (2) contingent health |
|---|---|---|
| (1) baseline health | 1.000 | - |
| (2) contingent health | 0.86 | 1.000 |
Table 4. Parent proxy values for children reporting the domain level for each FHS and for multiple FHS
| Domain | Level | % of respondents reporting the level: Food Allergy | % of respondents reporting the level: Coeliac Disease | % of respondents reporting the level: Food Intolerance | % of respondents reporting the level: Multiple | Total |
|---|---|---|---|---|---|---|
| Mobility | 1 | 90.88 | 67.86 | 91.30 | 75.71 | 86.99 |
| Mobility | 2 | 7.98 | 25.00 | 6.96 | 20.00 | 10.81 |
| Mobility | 3 | 1.14 | 7.14 | 1.74 | 4.29 | 2.20 |
| Selfcare | 1 | 85.19 | 71.43 | 84.35 | 71.43 | 82.09 |
| Selfcare | 2 | 13.39 | 25.00 | 13.04 | 24.29 | 15.71 |
| Selfcare | 3 | 1.42 | 3.57 | 2.61 | 4.29 | 2.20 |
| Usual Activity | 1 | 82.05 | 66.07 | 75.65 | 58.57 | 76.52 |
| Usual Activity | 2 | 14.81 | 26.79 | 20.00 | 34.29 | 19.26 |
| Usual Activity | 3 | 3.13 | 7.14 | 4.35 | 7.14 | 4.22 |
| Pain | 1 | 74.07 | 48.21 | 54.78 | 41.43 | 64.02 |
| Pain | 2 | 23.36 | 48.21 | 40.87 | 52.86 | 32.60 |
| Pain | 3 | 2.56 | 3.57 | 4.35 | 5.71 | 3.88 |
| Anxiety | 1 | 61.25 | 46.43 | 57.39 | 38.57 | 56.42 |
| Anxiety | 2 | 33.05 | 46.43 | 34.78 | 44.29 | 35.98 |
| Anxiety | 3 | 5.70 | 7.14 | 7.83 | 17.14 | 7.60 |
Table 5. Parent proxy values for children reporting the domain level for each FHS and for the worst FHS or only FHS
| Domain | Level | % of respondents reporting the level: Food Allergy | % of respondents reporting the level: Coeliac Disease | % of respondents reporting the level: Food Intolerance | % of respondents reporting the level: Multiple |
|---|---|---|---|---|---|
| Mobility | 1 | 90.00 | 70.15 | 86.40 | 86.99 |
| Mobility | 2 | 8.75 | 22.39 | 11.20 | 10.81 |
| Mobility | 3 | 1.25 | 7.46 | 2.40 | 2.20 |
| Selfcare | 1 | 83.75 | 71.64 | 82.40 | 82.09 |
| Selfcare | 2 | 14.00 | 26.87 | 15.20 | 15.71 |
| Selfcare | 3 | 2.25 | 1.49 | 2.40 | 2.20 |
| Usual Activity | 1 | 79.50 | 65.67 | 72.80 | 76.52 |
| Usual Activity | 2 | 17.25 | 26.87 | 21.60 | 19.26 |
| Usual Activity | 3 | 3.25 | 7.46 | 5.60 | 4.22 |
| Pain | 1 | 70.75 | 49.25 | 50.40 | 64.02 |
| Pain | 2 | 26.75 | 47.76 | 43.20 | 32.60 |
| Pain | 3 | 2.50 | 2.99 | 6.40 | 3.38 |
| Anxiety | 1 | 59.00 | 41.79 | 56.00 | 56.42 |
| Anxiety | 2 | 34.50 | 49.25 | 33.60 | 35.98 |
| Anxiety | 3 | 6.50 | 8.96 | 10.40 | 7.60 |
Figure 4. Reported domain levels for a child as valued by a parent compared with the UK population
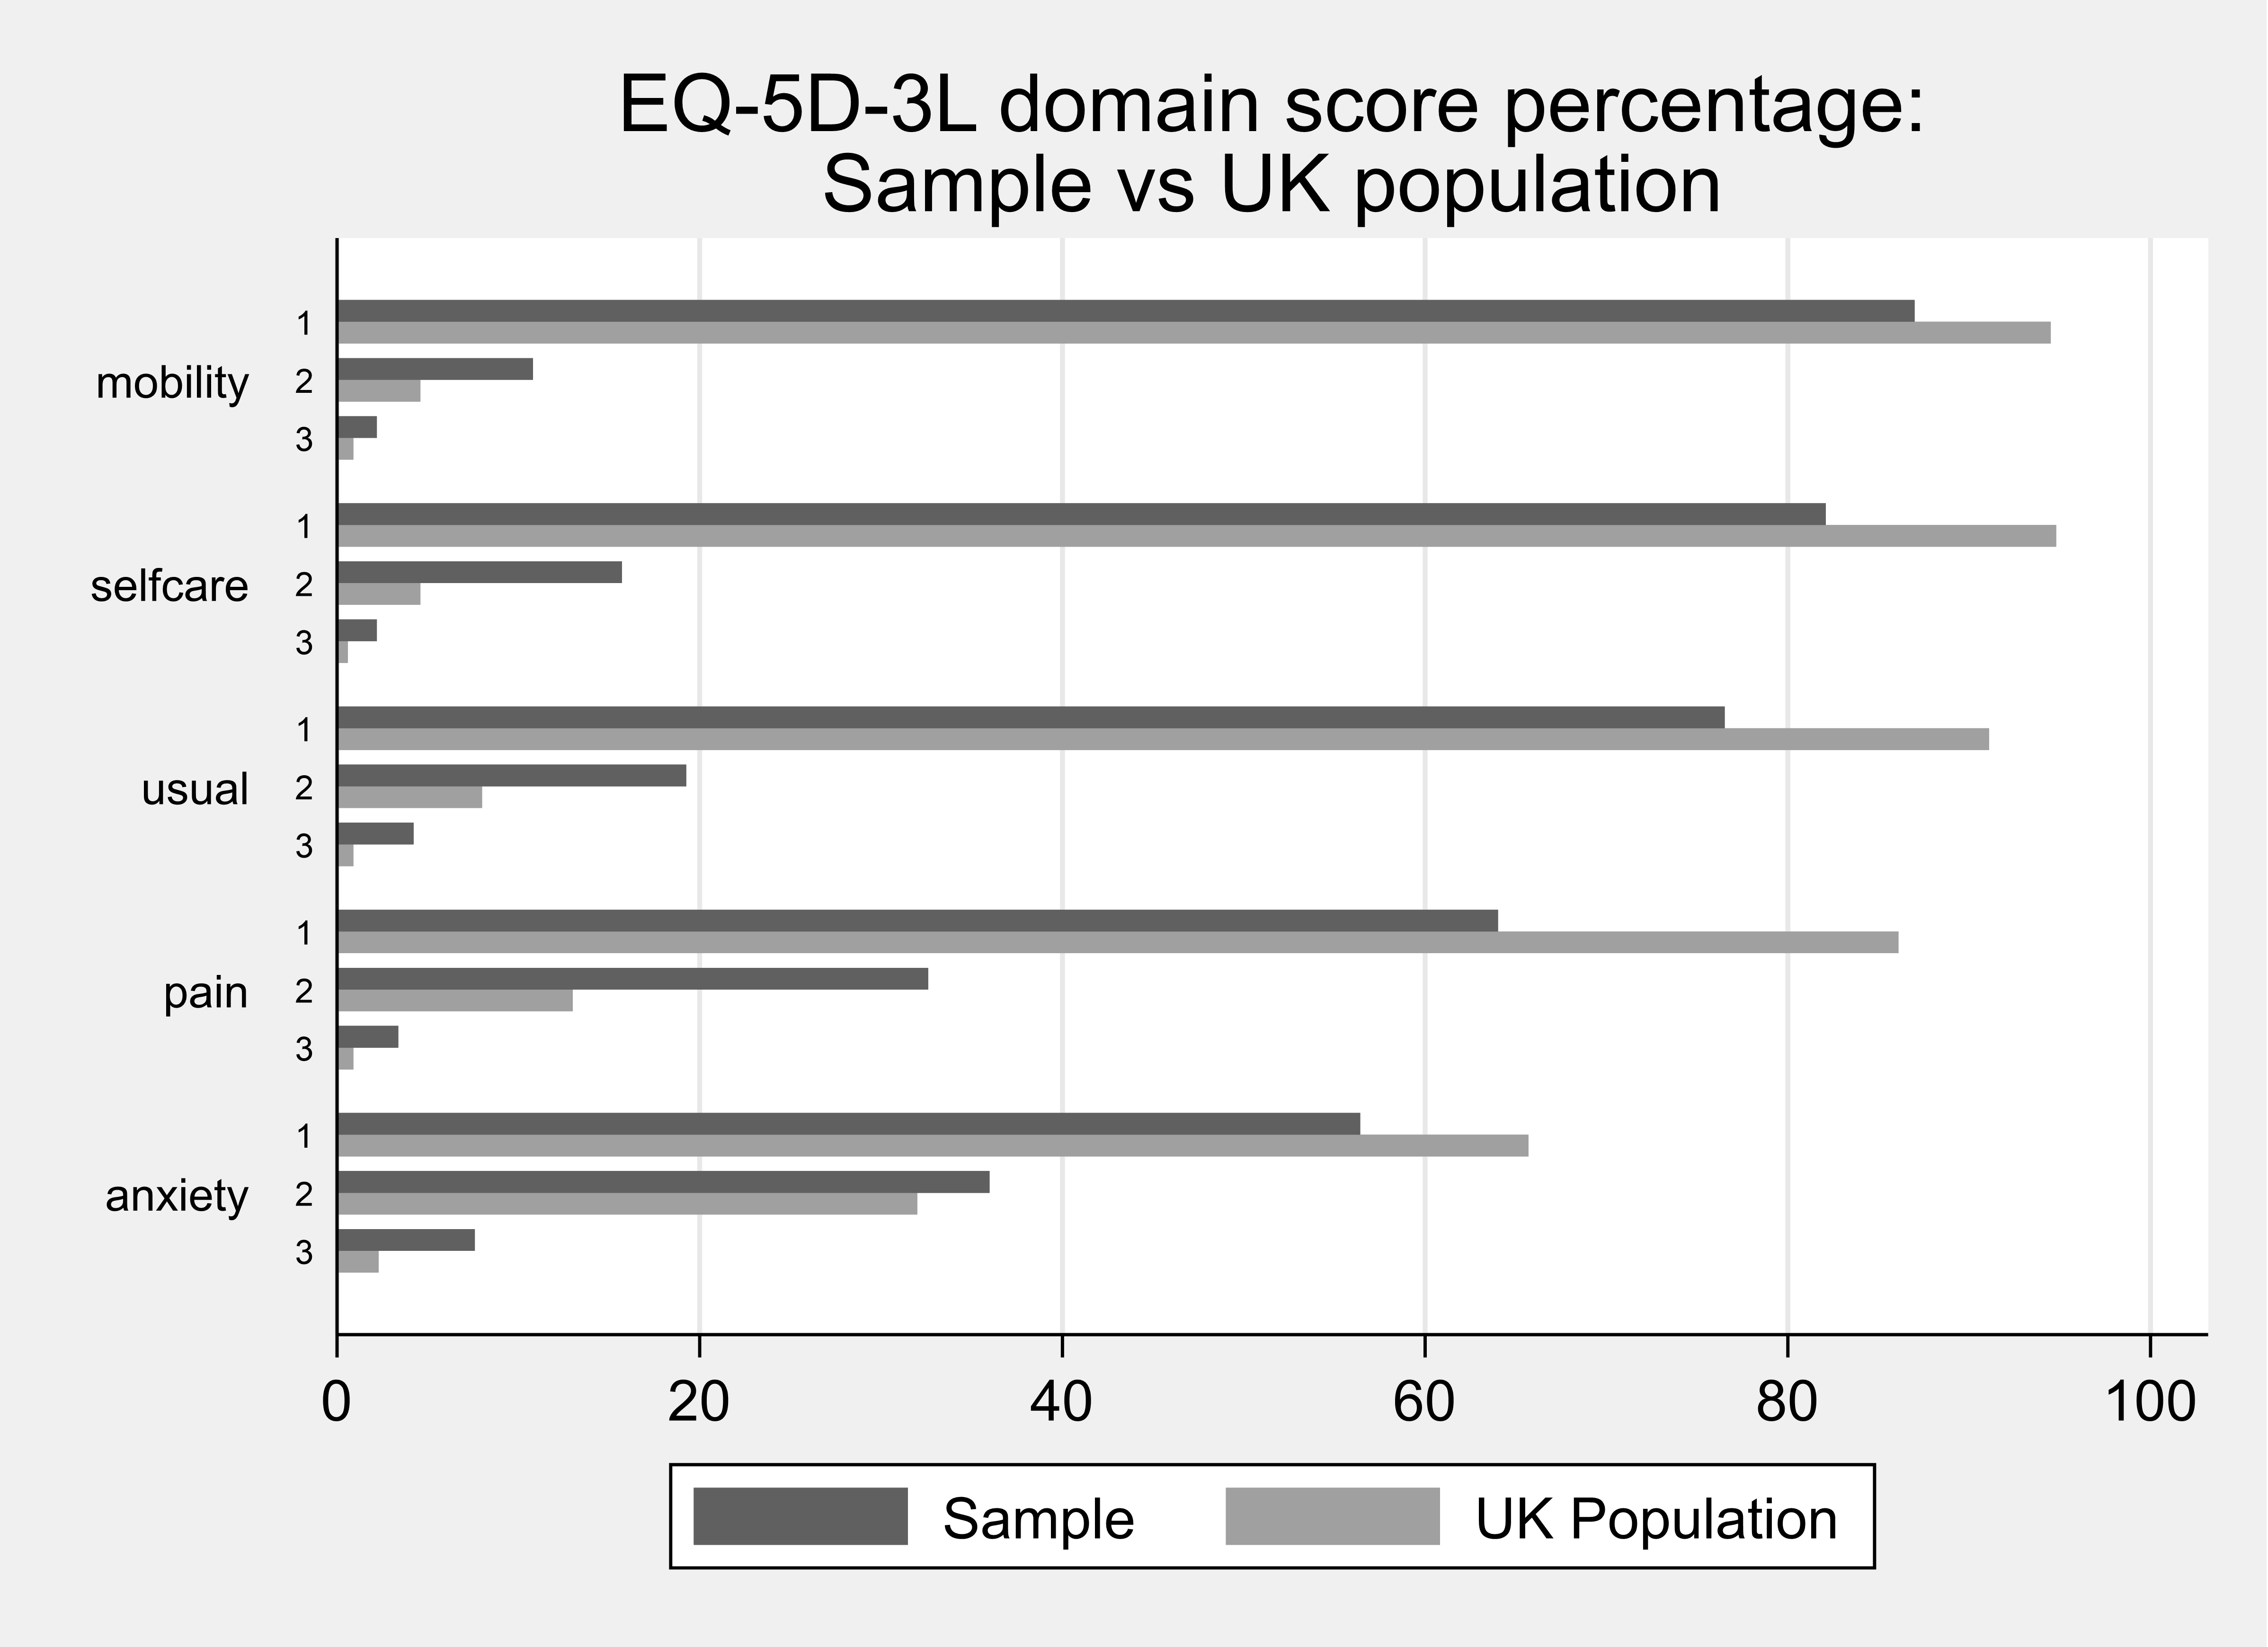
Table 6. Reported domain levels for a child as valued by a parent compared with the UK population
| Domain | Sample: Level | Sample: Frequency | Sample: Percent | UK Population: Frequency | UK Population: Percent |
|---|---|---|---|---|---|
| Mobility | 1 | 950 | 66.6 | 950 | 86.99 |
| Mobility | 2 | 276 | 19.4 | 46 | 10.81 |
| Mobility | 3 | 126 | 8.8 | 9 | 2.20 |
| Selfcare | 1 | 1215 | 85.2 | 953 | 82.09 |
| Selfcare | 2 | 117 | 8.2 | 46 | 15.71 |
| Selfcare | 3 | 77 | 5.4 | 6 | 2.20 |
| Usual Activity | 1 | 869 | 60.9 | 916 | 76.52 |
| Usual Activity | 2 | 313 | 21.9 | 80 | 19.26 |
| Usual Activity | 3 | 162 | 11.5 | 9 | 4.22 |
| Pain | 1 | 526 | 36.9 | 865 | 64.02 |
| Pain | 2 | 526 | 36.9 | 131 | 32.60 |
| Pain | 3 | 272 | 19.1 | 9 | 3.38 |
| Anxiety | 1 | 640 | 44.9 | 660 | 56.42 |
| Anxiety | 2 | 454 | 31.8 | 322 | 35.98 |
| Anxiety | 3 | 229 | 16.1 | 23 | 7.60 |
Source: UK population values taken from EQ5D-Youth
Figure 5. Scatter plot of calculated baseline and contingent health utility score from the EQ5D-3L (proxy)
Footnote: Matrix of correlations
| Variables | (1) baseline health | (2) contingent health |
|---|---|---|
| (1) baseline health | 1.000 | - |
| (2) contingent health | 0.75 | 1.000 |
Figure 6. Scatter plot of calculated baseline and contingent health utility score from the EQ-VAS (proxy)
Footnote: Matrix of correlations
| Variables | (1) baseline health | (2) contingent health |
|---|---|---|
| (1) baseline health | 1.000 | - |
| (2) contingent health | 0.68 | 1.000 |
Revision log
Published: 21 October 2022
Last updated: 23 October 2023