Impacts of Food Hypersensitivities on Quality of Life in the UK and Willingness to Pay (WTP) to remove those impacts
Appendix L. Condition-Specific Measures of Adult Quality Of Life, Additional Analysis.
Additional analysis of quality of life scale
Respondents were asked to complete a health-related quality of life scale appropriate to their self-reported food hypersensitivity:
- Food Allergy Quality of Life Questionnaire (FAQLQ) for food allergy.
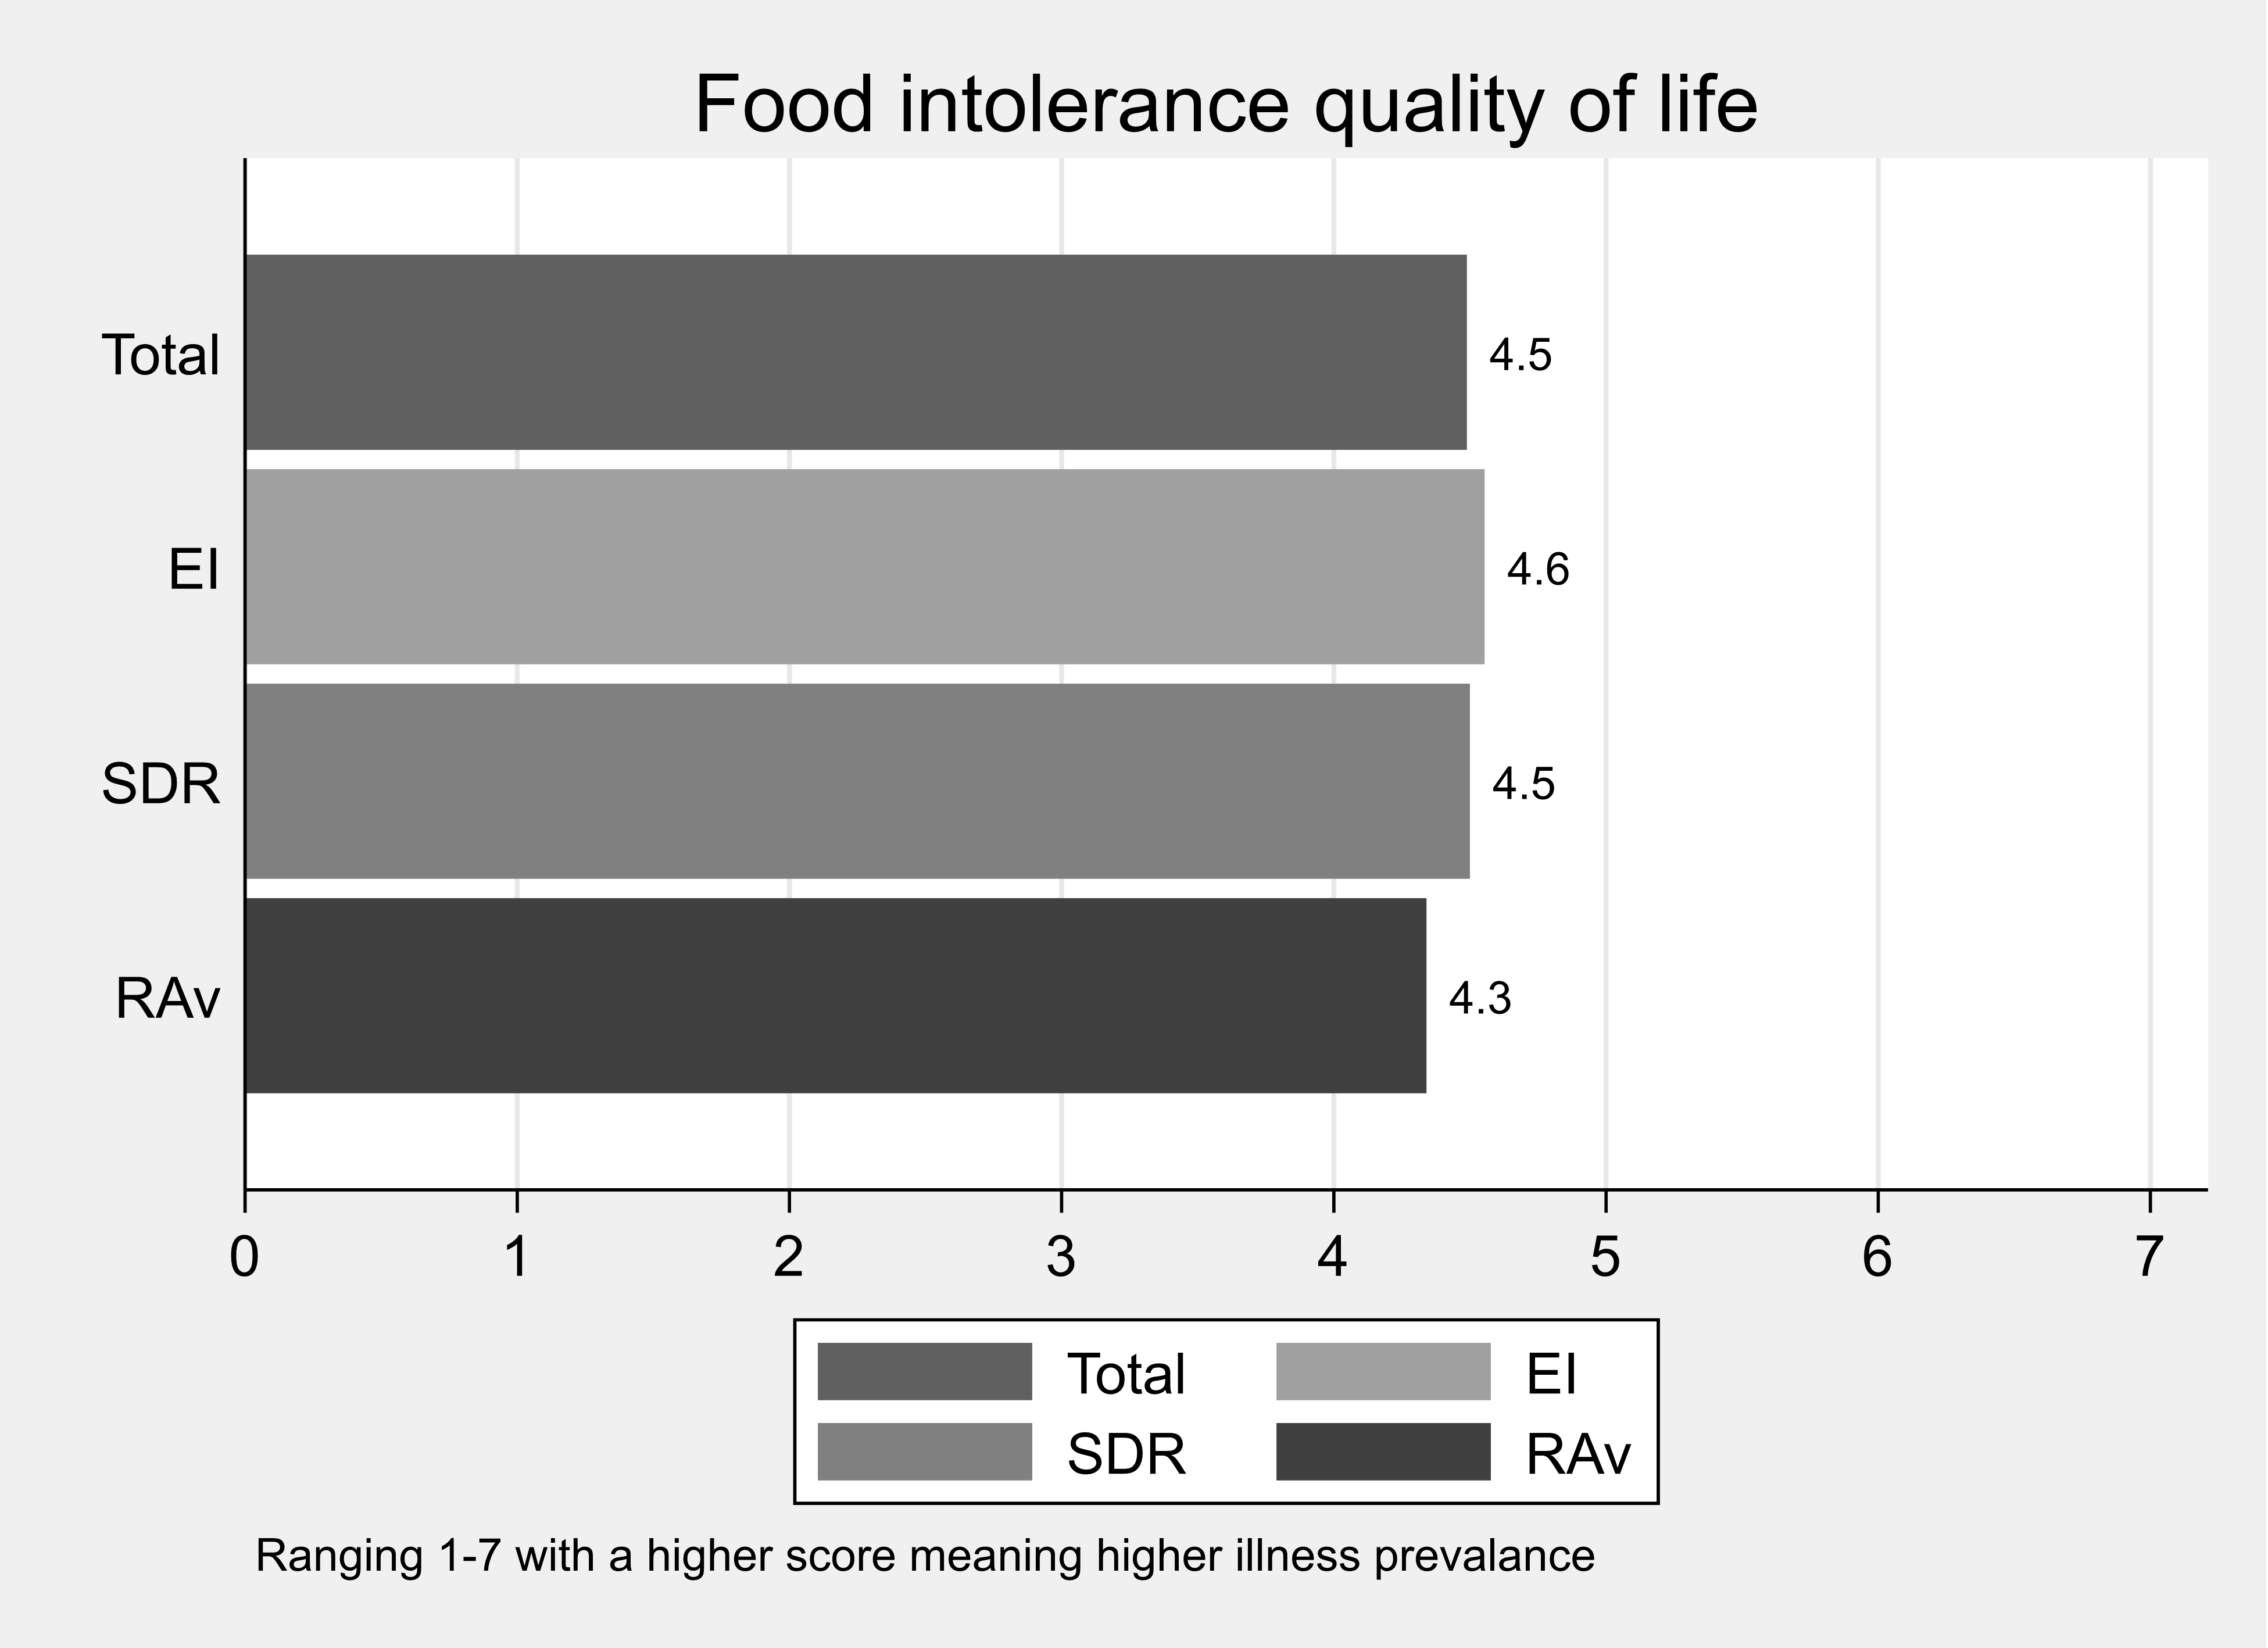
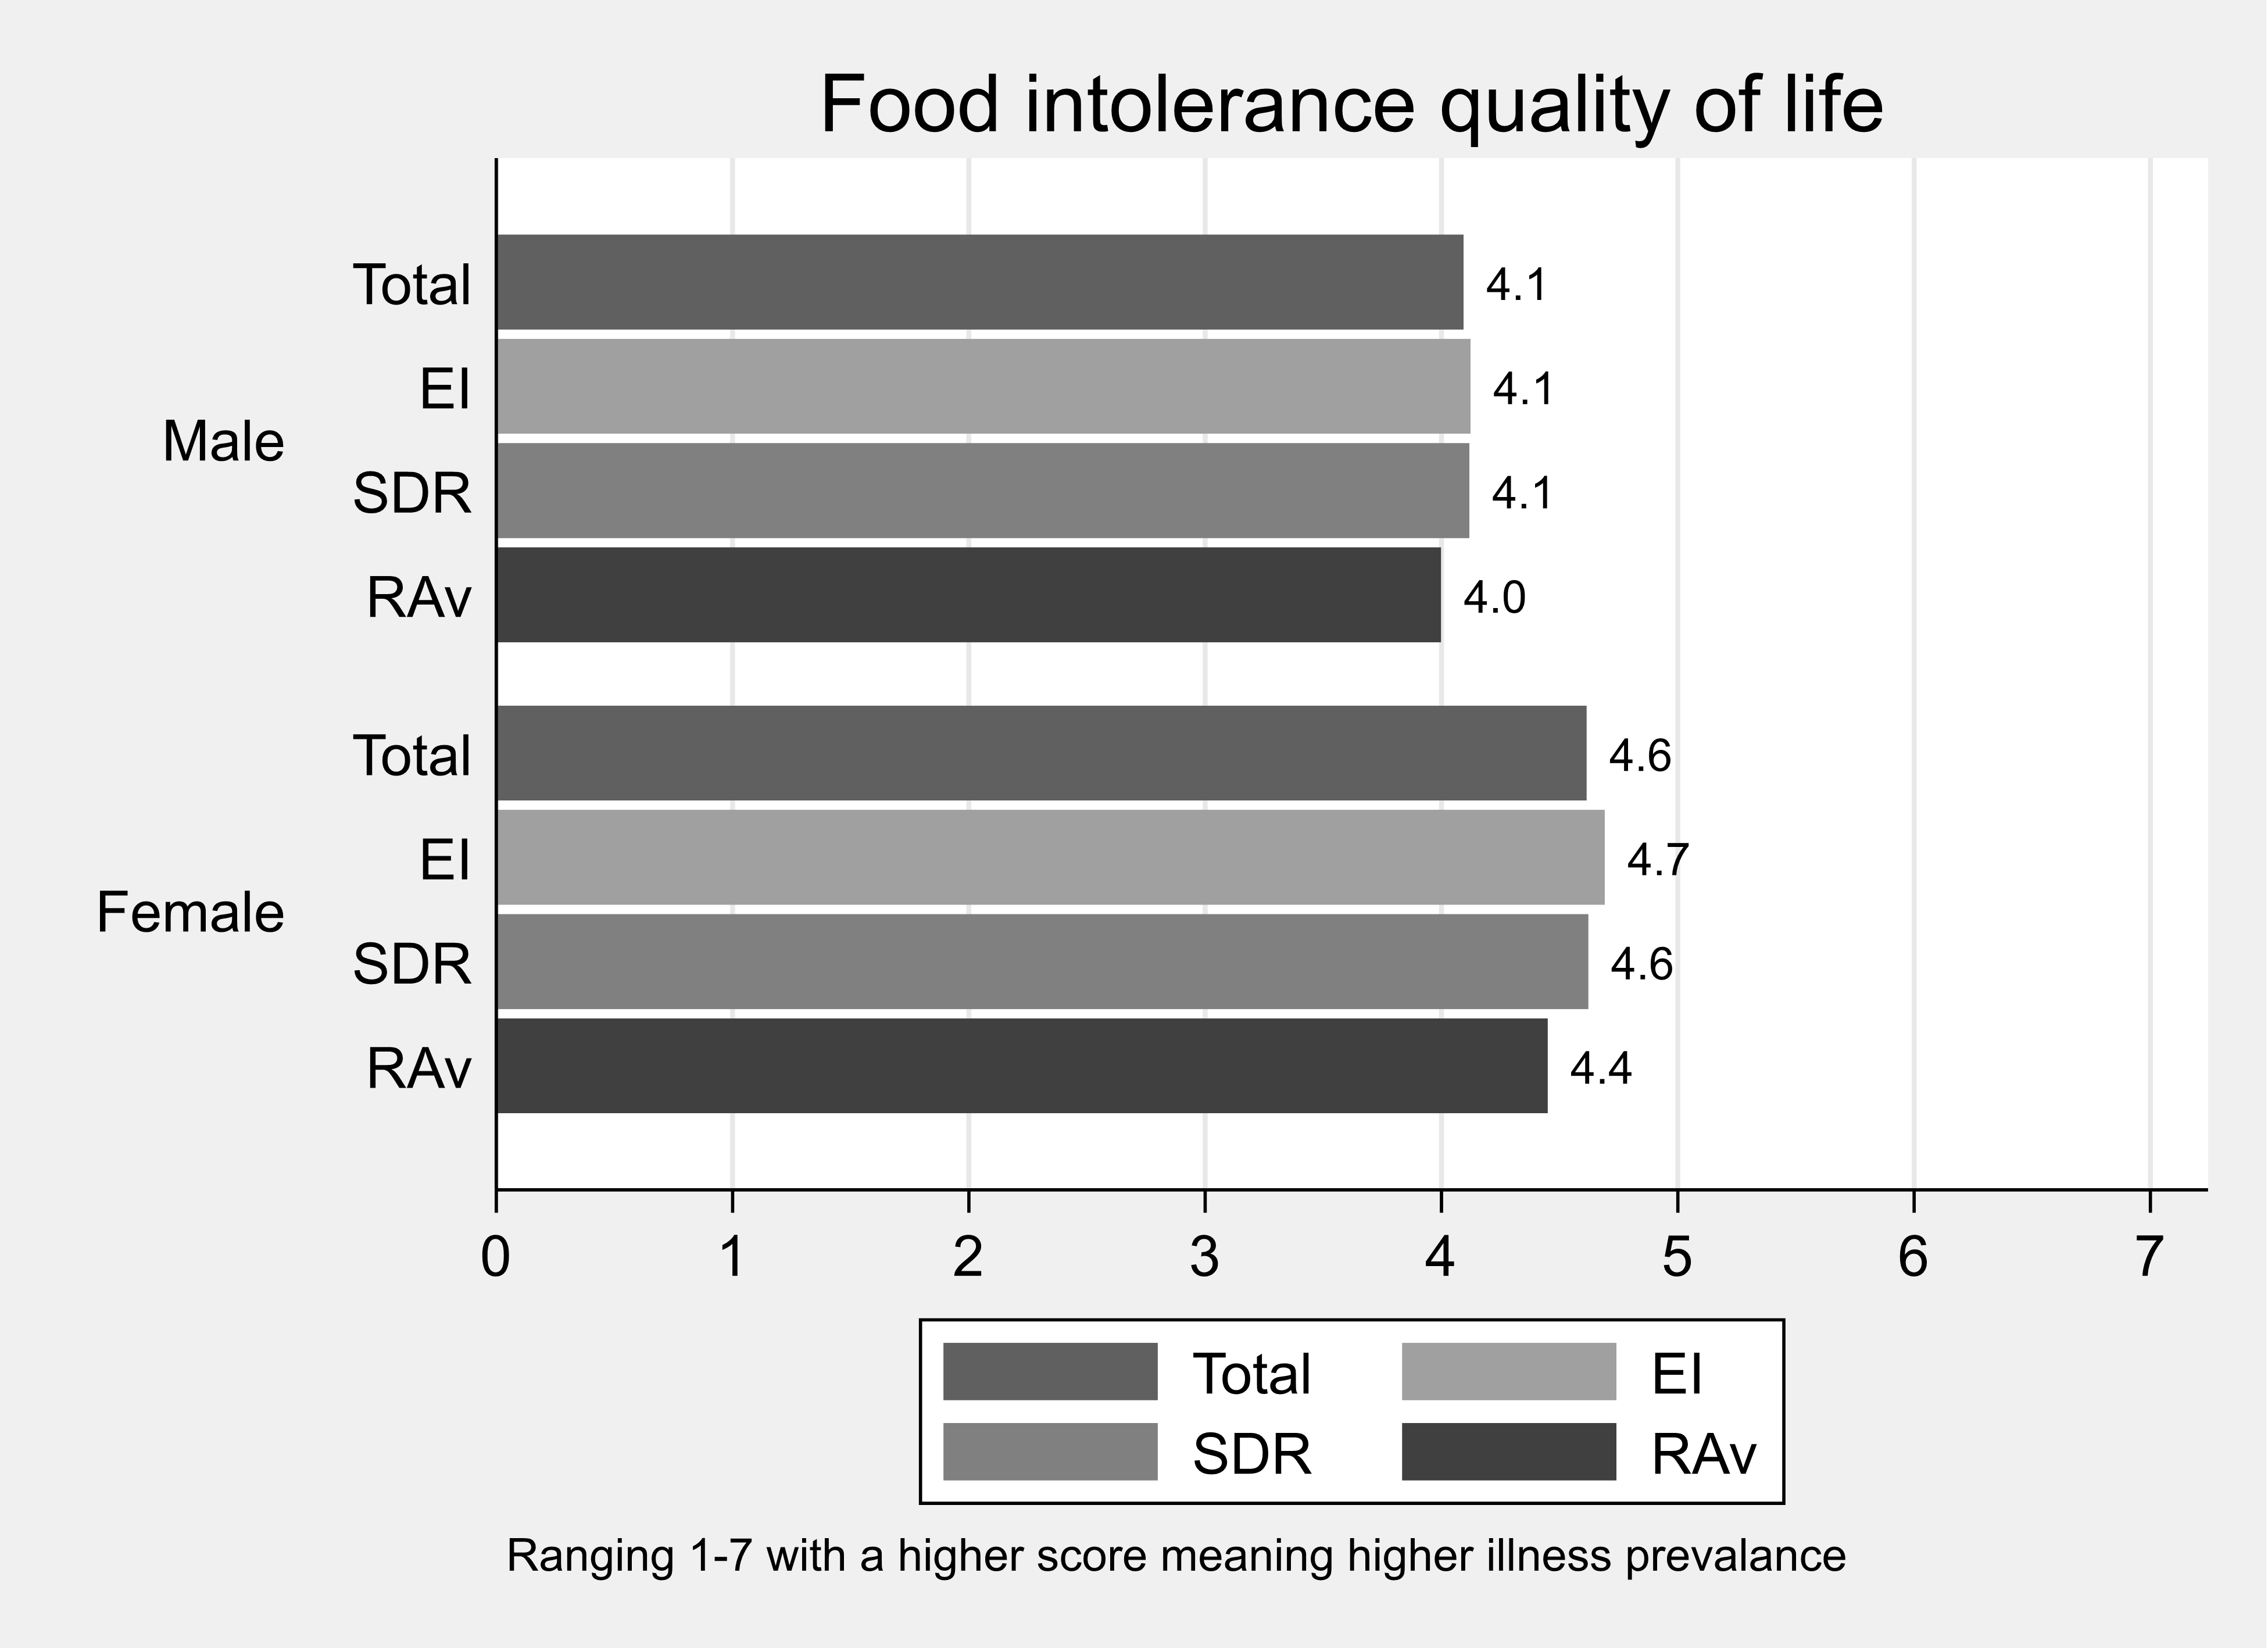
- Food Intolerance Quality of Life Questionnaire (FIQLQ) for food intolerance.
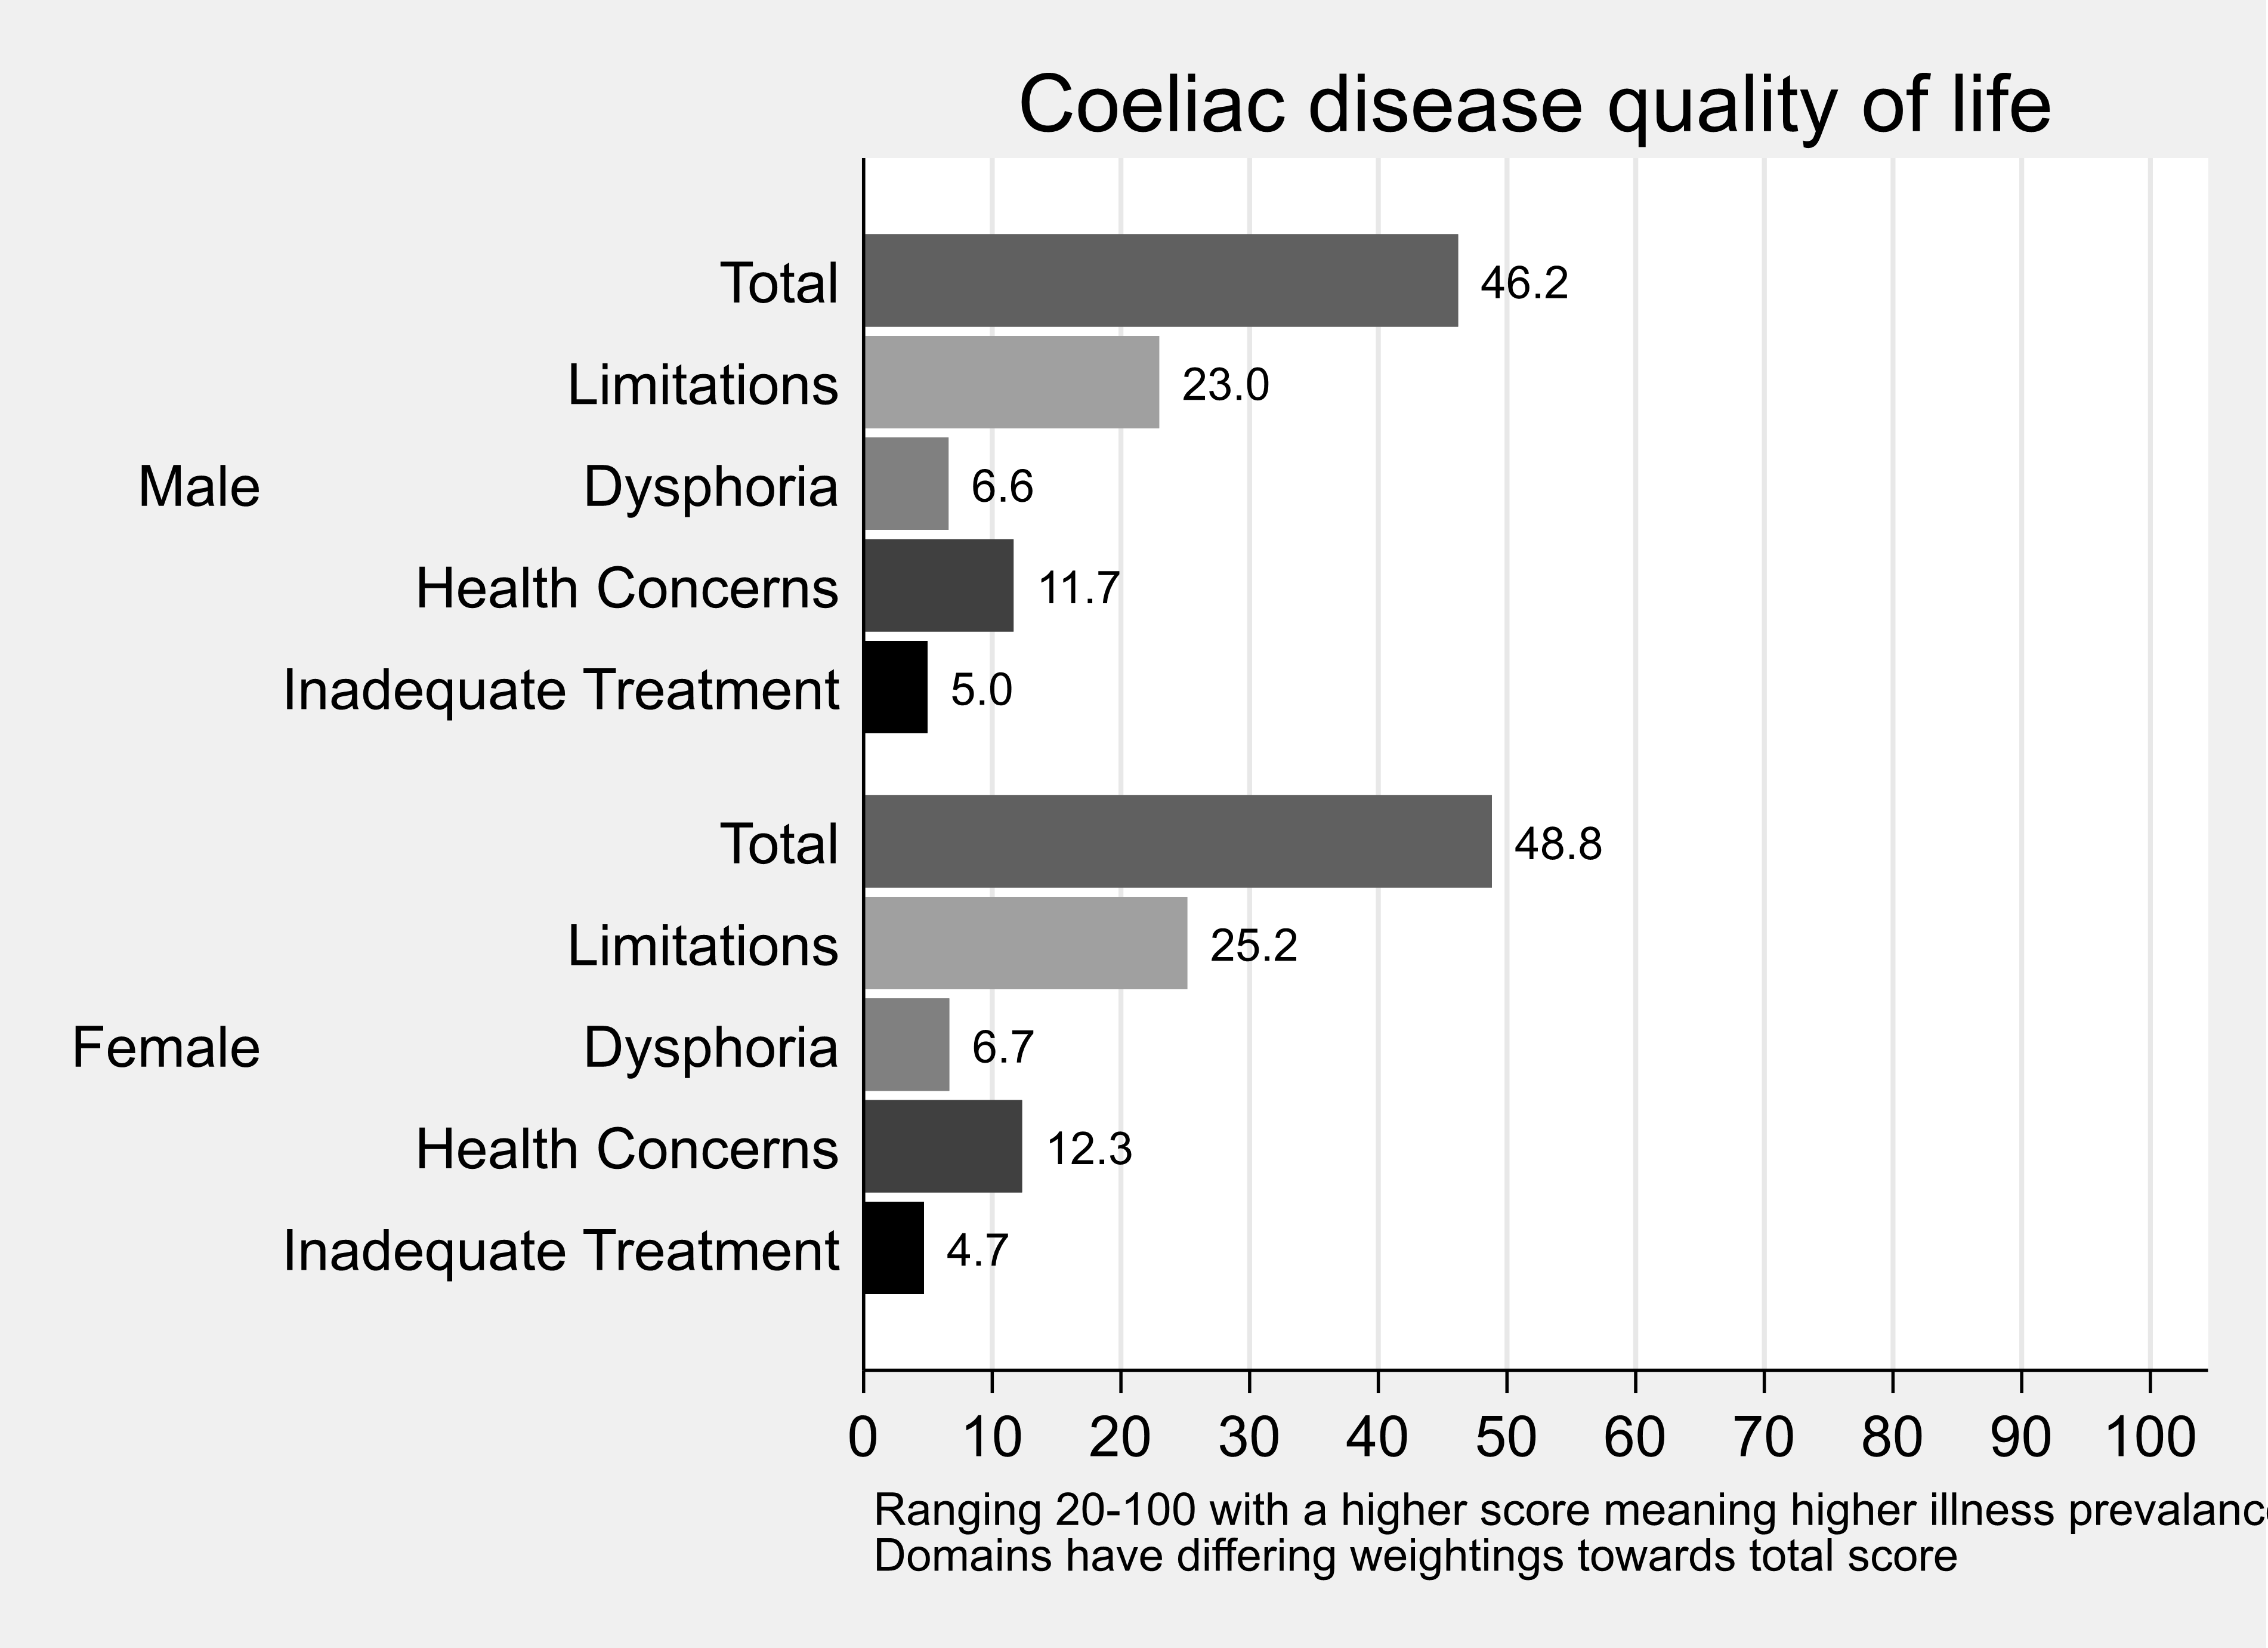
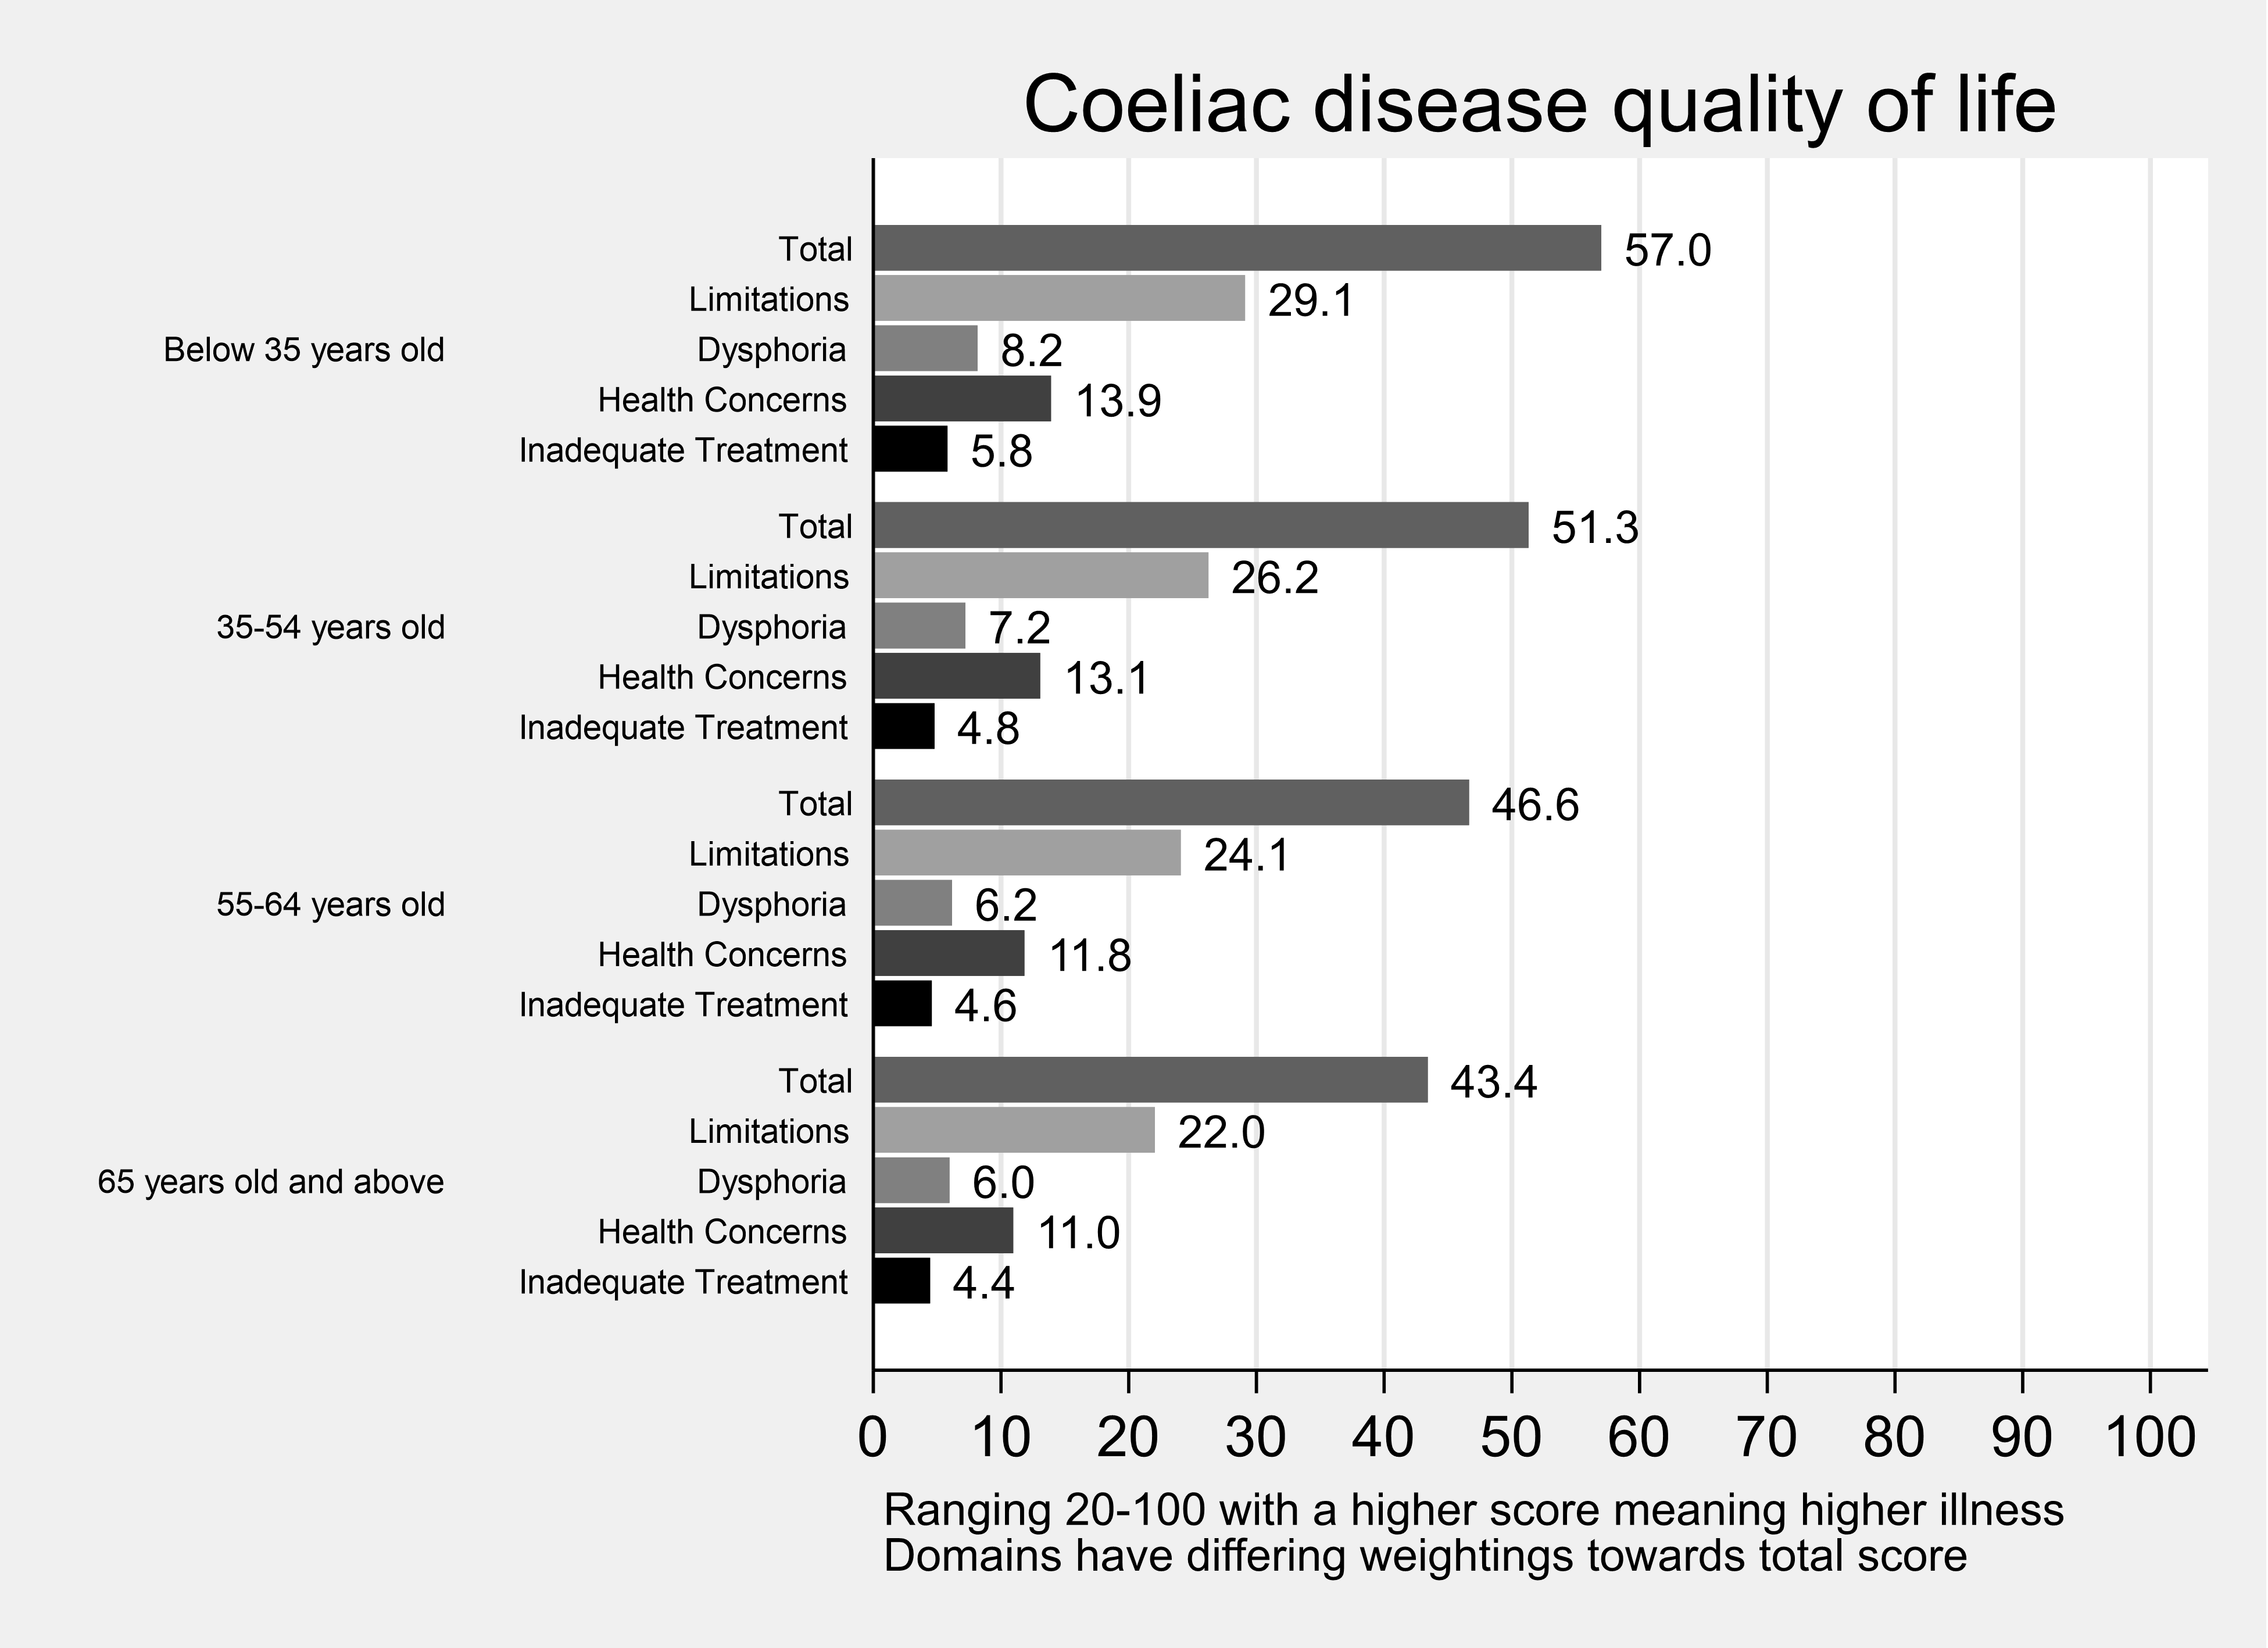
- Coeliac Disease Quality of Life scale (CDQoL) for coeliac disease.
The FAQLQ and FIQLQ are rated on a scale from 1 (least impairment on quality of life) to 7 (maximal impairment on quality of life).
The CDQ is rated on a five-point scale, with the 20 items scores summed – having a range of 20-100.
Each scale consists of food hypersensitivity specific subscales.
For those completing the FAQLQ, these are:
- Allergen Avoidance and Dietary Restrictions (AADR), which considers the impact that a restrictive diet has on quality of life and the impact this also has on social activities;
- Emotional Impact (EI) relating to the worries and concerns about having an allergic reaction or consuming allergens;
- Risk of Accidental Exposure (RAE), relating to vigilance and awareness needed to avoid ingesting allergens; and
- Food Allergy related Health (FAH), relating to specific health anxiety about having an allergy or reaction.
For the CDQ, subscales comprise of:
- limitations, relating to social and dietary limitations of having coeliac disease;
- Dysphoria, related to negative feelings of having coeliac disease;
- Health Concerns, concerns about the wider impact having coeliac disease will have on health; and
- Inadequate treatment, feelings that there are not enough treatment options for the disease.
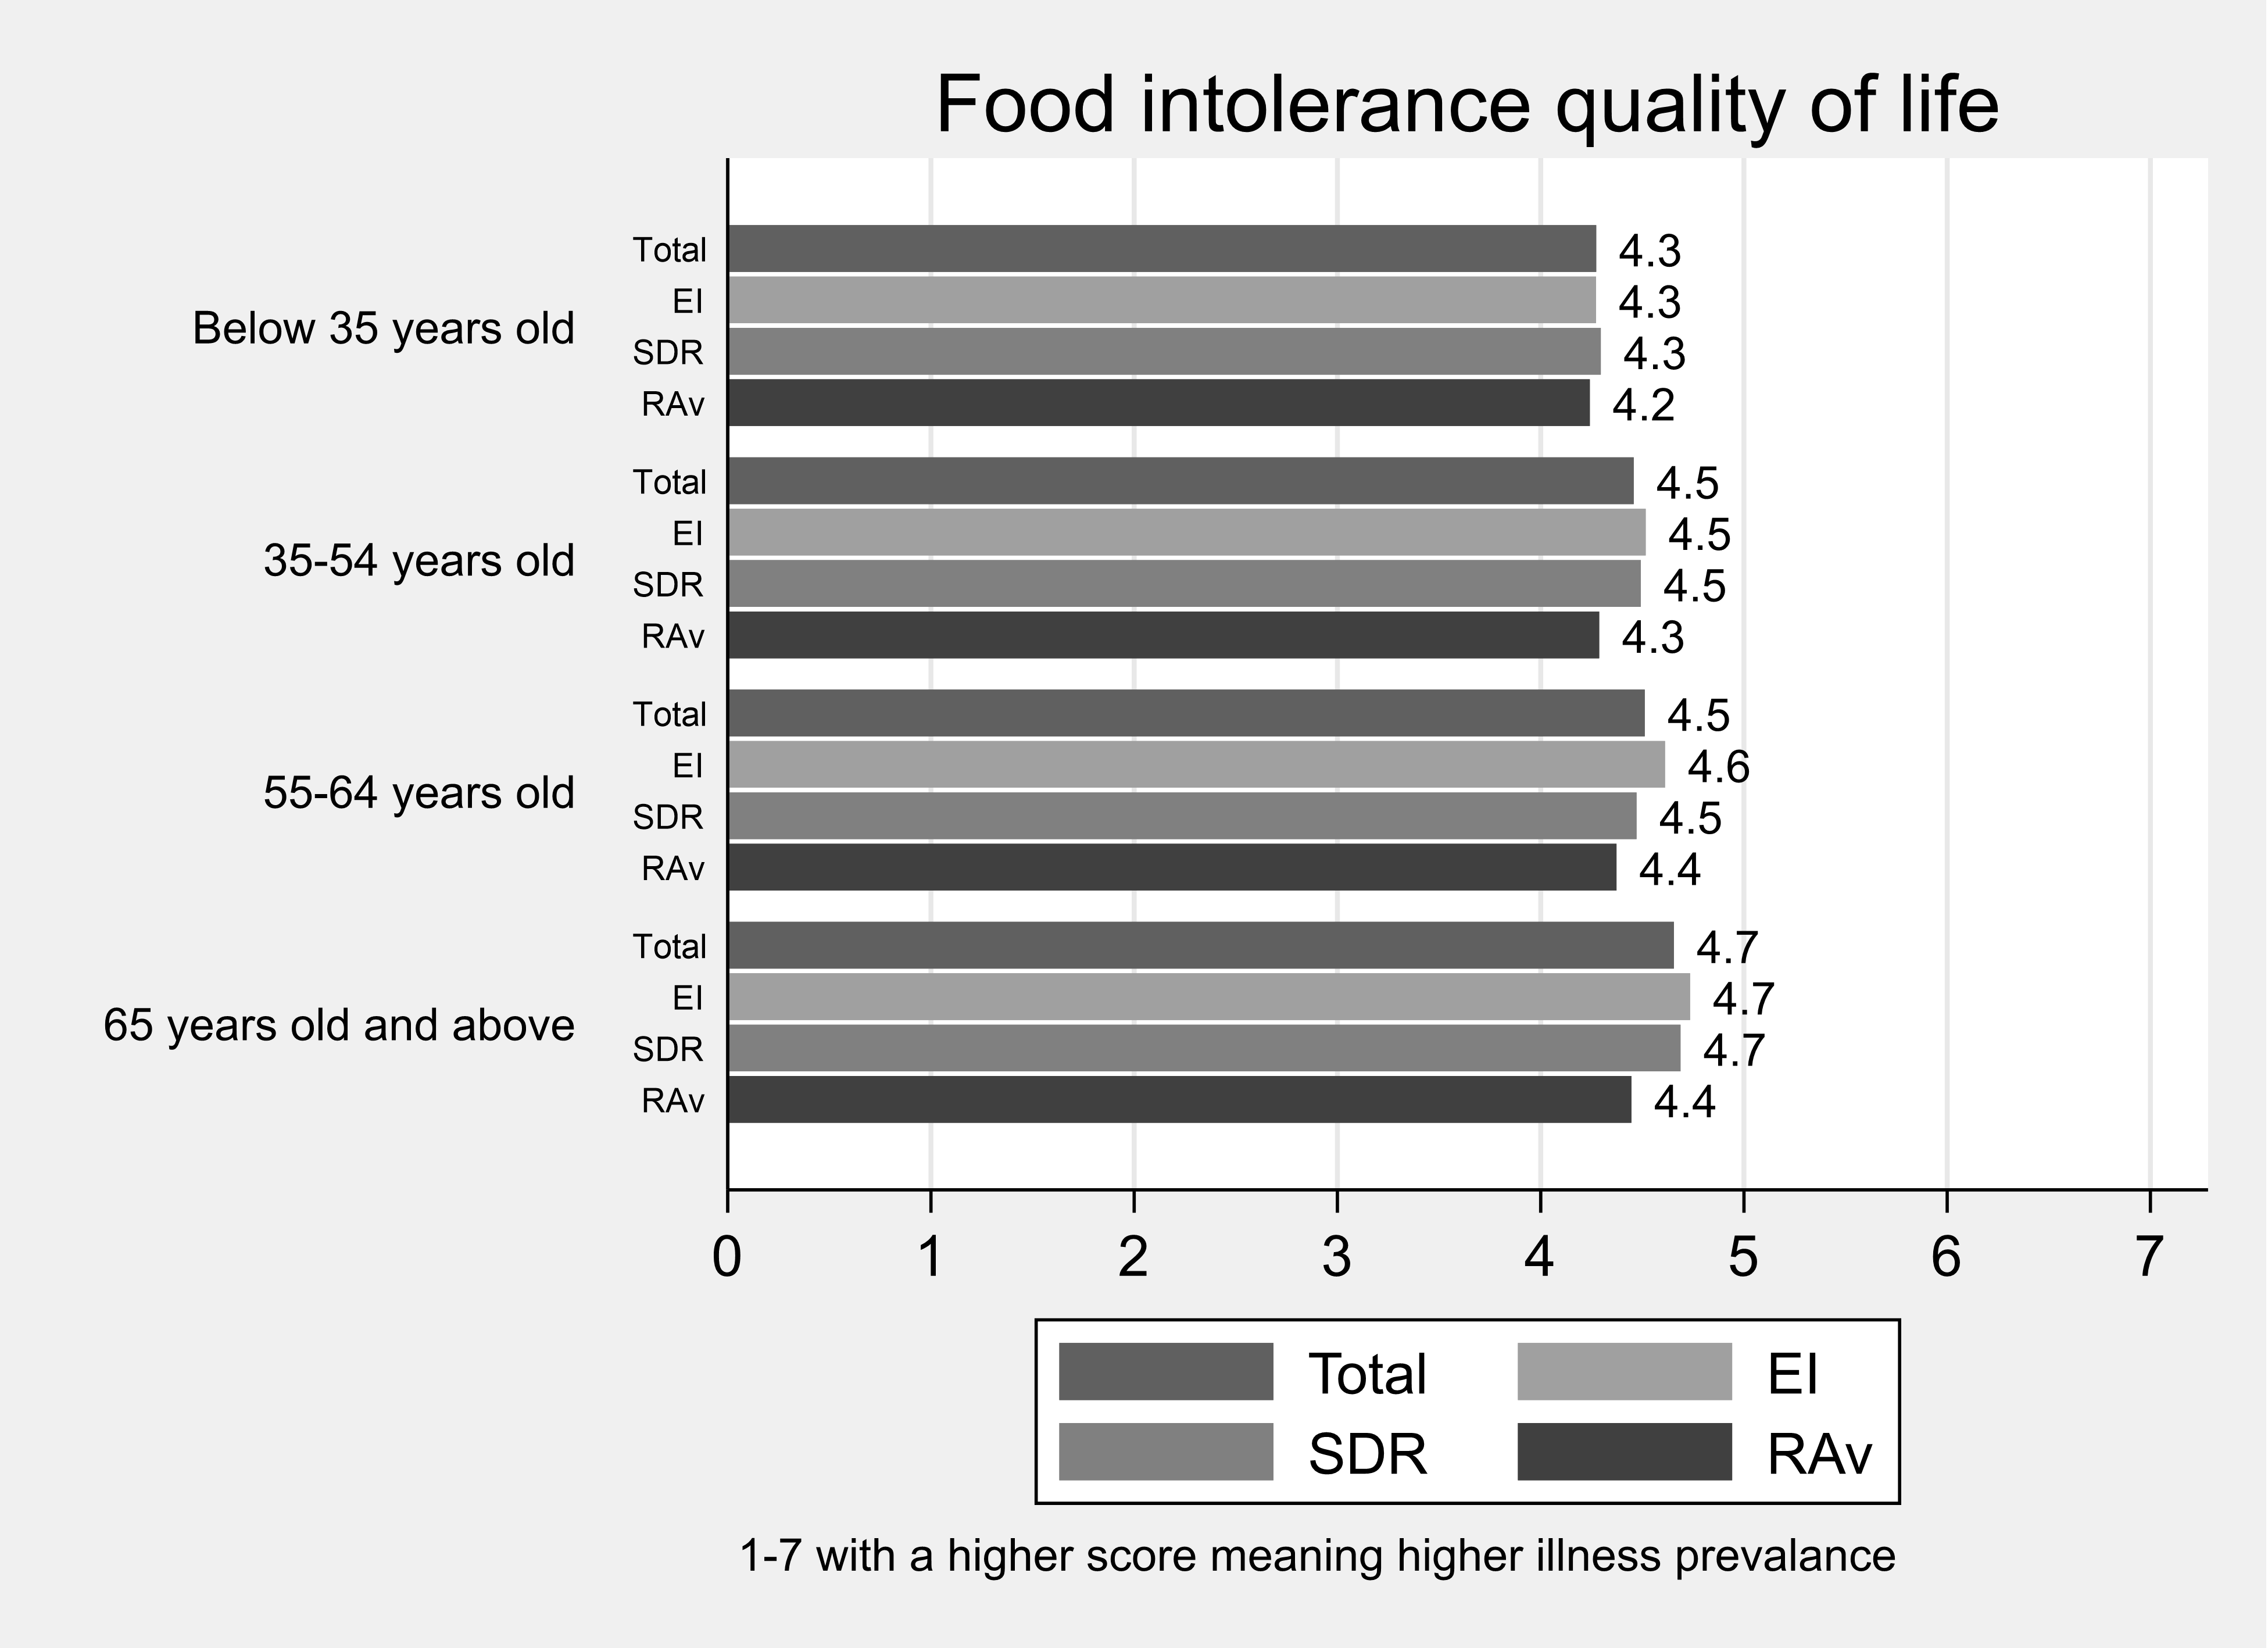
For the FIQLQ scale, subscales comprise:
- Emotional Impact (EI), related to the stresses and concerns of having to be aware of foods that could cause a reaction;
- Social and Dietary restrictions (SDR), related to the impact that having an intolerance has on diet and social activities (for example, eating out); and
- Reactions and Avoidance (RAv), related to negative feelings about having a reaction (for example, embarrassment and discouragement).
The distribution of the subscales, in aggregate and by characteristics are displayed in this Appendix.
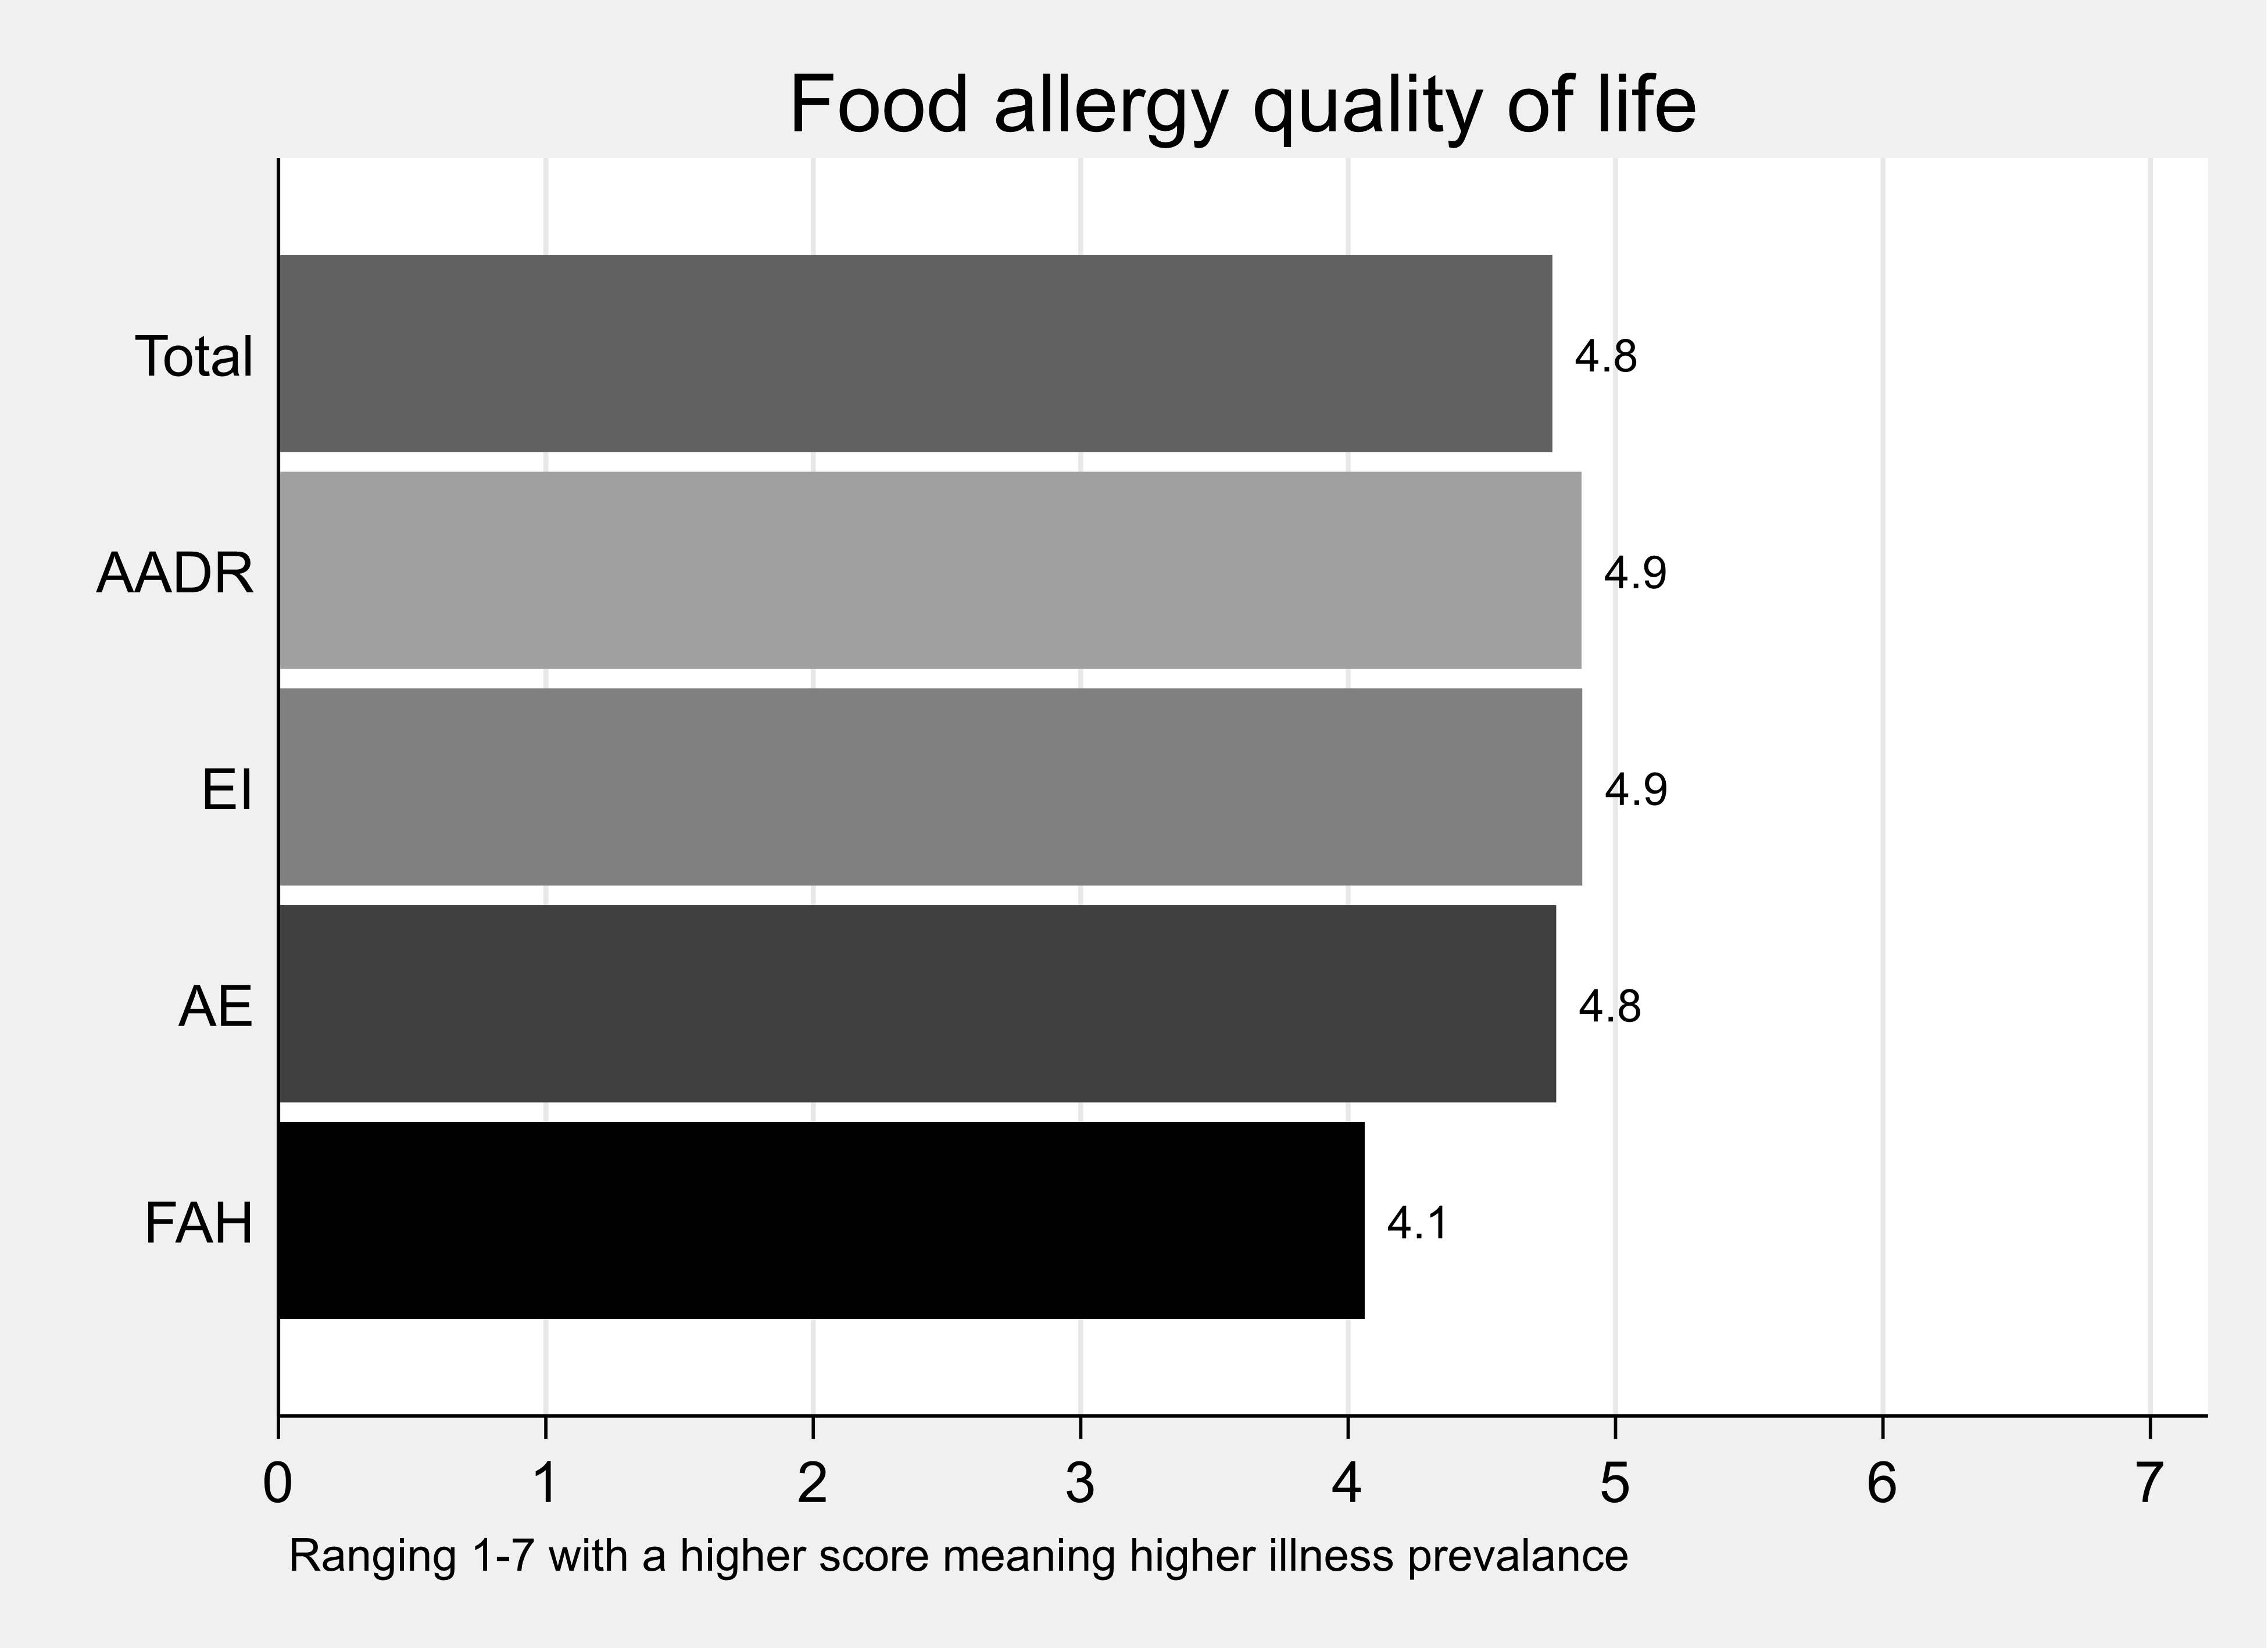
FAQLQ subscales
Table 1. Summary statistics: FAQLQ Index by domain
| Domain | Mean | Std. Dev. | N | min | p25 | Median | p75 | max |
|---|---|---|---|---|---|---|---|---|
| FAQ total | 4.76 | 1.49 | 385 | 1.14 | 3.66 | 5.1 | 6 | 7 |
| FAQ AADR | 4.87 | 1.57 | 385 | 1 | 3.73 | 5.09 | 6.18 | 7 |
| FAQ EI | 4.88 | 1.62 | 385 | 1 | 3.71 | 5.14 | 6.29 | 7 |
| FAQ AE | 4.78 | 1.63 | 385 | 1 | 3.5 | 5.13 | 6.13 | 7 |
| FAQ FAH | 4.06 | 1.63 | 385 | 1 | 3 | 4 | 5.33 | 7 |
Figure 1. FAQLQ Index by domain
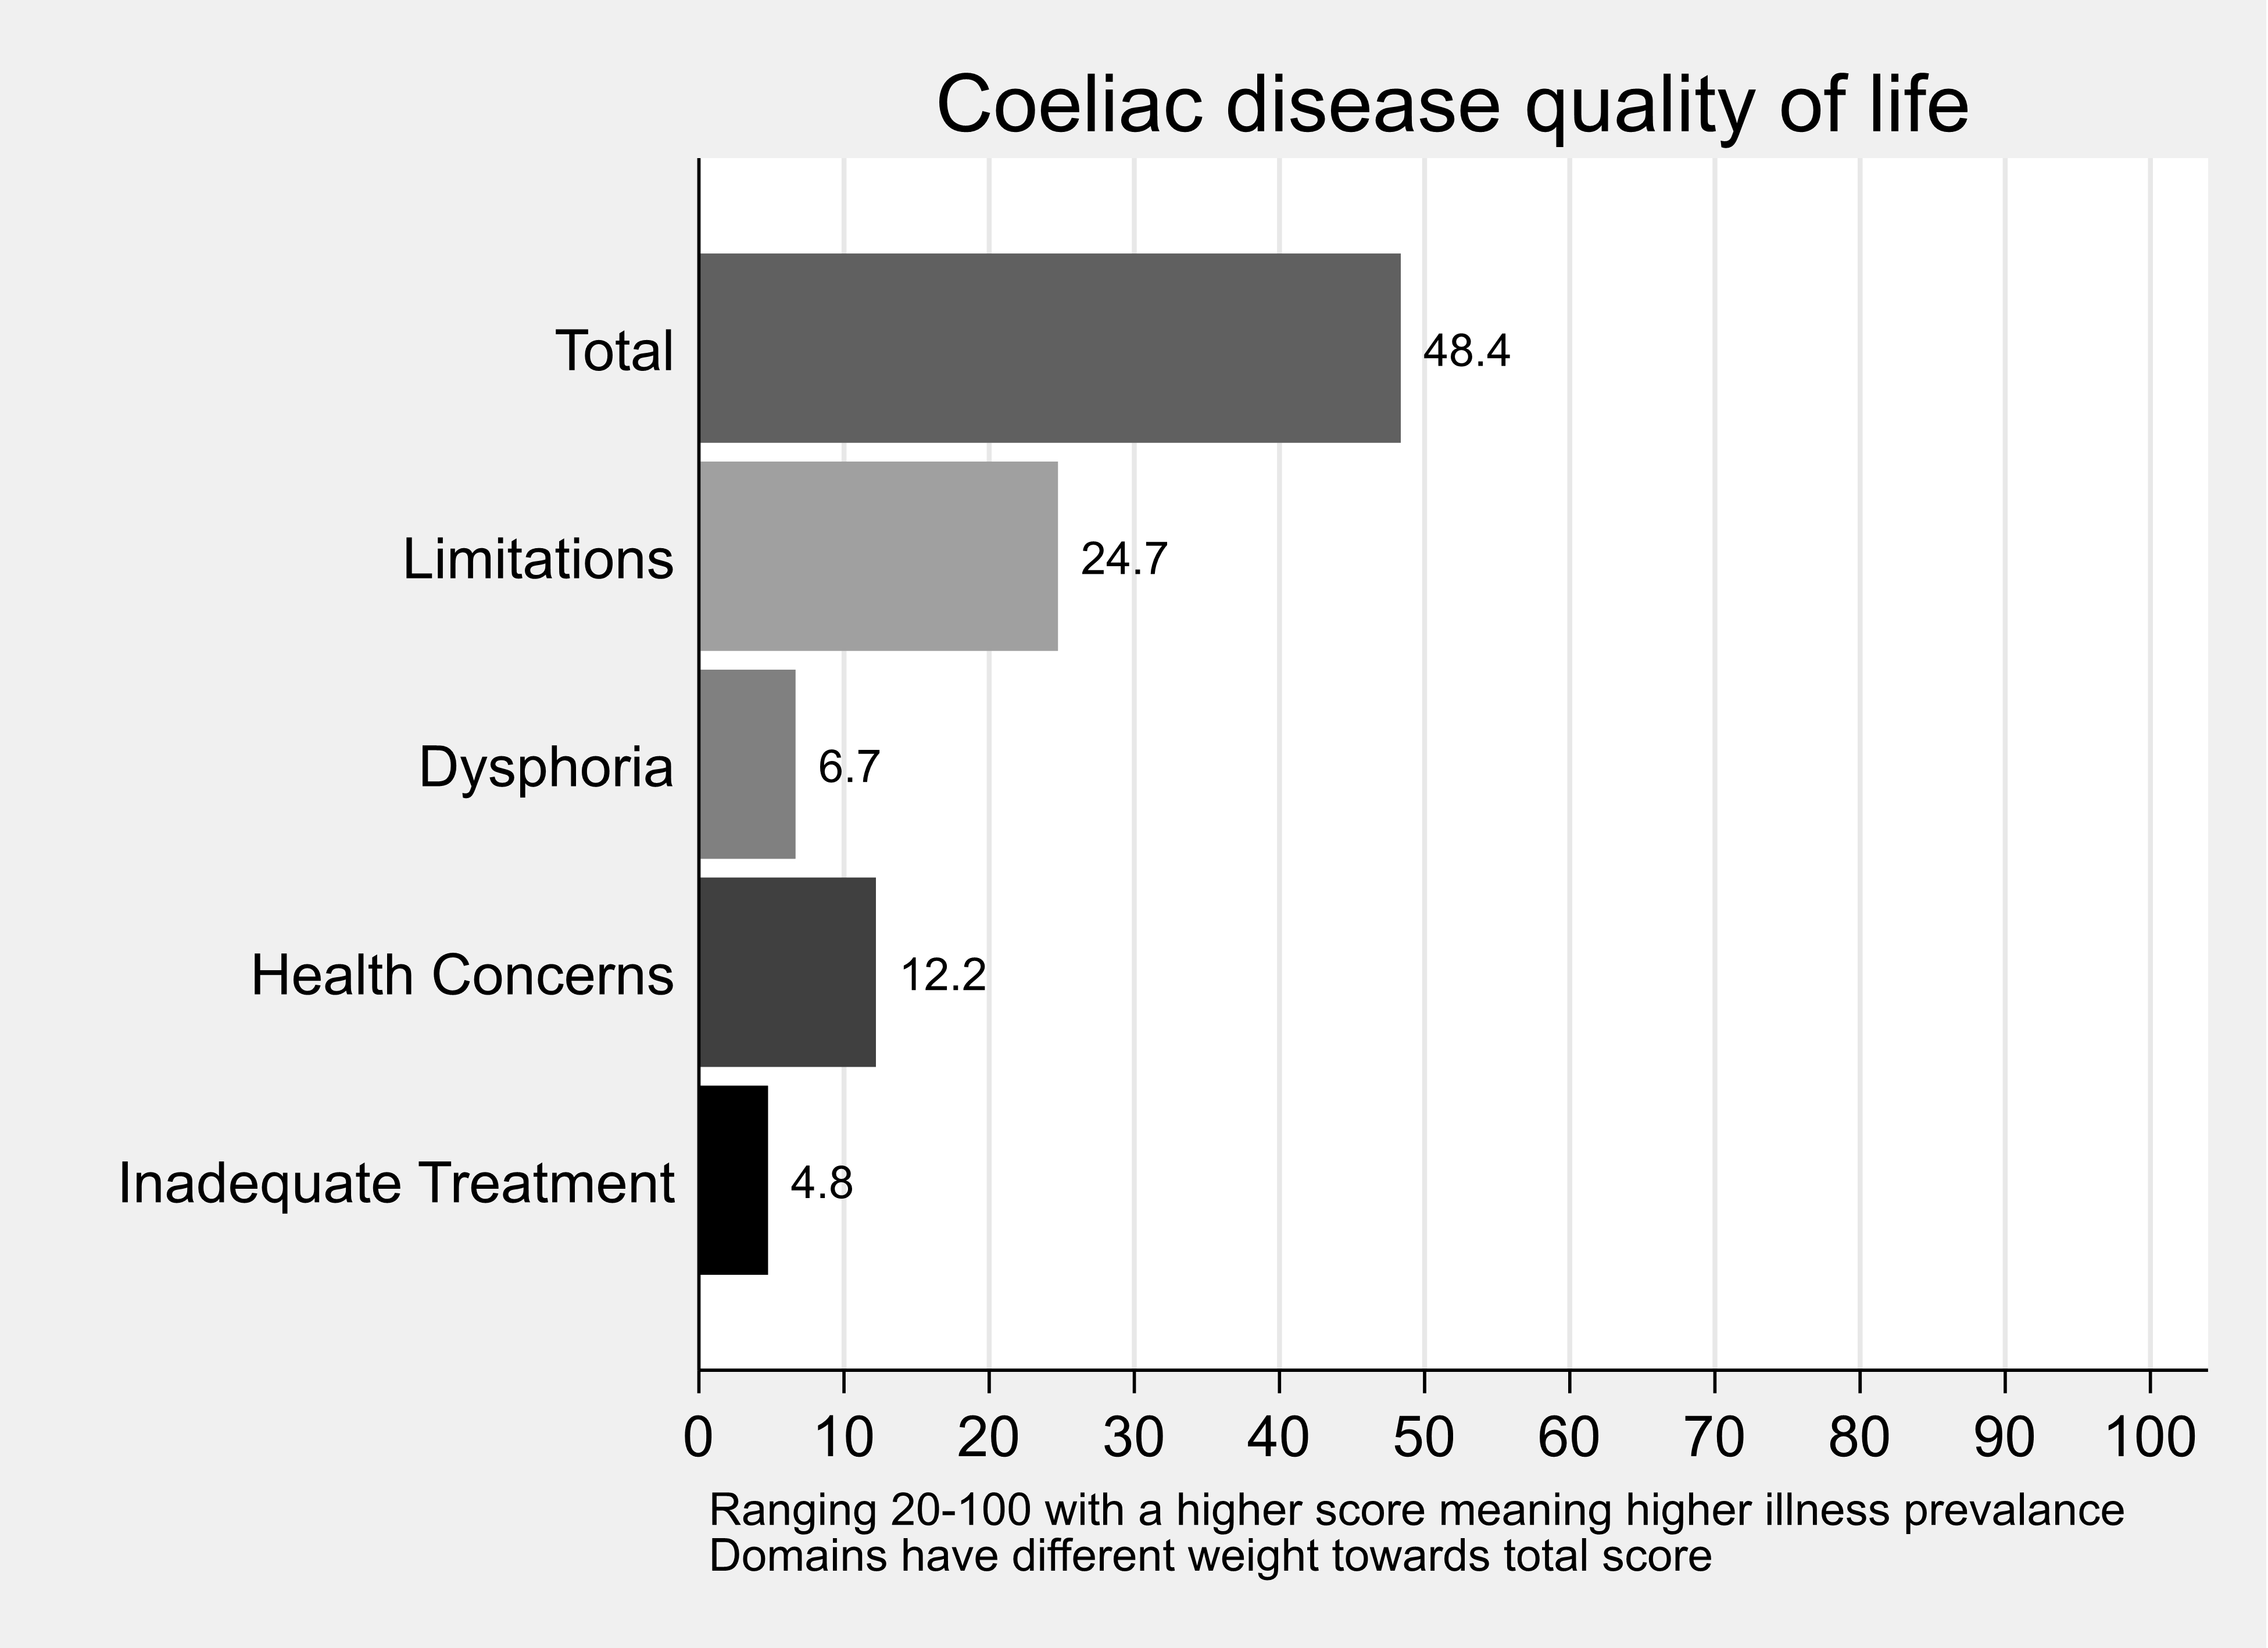
CDQ subscales
Table 2. Summary statistics: CDQ Index by domain
| Domain | Mean | Std. Dev. | N | min | p25 | Median | p75 | max |
|---|---|---|---|---|---|---|---|---|
| CDQ total | 48.35 | 16.91 | 601 | 20 | 34 | 47 | 61 | 95 |
| CDQ Limitations | 24.74 | 9.12 | 601 | 9 | 17 | 24 | 31 | 44 |
| CDQ Dysphoria | 6.66 | 3.1 | 601 | 4 | 4 | 5 | 8 | 19 |
| CDQ Health | 12.2 | 4.61 | 601 | 5 | 9 | 11 | 15 | 25 |
| CDQ Inadequate | 4.76 | 2.51 | 601 | 2 | 2 | 4 | 7 | 10 |
FIQLQ subscales
Table 3. Summary statistics: FIQLQ Index by domain
| Domain | Mean | Std. Dev. | N | min | p25 | Median | p75 | Max |
|---|---|---|---|---|---|---|---|---|
| FIQ total | 4.49 | 1.53 | 440 | 1.06 | 3.28 | 4.62 | 5.72 | 7 |
| FIQ EI | 4.55 | 1.55 | 440 | 1 | 3.38 | 4.81 | 5.75 | 7 |
| FIQ SDR | 4.5 | 1.69 | 440 | 1 | 3 | 4.67 | 6 | 7 |
| FIQ RA | 4.34 | 1.57 | 440 | 1 | 3 | 4.5 | 5.5 | 7 |
Revision log
Published: 21 October 2022
Last updated: 23 October 2023