Prosiect ymchwil
Impacts of Food Hypersensitivities on Quality of Life in the UK and Willingness to Pay (WTP) to remove those impacts
This project explores the impacts of food hypersensitivity on people’s quality of life and the monetary value people assign to the removal of those impacts. In this project, food hypersensitivities (FHS) are defined as comprising food allergy, coeliac disease and food intolerance.
Download a PDF version of the report:
This project concerns the impacts of food hypersensitivity on people’s quality of life and the monetary value people assign to the removal of those impacts. Food hypersensitivities (FHS) are, in this report, defined as comprising food allergy, coeliac disease and food intolerance.
Estimates of the economic value of removal of food hypersensitivity were generated from a stated preference (SP) survey in which people completed a discrete choice experiment (DCE). The DCE comprised of choices between (i) no change in respondents’ food hypersensitivity and (ii) the condition being removed for a specified period, at a cost.
The surveys were conducted between July and December 2021 by adults regarding their own food hypersensitivity or by parents/carers regarding their child’s food hypersensitivity. The samples comprised 1426 adults and 716 parents.
The average WTP for the removal of an adult’s FHS for a year, pooled across all conditions was £718. For models estimated separately by condition, the WTP values for food allergy, coeliac disease and food intolerance were £1064, £1342 and £540 respectively.
In models estimated on DCE data from parents regarding their children’s food hypersensitivity the average WTP, pooled across all conditions, was £2501. The annual WTP values by condition were: £2766 for food allergy; £1628 for coeliac disease; £1689 for food intolerance.
Respondents rated their (child’s) health and the impacts of their (child’s) FHS using several established instruments including the Food Allergy Quality of Life Questionnaire (FAQLQ); Food Intolerance Quality of Life Questionnaire (FIQLQ); Coeliac Disease Quality of Life Questionnaire, (CDQ).
In the adult allergy and intolerance models we find robust evidence of effects of the perceived severity of FHS on WTP – the higher people’s FAQLQ and FIQLQ scores, the more they are willing to pay to remove their condition. There was no effect of variation in the CDQ score on WTP to remove coeliac disease. In the child WTP results we find condition-severity effects in the coeliac sample: the worse the child’s CDQ score the higher the parents’ WTP to remove the condition.
The WTP values are estimates of the combined annual costs associated with (i) the intangible costs including the pain, anxiety, inconvenience and anxiety caused by FHS and (ii) additional incurred costs (time and money) and lost earnings. The values can be incorporated into the FSA Cost of Illness (COI) model, the Burden of Foodborne disease in the UK which is currently used to measure the annual, social, cost of foodborne disease.
A Best Worst Scaling (BWS) exercise was conducted to identify the relative importance of the many and diverse impacts which comprise the FAQLQ, FIQLQ and CDQ instruments.
The BWS results indicate that people assign very different levels of importance to the impacts comprising the three instruments. This unequal prioritisation contrasts with the equal weighting used in the construction of the FAQLQ, FIQLQ and CDQ measures. Embarrassment and fear related to eating out or social situations feature in the top three impacts for all the conditions. Identifying the effects which most affect quality of life (from the perspective of people living with those conditions) has the potential to inform policy and practice by both regulators and private organisations such as food business operators.
This project concerns the impacts of food hypersensitivity on people’s quality of life and the monetary value people assign to the removal of those impacts.
Food hypersensitivities (FHS) are, in this report, defined as comprising food allergy, Coeliac coeliac disease and food intolerance.
The aims of the research reported here were to:
A. estimate the economic value to people (their 'willingness to pay') of removing the symptoms and limitations of their conditions.
B. identify the impacts of living with food hypersensitivity which most affect people’s quality of life.
Regarding (A), the economic value to people of removing the symptoms and limitations of their food hypersensitivity was estimated using a stated preference (SP) survey in which people completed a discrete choice experiment (DCE).
Stated preference willingness to pay (WTP) is a measure of economic value, derived from survey responses. Stated preference methods are a set of established (see HMT’s Green Book for policy guidance (footnote 1)) valuation methods (for example, contingent valuation, DCEs) used to estimate non-market values for policy. WTP is the maximum amount of money an individual is willing to give up in exchange for some improvement (a good, service, change in policy etc). In this case the improvement is the removal of the individuals’ food hypersensitivity for a period of time. The average WTP across the survey sample is obtained by statistical analysis of DCE survey responses (footnote 2).
In the DCE people made repeated choices between two options:
- the food hypersensitivity unchanged, at no cost
- the food hypersensitivity removed for a specified period, at a cost.
The duration of the period for which the food hypersensitivity was removed, and the associated cost, were systematically varied in the choice scenarios.
The DCE choice sets were designed to be answered by adults regarding their own food hypersensitivity or by parents/carers regarding their child’s food hypersensitivity. The survey design was informed by 5 focus groups run online with adults with FHS or parents/carers of children (aged 1-17) with a food hypersensitivity.
The surveys were conducted online between July and December 2021. The sample sizes achieved were 1426 adults (385 allergy, 601 coeliac, 440 intolerance) and 716 parents (496 allergy, 73 coeliac, 147 intolerance).
Extensive testing of the questionnaire in the focus groups had facilitated design of an instrument which the vast majority of respondents understood and were willing and able to complete, including the DCE tasks involving the offer of temporary removal of the food hypersensitivity at a cost.
Low levels (<4.5%) of protest behaviour (prompted by, for example, the need to pay for removal of the condition in the context of NHS provision of healthcare free at the point of use) were observed. Another measure of the validity of the responses is the proportion of respondents who found the questionnaire too difficult. In this study few reported that the DCE choice sets were “very difficult” to understand (1.1% in adult survey; 3.9% in child survey;), see Tables 5 and 6 in Appendix O for more details).
Statistical analysis of the DCE choice data indicates significant effects of the cost and duration of food hypersensitivity removal, indicating most respondents were making the trade-offs envisaged when designing the DCE.
WTP results are shown in Table ES1. The average WTP for the removal of an adult’s FHS for a year, pooled across all conditions was £718. For models estimated separately by condition, the WTP values for food allergy, coeliac disease and food intolerance were £1064, £1342 and £540 respectively.
In models estimated on DCE data from parents regarding their children’s FHS conditions, the WTP values were: £2766 for food allergy; £1628 for coeliac disease; £1689 for food intolerance. Parents’ WTP for children with a food allergy is significantly higher than the case for the other two conditions – this ordering is intuitive given the potentially fatal impacts of an allergic reaction.
Table ES1: WTP Results in Aggregate and by condition, for adults and children
| Category | Condition | WTP, Adults (£ and year) | WTP, Children (£ and year) |
|---|---|---|---|
| Aggregate Models | - | 718 | 2501 |
| Models by condition | Allergy | 1064 | 2766 |
| Models by condition | Coeliac | 1342 | 1628 |
| Models by condition | Intolerance | 540 | 1689 |
Respondents rated their (child’s) health and the impacts of their (child’s) FHS using several established generic instruments (including EQ5D and Visual Analogue Scale, VAS). They also completed condition-specific instruments (Food Allergy Quality of Life Questionnaire, FAQLQ; Food Intolerance Quality of Life Questionnaire, FIQLQ; Coeliac Disease Quality of Life Questionnaire, CDQ).
Statistical Tests were conducted to identify whether these self-assessments of health and FHS severity affected WTP. In the adult allergy and intolerance models we find robust evidence of effects of condition severity on WTP – the higher people’s FAQLQ and FIQLQ scores, the more they are willing to pay to remove their food hypersensitivity. There was no effect of variation in the CDQ score on WTP to remove the condition in the adult coeliac disease sample.
In the child WTP results we find condition-severity effects in the coeliac sample: the worse the child’s CDQ score the higher the parents’ WTP to remove the condition. In the allergy and intolerance models the FAQLQ and FIQLQ scores affect the degree of aversion to moving away from the status quo option – the more severe the child’s condition the less averse the parent is to choosing the option to remove their condition.
Regarding (B), food hypersensitivities have diverse impacts on people’s health and quality of life. This is apparent in the high number of questions/items which comprise the FHS-specific measures; the FAQLQ comprises 29 impacts, the FIQLQ 22 impacts and the CDQ includes 20 impacts, all of which respondents with those conditions score.
The project investigated the relative importance of those different impacts to people with those conditions. Understanding this relative importance can inform policy and practice, allowing targeting of measures at those impacts which are considered the most important by people living with those food hypersensitivities.
The relative importance of the impacts comprising the FAQLQ, FIQLQ and CDQ impacts were elicited by including them in a Best Worst Scaling (BWS) exercise in the survey. This method presents repeated subsets of the full set of ‘items’ (in this case, FHS impacts) and respondents select the impacts which have the greatest and least impacts on their quality of life. The technique provides a ranking and estimates of the magnitude of the differences in importance.
The BWS results indicate that people assign very different levels of importance to the impacts comprising the FAQLQ, FIQLQ and CDQ instruments. This unequal prioritisation contrasts with the equal weighting using when constructing the FAQLQ, FIQLQ and CDQ measures.
The three impacts which were indicated to have the greatest impacts on people’s quality of life, for each condition, are shown in Table ES2. The embarrassment or fear related to eating out or social situations feature in the top three impacts for all the conditions.
ES2: FHS impacts with greatest effect on quality of life, by condition, from BWS results.
Food Allergy:
- The fear of an allergic reaction
- The fear of an allergic reaction when eating out
- The trouble from always being alert as to what you are eating
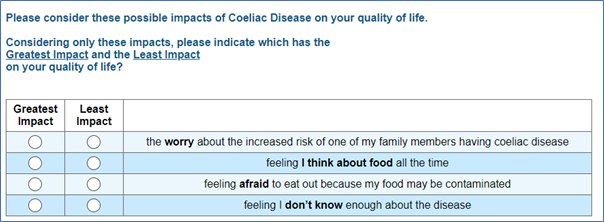
Coeliac Disease:
- Feeling afraid to eat out because my food may be contaminated
- The concern that my long-term health will be affected
- The concern that this disease will cause other health problems
Food Intolerance:
- The worry that you experience physical distress because of symptoms during a reaction
- The trouble from having to always be alert as to what you are eating
- The worry that you will be embarrassed by the symptoms of a reaction in social situations.
Uses of the Results
The FSA has developed a Cost of Illness (COI) model, the Burden of Foodborne disease in the UK which it currently uses to identify and measure the annual, social, cost of foodborne disease.
The research reported here contributes to the FSA’s assessment of the scale of the economic costs imposed on society by food hypersensitivities and, more specifically, the FSA’s intention to extend the FSA’s Cost of Illness (COI) model to include food hypersensitivities as well as foodborne disease.
The WTP values reported here are estimates of the combined annual costs associated with
- intangible costs including the pain, anxiety, inconvenience and anxiety caused by FHS
- additional incurred costs (time and money) and lost earnings
These costs can be incorporated into the COI model.
The BWS results indicate that people assign very different levels of importance to the impacts comprising the three instruments. This unequal prioritisation contrasts with the equal weighting using in the construction of the FAQLQ, FIQLQ and CDQ measures.
1.1 Background / policy context
This report presents the findings from research conducted by the University of Manchester as part of the #FOODSENSITIVE project led by Aston University and funded by the Food Standards Agency (FSA).
The FSA is an independent government department responsible for protecting public health and consumers’ interests in relation to food across England, Wales and Northern Ireland.
That public health remit includes protecting the public from potentially adverse and potentially fatal, impacts of food hypersensitivities.
The FSA seeks to ensure that consumers with food hypersensitivities (FHS) are able to understand the products they consume and so make safe and informed choices.
The research reported here contributes to the FSA’s assessment of impacts of FHS on quality of life and the scale of the economic costs imposed on UK society by food hypersensitivities. It supports the FSA’s intended extension of the FSA’s Cost of Illness (COI) model to include the costs of FHS.
The COI model identifies and measures the full social cost of foodborne disease, including both its financial (medical and personal costs) and monetary estimates of its non-financial impacts (pain, grief and suffering).
The costs included in the COI model comprise financial and non-financial costs borne by individuals and carers, businesses and government. The financial costs include direct costs (medical care expenditures including resource use and costs to the NHS and personal expenses) and indirect costs (loss of earnings due to illness and disturbance costs to business). The non-financial costs include the pain, grief and suffering caused by foodborne disease.
The COI model generates estimates of the annual burden to society from foodborne illness in the UK population and to facilitate assessment of cost effectiveness of food safety policy interventions, impact assessments and evaluation.
Extending the model to incorporate FHS values requires an annual value of the financial and non-financial costs associated with FHS. The model can accommodate values disaggregated by the three conditions included in this study (food allergy, coeliac disease and food intolerance) and by whether a ‘case’ is an adult or a child.
This research generates estimates of annual costs, by condition and parent/child status, associated with food hypersensitivities.
Project scope
The research reported here contributes to the FSA generating estimates of the annual costs to the UK of food hypersensitivities, with a view to these costs being incorporated in the FSA’s COI model.
For the purpose of this report, we define food hypersensitivities (FHS) as:
- Food Allergy
- Coeliac Disease
- Food Intolerance
We estimate an average annual value of removal of people’s FHS. Such a removal would yield benefits including:
- averted pain, suffering, inconvenience and anxiety imposed by food hypersensitivities.
- avoided additional expenditure (time and money) associated with managing food hypersensitivities.
- lost earnings because of FHS or caring for those with FHS.
Hence the scope of the costs estimated is
- non-financial costs including the pain, anxiety, inconvenience and anxiety caused by food hypersensitivities
- additional incurred costs (time and money) and lost earnings.
Medical care costs and NHS resource use are not covered by this report. The geographical scope of the project is the UK. We include adults and children (aged 1-17) in the study. Responses regarding children (in terms of their health, and the value associated with removal of their condition) are gathered from parents/carers rather than from children themselves.
The objectives of this study are:
- Estimate WTP for a year’s removal of food hypersensitivity, in aggregate and disaggregated by condition and whether an adult or child.
- Analyse how WTP values are moderated by individual characteristics - primarily the severity of the condition experienced by the respondent or their child.
- To test for declining marginal WTP for removal of food hypersensitivity as the duration of removal increases.
- Estimate the relative importance of the diverse impacts of food hypersensitivities on people’s quality of life in order to:
- test whether the equal weight given to the items in existing instruments is appropriate
- to facilitate prioritisation of actions to reduce the impact of food hypersensitivities on people’s quality of life.
Report structure
The report has 11 sections and 18 appendices.
2.1 Stated Preference Approach
The project aims to:
A. estimate the economic value of the pain and suffering caused by food hypersensitivity in the UK. This encompasses food allergies, food intolerances and coeliac disease.
B. estimate the relative importance of the different impacts of food hypersensitivity on people’s quality of life
2.1.1 Willingness to Pay (WTP)
The economic values were identified using a stated preference (SP) approach to identify people’s Willingness to Pay (WTP) to remove the symptoms and limitations of food hypersensitivity.
A Discrete Choice Experiment (DCE) was designed in which people made choices between their current situation and temporary removal of their condition – for varying durations and at varying cost.
Food allergies, food intolerances and Coeliac coeliac disease are experienced by adults and children, but WTP values could not be sought from children directly and hence WTP values were sought for two distinct groups:
- Adults’ WTP regarding their own food hypersensitivity
- Parents’ WTP regarding their children’s food hypersensitivity
These WTP values (for adult FHS, child FHS) for the three conditions (food allergy, food intolerance and Coeliac coeliac disease) were designed to be incorporated into the FSA’s Cost of Illness (CoI) model (see Section 1.1)
The gain delivered from removal of the food hypersensitivity, and hence the gain being valued, was captured at the individual-level in 3 ways:
1. EQ-5D
Respondents scored their health at the time of the survey using the EQ-5D-5L (see Appendix I). They were also asked to score (using EQ-5D-5L) how they imagined their health would be if their FHS was removed. The difference in those two scores is a measure of the improvement delivered by removal of the FHS. The same difference measure was generated for the sample of parents using the EQ-5D-3L (proxy) for children.
2. Visual Analogue Scale (VAS)
An equivalent process – scoring health today and if the FHS was removed, was undertaken using the EuroQol Visual Analogue Scale (hereafter referred to as ‘VAS’ see Appendix A), thus providing another measure of the gain delivered by removal of FHS. This was done for adults and parents regarding their child.
3. Condition-specific measures (FAQLQ, FIQLQ, or CDQ) for adults and children
Adults completed one of three health-related quality of life instruments appropriate to their food hypersensitivity:
- Food Allergy Quality of Life Questionnaire (FAQLQ)
- Food Intolerance Quality of Life Questionnaire (FIQLQ)
- Coeliac Disease Quality of Life scale (CDQ)
Parents responding regarding their children’s FHS, completed an age-appropriate version of these instruments (FAQLQ, FIQLQ, CCDUX).
See Appendices A and B for a fuller explanation of these scales and the variants used for children of different ages. Respondents reporting multiple different hypersensitivities completed the scale relevant to the condition they reported as affecting them most.
2.1.2 Relative Importance of food hypersensitivity Impacts
The importance of the many and diverse impacts of food hypersensitivity (as measured by the quality of life instruments) on quality of life were analysed to:
- investigate their relative importance (currently each is given equal weight in FAQLQ, FIQLQ and CDQ measures)
- aid identification of impacts which are most important to people, and/or within the FSA’s power to affect.
To estimate the relative importance of the different impacts of food hypersensitivity on people’s quality of life the Best Worst Scaling (BWS, see Section 4 for details of the method) technique was employed – as this method is designed to elicit the relative importance of items. The ‘items’ in this case are impacts of food hypersensitivities on people’s quality of life. These were taken from the FAQLQ, FIQLQ and CDQ instruments.
Each of these QoL measures comprise multiple statements of the different ways in which the food hypersensitivity affects people with the condition. The impacts are scored by respondents, and the scores aggregated to produce the relevant QoL measure. The items which comprise the FAQLQ, FIQLQ and CDQ instruments were converted into statements that could be placed alongside each other in BWS sets, and respondents asked which had the (a) greatest, and (b) least, impact on their quality of life (see Section 4 and Appendix E).
2.2 Survey Design
The survey was designed in Sawtooth Software’s Lighthouse Studio. It included two choice-based exercises: a Discrete Choice Experiment and a Best Worst Scaling Exercise. In addition, questions were designed to elicit information about their food hypersensitivity, overall health status, health related quality of life and perceptions of the severity of their food hypersensitivity.
2.3 Focus Groups
Five online focus groups (Adults and Parents, separately) were conducted, with 4-5 attendees on each occasion, to test the survey
In broad terms the focus groups were used to test whether the DCE and BWS exercises ‘worked’ – did people understand the choices they were being asked to make and, in the case of the DCE, were they prepared and able to make the trade-offs involved (money versus period of food hypersensitivity removal).
2.4 Recruitment
The sample for the online surveys (see Table 2.1) were recruited via contacting of people who had previously taken part in the project, advertising material distributed by support/patient groups (for example, Allergy UK, Coeliac UK, etc) and a sample purchased from a market research company (see Section 8).
The sample size (post data cleaning) was 2142: split between 1426 adults, 716 parents.
| Adults | N |
|---|---|
| Food Allergy | 385 |
| Coeliac Disease | 601 |
| Food Intolerance | 440 |
| Total | 1426 |
| Parents | N |
|---|---|
| Food Allergy | 496 |
| Coeliac Disease | 73 |
| Food Intolerance | 147 |
| Total | 716 |
2.5 Analysis
The Adult and Child DCE data were analysed via estimation of mixed logit choice models (see Appendix C for more details). Each of the two datasets are analysed in aggregate (considering all conditions) and disaggregated by the 3 conditions. This analysis yields WTP / year estimates – what people would pay to remove the symptoms and limitations of their conditions for a year.
The BWS choice data were also analysed via estimation of logit choice models. The resulting logit coefficients are transformed into ‘Importance Scores’ which allow the relative importance of the items which comprises the FAQLQ, FIQLQ and CDQ instruments to be investigated – that is, as well as a ranking of the impacts we derive estimates of how much more (or less) important an impact of food hypersensitivity is compared to another (see BWS results in Section 10).
3.1 DCE overview
A stated preference approach was employed to estimate the WTP values for the removal of all symptoms and limitations for a specified period.
The quality of any stated preference (SP) study’s results is contingent on the information provided to respondents when they make their choices.
The DCE involves making choices between discrete options which are defined in terms of attributes which vary in their levels. Monetary valuation requires a cost attribute (which needs to be clearly specified – what is being paid for and when).
The change in food hypersensitivity needed also to be conveyed in the DCE options. Various options were considered regarding this – for example specifying different options in terms of the levels of FHS-specific measures (FAQLQ/FIQLQ/CDQ) or generic measures of health such as the of EQ5D . This would have potentially yielded WTP to achieve changes in the levels that define those instruments.
The difficulties in this approach include:
- there not being an evidence base to map EQ5D levels to levels of food hypersensitivity severity (and indeed condition-specific QoL measures such as FAQLQ/FIQLQ/CDQ were in part developed because of the view that EQ5D did not capture food hypersensitivity impacts sufficiently well, [see Jansson et al., 2013]).
- the number of items in the FAQLQ (29), FIQLQ (22) and CDQ (20) were excessive to be included as DCE attributes, and many items/impacts are highly correlated which is problematic for DCE design in which attribute levels are typically designed to move independently of each other.
After considerable deliberation the decision was taken to specify the DCE in terms of a Status Quo (SQ) option (no change in food hypersensitivity, no cost) and an alternative: complete removal of food hypersensitivity, for specified (varying) duration and cost.
The extent of the improvement being offered (the gain from food hypersensitivity removal) would not be specified in the options but vary across individuals - given the distribution of FHS severity in the population.
The individual-level benefit from food hypersensitivity removal was captured in the survey via FAQLQ, FIQLQ, CDQ, EQ5D, VAS etc.
The structure of the choice sets is shown in Table 3.1 below:
| Option A: No change | Option B: Temporary removal of food hypersensitivity |
|---|---|
| No change in FHS | Removal of FHS for specified period |
| No cost | Cost |
3.2 DCE Framing – Deriving an Annual WTP value
A key issue when designing a DCE is in the framing of the valuation exercise. From the perspective of the COI model what is required is a value, expressed in monetary terms, of the additional costs, inconvenience and pain, suffering and anxiety associated with the FHS, for a year.
That value would then be applied to all who had the condition for a year to generate an aggregate measure of the burden in that year.
A direct and obvious approach would be to frame the question so respondents revealed what they would be prepared to pay to avoid a year with their FHS condition.
However, a finding from the focus groups (Section 6) was that many respondents were clear that there were ‘adjustment costs’ associated with moving from the current position (having the FHS) to not having the condition (for a year) and then the FHS returning.
The preference to reject zero-cost removal of the FHS for short periods of time (observed in the focus groups) is a manifestation of those costs of adjustment (associated with short term removal) exceeding the benefits of its removal.
Consequently, if the DCE was framed in terms of removal of the condition for a single year it is likely we would significantly underestimate the ongoing cost of the condition (we would estimate net benefits from removal for a year, and not be able to distinguish between benefits and adjustment costs).
An alternative approach would have been to offer complete removal, for the rest of the respondent’s life. This would address the adjustment cost issue but would raise other issues. We would have had to identify (either by asking respondents their expected life duration, or using life-tables ex post) what the expected length of remaining life was, in-order to identify the annual value.
Further, there could only be one DCE choice task per respondent which would severely limit the efficiency of the DCE design, especially for any conditions for which only small samples were recruited.
The approach adopted was to offer repeated choices in which the period of relief from the FHS condition was varied (from 1 to 20 years). Although choices will still be affected by respondents’ assessment of adjustment costs, statistically an annual value can be estimated, partitioned from those adjustment costs (see Appendix D utility function for more detail on this).
This monetary value (WTP for SQ) should not be included in the COI model, as it represents the value that is associated with a change in condition, whereas the COI model is concerned with costs of ongoing conditions. If, in contrast, one was interested in evaluating the market potential for a treatment that did indeed deliver relief from the FHS then this additional value should be included in the analysis, as it will modify the WTP value to transition from having, to not having, the condition.
For the COI model it is the economic value associated with the ongoing pain, suffering, inconvenience and cost that is relevant.
3.3 DCE Framing – means of food hypersensitivity removal
The choice sets involved an option in which food hypersensitivity was removed for a specified period, at a cost.
A decision was required as whether to specify how the food hypersensitivity was temporarily removed, for example via the taking of a pill, or leave the method unspecified.
Specifying a method (for example, pill or patch) could be regarded as more realistic (and hence induce more realistic choices from respondents), but any specified means of removal could potentially lead to many more questions – such as, pill or patch contents/ testing/safety etc. Leaving the means of food hypersensitivity removal unspecified avoided such questions - but could prompt questions about how the food hypersensitivity was being removed.
Two competing framings were developed (unspecified, a pill taken once) and tested in the focus groups. The strong preference of focus groups participants was to specify the means of food hypersensitivity removal by the pill – this was adopted in the main survey.
3.4 DCE Levels and Experimental Design
DCEs involve choices between discrete options defined by attributes which vary in their levels.
Levels for the Cost of food hypersensitivity removal (the cost of the pill) and the duration (years) of the removal were required. These levels were tested in the focus groups leading to the use of the cost and duration levels shown in Table 3.2.
Table 3.2: DCE Levels and experimental design
| Attribute | Levels |
|---|---|
| Duration (years) | 1, 5, 10, 15, 20 |
| Cost (£/year) | 50, 100, 250, 500, 1000, 1500, 5000 |
The DCE sets which respondents face are the outcome of an experimental design which combined attribute levels into options, and those options into pairs (sets). With 2 attributes each with 5 levels, a full factorial design was generated comprising 25 choice sets, divided into 3 blocks of 8, 8 and 9 sets. By adding a set (from the block of 9 choice sets) into the first two blocks a design of 27 choice sets in 3 blocks of 9 scenarios was achieved – each respondent saw (one of 3 blocks of) 9 choice sets.
3.5 Graphic Design
To increase respondent engagement and understanding of the choice tasks a graphic designer was employed to produce more intuitive representations of the DCE attribute levels. Competing designs were tested in the focus groups and a preferred design was arrived at.
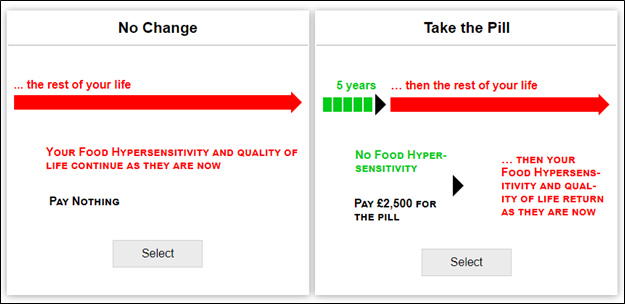
The choice sets for the Adult survey were of the form in Figure 3.1 below.
Figure 3.1. Example Choice Set: Adults
And in the Child survey they were of the form in Figure 3.2.
Figure 3.2. Example Choice Set: Parents
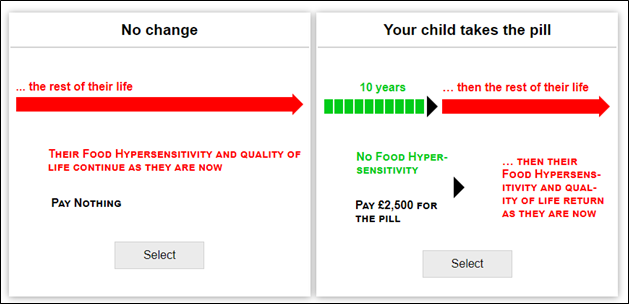
The arrows that convey duration need to be proportionate in their length (for example, 20 years needs to be 4 times as long as 5 years) which requires a screen width larger than most phones offer. Given that some respondents complete surveys on phones an alternative, narrow, graphic design was created – the survey software detects screen size and switched to that design when the respondents screen was suitably small. This design was tested in the focus groups and positively received by participants.
4.1 BWS Overview
A Best Worst Scaling (BWS) component was included within the survey to elicit which of the many impacts of their food hypersensitivity people considered to have the greatest (and least) effect on their quality of life. BWS is a technique designed to elicit relative importance’s.
The impacts considered were those which comprise the condition-specific quality of life measures:
- Food Allergy Quality of Life Questionnaire, FAQLQ
- Food Intolerance Quality of Life Questionnaire, FIQLQ
- Coeliac Disease Quality of Life Questionnaire, CDQ.
Respondents’ responses in the BWS choice sets allow:
- estimation of the relative importance of the impacts of each of the conditions, from the perspective of those living with the conditions
- aid identification of those impacts which are most important to people and within the FSA’s power to affect.
The 29 impacts which comprise the FAQLQ, the 22 which comprise the FIQLQ and the 20 items of the CDQ were (in some cases with modest rephrasing) included in an Best Worst Scaling choice sets. The BWS sets were the product of an experimental design in which the full set of FHS impacts were combined into multiple subsets each comprising 4 of the FHS impacts (see Appendix E for more details).
Example BWS choice sets for the 3 conditions are shown in Figures 4.1 to 4.3
Figure 4.1. Example BWS set: food allergy
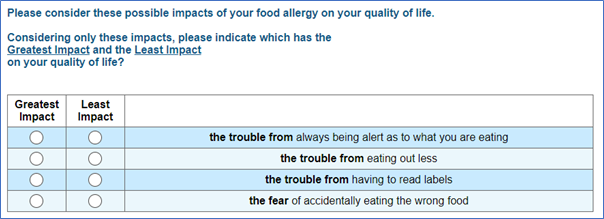
Figure 4.2. Example BWS set: food intolerance
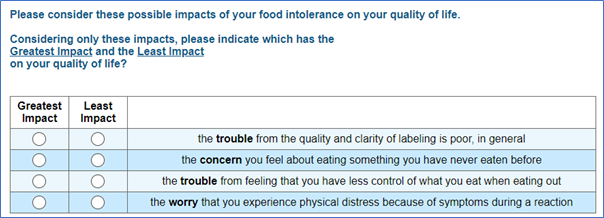
Figure 4.3. Example BWS set: coeliac disease
All BWS sets were made up of 4 FHS impacts per set (see Appendix E for more on the experimental design) and respondents were presented with sets relating to the condition that they had identified as the sole, or most significant, food hypersensitivity they had. Because the FAQLQ/FIQLQ/CDQ differ in the number of impacts included, the number of set people completed varied by condition. Food allergy participants completed 10, those with food intolerance completed 8 and those with Coeliac coeliac disease completed 7 sets.
Advantages of the BWS approach include
- BWS shows greater power of discrimination than more established methods such as Likert scales as it forces respondents to discriminate, preventing participants rating many or all of the items at equal importance (Cohen 2003, Cohen and Orme, 2004, Burton et al, 2019)
- as there are no category descriptors scale bias is avoided, for example from differential interpretations of terms such as “slightly”, “moderately” or “quite” (Cohen 2003, Sawtooth Software, 2020)
- participants are better at judging items at extremes of preference or importance (Louviere 1993).
5.1 Survey Overview
The main elements of the survey are shown In Table 5.1, and those sections are discussed thereafter.
Table 5.1: Survey Overview
| Number | Survey step |
|---|---|
| 1 | Introduction, Information and Consent |
| 2 | Household composition - which children & which adults have which FHS conditions. Nomination of child (if child survey and > 1 child has FHS). |
| 3 | Current EQ5D and VAS |
| 4 | Quality of life measures - FAQLQ, FIQLQ or CDQ |
| 5 | Contingent EQ5D and VAS - scored as if FHS removed |
| 6 | Discrete Choice Experiment (DCE) a) Introduction and training b) Zero costs training choice sets c) Debriefs on why 20-year zero cost option rejected (if it is) and minimum duration required to be desirable. d) 9 costed choice sets (unless declined all zero cost options) e) Includes cheap talk social desirability script f) DCE debrief – how hard to understand, how hard to make choices. g) Protest debriefs – why always paid/why never paid |
| 7 | Open ended CVM questions |
| 8 | Best Worst Scaling (BWS) – using FAQLQ, FIQLQ, or CDQ items. a) Introduction and training b) BWS sets c) BWS debrief – how hard to understand, how hard to make choices |
| 9 | Demographics |
| 10 | Subjective perception of illness |
| 11 | Risk attitudes |
| 12 | Free text comments |
5.1.1 Household composition and conditions
These questions elicited how many adults and how many children had which food hypersensitivities and what were the ages of the children.
If there were
- adults but no children with FHS in the household – the respondent was routed to the Adult FHS questions only
- one child with FHS in the household – the respondent was routed to the Child FHS questions only (whether or not there were adults with FHS in the household)
- >1 child with FHS in the household – the respondent was routed to the Child FHS questions (whether or not there were adults with FHS in the household). The respondent was also asked to nominate one child to answer about (and the age and FHS of that child was elicited).
If respondents had more than one condition they were asked which one had the greatest impact on their quality of life - this was in part because they were required to complete quite lengthy HR QoL instruments and it was regarded as impractical for people to complete more than one of these.
5.1.2 EQ5D and VAS – Current Health
Adults scored their current health on the day of the survey using the EQ5D-5L. These values were then referred to as ‘baseline’ health.
Parents were asked to complete the EQ5D for their children. As no proxy version of the EQ5D-5L is available for children, the EQ5D-3L proxy version was used.
Respondents also scored their (child’s) health using a Visual Analogue Scale (VAS) (Appendix A).
5.1.3 Quality of Life measures - FAQLQ, FIQLQ, CDQ
Adults rated the impacts of their food hypersensitivity on their life using one of FAQLQ, FIQLQ or CDQ.
Parents rated the impacts of their child’s food hypersensitivity on their life using age-appropriate versions of the FAQLQ, FIQLQ or CDQ.
5.1.4 ‘Contingent’ EQ5D and VAS – without food hypersensitivity
Adults were asked to imagine what their health related QoL would be if they did not have their food hypersensitivity - and then score that imagined health state using the EQ-5D-5L.
Likewise, parents were asked to imagine their child’s health without their FHS and score it using the proxy EQ-5D-5L.
Respondents were also asked to use the VAS to indicate how they thought their (child’s) health would be in the absence of their food hypersensitivity.
These questions were included to allow comparison with baseline (current) EQ5D and VAS scores; the difference between the two scores, at the individual level, being a measure of FHS severity.
5.1.5 Discrete Choice Experiment (DCE)
The DCE comprised 9 binary choice sets (see section 3)
These were preceded by training materials that introduced the idea of temporary removal of food hypersensitivity via a pill taken once. The training included 3 choice sets in which the binary choices were between the current situation and removal of their (child’s) FHS for 1, then 5, then 20 years – all at zero cost.
The prospect of there being a cost for the pill was then introduced.
If people declined free removal in all 3 training sets (i.e. including the removal of FHS for 20 years for free) they were skipped past the priced DCE – since they had declined the ‘best’ offer at zero price and so offering them inferior options at positive prices was unnecessary.
People who declined all 3 training sets were instead debriefed as to why they had declined them, and what was the minimum period of removal they would require to be interested in the option.
People who completed the 9 priced choice sets were asked debrief questions on
- how hard was it to understand the DCE choices
- how hard was it to make the DCE choices.
People who always chose to buy the pill in the 9 sets were presented with debrief questions (to allow identification of protest or problematic behaviour – for example people not taking the price seriously).
People who never chose to buy the pill in the 9 sets were presented with debrief questions (to allow identification of protest or problematic behaviour – for example not thinking that the pill would be safe and therefore not considering buying it).
5.1.6 Contingent Valuation questions
Respondents were asked an open-ended Contingent Valuation question as to the maximum they would pay for temporary removal of their condition for either 1, 3, or 5 years (randomly assigned a duration).
Additionally, they were asked their maximum WTP to remove their (child’s) food hypersensitivity permanently.
5.1.7 Best Worst Scaling (BWS)
The BWS comprised repeated choices of which food hypersensitivity impacts had the greatest/least impact on the respondents’ quality of life (see Section 4, Appendix E).
These were preceded by training materials that introduced the items and the structure of the BWS tasks.
People who completed the BWS sets were asked debrief questions on
- how hard was it to understand the BWS choices?
- how hard was it to make the BWS choices?
5.1.8 Demographics
Information on sex, income, etc was collected and is reported in Appendix H.
5.1.9 Subjective Perception of Illness
We used a subjective perception of illness scale as an additional potential measure of the impact of the conditions on respondents. We used the widely cited Brief Illness Perception Questionnaire (Brief IPQ) (Broadbent at al., 2006) which uses 9 questions on a single, 11-point, scale.
We report on the distributions of Brief IPQ scores in Appendix M and report results of choice models estimated incorporating this variable in Appendix R.
5.1.10 Risk Attitudes
The propensity to commit to (one’s child) taking a pill to eliminate a food hypersensitivity was hypothesised to potentially be affected by one’s attitude to risk.
To derive a measure of risk attitude, questions from the SOEP (German Socioeconomic Panel) were included in the survey. These questions and the resulting data are described in Appendix N. The Risk measure is included in additional choice models reported on in Appendix R.
5.1.11 A note on Sample Size
When designing a DCE a consideration of required sample size is appropriate. One can, with appropriate assumptions about the distribution of population preferences, simulate the necessary sample size to achieve statistically significant estimates for all parameters.
In this case, with only two DCE attributes and a full factorial, orthogonal, experimental design, the necessary sample sizes for statistical significance were small. The greater challenge was a recruiting sample for which representativeness could be claimed – something which we discuss in Section 11.
6.1 Focus Group Overview
5 focus groups were undertaken to test and develop survey components.
These comprised 2 groups made up of adults with a food hypersensitivity, three groups of parents of children with a food hypersensitivity, split by whether child had a Food Allergy, Food Intolerance or coeliac disease.
The focus groups were held online with 2 members of the research team present. The meetings were recorded. Participants received a voucher of value £15 for taking part.
After initial introductions, a link was shared for sections of the survey and the group progressed through the survey page by page and discussed the material presented and the tasks they were asked to complete.
Overall, the response was positive in terms of the
- clarity of the material presented (text and graphics)
- the nature of the choice tasks in the DCE
- the components of the BWS choice sets and the nature of the BWS tasks
Pill or Abstract Framing
People viewed (and completed choice sets) using 2 alternative framings:
- Pill as a delivery mechanism,
- Abstract framing “imagine your food hypersensitivity could be removed…”.
People did not object to the Abstract version, but participants articulated a preference (from weak to very strong) for the Pill version. This was the framing used in the main survey.
6.2 Declining a Free Good
Discussion in the focus groups revealed that short term removal of the food hypersensitivity might not be regarded as desirable – because of having to go through the process of re-adjustment after the temporary removal expires. The minimum period required to be desirable varied between people. Over the course of the focus groups the training sets (with no price) were modified to increase the duration up to a maximum of 20 years. The main survey design retained this feature and people declining free removal were skipped past the priced DCEs and asked about the minimum period of removal required to make it desirable.
6.3 Attribute Levels
The levels of duration of food hypersensitivity removal and price were also tested and refined during the course of the focus groups.
The finalised survey instruments for Adults and Parents are shown in Appendices F and G.
These are shown separately, but the online surveys were a single survey with people directed to the relevant adult or child surveys depending on their responses.
The sample for the online surveys were recruited via three routes:
A. direct approach to people who had completed a survey as part of Workstream 1 of this project (“wave 1”)
B. a sample purchased from the Pureprofile market research company (“pure”)
C. a sample recruited via publicity from support/patient groups (for example, Allergy UK, Coeliac UK, etc)(“support”).
Sample B was purchased – with respondents receiving remuneration via the market research company they are attached to.
As an inducement to recruitment, the emails and publicity material that generated samples A and C were offered the opportunity to be entered into a prize draw to win shopping vouchers.
The sample sizes achieved from the three recruitment routes are displayed in Table 8.1. As to whether the sample sizes are sufficient, we distinguish between statistical significance and representativeness of the results.
With only two attributes and a full factorial, orthogonal, experimental design the required sample sizes to retrieve statistically significant estimates are likely far smaller than those achieved.
A more challenging issue is that of the necessary sample size necessary to claim representativeness of the sample against the UK population of people with FHS. There are no reliable estimates of UK prevalence of the 3 FHS conditions included here, nor any breakdown of those populations in terms of condition severity or demographic characteristics. The strategy was to maximise the sample given timeframe and budget.
In conclusion, the challenge was not sufficient sample size to retrieve statistically significant estimates of the marginal utilities of the duration of FHS removal and the cost of that removal, rather the challenge was more generating sample sizes sufficiently large to have some confidence in generalising the estimated results. The sample sizes reported in Table 8.1 provide some confidence regarding representativeness, with the exception of children with Coeliac coeliac disease, an issue we return to in the discussion of the limitations of the study in Section 11.
Table 8.1: Samples sizes and sources, adult, children
Adults
| Adults with | 'wave 1' | 'pure' | 'support' |
|---|---|---|---|
| Food Allergy | 74 | 156 | 155 |
| Coeliac Disease | 231 | 52 | 318 |
| Food Intolerance | 72 | 287 | 81 |
| Total | 377 | 495 | 554 |
Children
| Children with | 'wave 1' | 'pure' | 'support' |
|---|---|---|---|
| Food Allergy | 71 | 205 | 220 |
| Coeliac Disease | 8 | 37 | 28 |
| Food Intolerance | 11 | 117 | 19 |
| Total | 90 | 359 | 267 |
WTP results are derived from estimation of mixed logit models on the choice data, with inferences drawn based on random utility theory.
9.1 Protest Behaviour
Respondents whose choice behaviour was regarded as protest behaviour were excluded from the estimation process. For example, those who indicated they always chose to pay for the pill because they did not take the price seriously, or those who said they did not trust the pill would work and so never chose to buy it.
Of those who completed the priced choice sets, 4.5% of adults and 2% of parents were excluded for such protest behaviour (for more details see Section 17). We regard these rates of protest behaviour as low, particularly given the context of trading off money against (a child’s) health.
9.2 Aggregate Models
9.2.1 Aggregate Models: Adults
The first two models on the adult DCE data are aggregated models, with the data pooled over all 3 conditions.
We estimate a model (AM1, see Table 9.1) in which choices are potentially affected by the duration of symptom removal (“years”) and the cost of the pill (“cost”).
We include an alternative specific constant (ASC) to account for the nature of the status quo “SQ” option over and above its levels of duration and cost. The ASC term on the status quo option is specified as a normally distributed random parameter with the parameters of that distribution estimated.
In this model (AM1) the signs of the Cost and Years terms are as expected – people prefer longer periods of symptom removal and lower costs.
The mean value of the SQ term is positive, implying people positively value the status quo option; they have an aversion to the change associated with taking the pill. The SQ term enters the model as a random term – the estimate of the standard deviation of the SQ term is positive - meaning that there is significant variation in the value placed on it. This means some people will have an aversion to it, that is, they positively value the change associated with taking the pill.
The WTP value for a year without a FHS, from model AM1, is £718.
Aggregate Model AM2 (reported in Table 9.1) is more complex in that the duration of the period of removal of FHS is entered as a quadratic expression, to allow for declining marginal utility from additional years, further in the future. Lower utility from additional years of FHS absence could be the result of diminishing marginal utility or the discounting of gains further in the future.
Model AM2 also accommodates heterogeneity in the severity of the FHS condition.
Two interaction terms are introduced which allow for differences in utility functions according to the VAS change people reported they anticipate from removal of their FHS. We use VAS difference because we need a measure that applies over all conditions (unlike FAQLQ etc which are specific to FHS conditions).
Interaction terms are specified between anticipated VAS change and:
- years of FHS removal
- the mean of the SQ ASC term.
Model AM2 results indicate that years without FHS are positive, cost is negative and the SQ ASC is again positive although there is significant heterogeneity in the marginal utility of the SQ term.
The Years2 term is negative, consistent with declining marginal utility from additional years of FHS, further in the future.
The VASdif*years term is positive (people who expect a bigger improvement in their QoL from removal of their FHS value years without that FHS more highly) but is not significant.
The VASdif*SQ term is negative and significant - people who expect a bigger improvement in their QoL from removal of their FHS value are less averse to moving away from the SQ (taking the pill). This is an intuitive result.
Table 9.1: Models AM1 and AM2 - Adults, aggregate model
| Category | Aggregate Model (AM1) | signif | Aggregate Model (AM2) | signif |
|---|---|---|---|---|
| years | 0.0919 | *** | 0.159 | *** |
| (s.error) | (0.00781) | - | (0.0223) | |
| years2 | - | - | -0.00331 | *** |
| (s.error) | - | - | (0.000902) | - |
| cost | -0.000128 | *** | -0.000129 | *** |
| (s.error) | (1.17e-05) | - | (1.18e-05) | - |
| VASdif x years | - | - | 0.000183 | - |
| (s.error) | - | - | (0.000400) | - |
| SQ (mean) | 1.206 | *** | 1.710 | *** |
| (s.error) | (0.100) | - | (0.144) | - |
| SQ (SD) | 2.937 | *** | 2.900 | *** |
| (s.error) | (0.208) | - | (0.207) | - |
| VAS dif x SQ | - | - | -0.0357 | *** |
| (s.error) | - | - | (0.0094) | - |
| Choices | 10,809 | - | 10,809 | - |
| Individuals | 1201 | - | 1201 | - |
The WTP values from AM2 (see Table 9.2) are moderated by the year (the first year is valued more highly than the 10th or 20th year) and by the person’s expected VAS improvement from removal of their FHS.
For someone anticipating a 5-point improvement in their VAS score (which is the median change in VAS between current and no-FHS score), the first year is valued at £1191, the 10th year is valued at £727, and the decline in value over time is such that a 20th year is not valued.
For someone anticipating a 21-point improvement in their VAS score (which is the 90th percentile change in VAS between current and no-FHS score), the first year is valued at £1214, the 10th year is valued at £750, and the decline in value over time is such that a 20th year is not valued.
Table 9.2 Marginal WTP for a single year removal. Adult aggregate results with quadratic duration term and VAS change interactions
| Category | WTP (£/year) | s.error | z | P | 95% CI lower | 95% CI upper |
|---|---|---|---|---|---|---|
| Years =1 dif=5 | 1191 | 144 | 8.29 | <0.001 | 909 | 1472 |
| Years=10 dif=5 | 727 | 50 | 14.45 | <0.001 | 629 | 826 |
| Years=20 dif=5 | 212 | 134 | 1.58 | 0.113 | -50 | 475 |
| Years=1 dif=21 | 1214 | 147 | 8.25 | <0.001 | 925 | 1502 |
| Years=10 dif=21 | 750 | 61 | 12.3 | <0.001 | 630 | 869 |
| Years=20 dif=21 | 234 | 139 | 1.69 | 0.091 | -37 | 507 |
9.2.2 Aggregate Models: Children
The first model reported is an aggregate model, over all 3 conditions.
We estimate a model (PAM1, see Table 9.3) in which choices are potentially affected by the duration of child’s symptom removal (“years”) and the cost of the pill. As with the adult models we include a normally distributed random term for the status quo ASC.
In this model (PAM1) the signs of the Cost and Years terms are as expected – people prefer longer periods of symptom removal and lower costs.
SQ is positive, implying people value the status quo option, they have an aversion to the change associated with their child taking the pill, although there is significant heterogeneity in the marginal utility of the SQ term.
Table 9.3 Base Aggregate Model
| Category | Child Aggregate Model (PAM1) | significance |
|---|---|---|
| years | 0.105 | *** |
| (s.error) | (0.00689) | - |
| cost | -0.000042 | *** |
| (s.error) | (2.43e-06) | - |
| SQ (mean) | 0.609 | *** |
| (s.error) | (0.120) | - |
| SQ (SD) | 2.265 | *** |
| (s.error) | (0.107) | - |
| Choices | 5,202 | - |
| Individuals | 578 | - |
The WTP value is the ratio of the Years and Cost terms giving values reported in Table 9.4.
Child, base aggregate model: Marginal WTP for a single year of removal of child’s FHS.
Table 9.4: Marginal WTP for year of removal of child's condition, base aggregate model
| Category | WTP (£/year) | s.error | z | P | 95% CI lower | 95% CI upper |
|---|---|---|---|---|---|---|
| Aggregate | 2501 | 155.97 | 16.04 | <0.001 | 2195 | 2807 |
The average WTP for a year of removal of their child’s FHS is £2501
9.3 Disaggregated Base Models
We now consider results for the 3 individual conditions.
9.3.1 Disaggregated Base Models: Adults
For each condition an initial, base, specification replicates that of model AM1: choices are potentially affected by the duration of symptom removal and the cost of the pill.
We include an alternative specific constant (ASC) to account for the nature of the option over and above its levels of duration and cost. The ASC term on the status quo option is specified as a normally distributed random parameter with the parameters of that distribution estimated.
Model results for each condition are shown in Table 9.5.
Table 9.5: Disaggregated Adult models by condition (models A1, C1, I1)
| Category | Allergy Model A1 | signif | Coeliac Model C1 | Signif | Intolerance Model I1 | Signif |
|---|---|---|---|---|---|---|
| years | 0.0671 | *** | 0.126 | *** | 0.0638 | *** |
| (s.error) | (0.0149) | - | (0.014) | - | (0.0131) | - |
| cost | -0.00108 | *** | -0.000165 | *** | -0.000106 | *** |
| (s.error) | (2.15E-05) | - | (0.0000243) | - | (1.59E-05) | - |
| SQ (mean) | 1.199 | *** | 0.790 | *** | 1.985 | *** |
| (s.error) | (0.184) | - | (0.141) | - | (0.215) | - |
| SQ (SD) | 2.610 | *** | 2.570 | *** | 3.458 | *** |
| (s.error) | (0.288) | - | (0.215) | - | (0.395) | - |
| Choices | 2736 | - | 4752 | - | 3321 | - |
| Individuals | 304 | - | 528 | - | 369 | - |
Models A1, C1 and I1 yield the WTP estimates for a year of FHS removal shown in Table 9.6.
Table 9.6 Marginal WTP for a year with condition removed
| Model type | WTP (£/year) | s.error | z | P | 95% CI lower | 95% CI upper |
|---|---|---|---|---|---|---|
| Allergy | 620 | 89 | 6.96 | <0.001 | 445 | 795 |
| Coeliac | 760 | 67 | 11.37 | <0.001 | 629 | 891 |
| Intolerance | 603 | 99 | 6.07 | <0.001 | 408 | 797 |
The WTP for FHS removal for people with coeliac disease (£760) is higher than that for people with Food Allergies (£620) and Intolerances (£603).
9.3.2 Disaggregated Base Models: Children
For each condition an initial, base, mixed logit specification replicates that of model PAM1: choices are affected by the duration of child’s symptom removal and the cost of the pill.
The ASC term on the status quo option is again specified as a normally distributed random parameter. Model results for each condition are shown in Table 9.7 and the resulting WTP values are displayed in Table 9.8.
Table 9.7. Disaggregated Models, Children (models: PA1, PC1, PI1)
| Category | Child Allergy Model PA1 | signif | Child Coeliac Model PC1 | Signif | Child Intolerance model PI1 | Signif |
|---|---|---|---|---|---|---|
| years | 0.115 | *** | ).0731 | *** | 0.0874 | *** |
| s.error | (0.00824) | - | (0.0216) | - | (0.0158) | - |
| cost | -0.0000397 | *** | -0.0000453 | *** | -0.0000516 | *** |
| s.error | (2.73e-06) | - | (8.41e-06) | - | (6.53e-06) | - |
| SQ (Mean) | 0.455 | *** | 0.724 | *** | 1.068 | *** |
| s.error | (0.138) | - | (0.404) | - | (0.291) | - |
| SQ (SD) | 2.142 | *** | 2.648 | *** | 2.449 | *** |
| s.error | (0.122) | - | (0.381) | - | (0.267) | - |
| Choices | 3573 | - | 576 | - | 1053 | - |
| Individuals | 397 | - | 64 | - | 117 | - |
Table 9.8. Children, base models: Marginal WTP for a single year increase
| Category | WTP (£/year) | s.error | z | P | 95 CI lower | 95% CI upper |
|---|---|---|---|---|---|---|
| Allergy | 2902 | 204 | 14.21 | <0.001 | 2502 | 3302 |
| Coeliac | 1611 | 422 | 3.81 | <0.001 | 783 | 2439 |
| Intolerance | 1695 | 274 | 6.18 | <0.001 | 1157 | 2232 |
The average WTP for a year of removal of their child’s food allergy is £2902, for coeliac disease it is £1611 and for Food Intolerance it is £1695.
9.4 Disaggregated Models using Condition-Specific QoL Measures
9.4.1 Models using Condition-Specific QoL Measures: Adults
In the next 3 adult models, reported in Table 9.9, condition-specific health effects are included. Unlike the aggregate model which uses the generic VAS score, the disaggregated models make use of condition-specific measures of condition severity (FAQLQ, FIQLQ, CDQ). Insignificant interactions are removed from the model.
We include interaction terms between the severity of the condition (FAQLQ, FIQLQ, CDQ) and:
- the value of additional years of FHS removal
- the value of the status quo.
Table 9.9. Models Disaggregated by Condition, Adults
| Category | Allergy model A2 | signif | Coeliac Model C2 | Signif | Intolerance Model I2 | Signif |
|---|---|---|---|---|---|---|
| years | -0.0484 | - | 0.126 | *** | -0.0461 | ** |
| s.error | (0.0401) | - | (0.0140) | - | (0.0386) | - |
| cost | -0.000109 | *** | -0.000166 | *** | -0.000105 | *** |
| s.error | (2.11e-05) | - | (2.47e-05) | - | (1.73e-05) | - |
| FIQ x years | - | - | - | - | 0.0220 | *** |
| s.error | - | - | - | - | (0.00760) | - |
| FAQ x years | 0.0221 | *** | - | - | - | - |
| s.error | (0.00746) | - | - | - | - | - |
| FIQ x SQ | - | - | - | - | -0.667 | *** |
| s.error | - | - | - | - | (0.150) | - |
| CDQ x SQ | - | - | -0.0281 | *** | - | - |
| s.error | - | - | (0.00771) | - | - | - |
| FAQ x SQ | -0.697 | *** | - | - | - | - |
| s.error | (0.141) | - | - | - | - | - |
| SQ (mean) | 4.587 | *** | 2.169 | *** | 5.021 | *** |
| s.error | (0.731) | - | (0.396) | - | (0.771) | - |
| SQ (SD) | 2.346 | *** | 2.517 | *** | 3.070 | *** |
| s.error | (0.246) | - | (0.216) | - | (0.362) | - |
| Choices | 2736 | - | 4752 | - | 3321 | - |
| Individuals | 304 | - | 528 | - | 369 | - |
Robust standard errors in parentheses
significance:*** p<0.01, ** p<0.05, * p<0.1
Food Allergy model A2
In this model the sign of Cost is as expected – people prefer lower costs. SQ is positive, implying people value the status quo option, they have an aversion to the change associated with taking the pill, although there is variation in that preference parameter.
The value of additional years without the food intolerance only becomes positive when the condition (the value of FAQLQ) is sufficiently severe (large) - the more severe the individuals’ FHS condition (higher FAQLQ score) the higher the value attached to an additional year of FHS removal.
The more severe the individuals’ FHS condition (higher FAQLQ score) the lower the value attached to the status quo – the less averse to change (taking the pill) people are.
Food Intolerance model I2
In this model the sign of Cost is as expected – people prefer lower costs. SQ is positive, implying people value the status quo option, they have an aversion to the change associated with taking the pill, although there is variation in that preference parameter.
The value of additional years without the food allergy only becomes positive and significant when the condition (the value of FIQLQ) is sufficiently severe (large) - the more severe the individuals’ FHS condition (higher FIQLQ score) the higher the value attached to an additional year of FHS removal.
The more severe the individuals’ FHS condition (higher FIQLQ score) the lower the value attached to the status quo – the less averse to change (taking the pill) people are.
Coeliac Disease model C2
In this model the sign of Cost is as expected – people prefer lower costs. SQ is positive, implying people value the status quo option, they have an aversion to the change associated with taking the pill, although there is variation in that preference parameter.
The utility increase from years without coeliac disease is positive and significant. The interaction term between severity (CDQ score) and years without FHS is not significant (excluded from model).
The more severe the individuals’ FHS condition (higher CDQ score) the lower the value attached to the status quo – the less averse to change (taking the pill) people are.
WTP estimates from the three disaggregated models are reported in Table 9.10.
For Food Allergy and Food Intolerance, the WTP for years of FHS removal are moderated by severity of condition (FAQLQ and FIQLQ score) – the WTP values in the table are for the sample median value of FAQLQ and FIQLQ.
Table 9.10: Marginal WTP for a year with FHS removed (calculated at median score of FAQLQ and FIQLQ)
| Category | WTP (£/year) | s.error | z | P | 95% CI lower | 95% CI upper |
|---|---|---|---|---|---|---|
| Allergy | 500 | 94 | 5.34 | <0.001 | 317 | 684 |
| Coeliac | 760 | 67 | 11.34 | <0.001 | 629 | 891 |
| Intolerance | 633 | 104 | 4.7 | <0.001 | 429 | 837 |
9.5 Preferred Model Results: Adults
9.5.1 Preferred Model Specifications: Adults
In addition to individual-level measures of health impacts of the conditions (VAS, EQ5D, FAQLQ, FIQLQ and CDQ) a range of characteristics were included in the models estimated.
One of the findings from the Focus groups was that age played a role – in terms of some (older) adults reporting that they had become used to their FHS, or parents indicating a difference in how they regarded temporary FHS removal for children of different ages.
Age effects were tested for and found to be present in the Allergy model: older people were more averse to moving from away the status quo (taking the pill and temporarily removing their FHS).
In addition, quadratic duration effects were tested for and found to be present in the allergy and coeliac model: additional years of FHS removal yielded smaller utility gains the further into the future they occurred.
These effects are retained in the preferred adult models A3, C3 and I3 reported in Table 9.11.
Table 9.11: Preferred Specifications of Disaggregated Models, Adults
| Category | Allergy model A3 | signif | Coeliac Model C3 | Signif | Intolerance Model I3 | Signif |
|---|---|---|---|---|---|---|
| years | - | - | 0.235 | *** | -0.0461 | * |
| s.error | - | - | (0.0327) | - | (0.0386) | - |
| years2 | -0.00283 | ** | -0.00527 | *** | - | - |
| s.error | (0.00132) | - | (0.00129) | - | - | - |
| cost | -0.000110 | *** | -0.000167 | *** | -0.000104 | *** |
| s.error | (2.09e-05) | - | (2.50e-05) | - | (1.73e-05) | - |
| FIQ x years | - | - | - | - | 0.0220 | *** |
| s.error | - | - | - | - | (0.00760) | - |
| FAQ x years | 0.0241 | *** | - | - | - | - |
| s.error | (0.0058) | - | - | - | - | - |
| FIQ x SQ | - | - | - | - | -0.667 | *** |
| s.error | - | - | - | - | (0.150) | - |
| CDQ x SQ | - | - | -0.0283 | *** | - | - |
| s.error | - | - | (0.00779) | - | - | - |
| FAQ x SQ | -0.663 | *** | - | - | - | - |
| s.error | (0.135) | - | - | - | - | - |
| SQ (mean) | 0.0288 | ** | 2.506 | *** | 5.021 | *** |
| s.error | (0.740) | - | (0.405) | - | (0.771) | - |
| SQ (SD) | 2.318 | *** | 2.536 | *** | 3.069 | *** |
| s.error | (0.239) | - | (0.217) | - | (0.362) | - |
| Choices | 2727 | - | 4752 | - | 3321 | - |
| Individuals | 303 | - | 528 | - | 369 | - |
Robust standard errors in parentheses
significance:*** p<0.01, ** p<0.05, * p<0.1
Note: in model A3 the coefficient on years was not significant, and hence the variable has been dropped from the model – but duration effects are still included via the term interacting years with FAQLQ score
9.6 WTP Values from Preferred Specifications: Adults
9.6.1 Adult WTP values: Food Allergy
The WTP values reported in Table 9.12 depend on the severity of the condition’s impacts (FAQLQ score) and the year in which the allergy’s effects are removed. They are reported here for 10th, 50th and 90th percentile values of FAQLQ and in years 1, 10 and 20.
At a FAQLQ score of 2.44 (10th percentile value) the WTP of £482 in year 1 falls to zero in year 10. At the sample median FAQLQ value (5.1) the WTP of £1064 falls to zero by year 16.
Table 9.12: Marginal WTP for removal of food allergy, at 3 levels of FAQLQ and year of removal
| Category | WTP (£/year) | s.error | z | P | 95% CI lower | 95% CI upper |
|---|---|---|---|---|---|---|
| FAQLQ=2.44 years=1 | 428 | 102 | 4.72 | <0.001 | 282 | 683 |
| FAQLQ=5.10 years=1 | 1064 | 239 | 4.45 | <0.001 | 596 | 1532 |
| FAQLQ=6.45 years=1 | 1359 | 308 | 4.41 | <0.001 | 755 | 1964 |
| FAQLQ=2.44 years=10 | 18 | 139 | 0.13 | 0.895 | -255 | 292 |
| FAQLQ=5.10 years=10 | 600 | 87 | 6.89 | <0.001 | 429 | 771 |
| FAQLQ=6.45 years=10 | 896 | 126 | 7.10 | <0.001 | 648 | 1143 |
| FAQLQ=2.44 years=20 | -497 | 387 | -1.28 | 0.199 | -1255 | 261 |
| FAQLQ=5.10 years=20 | 85 | 270 | 0.31 | 0.753 | -444 | 614 |
| FAQLQ=6.45 years=20 | 380 | 220 | 1.73 | 0.083 | -50 | 810 |
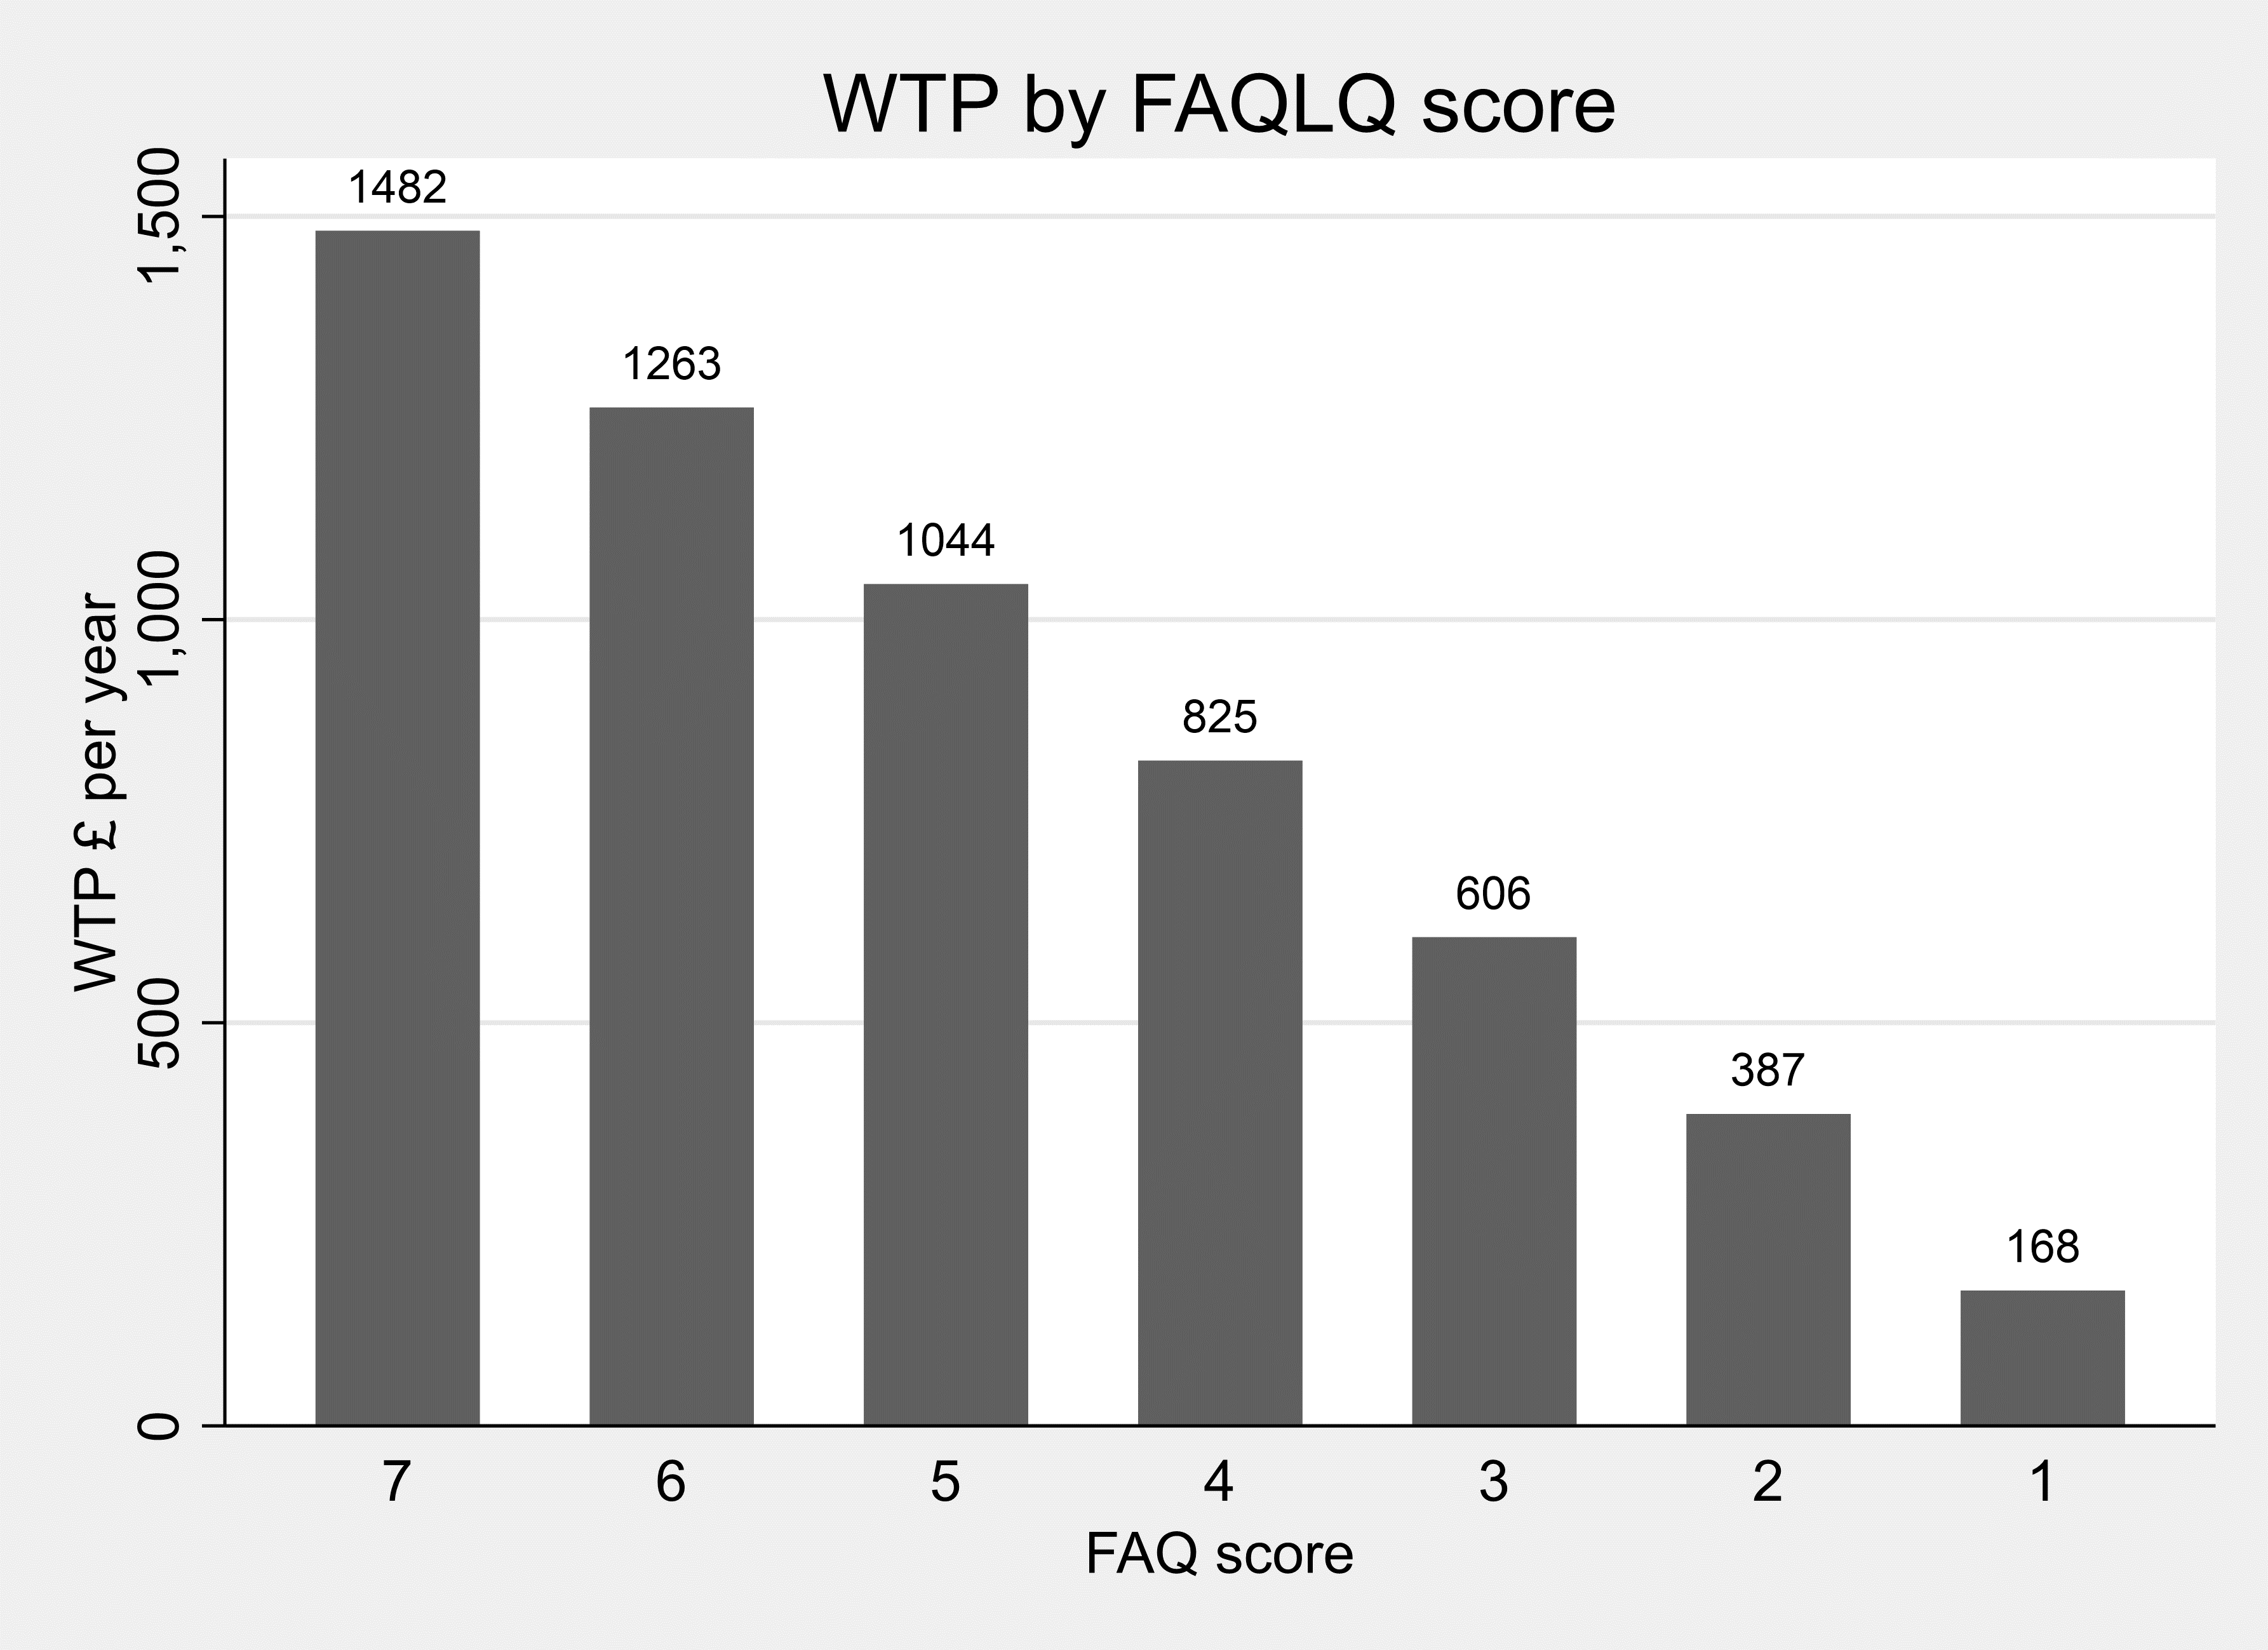
Figure 9.1 below reports the marginal WTP for an additional year of health improvement, evaluated at the initial year. This is significant at all levels of FAQLQ, although it falls to a relatively low level (£168) for a FAQLQ score of 1.
Figure 9.1. WTP for one year without food allergy, by FAQLQ score
9.6.2 Adult WTP values: Coeliac Disease
WTP values, displayed in Table 9.13, are invariant over CDQ scores (although the higher the CDQ score the less averse people are to moving away from the SQ option people) but vary over time.
Table 9.13. Marginal WTP for a year without FHS, at 3 different levels of year of improvement
| Category | WTP (£/year) | s.error | z | P | 95% CI lower | 95% CI upper |
|---|---|---|---|---|---|---|
| Years=1 | 1342 | 188 | 7.16 | <0.001 | 975 | 1710 |
| Years=10 | 775 | 71 | 10.94 | <0.001 | 636 | 914 |
| Years=20 | 144 | 151 | 0.95 | 0.340 | -152 | 440 |
The marginal value of an additional year without coeliac disease is not significantly different from zero by Year 19 (which is evident in Figure 9.2).
Figure 9.2. WTP per year without coeliac disease
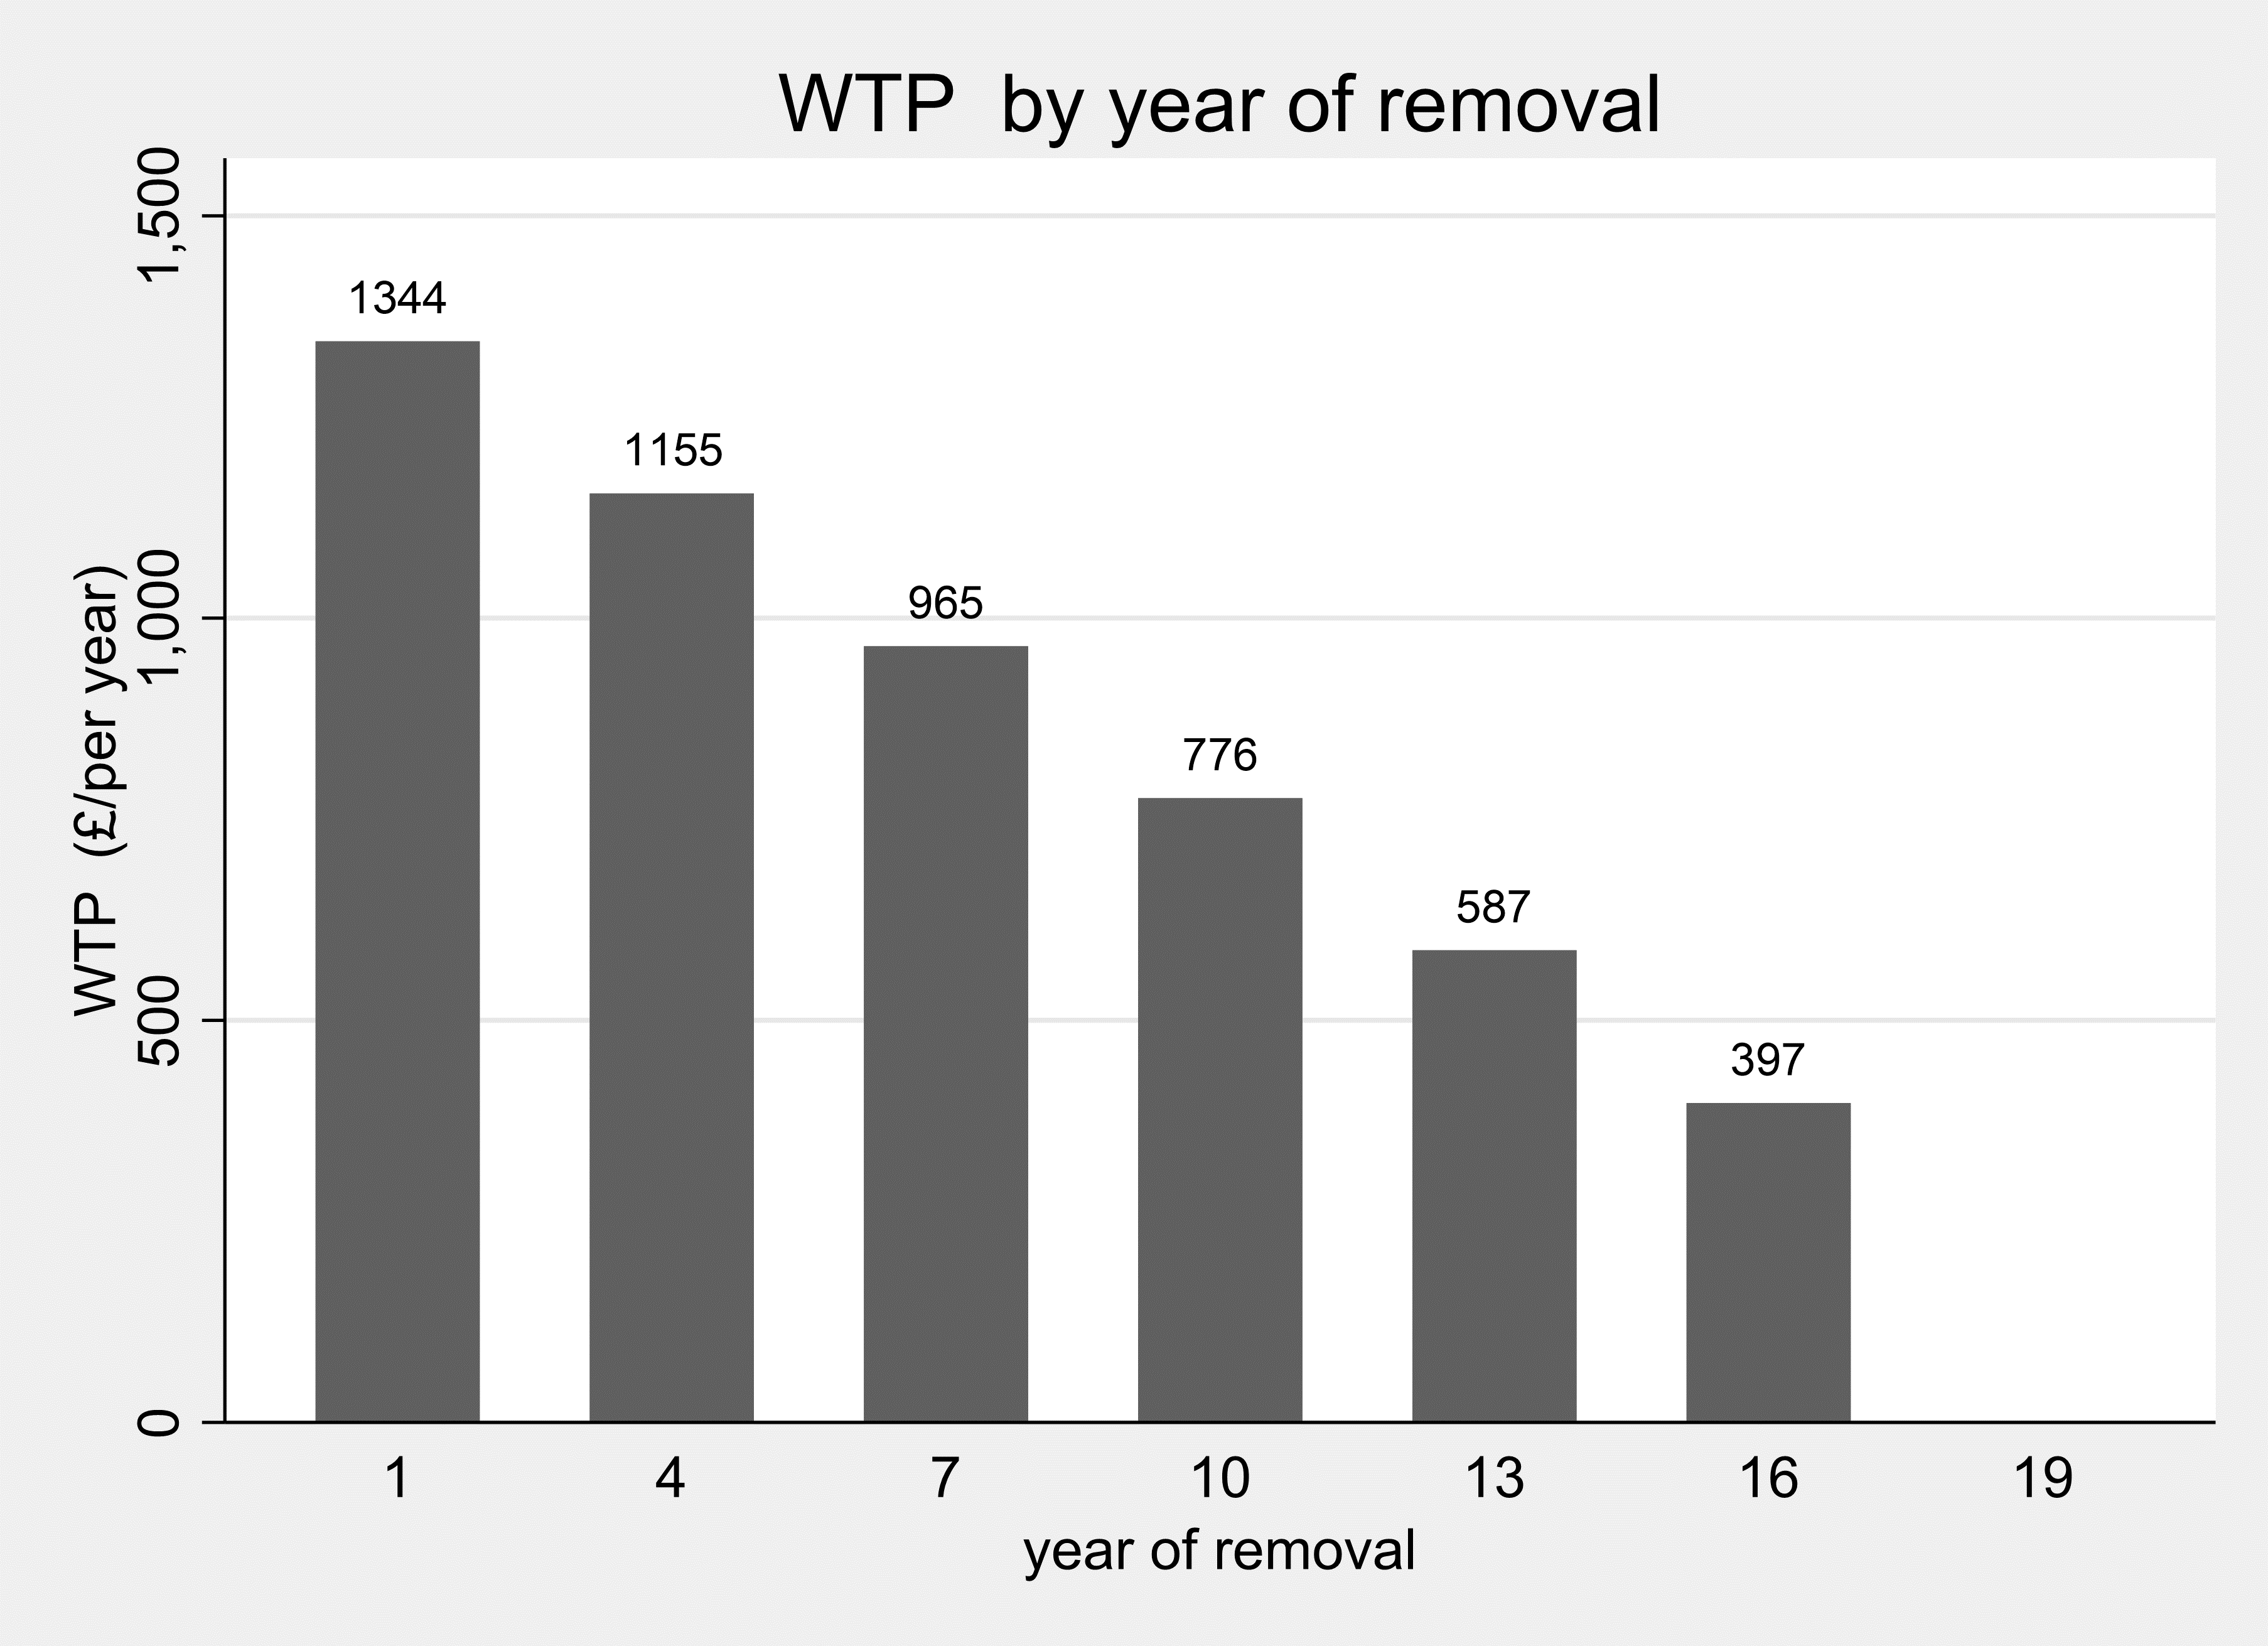
The WTP for a year without coeliac disease falls to zero at Year 19.
9.6.3 Adult WTP values: Food Intolerance
The WTP to remove food intolerance depend on the severity of the condition’s impacts (FIQLQ score) but not the year of removal. The WTP estimates reported in Table 9.14 are for the 10th, 50th and 90th percentile values of FIQLQ.
Table 9.14. Marginal WTP for a single year increase. Intolerance, at 3 different levels of FIQLQ
| Category | WTP (£/year) | s.error | z | P | 95% CI lower | 95% CI upper |
|---|---|---|---|---|---|---|
| FIQ=2.38 | 61 | 211 | 0.29 | 0.773 | -353 | 474 |
| FIQ=4.66 | 540 | 97 | 5.56 | <0.001 | 349 | 731 |
| FIQ=6.44 | 915 | 177 | 5.17 | <0.001 | 568 | 1262 |
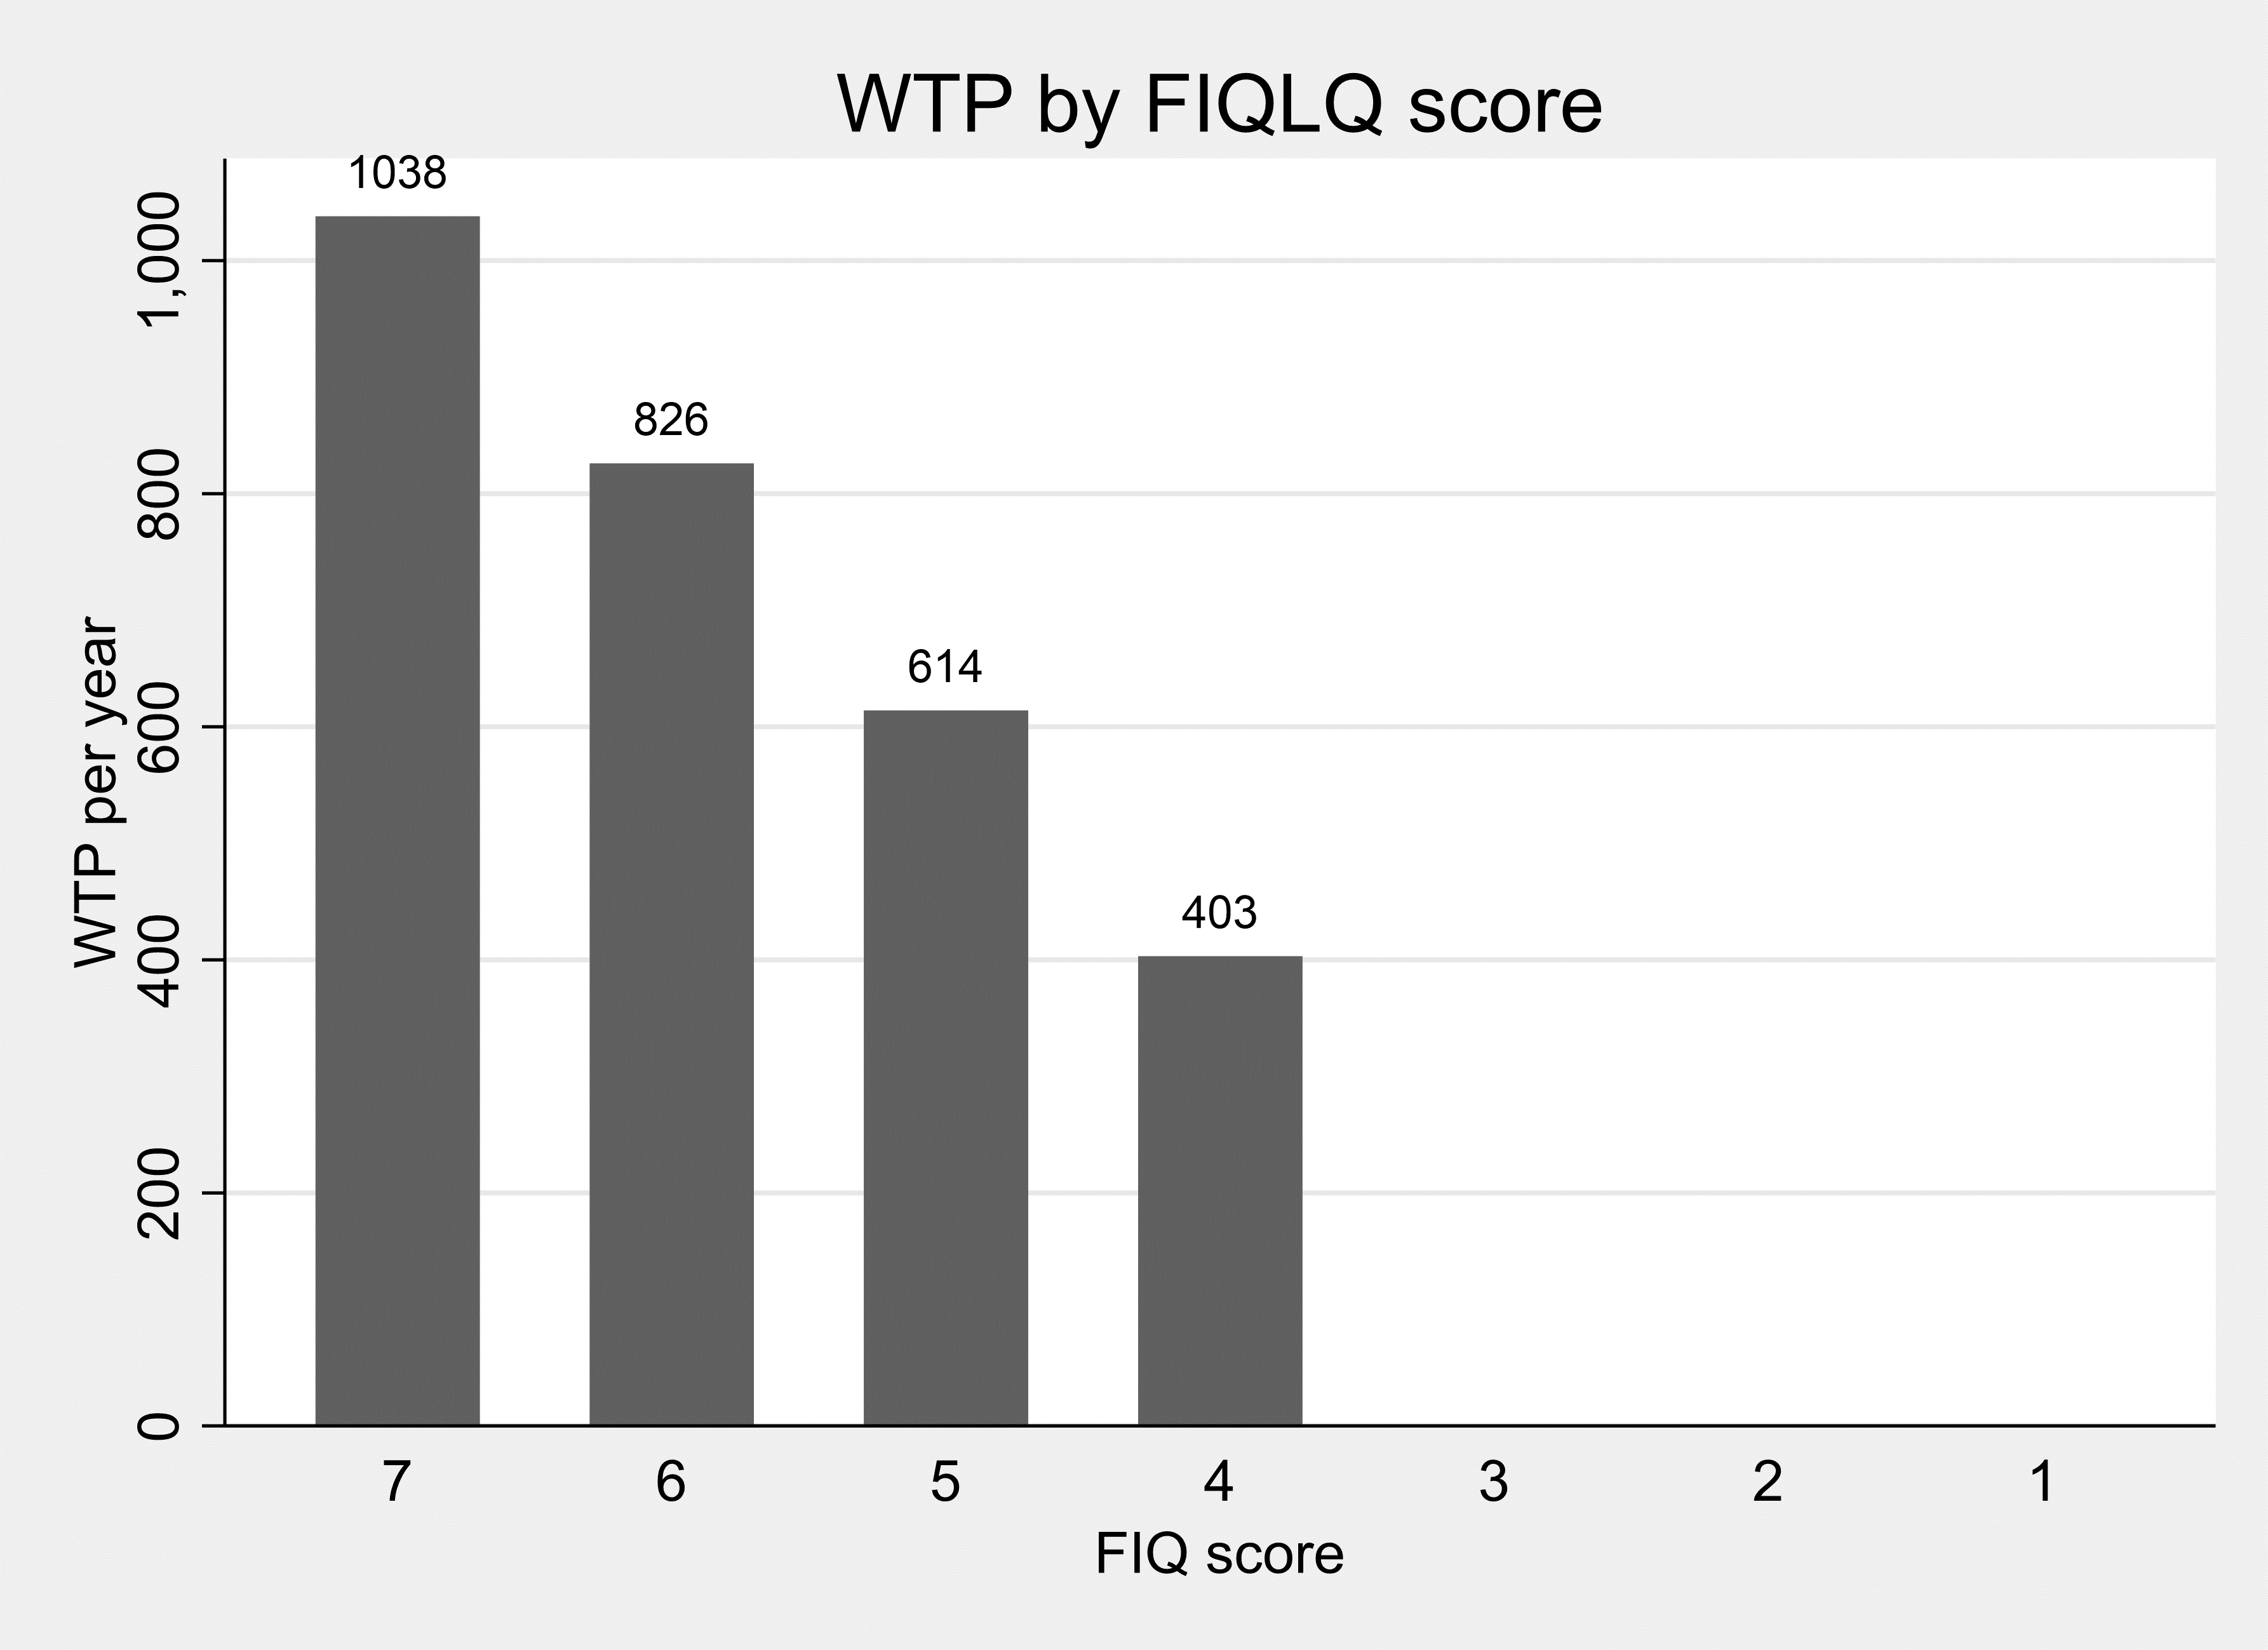
A FIQLQ score of 3 or below implies that the WTP for removal of the Food Intolerance is not significantly different from zero (which is evident in Figure 9.3).
Figure 9.3. WTP for one year without food intolerance, by FIQLQ score
9.7 Preferred Model Results: Children
9.7.1 Preferred Model Specifications: Children
In these preferred mixed logit model specifications, the marginal utility of additional years with the child’s FHS removed, and/or the SQ ASC, are conditioned by the child’s age and the predicted improvement in the child’s health condition score. The three sets of model results are reported in Table 9.15.
In the Allergy model (PA2) the younger the child the lower the value derived from years with the allergy removed and the less averse the parent is to change (their child taking the pill). Also, the higher the condition score (FAQLQ) the less averse the parent is to change (their child taking the pill)
In the coeliac model (PC2) no child age effects are significant but the greater the anticipated improvement in CCDUX score, the greater the value the parent places on reducing a year of the condition.
In the Intolerance model (PI2) there are no significant effects of child age but the higher the FIQLQ score (for example, the worse the condition) the more likely they are to take the pill.
Table 9.15. Preferred Specifications of Disaggregated Models, Child sample
| Category | Child Allergy model PA2 | signif | Child Coeliac Model PC2 | Signif | Child Intolerance Model PI2 | Signif |
|---|---|---|---|---|---|---|
| years | 0.140 | *** | -0.110 | - | 0.0873 | *** |
| s.error | (0.0155) | - | (0.0810) | - | (0.0158) | - |
| years x childage | -0.00313 | * | - | - | - | - |
| s.error | (0.00161) | - | - | - | - | - |
| Years x CCDUX | - | - | 0.00438 | ** | - | - |
| s.error | - | - | (0.00188) | - | - | - |
| cost | -0.0000395 | *** | 0.0000454 | *** | -0.0000517 | *** |
| s.error | (2.72e-06) | - | (2.70e-05) | - | (6.54e-06) | - |
| SQ (mean) | 2.953 | *** | 0.714 | * | 4.252 | *** |
| s.error | (0.422) | - | (0.398) | - | (0.751) | - |
| SQ (SD) | 2.106 | *** | 2.6768 | *** | 2.219 | *** |
| s.error | (0.116) | - | (0.386) | - | (0.244) | - |
| childage x SQ | -0.0578 | * | - | - | - | - |
| s.error | (0.0307) | - | - | - | - | - |
| FIQ x SQ | - | - | - | - | -0.844 | *** |
| s.error | - | - | - | - | (0.176) | - |
| FAQ x SQ | -0.486 | *** | - | - | - | - |
| s.error | (0.086) | - | - | - | - | - |
| Choices | 3573 | - | 576 | - | 1053 | - |
| Individuals | 397 | - | 64 | - | 117 | - |
Robust standard errors in parentheses
significance:*** p<0.01, ** p<0.05, * p<0.1.
9.8 WTP Values from Preferred Specifications: Children
9.8.1 Child WTP values: Food Allergy
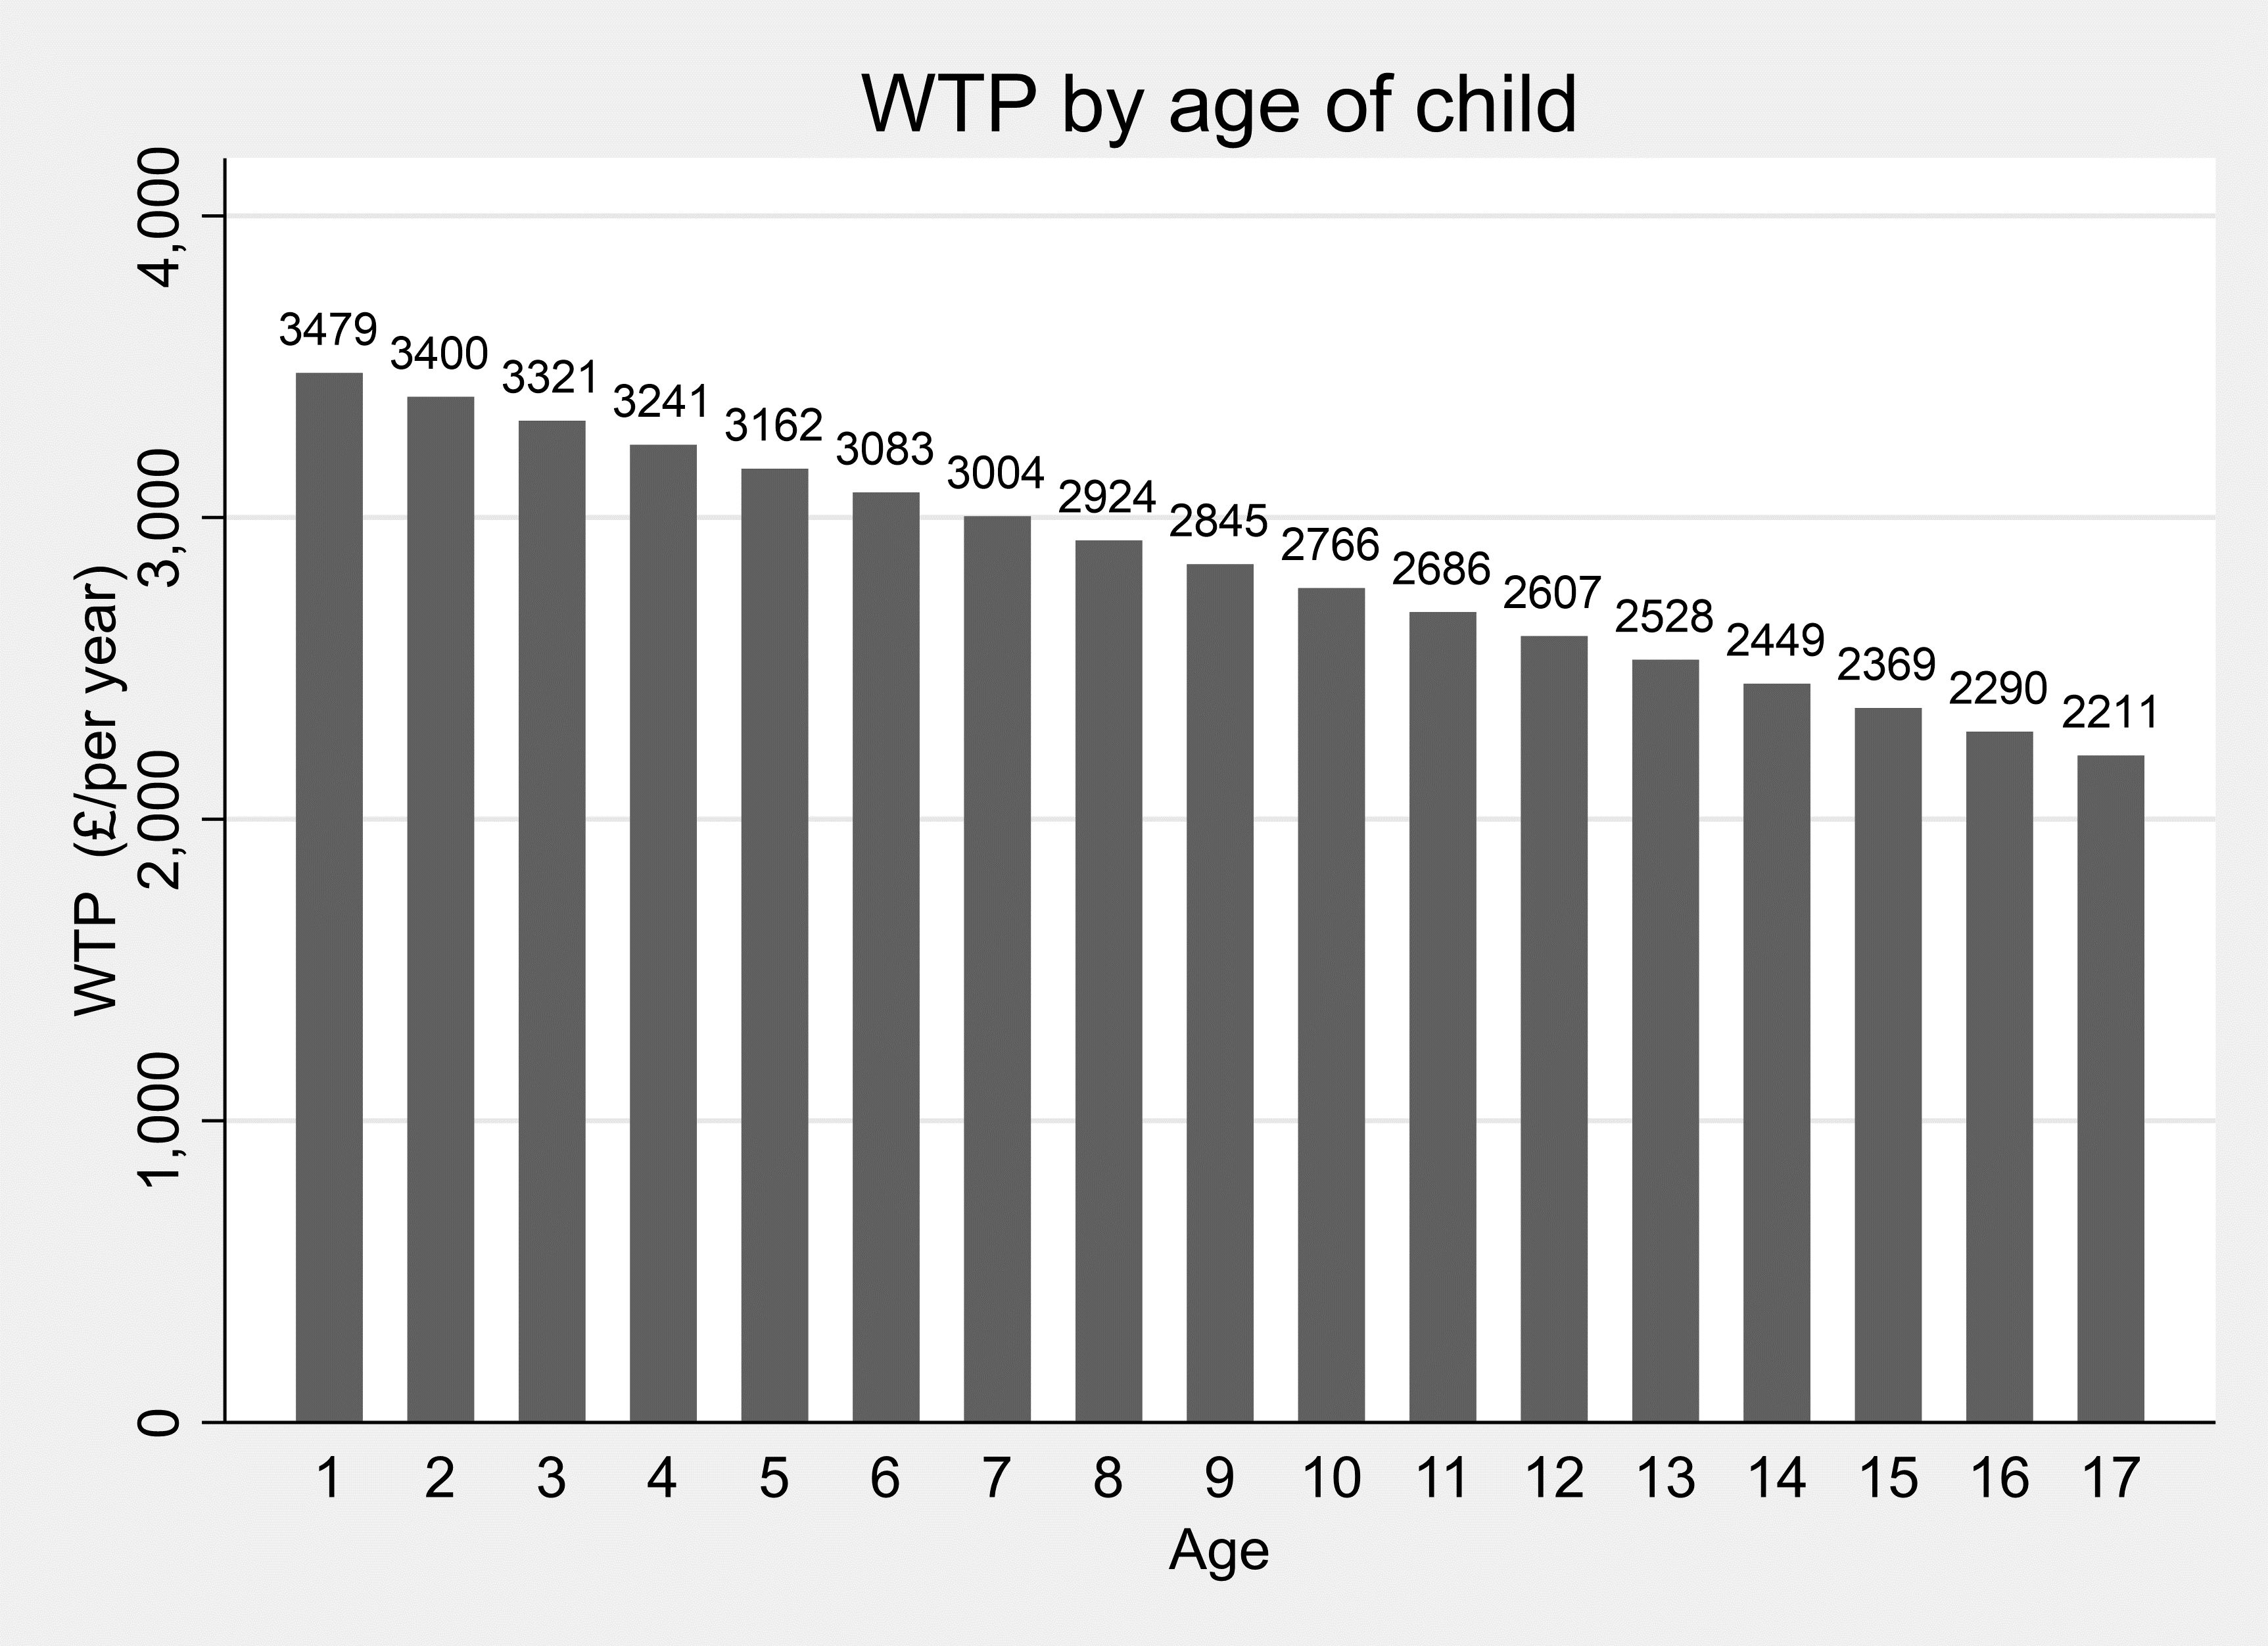
The age of the child with the allergy moderates WTP estimates in the food allergy model – the younger the child the more people are on average prepared to pay per year. The WTP estimates shown in Table 9.16 indicate that for a one-year-old the mean WTP is £3479/ year whilst for a ten-year-old the WTP is £2766/year.
Table 9.16. Child Food Allergies: Marginal WTP for a single year removal, at different ages of the child
| Category | WTP (£/year) | s.error | z | P | 95% CI lower | 95% CI upper |
|---|---|---|---|---|---|---|
| Age=1 | 3479 | 368 | 9.47 | <0.001 | 2759 | 4200 |
| Age=10 | 2766 | 215 | 12.85 | <0.001 | 2344 | 3188 |
| Age=17 | 2211 | 409 | 5.41 | <0.001 | 1410 | 3012 |
Figure 9.4. WTP for one year without food allergy, by age of child
9.8.2 Child WTP values: Coeliac Disease
In the preferred child coeliac disease model (PC2) the severity of the child’s condition, measured via parents scoring on the CCDUX health related QoL instrument, moderates WTP. The greater the disease impacts (the higher the CCDUX score) the higher is WTP for a year without coeliac disease.
The CCDUX score takes values between 12 and 60 (12 items scored 1 to 5). The WTP is not significantly different from zero for children whose CCDUX score is below 36. A CCDUX score of 36 corresponds to a WTP value of £1049. The maximum CCDUX score (60) generates a WTP value of £3366/year. At the sample median CCDUX value of 42, the WTP for a year without the condition is £1628.
Table 9.17. Child Coeliac Disease: Marginal WTP for a year of removal, evaluated at 10th , 50th and 90th percentiles of CCDUX
| Category | WTP (£/year) | s.error | z | P | 95% CI lower | 95% CI upper |
|---|---|---|---|---|---|---|
| CCDUX=29 | 374 | 690 | 0.54 | 0.588 | -978 | 1727 |
| CCDUX=42 | 1628 | 428 | 3.81 | <0.001 | 789 | 2466 |
| CCDUX=53 | 2689 | 671 | 4.01 | <0.001 | 1374 | 4003 |
Figure 9.5. WTP for one year without coeliac Disease, by severity of condition (CCDUX score)
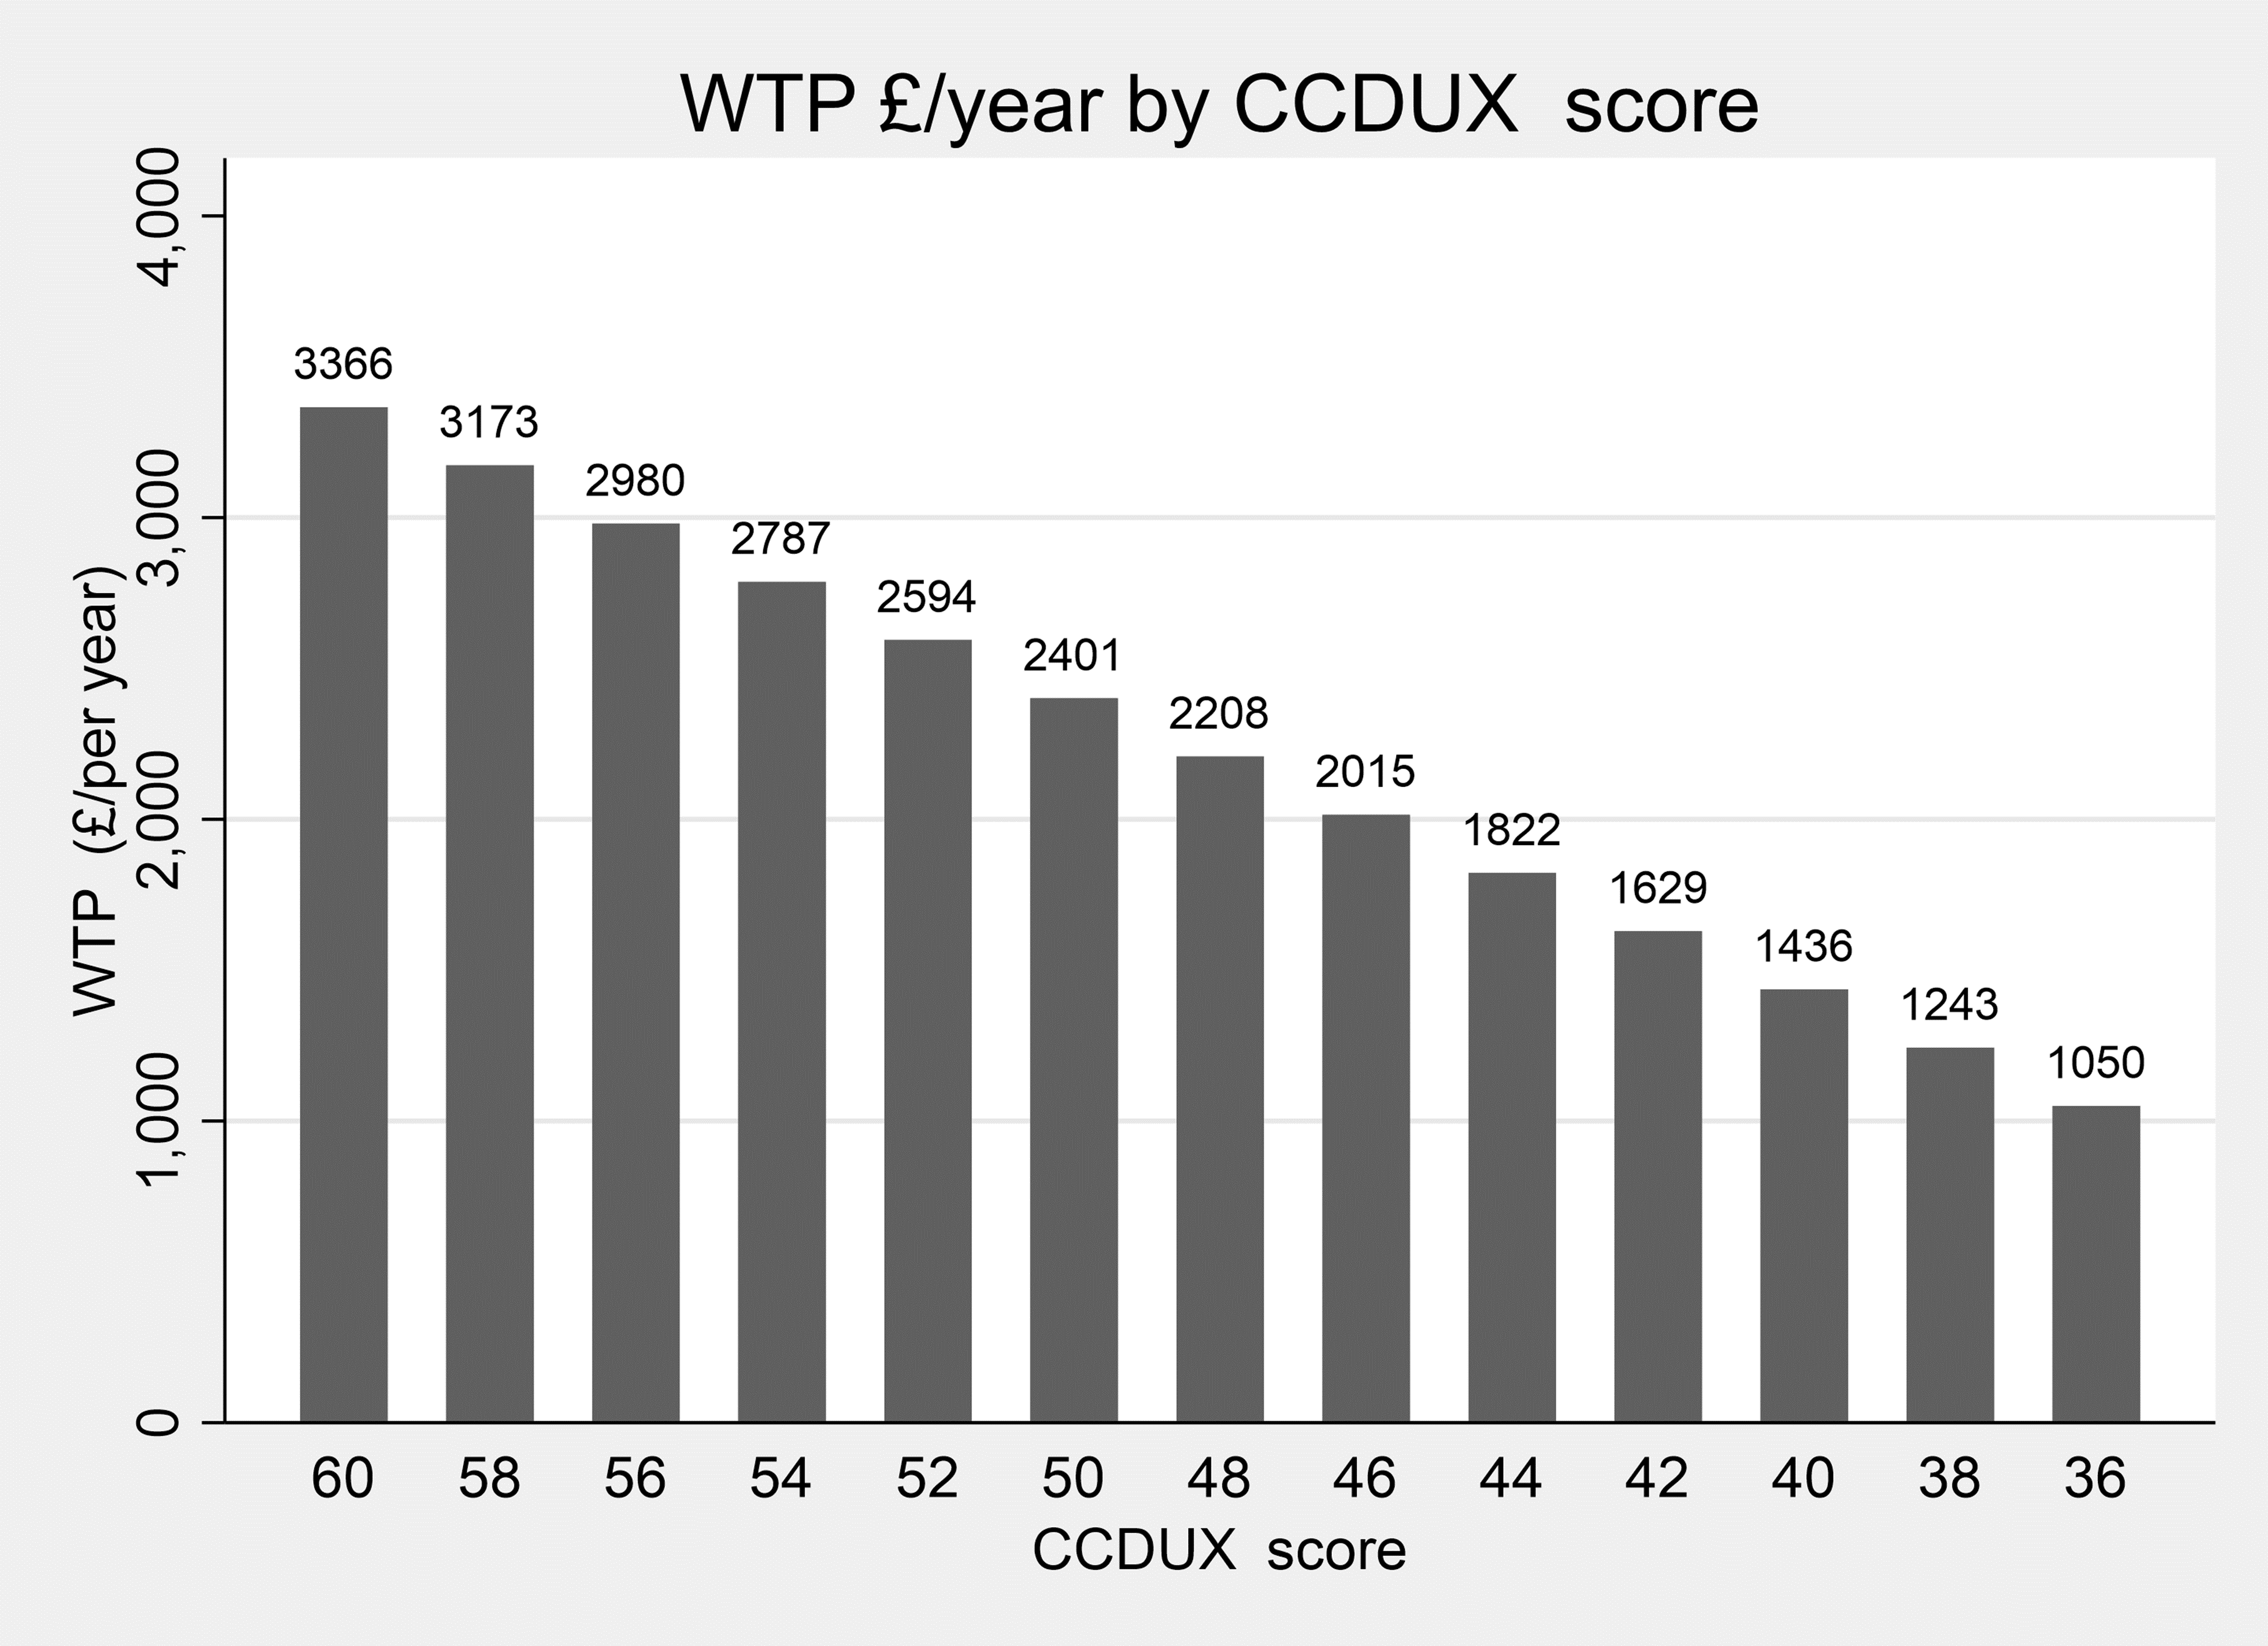
WTP is not significantly different from zero for children whose CCDUX score is below 36, which is evident in Figure 9.5.
9.8.3 Child WTP values: Food Intolerance
There are no effects of child age, or severity of condition (FIQLQ) on WTP values for parents of children with a food intolerance: the WTP value for removal of a child’s food intolerance is £1689/ year.
Table 9.18. Child Food Intolerance: Marginal WTP for a single year removal
| Category | WTP (£/year) | s.error | z | P | 95% CI lower | 95% CI upper |
|---|---|---|---|---|---|---|
| Intolerances | 1689 | 274 | 6.17 | <0.001 | 1153 | 2226 |
The Adult results are summarised in Table 9.19 and the child results in Table 9.20. The results and the uses to which they can be put, in particular in relation to the FSA COI model are discussed in Section 11.
Table 9.19. WTP Summaries, Adult conditions, In Aggregate and Disaggregated by FHS Condition
| Adults | Adult condition | WTP (£/year) |
|---|---|---|
| - | Aggregate | 718 (627-810) |
| Base models | Allergy | 620 (445-795) |
| Base models | Coeliac | 760 (629-891) |
| Base models | Intolerance | 603 (408-797) |
| Preferred models | Allergy | 1064 (596-1532) (for first year) |
| Preferred models | Coeliac | 1342 (975-1710) (for first year) |
|
Preferred models |
Intolerance | 540 (349-731) (at median values of relevant condition score) |
95% CI in parentheses.
Table 9.20. WTP Summaries, Child conditions, In Aggregate and Disaggregated by Condition
| Children | Child condition | WTP (£/year) |
|---|---|---|
| - | Aggregate | 2501 (2195-2807) |
| Base models | Allergy | 2902 (2502-3302) |
| Base models | Coeliac | 1611 (783-2439) |
| Base models | Intolerance | 1695 (1157-2232) |
| Preferred models | Allergy | 2766 (2344-3188) (At child age of 10; WTP = £3479 for a one-year-old child, WTP = £2211 for 17-year-old.) |
| Preferred models | Coeliac | 1628 (789-2466) (at median values of relevant condition score) |
|
Preferred models |
Intolerance | 1689 (1153-2226) |
95% CI in parentheses.
10.1 Overview of BWS research
The Importance Scores derived from estimation of the logit model on the BWS choice data are reported here.
Adult respondents completed the BWS exercise relevant to their condition – identifying the items comprising the FAQLQ, FIQLQ or CDQ which had the least and greatest impact on their quality of life (see example choice sets in Section 3.5).
The relative importance of the varying impacts of FHS were investigated in order to:
- investigate their relative importance (noting that each impact is given equal weight in the construction of the FAQLQ, FIQLQ and CDQ measures);
- aid identification of impacts which are (a) most important to people, and (b) within the FSA’s power to affect.
We now report and discuss the results for the BWS exercises undertaken for three FHS conditions.
In the discussion we focus on the Importance Score associated with each quality-of-life impact derived from logit models estimated on the BWS data. The advantage of Importance Scores (see Appendix E) is that they are ratio scaled - meaning that an item with a score of 6, for example, is regarded by the sample as 6 times more important than an item with a score of 1. This property makes for more intuitive assessment and interpretation of the results (it provides information on the magnitude of the differences in quality-of-life impacts rather than just a ranking).
In the discussion we pay particular attention to labelling and eating out since these are domains over which the FSA has some control. The FSA have responsibility for labelling in relation to allergens in food and have, for example, issued guidance for food businesses, allergen guidance for food business (food.gov) regarding such labelling.
10.2 BWS Results: Food Allergy
The Importance Scores derived from estimation of the logit model on the Allergy BWS choice data are displayed in Table 10.1.
Table 10.1. BWS Importance Scores: Food Allergy (FAQLQ)
| Impact | Mean | 95% lower | 95% upper |
|---|---|---|---|
| the fear of an allergic reaction | 7.20 | 6.93 | 7.47 |
| the fear of an allergic reaction when eating out | 6.85 | 6.59 | 7.11 |
| the trouble from always being alert as to what you are eating | 6.64 | 6.38 | 6.89 |
| the fear of accidentally eating the wrong food | 6.04 | 5.77 | 6.30 |
| the worry that the allergic reactions to foods will become increasingly severe | 5.71 | 5.40 | 6.03 |
| the trouble from having to personally check if you can eat something when eating out | 4.70 | 4.43 | 4.97 |
| the trouble from people underestimating the problems caused by your allergy | 4.62 | 4.33 | 4.91 |
| the apprehension you feel about eating something you’ve never eaten before | 4.36 | 4.15 | 4.57 |
| the trouble from having to hesitate eating a product when you doubt it | 4.20 | 4.02 | 4.38 |
| the trouble from the feeling that you have less control when eating out | 4.08 | 3.87 | 4.29 |
| the trouble from product ingredients changing | 3.77 | 3.56 | 3.97 |
| the discouragement you feel during an allergic reaction | 3.58 | 3.35 | 3.81 |
| the trouble from labels stating: “may contain (traces of)….” | 3.39 | 3.08 | 3.71 |
| the feeling of being a nuisance when eating out | 3.38 | 3.08 | 3.68 |
| the worry about your health | 3.08 | 2.83 | 3.33 |
| the trouble from having to explain that you have a food allergy | 2.84 | 2.57 | 3.10 |
| the trouble from labels being incomplete | 2.72 | 2.50 | 2.93 |
| the trouble from being less able to taste or try products when eating out | 2.46 | 2.26 | 2.66 |
| the trouble from being able to eat fewer products | 2.27 | 2.02 | 2.53 |
| the trouble from being limited as to the products you can buy | 2.20 | 1.98 | 2.43 |
| the trouble from being less able to spontaneously accept an invitation | 2.17 | 1.95 | 2.40 |
| the trouble from having to refuse many things during social activities | 2.16 | 1.98 | 2.34 |
| the trouble for your hosts should you have an allergic reaction | 2.13 | 1.95 | 2.31 |
| the trouble from sometimes frustrating people | 2.06 | 1.86 | 2.27 |
| the trouble from it being unclear to which foods you are allergic | 2.02 | 1.79 | 2.25 |
| the trouble from ingredients being different in other countries | 1.81 | 1.60 | 2.01 |
| the trouble from having to read labels | 1.45 | 1.25 | 1.65 |
| the trouble from lettering on labels being too small | 1.21 | 1.03 | 1.40 |
| the trouble from eating out less | 0.90 | 0.79 | 1.01 |
It is apparent from the Importance Scores displayed in Table 10.1 and in Figure 10.1 that there is great variation in the relative importance that the sample attach to the components of the FAQLQ. This contrasts with the equal weight the items are given in the calculation of the index.
The most important item (the fear of an allergic reaction) is 8 times as important as the least important impact (the trouble from eating out less).
The fear of having an allergic reaction when eating out is the second most important aspect of living with a food allergy. The impact of this on people’s quality of life is more than 3 times as great as the trouble people experience from it being unclear as to which foods they are allergic, and over 7 times as important as the trouble from eating out less.
The reactions and understanding of other people are also relatively important to people with food allergies - the trouble from people underestimating the problems caused by your allergy is twice as great as that from it being unclear as to which foods people are allergic.
Three of the 10 most important quality of life effects (ranked 2nd, 6th 10th) concern eating out:
- the fear of an allergic reaction when eating out
- the trouble from having to personally check if you can eat something when eating out
- the trouble from the feeling that you have less control when eating out
In contrast ‘the trouble from eating out less’ was ranked bottom of the 29 quality of life effects.
Quality of life impacts concerning labels were ranked 13th, 17th, 27th and 28th of the 29 effects:
- the trouble from labels stating: “may contain (traces of)….”
- the trouble from labels being incomplete
- the trouble from having to read labels
- the trouble from lettering on labels being too small
Figure 10.1. BWS Importance Scores: Food Allergy (FAQLQ)
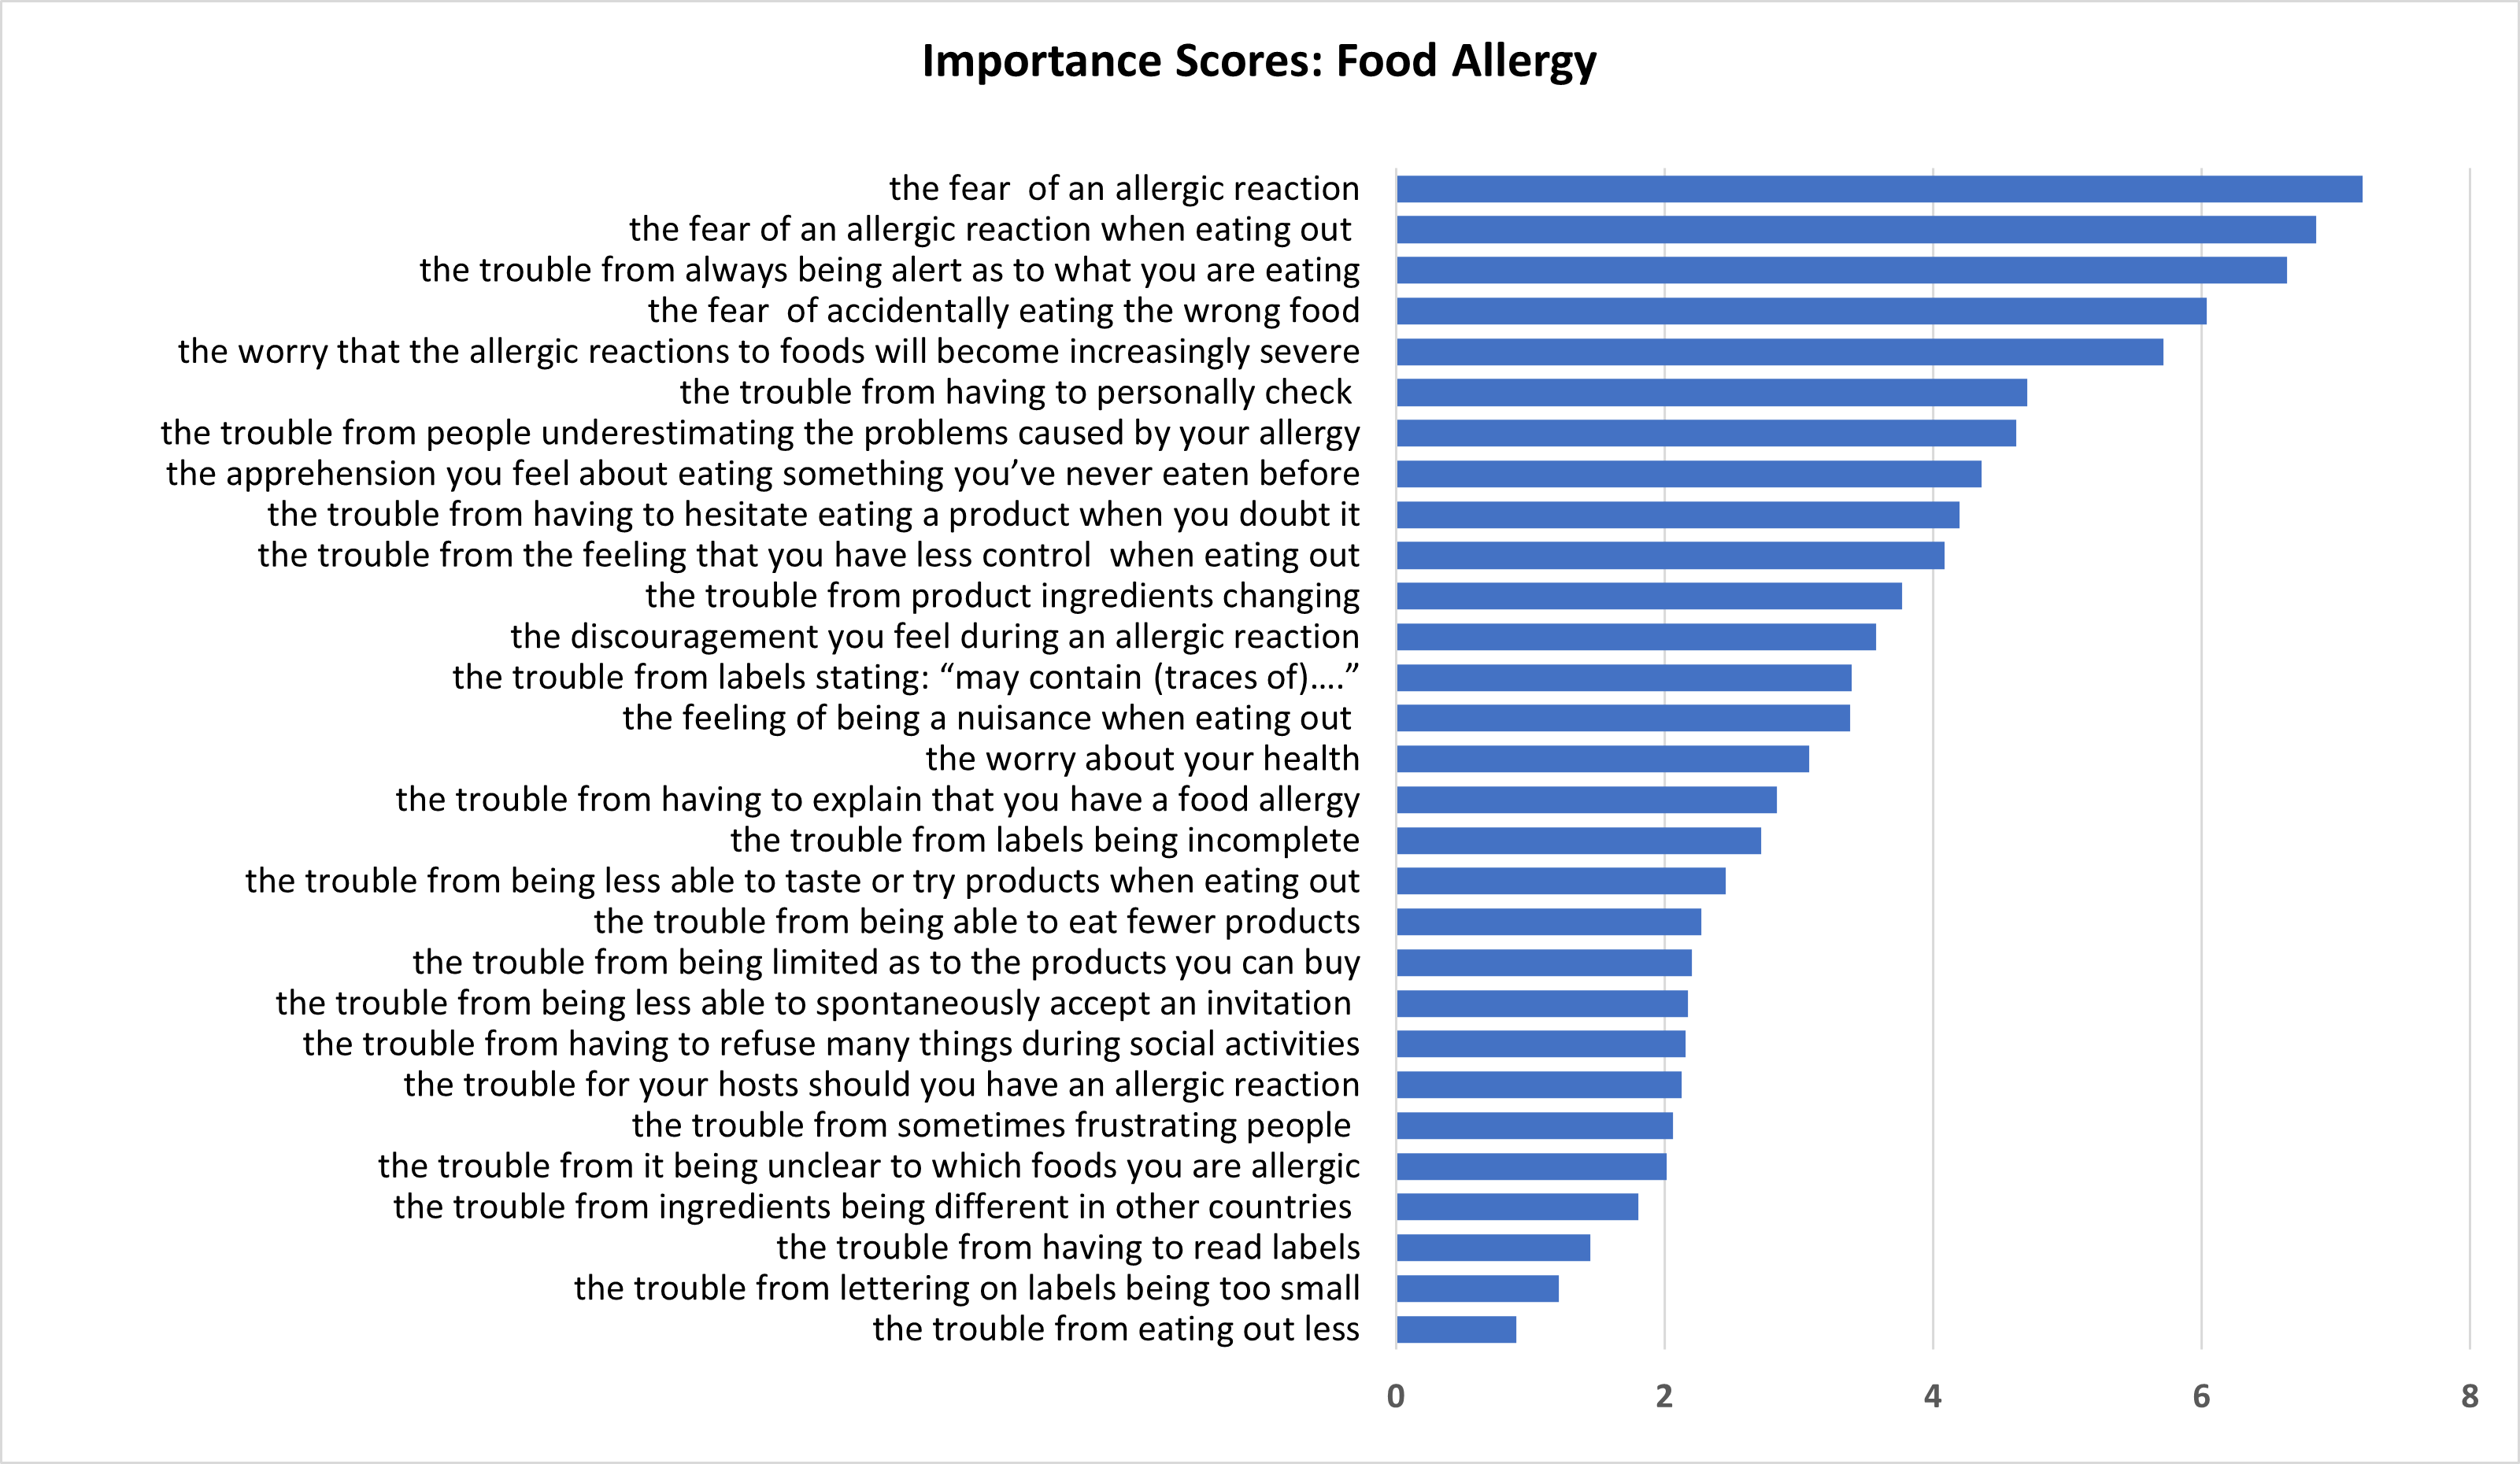
10.3 BWS Results: Food Intolerance
The Importance Scores derived from estimation of the logit model on the Food Intolerance BWS choice data are displayed in Table 10.2.
Table 10.2. BWS Importance Scores: Food Intolerance (FIQLQ)
| Impact | Mean | 95% lower | 95% upper |
|---|---|---|---|
| the worry that you experience physical distress because of symptoms during a reaction | 10.65 | 10.15 | 11.16 |
| the trouble from having to always be alert as to what you are eating | 9.15 | 8.78 | 9.53 |
| the worry that you will be embarrassed by the symptoms of a reaction in social situations | 9.00 | 8.40 | 9.59 |
| the worry about the impact on your health | 7.66 | 7.16 | 8.16 |
| the discouragement you feel during an intolerant reaction | 7.27 | 6.79 | 7.74 |
| the trouble from having to be cautious about eating a product when you have doubts about it | 6.82 | 6.58 | 7.06 |
| the trouble from having to personally check whether you can eat something when eating out | 6.03 | 5.61 | 6.44 |
| the trouble from people underestimating the impact of food intolerance | 5.46 | 5.02 | 5.91 |
| the trouble from feeling that you have less control of what you eat when eating out | 4.96 | 4.72 | 5.19 |
| the feeling of being a nuisance when eating out because you have a food intolerance | 4.90 | 4.41 | 5.40 |
| the concern you feel about eating something you have never eaten before | 4.40 | 4.14 | 4.66 |
| the trouble from having less variety in the products that you can buy | 4.10 | 3.66 | 4.53 |
| the trouble from having less variety in the food that you can eat | 4.03 | 3.58 | 4.48 |
| the trouble from being less able to spontaneously accept an invitation to stay for a meal | 3.86 | 3.45 | 4.27 |
| the trouble from the ingredients of a product changing | 3.84 | 3.54 | 4.15 |
| the trouble from the quality and clarity of labelling is poor, in general | 3.30 | 2.96 | 3.64 |
| the trouble from being less able to taste or try various foods when eating out | 3.19 | 2.92 | 3.47 |
| the trouble from having to read labels | 1.37 | 1.15 | 1.60 |
As with the results from the Food Allergy BWS, there is great variation in the relative importance of the quality-of-life impacts included in the CDQ instrument.
The impact which people regarded as having the greatest effect on their quality of life (the worry that you experience physical distress because of symptoms during a reaction) is 7.8 times more important to them than the lowest ranked impact (the trouble from having to read labels).
The worry that one will be embarrassed by the symptoms of a reaction in social situations is the 3rd most important impact; it is more than 2.5 times as important as the trouble from other people underestimating the impact of food intolerance.
The effect of people underestimating the impact of one’s food intolerance is the 8th most important item (out of 18) and is 1.7 times as important as the trouble from the quality and clarity of labelling being poor.
The 4 items explicitly concerned with eating out:
- the trouble from having to personally check whether you can eat something when eating out
- the trouble from feeling that you have less control of what you eat when eating out
- the feeling of being a nuisance when eating out because you have a food intolerance
- the trouble from being less able to taste or try various foods when eating out
were ranked 7th, 9th 10th and 17th respectively in terms of their impact on quality of life.
The two impacts concerning labels were ranked in the bottom three of quality of life effects:
- the trouble from the quality and clarity of labelling is poor, in general
- the trouble from having to read labels
Figure 10.2. BWS Importance Scores: Food Intolerance (FIQLQ)
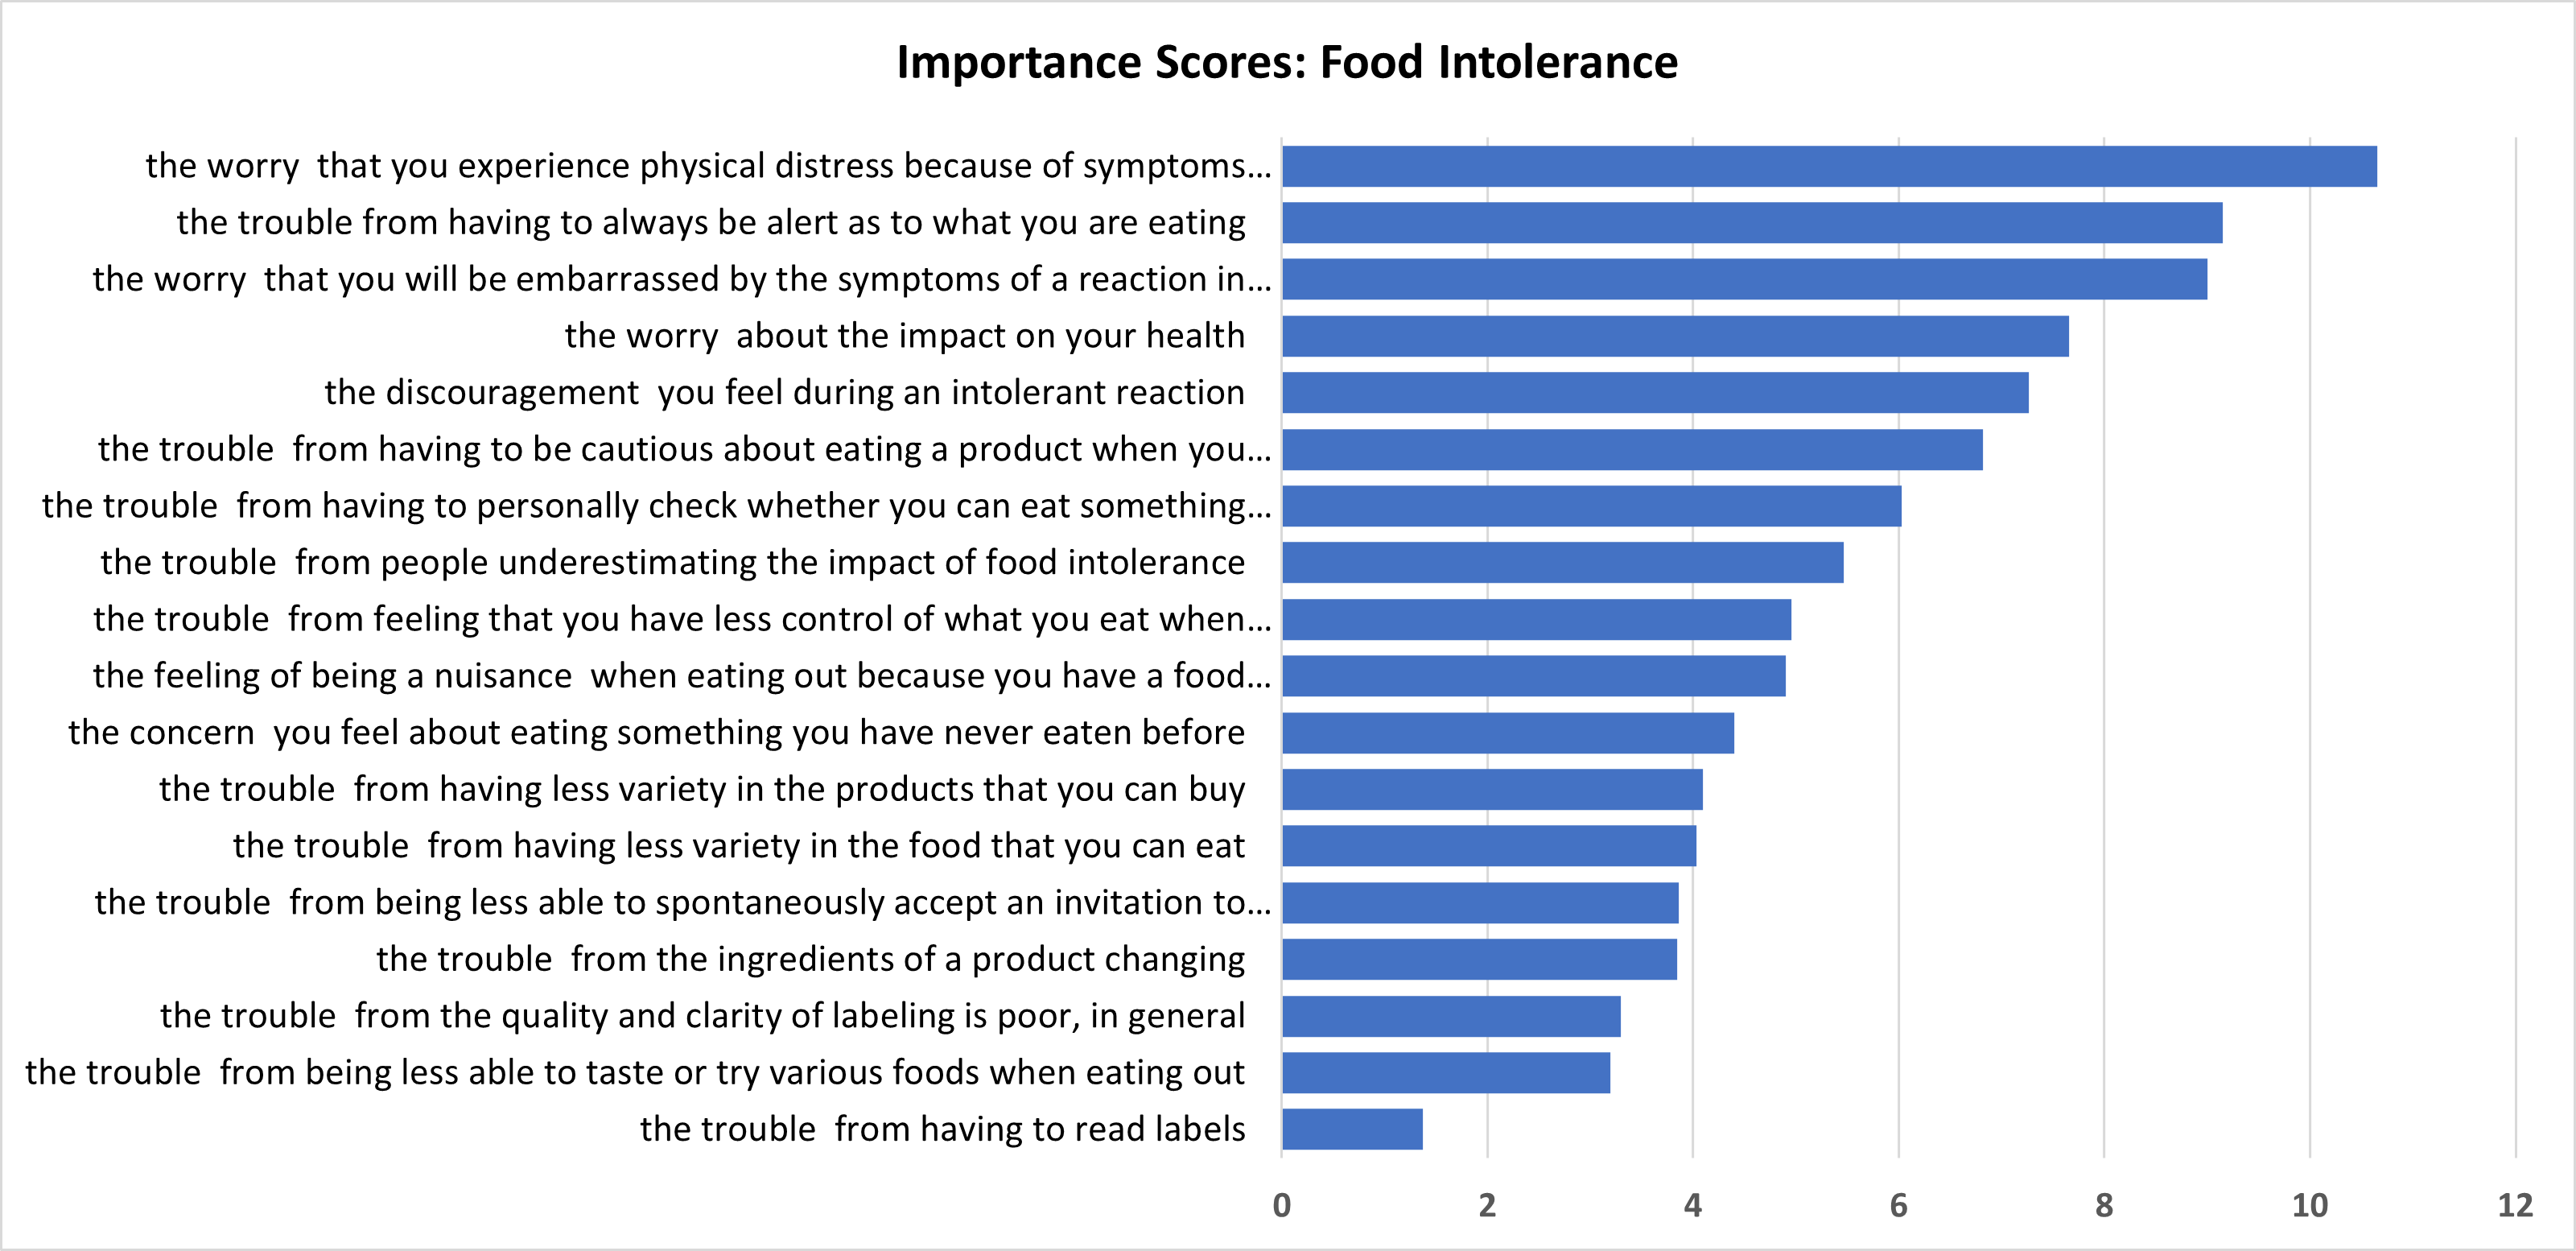
10.4 BWS Results: Coeliac Disease
The Importance Scores derived from estimation of the logit model on the Coeliac coeliac Disease disease BWS choice data are displayed in Table 10.3.
Table 10.3: BWS Importance Scores: Coeliac Disease (CDQ)
| Impact | Mean | 95% lower | 95% upper |
|---|---|---|---|
| feeling afraid to eat out because my food may be contaminated | 10.442 | 10.125 | 10.759 |
| the concern that my long-term health will be affected | 9.201 | 8.812 | 9.589 |
| the concern that this disease will cause other health problems | 9.133 | 8.739 | 9.527 |
| the difficulty of traveling or taking long trips because of my disease | 8.823 | 8.432 | 9.214 |
| feeling limited by this disease | 8.390 | 8.049 | 8.732 |
| feeling I cannot live a normal life because of my disease | 6.752 | 6.376 | 7.128 |
| the trouble I have socializing because of my disease | 6.565 | 6.180 | 6.950 |
| the worry about an increased risk of cancer from this disease | 6.340 | 5.921 | 6.760 |
| feeling limited in eating meals with co workers | 5.767 | 5.387 | 6.146 |
| feeling there are not enough choices for treatment | 4.965 | 4.645 | 5.285 |
| the worry about increased risk of family members having coeliac disease | 4.745 | 4.385 | 5.105 |
| feeling unable to have special foods like birthday cake and pizza | 3.847 | 3.487 | 4.208 |
| the worry that I will suffer from this disease | 3.650 | 3.410 | 3.889 |
| feeling I think about food all the time | 3.408 | 3.095 | 3.721 |
| feeling socially stigmatized for having this disease | 3.239 | 2.920 | 3.558 |
| feeling depressed because of my disease | 1.779 | 1.574 | 1. |
| feeling overwhelmed about having this disease | 1.181 | 1.065 | 1.297 |
| feeling I don't know enough about the disease | 1.144 | 1.000 | 1.287 |
| feeling frightened by having this disease | 0.629 | 0.549 | 0.710 |
The range of importance of the items in the CDQ measure of QoL is the greatest of the 3 condition-specific scales: the most important item (feeling afraid to eat out because my food may be contaminated) is more than 16 times as important to people with coeliac disease than the lowest ranked impact (feeling frightened by having this disease).
Indeed, four of the five lowest ranked items concern the psychological impacts of having the condition: feeling socially stigmatized, depressed, overwhelmed, or frightened by having coeliac disease.
No impacts relating to labels are included in the CDQ. There is only one item explicitly concerning eating out (feeling afraid to eat out because my food may be contaminated), and it has the greatest impact on quality of life.
Figure 10.3. BWS Importance Scores: Coeliac coeliac Disease (CDQ)
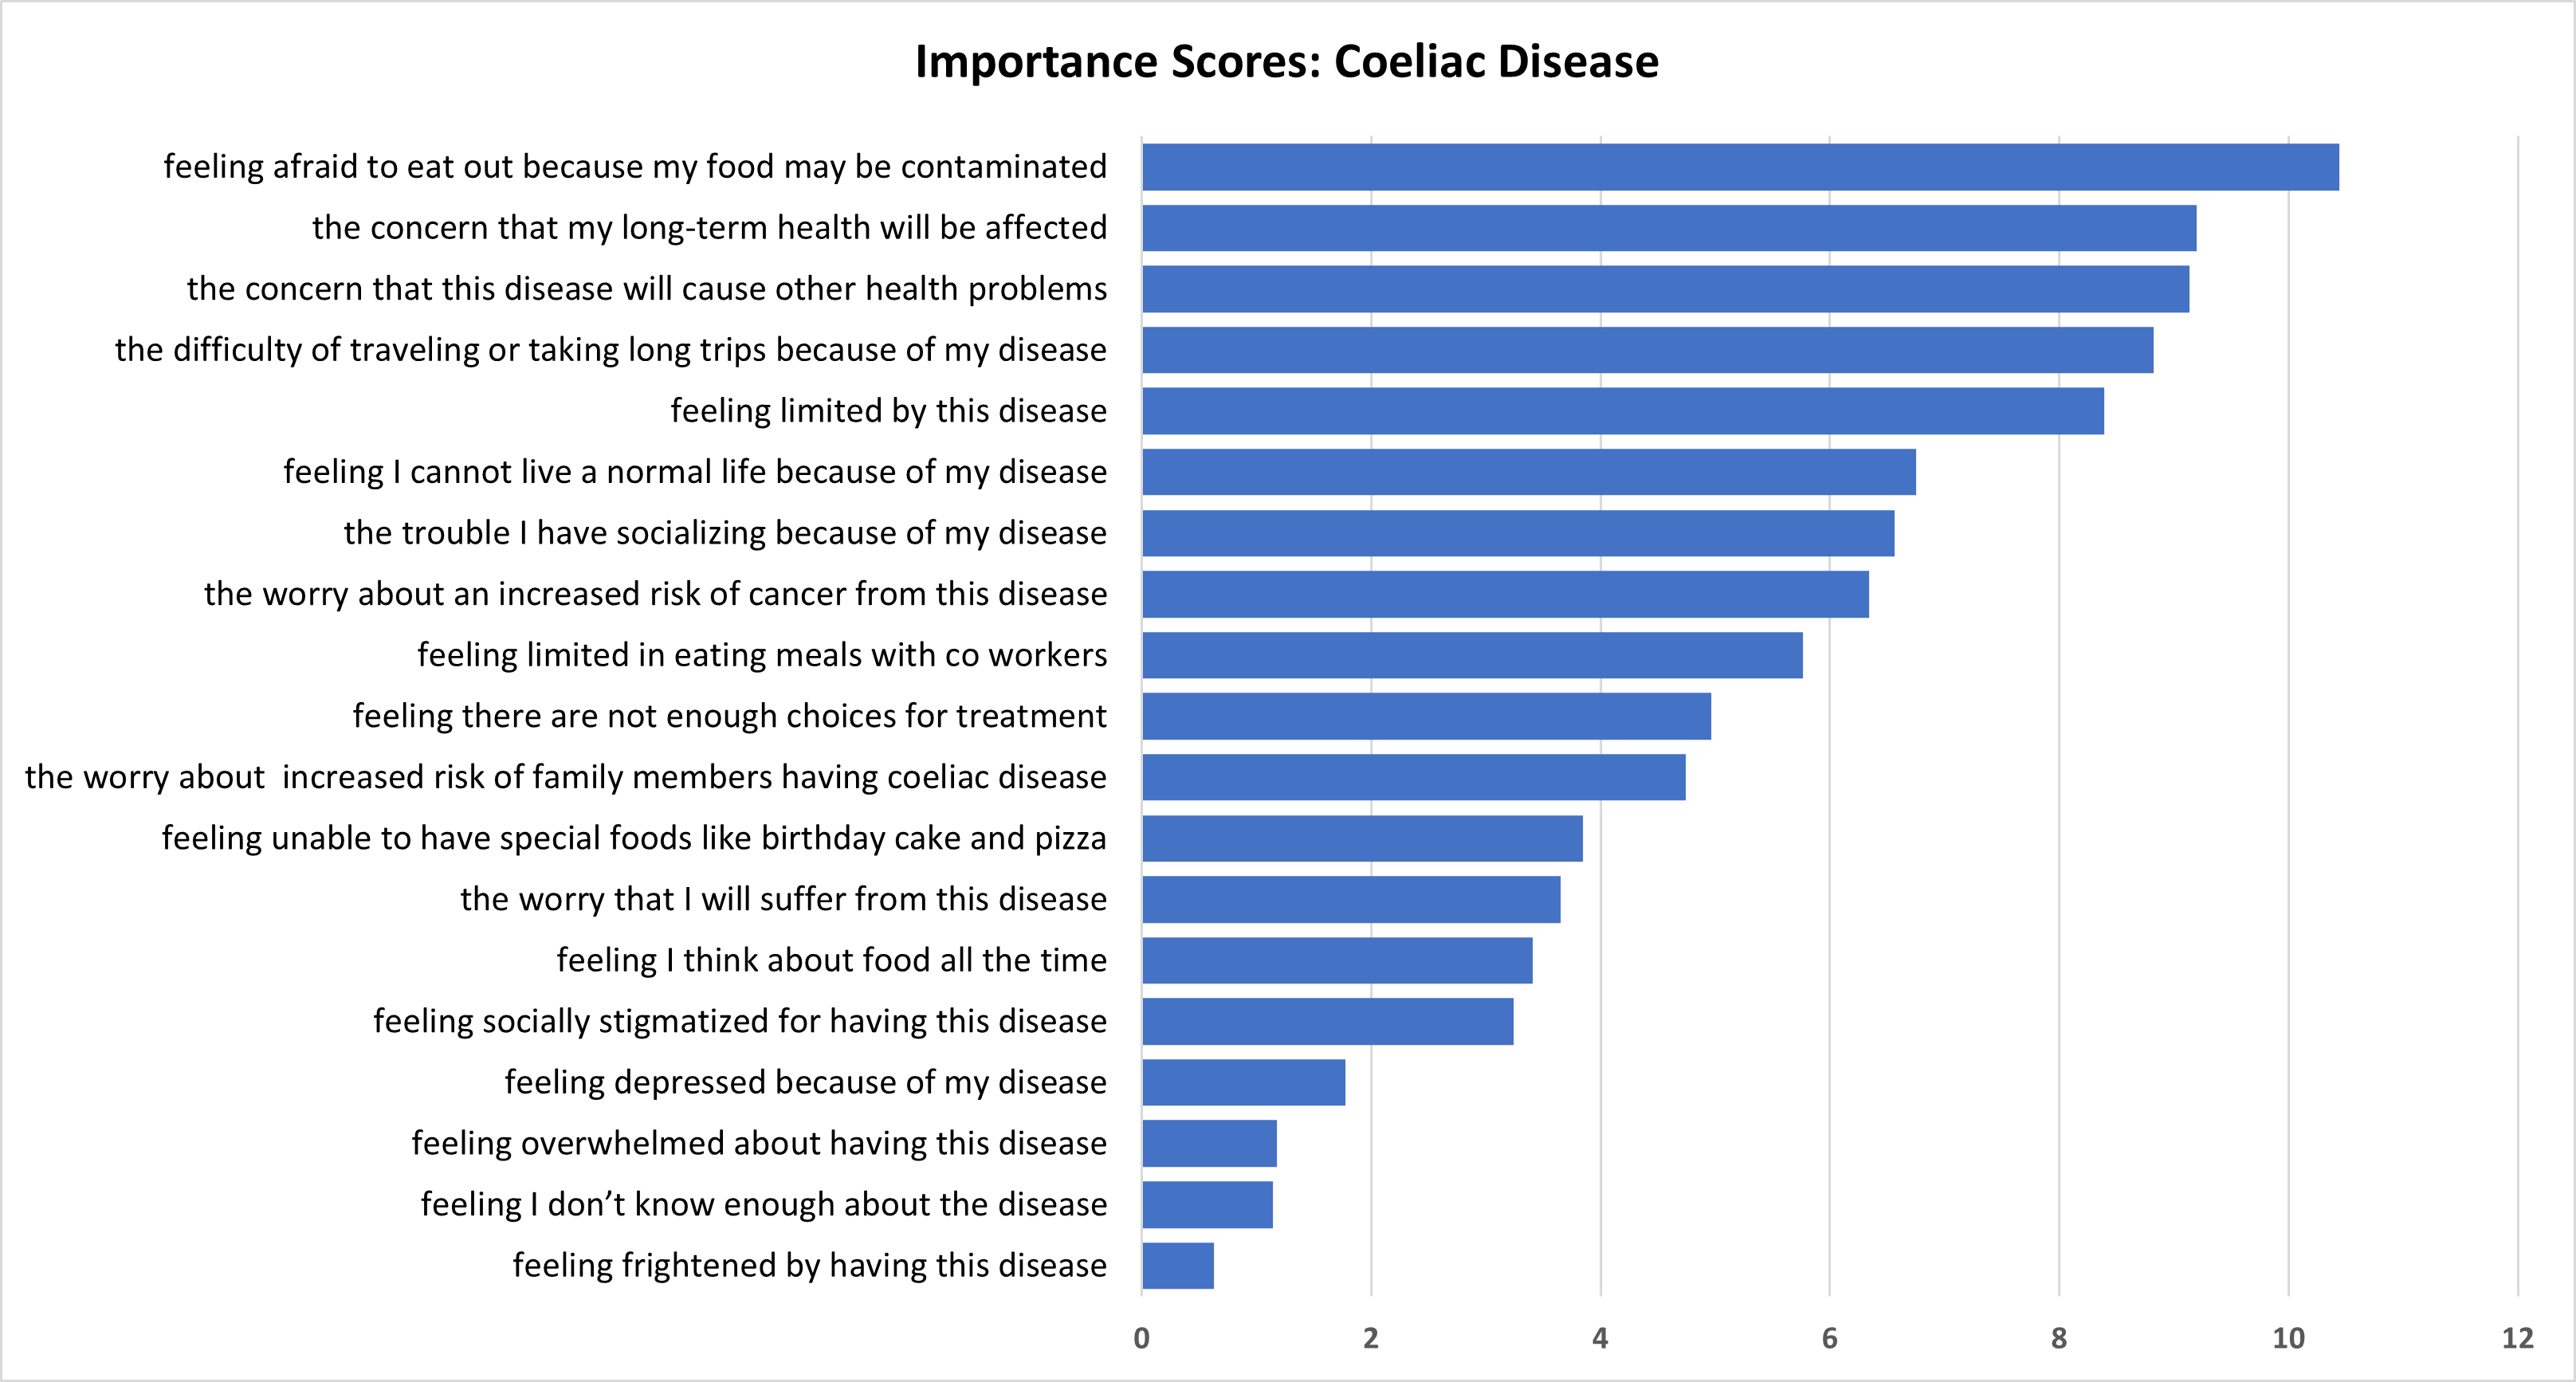
National online surveys were conducted with adults who had a food allergy, food intolerance or coeliac disease or were parents/carers of children with one or more of those conditions.
The impact of food hypersensitivities on respondent’s ( or respondents child’s) health and quality of life were captured at the individual level via a number of generic and condition specific measures, including:
1. EQ5D-5L and EQ-VAS for adults
2. EQ5D-3L (proxy) and EQ-VAS for children
3. Condition-specific measures for food allergy, food intolerance and Coeliac coeliac disease for adults:
- Food Allergy Quality of Life Questionnaire, FAQLQ (FAQLQ-PF/FAQLQ-PFT for children)
- Food Intolerance Quality of Life Questionnaire, FIQLQ (FIQLQ-PF for children)
- Coeliac Disease Quality of Life Questionnaire, CDQ (CCDUX for children)
4. Scoring of EQ5D-5L and EQ5D-3L (proxy) and EQ-VAS contingent upon their food hypersensitivity being removed.
These data represent the impacts of food hypersensitivities on health and quality of life. In addition, they are included in the WTP choice models to investigate if, and how, the value of removal of food hypersensitivities is affected by the severity of those conditions.
11.1 DCE Valuation Instrument
A stated preference valuation instrument was developed to allow estimation of WTP for a year’s removal of the symptoms and limitations of a food hypersensitivity. The instrument was a DCE using a full factorial experimental design over two attributes: duration of FHS removal and cost.
A pill, taken once, was specified as the means of temporarily removing the food hypersensitivity. Attributes and their levels were represented graphically in the DCE to increase engagement and reduce cognitive load. The valuation tasks were tested and refined in five focus groups which yielded useful feedback but to a large extent validated the approach and the valuation instrument.
11.2 BWS Instrument
The condition-specific QoL measures (FAQLQ, FIQLQ, CDQ) comprise multiple impacts which people score, using Likert scales, to indicate how much each impact affects them. The FAQLQ, FIQLQ and CDQ indices constructed from those scores give an equal weight to each impact.
The relative importance of the impacts comprising the FAQLQ, FIQLQ and CDQ instruments were elicited by including them in a Best Worst Scaling (BWS) exercise in the survey. BWS involves presenting repeated subsets of the full set of ‘items’ (in this case, FHS impacts) and respondents select the impacts which have the greatest and least impact on their quality of life. The technique provides a ranking and estimates of how much more or less important those quality of life impacts are.
11.3 DCE Results
The extent to which respondents reject the premise of the valuation task is an important indicator of the validity of the valuation instrument and the economic values derived from it.
We find low levels of protest behaviour for those who complete the DCE choice sets. There are, however, larger numbers who decline even free removal of their FHS for periods up to 20 years and hence were not presented with DCE choice sets. These people require longer periods (> 20 years) of temporary removal, or permanent removal, or would decline even permanent removal of their (child’s) food hypersensitivity. This is a new and important research finding.
For all conditions and in aggregate, for both Adult and Child models, we find statistically significant effects of duration of FHS removal and cost of removal on choice probabilities – this is consistent with most people making the trade-offs envisaged when designing the DCE.
Based on the analysis of the DCE results, the average WTP for the removal of an adult’s FHS for a year, pooled across all conditions was £718. For models estimated separately by condition, the WTP values for food allergy, Coeliac coeliac disease and food intolerance were £1064, £1342 and £540 respectively.
Statistical tests were conducted to identify whether self-assessments of FHS impact (FAQLQ, FIQLQ, CDQ) affected WTP. In the adult allergy and intolerance models we find robust evidence of effects of condition severity on WTP – the higher people’s FAQLQ and FIQLQ scores, the more they are willing to pay to remove their food hypersensitivity.
In these adult food allergy and food intolerance models the WTP values were only significantly different from zero when the condition severities (FAQLQ and FIQLQ scores) are sufficiently severe. For both conditions, the WTP estimates are significantly different from zero at the median FAQLQ and FIQLQ scores.
In contrast to the food allergy and food intolerance results, no effect of variation in the CDQ score on WTP to remove the condition was identified in the adult Coeliac coeliac disease sample.
The DCE choice tasks offered, at a cost, FHS removal for various durations (1 to 20 years). This was in part required because the focus groups indicated that a significant minority of people with a FHS would decline a single year of removal of their FHS, because of the ‘cost’ of having to adjust to their FHS returning one year later. The use of varying durations of FHS removal permitted testing for non-linearity in the value of additional years of FHS-absence.
These tests in the choice models estimated on the DCE data indicated that the value of additional years without the FHS declined in the adult Coeliac coeliac and Allergy models. There was no decline in the value of additional years in the adult food Intolerance model. The decline in the value of additional years free of their FHS could be the result of declining marginal utility or positive discount rates, or both.
In models estimated on DCE data from parents regarding their children’s FHS conditions, the WTP values were: £27662902 for food allergy; £162811 for coeliac disease; £168995 for food intolerance. Parents’ WTP for children with a food allergy is significantly higher than the case for the other two conditions – this ordering is intuitive given the potentially fatal impacts of an allergic reaction.
Table 11.1. WTP Results, in Aggregate and by Condition, for Adults and Children
| Models | Type of condition | WTP, Adults (£/year) | WTP, Children (£/year) |
|---|---|---|---|
| Aggregate Models | - | 718 | 2501 |
| Models by condition | Allergy | 1064 | 2766 |
| Models by condition | Coeliac | 1342 | 1628 |
| Models by condition | Condition | 540 | 1689 |
The WTP for removal of a child’s condition is greater than the corresponding WTP values for adults, in aggregate and for the 3 conditions separately, by a factor of between 1.2 and 3.1.
These differences in magnitude do not mean that the impacts of FHS are clinically more severe in children than adults. These WTP values are subjective valuations.
As with the adult samples, we test in the child models for the effects of FHS-severity on WTP and for declining value of additional years. In addition we test for the effects of the child’s age on WTP – a plausible effect since younger children are less able to control what they consume and so may be regarded as more at risk of an adverse event.
In the child models we find evidence of WTP values being moderated by FHS- severity in only the coeliac model - the more severe the condition (as scored by the parent) the greater the WTP value of years of disease removal.
In the child allergy and intolerance models the FAQLQ and FIQLQ scores affect the degree of aversion to moving away from the status quo option – the more severe the condition impacts the less averse people are to taking the pill to remove their condition. But the FAQLQ and FIQLQ scores do not affect the WTP value.
We find no evidence of declining WTP for additional years without the condition for children. We do however identify an effect of the child’s age on WTP in the child food allergy model – the WTP value declines with the child’s age.
11.4 BWS Results
The BWS results indicate that people assign very different levels of importance to the impacts comprising the FAQLQ, FIQLQ and CDQ instruments. For example, in the adult allergy results on the impacts on quality of life, the most important impact included in the FAQLQ (the fear of an allergic reaction) is 8 times more important than the least important FAQLQ impact (the trouble from eating out less). This unequal prioritisation contrasts with the equal weighting used when constructing the FAQLQ, FIQLQ and CDQ measures.
Concerns related to eating out were top ranked for people with coeliac disease and ranked second for people with a Food Allergy. The trouble associated with reading labels was ranked least or near least important by people with food allergies and food intolerances.
The three impacts which were indicated to have the greatest impacts on people’s quality of life, for each condition, are shown in Table 11.2. Embarrassment or fear related to eating out or /social situations feature in the top three impacts for all the conditions.
Table 11.2. FHS impacts with greatest effect on quality of life, by condition, from BWS results
Food Allergy
1. The fear of an allergic reaction
2. the fear of an allergic reaction when eating out
3. the trouble from always being alert as to what you are eating
Coeliac Disease
1. feeling afraid to eat out because my food may be contaminated
2. the concern that my long term health will be affected
3. the concern that this disease will cause other health problems
Food intolerance
1. the worry that you experience physical distress because of symptoms during a reaction
2. the trouble from having to always be alert as to what you are eating
3. the worry that you will be embarrassed by the symptoms of a reaction in social situations
11.5 Limitations
The sample sizes were sufficient for the estimation of statistically significant effects of duration of FHS-removal and cost. However, it should be noted that the sample of parents of children with coeliac disease was small (73 people) and not all of those completed the choice sets (having been filtered out because of their choice behaviour in the training or priced choice sets). The sample was recruited from 3 pools, and attempts were made to increase the sample size (by for example offering additional inducements) – this did result in increases in the sample, but the parents of children with coeliac disease proved hard to recruit. Further augmentation of that sample would further increase confidence in the results derived from estimation of choice models of the form presented here.
An evaluation of whether the samples are representative of the UK populations of people with food allergies, intolerances and coeliac disease is not possible because of the absence of UK data on the prevalence of those conditions. This is a limitation of the study. Reliable prevalence data would allow an assessment of representativeness and potentially the use of weights to aggregate from the sample to the population.
The estimated WTP values are for the removal of the condition (for a specified period). Respondents were not asked to mentally partition the value of pain, suffering and anxiety from other aspects, such as the savings (in time and money) that removal of their (child’s) FHS would generate. As such, the WTP values estimated here are an aggregate value, including inter alia the expected financial savings.
11.6 Recommendations
This research aimed to:
A. estimate the economic value to people of removing the symptoms and limitations of their food hypersensitivities.
B. identify the impacts of living with food hypersensitivity which most affect people’s quality of life.
Regarding (A), the WTP models estimated have been designed to provide an estimate of the economic value to people with a food hypersensitivity of a year without their condition. The estimated WTP values encompass the pain, suffering, anxiety as well as the cost and inconvenience imposed by food hypersensitivities.
The magnitude of estimated WTP values seem plausible, as is the finding that the WTP of parents regarding their children was greater than the WTP of adults about themselves.
Confidence in the validity of the results is increased by the feedback in the focus groups, the low rates of rejection of the DCE valuation scenario and the assessment of the difficulty in understanding and making the choices in the DCE.
One of the motivations of the research was to provide WTP values which could be used to extend the FSA’s Cost of Illness (COI) model from its current focus on foodborne disease to include the costs of food hypersensitivities.
The COI model currently includes the tangible (private medical expenditures and costs to the NHS, loss of earnings and costs to business) and intangible costs (pain, grief and suffering) caused by foodborne disease. It generates estimates of the annual burden to society from foodborne to facilitate assessment of cost effectiveness of food safety policy interventions, impact assessments and evaluation.
Extending the model to incorporate food hypersensitivity values requires an annual monetary value of the burden associated with FHS. The model can accommodate values disaggregated by the three conditions included in this study, and whether a ‘case’ is an adult or a child.
Identifying the appropriate WTP values to use in the COI model from the models reported above requires some explanation given that the estimated models:
- are based on a DCE in which the period of FHS removal ranged from 1 to 20 years.
- include a Status Quo ASC for which a WTP can be estimated in addition to the WTP per year of FHS removal
- include (in some preferred specifications):
- declining marginal value of additional years without FHS
- measures of FHS-severity
- age of child
The use of varying levels of FHS removal in the DCE was necessary because of the finding from the focus groups (Section 6) that for important numbers of respondents the adjustment ‘costs’ associated with removing the FHS for a single year, and then having it return, were large enough to decline that one-year removal. Even at zero cost.
This preference to reject zero-cost removal of the FHS for short periods of time is a manifestation of the costs of adjustment (associated with short term FHS removal) exceeding the benefits of removal. Hence the DCE design included varying and, in some cases, long, durations (up to 20 years). Although choices will still be affected by respondents’ perception of adjustment costs, an annual value can be estimated, partitioned from those adjustment costs.
That partitioning is achieved by the inclusion, in the models estimated to yield WTP, of the Alternative Specific Coefficient (ASC), associated with not choosing the pill.
In the models estimated people, on average, have a positive preference for the Status Quo (SQ). As such they have a positive WTP to avoid change – to avoid taking the pill to remove the FHS. This WTP can be estimated (See Appendix D).
This is not the case for the COI model. The WTP for the SQ represents the value associated with avoiding change in condition, whereas the COI model is concerned with costs of ongoing conditions. If, in contrast, one was interested in evaluating the market potential for a treatment that did indeed deliver relief from the FHS then this additional value should be included in the analysis, as it will modify the WTP value to transition from having, to not having, the condition. Whereas for the COI model it is the economic value associated with the ongoing pain, suffering, inconvenience and cost that is relevant.
The preferred models (See Section 9) include:
- FHS-severity effects on WTP
For the COI model we recommend using WTP values evaluated at median values of FAQLQ and FIQLQ instruments.
- declining WTP for additional years of relief from FHS
For the COI model what is required is the WTP related to the current year. In cases of non-constant marginal utilities (adult Coeliac coeliac disease and food allergy models) we recommend using the WTP value estimated at a 1-year time horizon
- WTP varying with the age of the affected child.
In the child food allergy model, the WTP ranges from £3465 for a 1-year-old to £2197 for a 17-year-old. The choice of value to be used in the COI model should lie in this range but it is essentially arbitrary, and we have adopted the value for a 10-year old of £2766.
Based on these findings we recommend that:
- the WTP values presented in Table 11.3 be incorporated into the COI model as annual FHS cost values for children and adults with the three conditions and used for impact assessments and evaluations by the FSA
- additional work be undertaken to better understand the prevalence of the conditions among adults and children, particularly given widespread (potentially mistaken) self-diagnosis of conditions
- the FSA review the results of the BWS exercises as they are an indication of the priorities of people living with food hypersensitivities, disaggregated by the 3 conditions.
Table 11.3. WTP Results, in Aggregate and by Condition, for Adults and Children
| Models | Type of condition | WTP, Adults (£/year) | WTP, Children (£/year) |
|---|---|---|---|
| Aggregate Models | - | 718 | 2501 |
| Models by condition | Allergy | 1064 | 2766 |
| Models by condition | Coeliac | 1342 | 1628 |
| Models by condition | Condition | 540 | 1689 |
- Broadbent E Petrie KJ Main J Weinman J . The Brief Illness Perception Questionnaire . J Psychosom Res 2006 ; 60 : 631 – 637 .
- Burton, N., Burton, M., Rigby, D. et al. Best-worst scaling improves measurement of first impressions. Cogn. Research 4, 36 (2019). https://doi.org/10.1186/s41235-019-0183-2
- Chrzan and Patterson (2006) Chrzan, Keith and Michael Patterson (2006), “Testing for the Optimal Number of Attributes in MaxDiff Questions,” 2006 Sawtooth Software Conference Proceedings, Sequim, WA.
- Cohen, Steve (2003), “Maximum Difference Scaling: Improved Measures of Importance and Preference for Segmentation,” 2003 Sawtooth Software Conference Proceedings, Sequim, WA.
- Cohen, Steve and Bryan Orme (2004), “What's Your Preference?” Marketing Research, 16 (Summer 2004), 32-37.
- Devlin NJ, Shah KK, Feng Y, Mulhern B, van Hout B. Valuing health-related quality of life: An EQ-5D-5L value set for England. Health Econ. 2018 Jan;27(1):7-22. doi: 10.1002/hec.3564. Epub 2017 Aug 22. PMID: 28833869; PMCID: PMC6680214.
- Dorn, S.D., Hernandez, L., Minayas, C.B. et al. (2010). The development and validation of a new coeliac disease quality of life survey (CD-QOL). Alimentary Pharmacology and Therapeutics, 31, 666-675.
- Dubé C, Rostom A, Sy R, et al. (2005). The prevalence of celiac disease in average-risk and at-risk Western European populations: a systematic review. Gastroenterology, 128(4 Suppl 1),S57-67
- DunnGalvin, A., Barnett, J., Begen, F.M., Ryan, K., Lucas J. (2018). Development and preliminary validation of the food intolerance quality of life questionnaire (FIQLQ): adult form. Quality of Life Research, 27, 1109-1116.
- DunnGalvin, A., Cullinane, C.D., Flokstra-de Blok, B.M.J., Dubois, A.E.J., Hourihane, J.O’B. (2010). Longitudinal validity and responsiveness of the Food Allergy Quality of Life Questionnaire – Parent Form (FAQLQ-PF) in children 0-12 years following positive and negative food challenges. Clinical and Experimental Allergy, 40, 476-85.
- DunnGalvin, A., de Blok, B.M.J., Dubois, A., Hourihane, J.O’B. (2008). Development and validation of the Food Allergy Quality of Life – Parent Administered Questionnaire (FAQLQ-PF) for food allergic children aged 0-12 years. Clinical and Experimental Allergy, 38, 977-986.
- EQ-5D-5L | About
- Feng, Y., Devlin, N. & Herdman, M. Assessing the health of the general population in England: how do the three- and five-level versions of EQ-5D compare?. Health Qual Life Outcomes 13, 171 (2015). https://doi.org/10.1186/s12955-015-0356-8
- Flokstra de-Blok, B.M., DunnGalvin, A., Vlieg-Boerstra, B.J., et al. (2009). Development and validation of the self-administered Food Allergy Quality of Life Questionnaire for adolsecents. Journal of Allergy and Clinical Immunology, 122, 139-44.
- Hernández Alava M, Wailoo AJ, Ara R. Tails from the peak district: adjusted limited dependent variable mixture models of EQ-5D questionnaire health state utility values. Value Health. 2012 May;15(3):550-61. doi: 10.1016/j.jval.2011.12.014.
- Hernandez-Alava, M., Pudney, S., Wailoo, A. (2018). Quality review of a proposed EQ-5D-5L value set for England. Policy Research Unit in Economic Evaluation of Health and Care Interventions. Universities of Sheffield and York. EEPRU Research Report 060.
- Jansson, SA., Heibert-Arnlind, M., Middelveld, R.J. et al (2013). Health-related quality of life, assessed with a disease-specific questionnaire, in Swedish adults suffering from well-diagnosed food allergy to staple foods. Clin Transl Allergy 3, 21. https://doi.org/10.1186/2045-7022-3-21
- Ludvigsson JF, Bai JC, Biagi F, et al. (2014). Diagnosis and management of adult coeliac disease: guidelines from the British Society of Gastroenterology. Gut, 63, 1210-1228
- Lins, MT.C., Tassitano, R.M., Brandt, K.G., et al (2015). Translation, cultural adaptation and validation of the celiac disease DUX (CDDUX). Jornal de Pediatria, 9, 448-454.
- Louviere, J. J. (1993), “The Best-Worst or Maximum Difference Measurement Model: Applications to Behavioral Research in Marketing,” The American Marketing Association's 1993 Behavioral Research Conference, Phoenix, Arizona.
- NICE Position statement on use of the EQ-5D-5L value set for England (updated October 2019)
- Paez MA, Gramelspacher AM, Sinacore J et al (2017). Delay in Diagnosis of Celiac Disease in Patients Without Gastrointestinal Complaints. Am J Med, 130, 1318-1323
- Sawtooth Software (2020) TECHNICAL PAPER SERIES The MaxDiff System Technical Paper Version 9.
- Singh P, Arora A, Strand TA, Leffler DA, Catassi C, Green PH, Kelly CP, Ahuja V, Makharia GK. (2018). Global Prevalence of Celiac Disease: Systematic Review and Meta-analysis. Clin Gastroenterol Hepatol. 2018.
- Szende A, Janssen B, Cabases J (2014). Self-Reported Population Health: An International Perspective based on EQ-5D. Springer.
- Train, K. (2009). Discrete Choice Methods with Simulation. Cambridge: Cambridge University Press.
- Van Doorn, R.K., Winkler, L.M.F., Zwinderman, K.H. et al (2008). CDDUX: A Disease-specific Health-related Quality-of-life Questionnaire for Children with Celiac Disease. Journal of Pediatric Gastroenterology and Nutrition, 47, 147-152.
- Zipser RD, Patel S, Yahya KZ et al. (2003). Presentations of adult celiac disease in a nationwide patient support group. Dig Dis Sci, 48(4),761-4.
Generic quality of life scales
The EuroQol 5-dimension health questionnaire (EQ5D) was adopted. It is a descriptive system of health-related quality of life states consisting of five dimensions (mobility, self-care, usual activities, pain/discomfort, anxiety/depression) each of which can take one of a set of defined levels.
In the EQ5D-5L the levels of mobility, self-care, usual activities, pain/discomfort, anxiety/depression can take one of 5 levels. This scale was adopted for adults answering regarding themselves.
There is no validated 5-level version of the EQ5D available for parents answering regarding their children. Hence in the Parent questionnaire the EQ5D-3L parent proxy instrument was adopted.
Respondents also used the Visual Analogue Scale (VAS) to record their (child’s) health on the day of the survey. The VAS is represented visually as a thermometer-like scale ranging between values of 0 and 100.

Psychometric scales concerning Food Hypersensitivities
A number of validated scales exist for food allergy, and the Food Allergy Quality of Life Questionnaires (FAQLQs) was adopted. FAQLQs were developed as part of the EuroPrevall study and is the most widely used and validated.
The FAQLQs have also been used as a basis to develop versions for people with food intolerance and these were used where available.
Proxy quality of life scales were used for:
- parents of teens aged 13-17 years with food allergy (FAQLQ-TF-PF) and
- parents of children aged 0-17 with food intolerance (FIQLQ-CF-PF)
There was no available validated scale for children or teens with food intolerance so we used the adaptations of the FAQLQ for children and teens which were developed in Workstream 1.
Following Workstream 1 of the project, the Coeliac Disease Quality of Life scale for adults (CDQ) and Coeliac Disease quality of life scale for children parent-proxy (CDDUX parent proxy) were adopted in this phase of the project (see Appendix B).
The FAQLQ and FIQLQ use scales running from 1 (least impairment on quality of life) to 7 (maximal impairment on quality of life). The CDQ is rated on a five-point scale, with totals adding up from 20-100 and cut off points (1-20, 20-40, 40-60, 60-80, 80-100) to denote different levels of quality of life.
On all scales, higher scores indicate a bigger impact on quality of life. Each scale consists of food hypersensitivity specific subscales.
For those completing the FAQLQ, these are:
- Allergen Avoidance and Dietary Restrictions (AADR), which considers the impact that a restrictive diet has on quality of life and the impact this also has on social activities
- Emotional Impact (EI) relating to the worries and concerns about having an allergic reaction or consuming allergens
- Risk of Accidental Exposure (RAE), relating to vigilance and awareness needed to avoid ingesting allergens
- Food Allergy related Health (FAH), relating to specific health anxiety about having an allergy or reaction
- For the FIQLQ scale, subscales comprise
- Emotional Impact (EI), related to the stresses and concerns of having to be aware of foods that could cause a reaction;
- Social and Dietary restrictions (SDR), related to the impact that having an intolerance has on diet and social activities (e.g., eating out)
- Reactions and Avoidance (RAv), related to negative feelings about having a reaction (for example, embarrassment and discouragement).
For the CDQ, subscales comprise of:
- limitations, relating to social and dietary limitations of having coeliac disease
- Dysphoria, related to negative feelings of having coeliac disease
- health concerns, concerns about the wider impact having coeliac disease will have on health
- inadequate treatment, feelings that there are not enough treatment options for the disease.
Table 1: The validated scales used to measure quality of life
| Respondent group | Quality of life scales | Development and validation reference |
|---|---|---|
| Adults with food allergy | Food Allergy Quality of Life Scale (FAQLQ) | Flokstra de-Block et al., 2009 |
| Adults with food intolerance | Food Intolerance Quality of Life Scale (FIQLQ) | DunnGalvin et al., 2018 |
| Adults with coeliac disease | Coeliac Disease Quality of Life Scale for adults (CDQ) | Dorn et al., 2010 |
| All adult respondents | EQ5D-5L | Hernandez-Alava et al., 2018 |
| All adult respondents | Visual Analogue Scale (VAS) | - |
| Parents of children aged 0 to 12 years with food allergy | Food Allergy Quality of Life Scale for children parent form(FAQLQ-PF) | DunnGalvin et al., 2008, 2010 |
| Parents of children aged 13 to 17 years with food intolerance | Food Allergy Quality of Life Scale for teens parent form (FAQLQ-TF-PF) | Workstream 1 of the FoodSensitive Study |
| Parents of children aged 0 to 17 years with food intolerance | Workstream 1 of the FoodSensitive Study | |
| Parents of children with coeliac disease | Van-Doorn et al., 2008 | |
| - | - | Lins et al., 2015 |
| All parent respondents | EQ5D-3L parent proxy | Hernandez-Alava et al., 2018 |
| All parent respondents | Visual Analogue Scale (VAS) | - |
FAQLQ
The adult FAQLQ comprised these response categories and questions:
Response categories:
- not
- barely
- slightly
- moderately
- quite
- very
- extremely
Prompts:
How troublesome do you find it, because of your food allergy that you...
- must always be alert as to what you are eating?
- are able to eat fewer products?
- are limited as to the products you can buy?
- must read labels?
- have the feeling that you have less control of what you eat when eating out?
- must refuse many things during social activities?
- sometimes frustrate people when they are making an effort to accommodate your food allergy?
- are less able to spontaneously accept an invitation to stay for a meal?
- are less able to taste or try various products when eating out?
- can eat out less?
- must personally check whether you can eat something when eating out?
- hesitate eating a product when you have doubts about it?
- that the ingredients of a product change?
- that labels are incomplete?
- that the lettering on labels is too small?
- that the label states 'may contain traces of...'
- that ingredients are different in other countries (for example during vacation)?
- that people underestimate your problems caused by food allergy?
- that it is unclear to which foods you are allergic?
- that you must explain to those around you that you have a food allergy?
- for your host or hostess should you have an allergic reaction?
How worried are you because of your food allergy?
- about your health?
- that the allergic reactions to foods will become increasingly severe?
How frightened are you because of your food allergy?
- of an allergic reaction?
- of accidentally eating the wrong food?
- of an allergic reaction when eating out despite the fact that your dietary restrictions have been discussed beforehand?
Please answer the following questions:
- to what degree do you feel you are being a nuisance because you have a food allergy when eating out?
- how discouraged do you feel during an allergic reaction?
- how apprehensive are you about eating something you have never eaten before?
FIQLQ
The adult FIQLQ comprised these response categories and questions:
Response categories:
- not
- barely
- slightly
- moderately
- quite
- very
- extremely
Prompts:
How troublesome do you find it, because of your food intolerance that you...
- must always be alert as to what you are eating?
- have less variety in the food that you can eat?
- have less variety in the products that you can buy?
- must read labels?
- have the feeling that you have less control of what you eat when eating out?
- are less able to spontaneously accept an invitation to stay for a meal?
- less able to taste or try various foods when eating out?
- must personally check whether you can eat something when eating out?
- must be cautious about eating a product when you have doubts about it
- that the ingredients of a product change?
- that the quality and clarity of labelling is poor in general?
- that people underestimate the impact of food intolerance?
- that you must explain to those around you that you have a food intolerance?
- about the impact on your health?
- that you will be embarrassed by the symptoms of a reaction in social situations?
- that you experience physical distress because of symptoms during a reaction?
How concerned are you because of your food intolerance of...
- having a reaction?
- accidentally eating something to which you will react?
- having a reaction when eating out despite the fact that your dietary restrictions have been discussed beforehand?
Please answer the following questions:
- to what degree do you feel you are being a nuisance when eating out because you have a food intolerance?
- how discouraged do you feel during an intolerant reaction?
- how concerned are you about eating something you have never eaten before?
CDQ
The adult CDQ comprised these response and categories and questions:
Response categories:
- Not at all
- slightly
- moderately
- quite a bit
- a great deal
Prompts:
For each statement, please select the option that best describes your feelings.
- I feel limited by this disease
- I feel worried that I will suffer from this disease
- I feel concerned that this disease will cause other health problems
- I feel worried about my increased risk of cancer from this disease
- I feel socially stigmatized for having this disease
- I feel like I'm limited in eating meals with co workers
- I feel like I am not able to have special foods like birthday cake and pizza
- I feel diet is not sufficient treatment for my disease
- I feel that there are not enough choices for treatment
- I feel depressed because of my disease
- I feel frightened by having this disease
- I feel like I don't know enough about the disease
- I feel overwhelmed about having this disease
- I have trouble socializing because of my disease
- I find it difficult to travel or take long trips because of my disease
- I feel like I cannot live a normal life because of my disease
- I feel afraid to eat out because my food may be contaminated
- I feel worried about the increased risks of one of my family members having coeliac disease
- I feel like I think about food all the time
- I feel concerned that my long-term health will be affected
Formally expressed, the utility (for example, the improvement in welfare or happiness) obtained from removing the food hypersensitivity is given by:
(1.) U= Adj + V(T) – β COST (1)
where:
- Adj is the adjustment cost in utility terms
- V(T) is the utility gain from removing the condition for a period of T years
- COST is the monetary payment required to remove the condition and β is the utility change associated with that payment (the marginal utility of money).
If we generalise (1) we can specify that the utility person n gains from an outcome j is given by:
(2.)

Where x denotes a vector of attributes describing the outcome j, and βn a vector of marginal utilities associated with x, which are individual (n) specific.
When faced with a number of outcomes to choose from, and assuming ε is iid extreme value, the conditional probability of selecting outcome i from the set of J is given by:
(3.)

The unconditional probability of making a choice requires integration of (3) over all possible values of βn.
One has to specify a distribution for the random parameters: here we assume they follow a normal distribution:
(4.)

Where βm and σ represent the mean and variance of the distribution, and z represents a vector of individual specific variables that ‘shift’ the mean of the distribution.
The latter appear as interaction effects with the attributes in the estimated model.
In our implementation we assume that the coefficients associated with the length of time the condition is removed, and the cost are constant across individuals. Individual specific heterogeneity is included only for the Alternative Specific Constant (ASC) associated with the adjustment cost. We find that including this fixability in the model substantially improves the fit of the model, while retaining the simplicity of having fixed parameter estimates associated with the WTP estimates.
Estimation is undertaken using the mixlogit command within Stata 17.
The modelling approach requires separation of the utility gain from a year without FHS and the adjustment costs associated with a person’s FHS being removed and then returning.
Formally, the utility (for example, the improvement in welfare or happiness) obtained from removing the condition is given by:
(1.) U= Adj + V(T) – β COST
where:
- Adj is the adjustment cost in utility terms
- V(T) is the utility gain from removing the condition for a period of T years
- COST is the monetary payment required to remove the condition and β is the utility change associated with that payment (the marginal utility of money).
V(T) may be linear in T, or one could expect a declining marginal function if respondents discount future benefits, or even an increasing function if, absent adjustment costs, they have an increasing marginal value for longer periods of relief. This can be determined empirically from analysis of the DCE data.
The adjustment cost term, Adj, can be estimated as the Alternative Specific Coefficient (ASC) associated with taking the treatment i.e. an effect that is independent of length of treatment.
The derivation of the WTP associated with a year’s removal of the FHS condition is given by:
(2.)

If V(T) is linear in t then it means the same value is applied for a year, irrespective of the length of treatment. If V(T) is nonlinear then the marginal value of an additional year will vary according to the year (T) in which it is evaluated.
For the COI model, the appropriate value is evaluated at T=1, that is, the current year.
For example, if the value of year without the FHS condition is a quadratic function of time of the form:
(3.) V(T) = aT+ bT2
then the value of an additional year of not having the condition is given by
(4.) a + 2bT
For the CoI model the appropriate value for the marginal utility associated with avoiding a year in the condition is given by a+2b, and the equivalent value in monetary terms
(5.) (a+2b)/ β.
It is possible to identify an equivalent monetary value associated with the adjustment cost for example, Adj/ β.
As discussed in the report, the context being evaluated determines whether the WTP to move away from the SQ should be included in the calculation of the WTP for time without one’s FHS.
This monetary value (WTP for SQ) should not be included in the COI model, as it represents the value that is associated with a change in condition, whereas the COI model is concerned with costs of ongoing conditions. If, in contrast, one was interested in evaluating the market potential for a treatment that did indeed deliver relief from the FHS then this additional value should be included in the analysis, as it will modify the WTP value to transition from having, to not having, the condition.
For the COI model it is the economic value associated with the ongoing pain, suffering, inconvenience and cost that is relevant.
BWS is a technique designed to elicit the relative importance of items (desirability of brands priorities in policy, preferences for ice cream flavours,…).
The items being ranked here are the set of impacts of FHS which comprise the condition-specific quality of life measures:
• Food Allergy Quality of Life Questionnaire, FAQLQ;
• Food Intolerance Quality of Life Questionnaire, FIQLQ;
• Coeliac Disease Quality of Life Questionnaire, CDQ.
The FAQLQ and FIQLQ quality of life instruments use a 7-point Likert Scale format (from “not” to “extremely”) when eliciting the magnitude of each impact on respondents, as shown in this set of questions from the FAQLQ and FIQLQ instruments. The FAQLQ comprises 29 items, and the FIQLQ 22 items
Figure 1. Example FIQLQ questions
How troublesome do you find it, because of your food intolerance, that you... (marked on a scale from 0 'not' to 6 'extremely'.
- must always be alert as to what you are eating?
- have less variety in the food that you can eat?
- have less variety in the products that you can buy?
- must read labels?
- have the feeling that you have less control of what you eat when eating out?
The image shows the 7-point likely scale (ranging between ‘not’ and ‘extremely’) on which impacts were scored in the FIQLQ instrument.
Some example FIQLQ items are shown, of the form: ‘how troublesome do you find it, because of your food intolerance, that you…
1. Must always be alert as to what you are eating
2. Have less variety in the food that you can eat?
3. Have less variety in the products that you can buy?
4. Must read labels?
5. Have the feeling that you have less control of what you eat when eating out?
Figure 2. Example FAQLQ questions
How troublesome do you find it, because of your food allergy, that you... (marked on a scale from 0 'not' to 6 'extremely'.
- must always be alert as to what you are eating?
- are able to eat fewer products?
- are limited as to the products you can buy?
- must read labels?
- have the feeling that you have less control of what you eat when eating out?
- must refuse many things during social activities?
The CDQ comprises 20 items and is scored on a 5-point scale (from “not at all” to “a great deal”):
Figure 3. Example CDQ questions
For each statement, please select the option that best describes your feelings.
- I feel limited by this disease
- I feel worried that I will suffer from this disease
- I feel concerned that this disease will cause other health problems
- I feel worried about my increased risks of cancer from this disease
- I feel socially stigmatized for having this disease
The items which comprise the FAQLQ, FIQLQ and CDQ instruments were converted into statements that could be placed alongside each other in BWS sets, and respondents asked which had the (a) greatest, and (b) least, impact on their quality of life.
The items from the 3 instruments required a minor rephrasing so they could be displayed next to each other, and respondents asked to pick those with least/greatest impact. A small number of items
Example BWS sets for the FAQLQ, FIQLQ and CDQ are shown in Figures 3.1 and 3.2 in section 3.5 of the report.
BWS Experimental Design
The BWS sets were the product of an experimental design in which the items are combined into varying subsets of the full set of items.
The design requires decisions to be made regarding (i) number of items per set, and (ii) how many sets to shown to each respondent.
For all 3 BWS exercises the items were combined into sets of 4 items; research has indicated that a maximum number of 5 items should be presented within a subset, as sets greater than this yield little in terms of statistical power relative to the costs of additional cognitive load (Sawtooth Software, 2020; Chrzan and Patterson (2006)).
The experimental design (created using Sawtooth Software’s MaxDiff design module.) of the BWS exercise used a programming-based algorithm which generated an orthogonal design in which each item appeared the same number of times and there was positional balance of the items within the subsets. The designs were of the form:
Table 1. BWS design details for each of the 3 conditions / QoL measures
| Conditions | Items | Items/set | Number of sets/person |
|---|---|---|---|
| Allergy (FAQLQ) | 29 | 4 | 10 |
| Coeliac (CDQ) | 19 | 4 | 8 |
| Intolerance (FIQLQ) | 18 | 4 | 7 |
In each case the design a respondent saw was randomly selected from one of 50 blocks, - having multiple blocks of the design increased variation in item co-occurrence and item position within the sets (which can have an impact on the probability of selection by a respondent). They were presented with the condition that they had identified as the sole, or most significant, food hypersensitivity that they had.
Analysing and Interpreting BWS data and results
In each BWS set the respondent chooses the impact which has ‘most’ and ‘least’ impact on their quality of life. These are yes/no choices from a fixed set of options (like the DCE reported above) and hence logit models are estimated on the BWS data.
To increase the interpretive power of the results, the logit coefficient for each impact included in the BWS exercise was transformed into an ‘Importance Score’ (Sawtooth Software, 2020) where the Importance Score is defined as:
Φi /( Φi + n-1)
where:
Φi =zero-meaned logit score for impact i
n=number of items shown per BWS set (in this study, n = 4)
The advantage of this transformation is that Importance Scores are ratio scaled - meaning that an item with a score of 6, for example, is regarded by the sample as 6 times more important than an item with a score of 1. This property makes for more intuitive assessment and interpretation of the results (it provides information on the magnitude of the differences in quality-of-life impacts rather than just a ranking).
If you need an accessible version of this attachment, please contact fsa.communications@food.gov.uk.
If you need an accessible version of this attachment, please contact fsa.communications@food.gov.uk.
A sample of 2276 adults was achieved, comprising people who either
- have one or more Food Hypersensitivity, or
- are a parent/carer of one or more children with a Food Hypersensitivity (FHS).
The sample was recruited in July-November 2021.
The survey sources are:
- people who completed a survey as part of Workstream 1 of this project and agreed to be recontacted
- a market research commercial sample recruited from Pureprofile
- people recruited from marketing / publicity distributed by support groups (Anaphylaxis UK, etc).
The sample was reduced to 2142 after removal of people who completed the survey excessively quickly (an issue most common in the purchased sample).
We now summarise the characteristics of the Adult and then Parents sample.
Demographic Information: Adult sample
The adult sample is now described, first in terms of demographics, and then in terms of their food hypersensitivity.
Sex: The sample was overwhelmingly (77%) female.
Table 1. Tabulation of sex
| Sex | Frequency | Percent |
|---|---|---|
| Male | 326 | 22.89 |
| Female | 1098 | 77.11 |
| Total | 1424 | 100.00 |
Age: The modal age category was 35 to 54 years old.
Table 2: Tabulation of age category
| Age | Frequency | Percent | Cumulative |
|---|---|---|---|
| Below 35 years old | 245 | 17.24 | 17.24 |
| 35 to 54 years old | 462 | 32.51 | 49.75 |
| 55 to 64 years old | 372 | 26.18 | 75.93 |
| 65 years old and above | 342 | 24.07 | 100.00 |
| Total | 1421 | 100.00 | - |
The mean age was 52 years, and the median age of respondents was 55 years old with ages distributed between 17 and 90 years.
Table 3: Adult age statistics
| - | Mean | Std Dev | N | Min | p25 | Median | p75 | max |
|---|---|---|---|---|---|---|---|---|
| Age | 52.36 | 15.68 | 1421 | 17 | 41 | 55 | 64 | 90 |
Figure 1: Age Distribution Analysis

Income: For those who stated their income, the modal income category is £25,000-£34,999 but nearly 20% of respondents refused to state their income.
Figure 2: Income distribution, Adults

Distribution of Food Hypersensitivities: Adult sample
Accounting for Multiple Conditions
Just over a third of the sample reported having a food allergy, over 40% reported having coeliac disease or a food intolerance. The distribution of conditions shown (with percent values summing to more than 100) reflect that some people reported having more than one condition. The sample included people with a clinical diagnosis and those whose condition was self-assessed.
Table 4. Distribution of food hypersensitivity Conditions, adults
| Food hypersensitivity conditions | Frequency | Percent |
|---|---|---|
| Food Allergy | 495 | 34.7 |
| Coeliac Disease | 630 | 44.2 |
| Food Intolerance | 607 | 42.6 |
| Total | 1426 | 100 |
Decomposing these figures into single and multiple conditions gives:
Table 5. Distribution of food hypersensitivity Conditions accounting for multiple conditions, adults
| Food hypersensitivity conditions | Frequency | Percent | Cum. |
|---|---|---|---|
| Food Allergy | 274 | 19.21 | 19.21 |
| Coeliac Disease | 508 | 35.62 | 54.84 |
| Food intolerance | 365 | 25.60 | 80.43 |
| Multiple | 279 | 19.57 | 100.00 |
| Total | 1426 | 100.00 | - |
Figure 3: Distribution of conditions, including multiple conditions, adults

The specific combinations of conditions are shown in Table 9.6 which indicates only 1.9% of respondents report having all 3 conditions, and 18% of respondents report having 2 conditions.
Table 6. Tabulation of food hypersensitivity conditions and combinations
| Food hypersensitivity conditions | Frequency | Percent | Cum. |
|---|---|---|---|
| Food Allergy | 274 | 19.21 | 19.21 |
| Coeliac Disease | 508 | 35.62 | 54.84 |
| Food intolerance | 365 | 25.60 | 80.43 |
| Allergy and Coeliac | 37 | 2.59 | 83.03 |
| Allergy and intolerance | 157 | 11.01 | 94.04 |
| Coeliac and intolerance | 58 | 4.07 | 98.11 |
| Allergy, coeliac and intolerance | 27 | 1.89 | 100.00 |
| Total | 1426 | 100.00 | - |
Figure 4: Distribution of conditions, including specific multiple conditions, adults

The distribution of conditions by sex is shown here, with 40% of males report having coeliac disease whereas 45% of females report having coeliac disease. Coeliac disease is the most commonly reported condition among both male and female adults, food allergy is the least common condition in both groups. Note that people reporting multiple conditions means these percentage values do not sum to 100.
Table 7: Tabulation of food hypersensitivity conditions by sex
| Female | mean | sd |
|---|---|---|
| Food Allergy | 34.8 | .48 |
| Coeliac | 45.4 | .5 |
| Food Intolerance | 43.8 | .5 |
| Male | mean | sd |
|---|---|---|
| Food Allergy | 34.7 | .48 |
| Coeliac | 39.6 | .49 |
| Food Intolerance | 38.7 | .49 |
Figure 5: Distribution of conditions, by sex

40% of males report having coeliac disease whereas 45% of females report doing so.
The distributions of the 3 conditions between the 4 age groups we use to disaggregate the data are shown in Figure 6. (Singh et al’s 2018 meta-analysis reports that biopsy-confirmed coeliac disease is 1.5 times more common in females than in males).
Figure 6: Distribution of conditions by age

Multiple conditions are much less commonly reported in those aged 65 and over (22% compared to 27-29% of the other groups). Food allergies are relatively uncommon amongst the 65 plus group: 14% of over 65s have only a food allergy whereas 32% of under 35s do so.
Pearson's chi-squared tests indicate that the distributions of conditions are different at the 1% level across age brackets (χ_9^2= 62.5956, Pr = 0.000). Therefore, the null hypothesis of no difference is rejected.
Identifying the ‘worst’ condition for those with multiple FHS
Twenty percent of the adult sample reported having more than one food hypersensitivity. The tabulations of those conditions, for people’s only or worst condition are shown here – where the sample size is 1426 and the percentage values sum to 100 as each person indicates only a single food hypersensitivity.
Table 8. Tabulation of food hypersensitivity worst or only condition
| Food hypersensitivity condition | Frequency | Percent | Cum. |
|---|---|---|---|
| Food Allergy | 385 | 27.00 | 27.00 |
| Coeliac Disease | 601 | 42.15 | 69.14 |
| Food Intolerance | 440 | 30.86 | 100.00 |
| Total | 1426 | 100.00 | - |
Figure 7: Distribution of worst or only condition, adults

Coeliac disease was the condition most commonly (by 42%) identified as only/worst food hypersensitivity, just under a third reported food intolerance as only/worst FHS condition, and 27% indicated this was true of food allergy.
Distribution of only or worst condition
The distribution of these conditions between male and female respondents is shown here.
Table 9: Distribution of worst or only food hypersensitivity, by sex
| Only or Worst condition | Number in each sex: Male (%) | Number in each sex: Female (%) | Number in each sex: Total (%) |
|---|---|---|---|
| Frequencies: Food Allergy | 96 | 289 | 385 |
| Cell percentages: Food Allergy | 6.74 | 20.29 | 27.04 |
|
Frequencies: Coeliac Disease |
124 | 475 | 599 |
| Cell percentages: Coeliac Disease | 8.71 | 33.36 | 42.06 |
| Frequencies: Food Intolerance | 106 | 334 | 440 |
| Cell percentages: Food Intolerance | 7.44 | 23.46 | 30.90 |
| Frequencies: total | 326 | 1098 | 1424 |
| Cell percentages: total | 22.89 | 77.11 | 100.00 |
38% of Males say that coeliac disease affects them the most, whereas 43% of Females do so.
Pearson's chi-squared tests (Pearson chi2(2) = 2.8974 Pr = 0.235)) indicate that the distributions of worst conditions are not statistically different across sex.
Figure 8: Distribution of worst or only condition, by sex, adults

The distribution of these conditions by age group is shown in Table 10 and Figure 9.
Table 10: Distribution of worst or only food hypersensitivity, by age
| Only or Worst condition | Below 35 years old | 35 to 54 years old | 55 to 64 years old | 65 years old and above | Total |
|---|---|---|---|---|---|
| Frequencies: Food Allergy | 104 | 140 | 71 | 69 | 384 |
| Cell percentages: Food Allergy | 42.45 | 303.30 | 19.09 | 20.18 | 27.02 |
|
Frequencies: Coeliac Disease |
79 | 164 | 177 | 180 | 600 |
| Cell percentages: Coeliac Disease | 32.24 | 35.50 | 47.58 | 52.63 | 42.22 |
| Frequencies: Food Intolerance | 62 | 158 | 124 | 93 | 437 |
| Cell percentages: Food Intolerance | 25.31 | 34.20 | 33.33 | 27.19 | 30.75 |
| Frequencies: total | 245 | 462 | 372 | 342 | 1421 |
| Cell percentages: total | 100.00 | 100.00 | 100.00 | 100.00 | 100.00 |
Pearson chi2(6) = 66.4119 Pr = 0.000
Figure 9. Distribution of Worst or Only Condition, by age group, Adults

Sampled adults below 35 are most likely to report food allergy as their only (or worst) FHS, whereas people aged over 55 are much less likely to do so; about half of the sample over 55 report Coeliac coeliac Disease disease as their only or worst condition. Those recruited with food intolerances are more evenly distributed across the age groups.
These results are consistent with Coeliac coeliac disease tending to be diagnosed later in life (often at 40-50 years of age) (Paez et al (2017); Zipser et al (2003); Ludvigsson et al (2014)). Care must be taken not to over-interpret these distributions. The sample includes many people with multiple FHS – for them it could be that the symptoms of their multiple conditions differ as they age, it could be that they adapt better to one than the other. Pearson's chi-squared tests indicate that the distributions of only/worst conditions are different at the 1% level across age groups (χ_6^2= 66.4119, Pr = 0.000); the null hypothesis of no difference is rejected.
Demographic Information: Child Sample
The child sample is now described, first in terms of child and parent demographics, and then in terms of the children’s food hypersensitivity.
Child Age
The children were aged between1 and 17 years old with a mean age of 8.7 years.
Table 11. Summary statistics: child age
| - | Mean | Std. Dev | N | Min | p25 | Median | p75 | max |
|---|---|---|---|---|---|---|---|---|
| Age | 8.66 | 4.72 | 716 | 1 | 5 | 8 | 13 | 17 |
The median age of the children that parents responded about was 8 years old.
Figure 10 Distribution of Child age

Parental income
For those who stated their income, the modal (household) income category is £55,000-£74,999 but it should be noted that 12% of respondents declined to state their household income.
Table 12. Tabulation of income, parents
| Income | Frequency | Percent | Cumulative |
|---|---|---|---|
| Below £6,000 | 18 | 2.51 | 2.51 |
| £6,500 to £11,499 | 35 | 4.89 | 7.4 |
| £11,500 to £17,499 | 21 | 2.93 | 10.34 |
| £17,500 to £24,999 | 48 | 6.7 | 17.04 |
| £25,000 to £34,999 | 88 | 12.29 | 29.33 |
| £35,000 to £44,999 | 66 | 9.22 | 38.55 |
| £45,000 to £54,999 | 70 | 9.78 | 48.32 |
| £55,00 to £74,999 | 115 | 16.06 | 64.39 |
| £75,000 to £99,999 | 80 | 11.17 | 75.56 |
| £75,000 to £99,999 | 33 | 4.61 | 80.17 |
| £75,000 to £99,999 | 19 | 2.65 | 82.82 |
| £150,00 to £199,999 | 21 | 2.93 | 85.75 |
| More than £150,000 to £199,999 | 16 | 2.23 | 87.99 |
| Prefer not to say | 86 | 12.01 | 100 |
| Total | 716 | 100.00 | - |
Figure 11: Distribution of income, child sample

Distribution of Food Hypersensitivities: Child Sample
Accounting for Multiple Child Conditions
Just over 70% the sample reported their child had a food allergy, 29% reported their child had a food intolerance. The numbers reporting their child had coeliac disease was much lower at 12%.
These data reflect that some people reported having more than one condition
Table 13. Distribution of child conditions
| Condition | Mean | Std. Dev |
|---|---|---|
| Food Allergy | 72.2 | .448 |
| Coeliac Disease | 11.9 | .3242 |
| Food Intolerance | 28.5 | .452 |
Decomposing these figures into single and multiple conditions gives this breakdown with 11% of the sample reporting their child had more than one (??) of the 3 conditions.
Table 14. Tabulation of child conditions, including multiple conditions
| Food hypersensitivity conditions | Frequency | Percent | Cum. |
|---|---|---|---|
| Food Allergy | 440 | 61.45 | 61.45 |
| Coeliac Disease | 60 | 8.38 | 69.83 |
| Food intolerance | 135 | 18.85 | 88.69 |
| Multiple | 81 | 11.31 | 100.00 |
| Total | 716 | 100.00 | - |
Figure 12: Distribution of conditions including multiple conditions, children

The specific combinations of child conditions that people report are shown in Table 15.
Table 15: Tabulation of Children's food hypersensitivity conditions and combinations
| Food hypersensitivity | Frequency | Percent | Cumulative |
|---|---|---|---|
| Food Allergy | 440 | 61.45 | 61.45 |
| Coeliac Disease | 60 | 8.38 | 69.83 |
| Food Intolerance | 135 | 18.85 | 88.69 |
| Allergy and Coeliac | 12 | 1.68 | 90.36 |
| Allergy and Intolerance | 56 | 7.82 | 98.18 |
| Coeliac and Intolerance | 4 | 0.56 | 98.74 |
| Allery, Coeliac and Intolerance | 9 | 1.26 | 100.00 |
| Total | 716 | 100.00 | - |
Figure 13: Distribution of conditions including specific combinations conditions, children

10% of respondents report their child having 2 conditions, and only 1.3% of respondents report their child having all 3 conditions.
Table 16: Tabulation of number of conditions per child
| Number of conditions | Frequency | Percent | Cum. |
|---|---|---|---|
| 1 Condition | 635 | 88.69 | 88.69 |
| 2 Conditions | 72 | 10.06 | 98.74 |
| 3 Conditions | 9 | 1.26 | 100.00 |
| Total | 716 | 100.00 | - |
Identifying the 'worst' condition for those children with multiple FHS
In the child sample 11% reported their child had more than one food hypersensitivity, and so were asked to indicate which one had the greatest impact on their child’s quality of life.
The tabulations of those conditions, for people’s only or worst condition are shown here – where the sample size is 716 and the percentage values sum to 100 as each person indicates only a single food hypersensitivity.
Table 17. Distribution of child’s only or worst condition
| Type of condition | Frequency | Percent | Cumulative |
|---|---|---|---|
| Food Allergy | 496 | 69.27 | 69.27 |
| Coeliac Disease | 73 | 10.20 | 79.47 |
| Food Intolerance | 147 | 20.53 | 100.00 |
| Total | 716 | 100.00 | - |
69.3% of respondents say that Food Allergy if their only or worst condition, and only 10% reported that coeliac disease was their child’s only or worst condition.
This is a strong contrast with the adult sample in which coeliac disease was the condition most commonly (42%) identified as only or worst condition.
The impact of living with a food hypersensitivity, and hence the gain to be valued if it was removed, was captured using three approaches:
1. EQ-5D
Respondents scored their (child’s) health using EQ-5D at the time of the survey and how they imagined it would be if the FHS was removed.
2. Visual Analogue Scale (VAS)
Respondents scored their (child’s) health using EQ-VAS at the time of the survey and how they imagined it would be if the FHS was removed.
3. Condition-specific measures (FAQLQ, FIQLQ, or CDQ) for adults and children
This appendix covers the first two approaches. EQ-VAS Condition-specific measures. FAQLQ, FIQLQ, and CDQ are covered in Appendix K of the report, for adults and children.
Adult results: EQ5D-5L and EQ-VAS
Table 1 reports the mean utility score representing the health of the adult respondents estimated from the EQ5D-5L. These utility scores were generated from the levels for each completed EQ5D shown in Appendix J.
Table 1. Summary statistics for the calculated utility score from EQ5D-5L for adults
| - | Mean | Std. Dev. | N | Min | p25 | Median | p75 | Max |
|---|---|---|---|---|---|---|---|---|
| EQ5D index | 0.74 | .24 | 1426 | -.51 | .66 | .77 | .88 | 1 |
Figure 1 shows the distribution of the utility scores for the population of adult respondents. This Figure shows that over one-fifth of adult respondents rated their health to be ‘perfect’ (score 1) despite living with a food hypersensitivity. Table 3 and Figure 1 in Appendix J show how the observed EQ5D levels compared with those values from the UK population.
Accepted published values representing the ‘population normal’ scores for each of the domains for the EQ5D-5 level and total utility score are not available for the UK [https://euroqol.org/eq-5d-instruments/eq-5d-5l-about ]. In Appendix J, Figure 1 we show an illustrative comparison using data from Feng et al (2015) that reports some exemplar data from 996 respondents that completed the EQ5D-5 level as part of the original valuation study [Devlin et al (2018)]. Comparing the data we observed from the population of adults living with a food hypersensitivity with the EQ5D-5L domain scores from Feng (2015) shows that, in general, a lower proportion of adults scored ‘level one’ (no problems) on the EQ5D-5L (representing perfect health). In the adult population with a food hypersensitivity, a higher proportion scored ‘level two’ (slight problems) and a similar proportion scored ‘level five’ (unable to perform a function or in the extreme in terms of anxiety/depression or pain/discomfort) using the EQ5D-5L compared with the reported population norms from Feng and colleagues.
Devlin et al (2018) has published a population level value set for the five-level version of EQ5D use in England but an independent review has meant that national decision-making bodies such as NICE recommend against its use. This recommendation means that there is no publically available set of data to allow a direct comparison of population norms of EQ5D-5 level utility scores in an adult population with a population living with a food hypersensitivity. There are population form data available for the EQ5D-3L, which contains the same domains (mobility, self-care, usual activities, pain/discomfort, anxiety/depression) but measured using a three-level rather than five-level scale for each domain [Svende et al (2014)]. Using a country-specific valuation exercise the population average value of health status is 0.855. This value compares to 0.74 in an adult population living with a food hypersensitivity that suggests they are living at a lower level of health status. Looking at the EQ-VAS rating scale, for the UK population the score (using a scale of 0 to 100) is 82.8 for people aged between 45 and 54 years. This compares to a value of 69.4 for the adult population living with a food hypersensitivity.
Figure 1. Distribution of utility scores representing the current health of adult
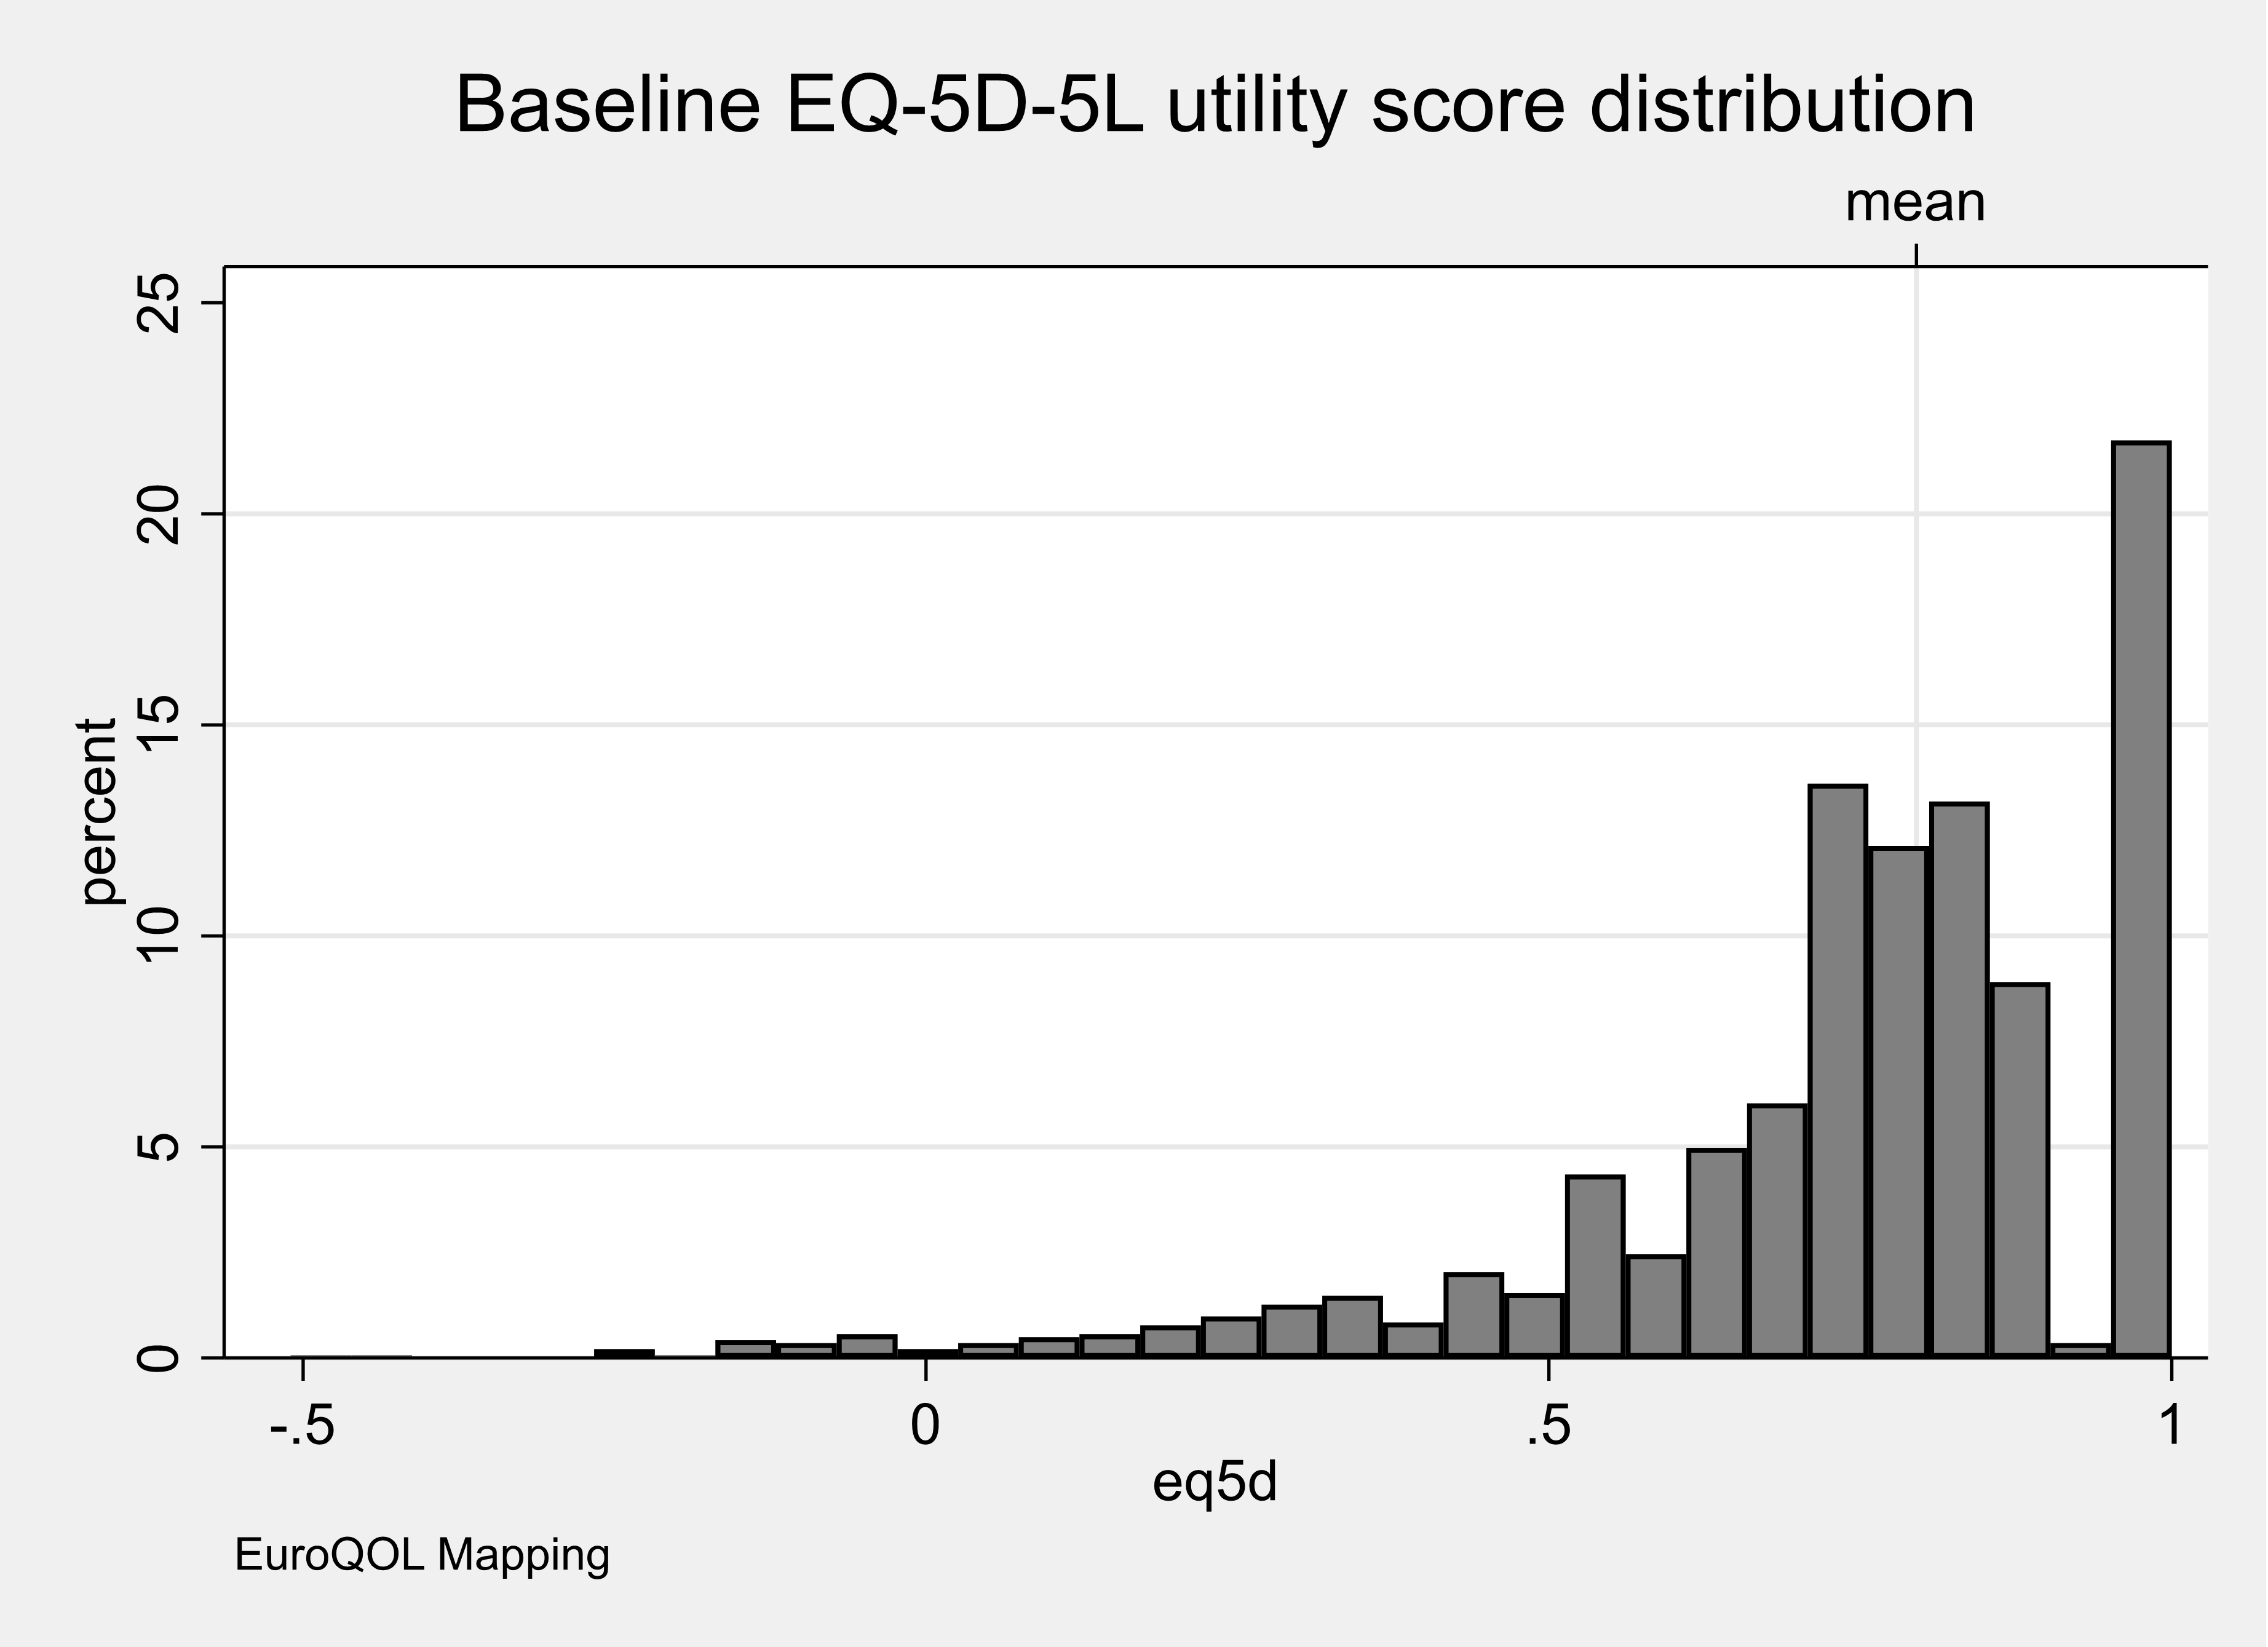
Respondents were asked to identify the food hypersensitivity that had the most substantial impact on them. Table 2 reports the mean utility score representing the health of the respondents estimated from the EQ5D-5L for each category of food hypersensitivity. These utility scores were generated from the levels for each completed EQ5D shown in Appendix J.
Table 2. Summary statistics for the calculated utility score from EQ5D-5L for adults for the worst or only food hypersensitivity
| Only or Worst condition | mean | sd | N | min | p25 | Median | p75 | Max |
|---|---|---|---|---|---|---|---|---|
| Coeliac Disease | 0.8 | .18 | 601 | -.44 | .73 | .8 | .91 | 1 |
| Food Allergy | 0.73 | .25 | 385 | -.51 | .63 | .77 | .88 | 1 |
| Food Intolerance | 0.68 | .27 | 440 | -.22 | .58 | .74 | .84 | 1 |
Figure 2 shows the distribution of the utility scores for the population of adult respondents for each category of food hypersensitivity for the worst condition only. This Figure shows that over one-fifth of adult respondents living with a food allergy or coeliac disease rated their health to be ‘perfect’ despite living with a food hypersensitivity. In contrast, only around 15% of adult respondents rated their health to be ‘perfect’ if they were living with food intolerance.
Figure 2. Distribution of utility scores representing the current health of adults for the worst or only food hypersensitivity
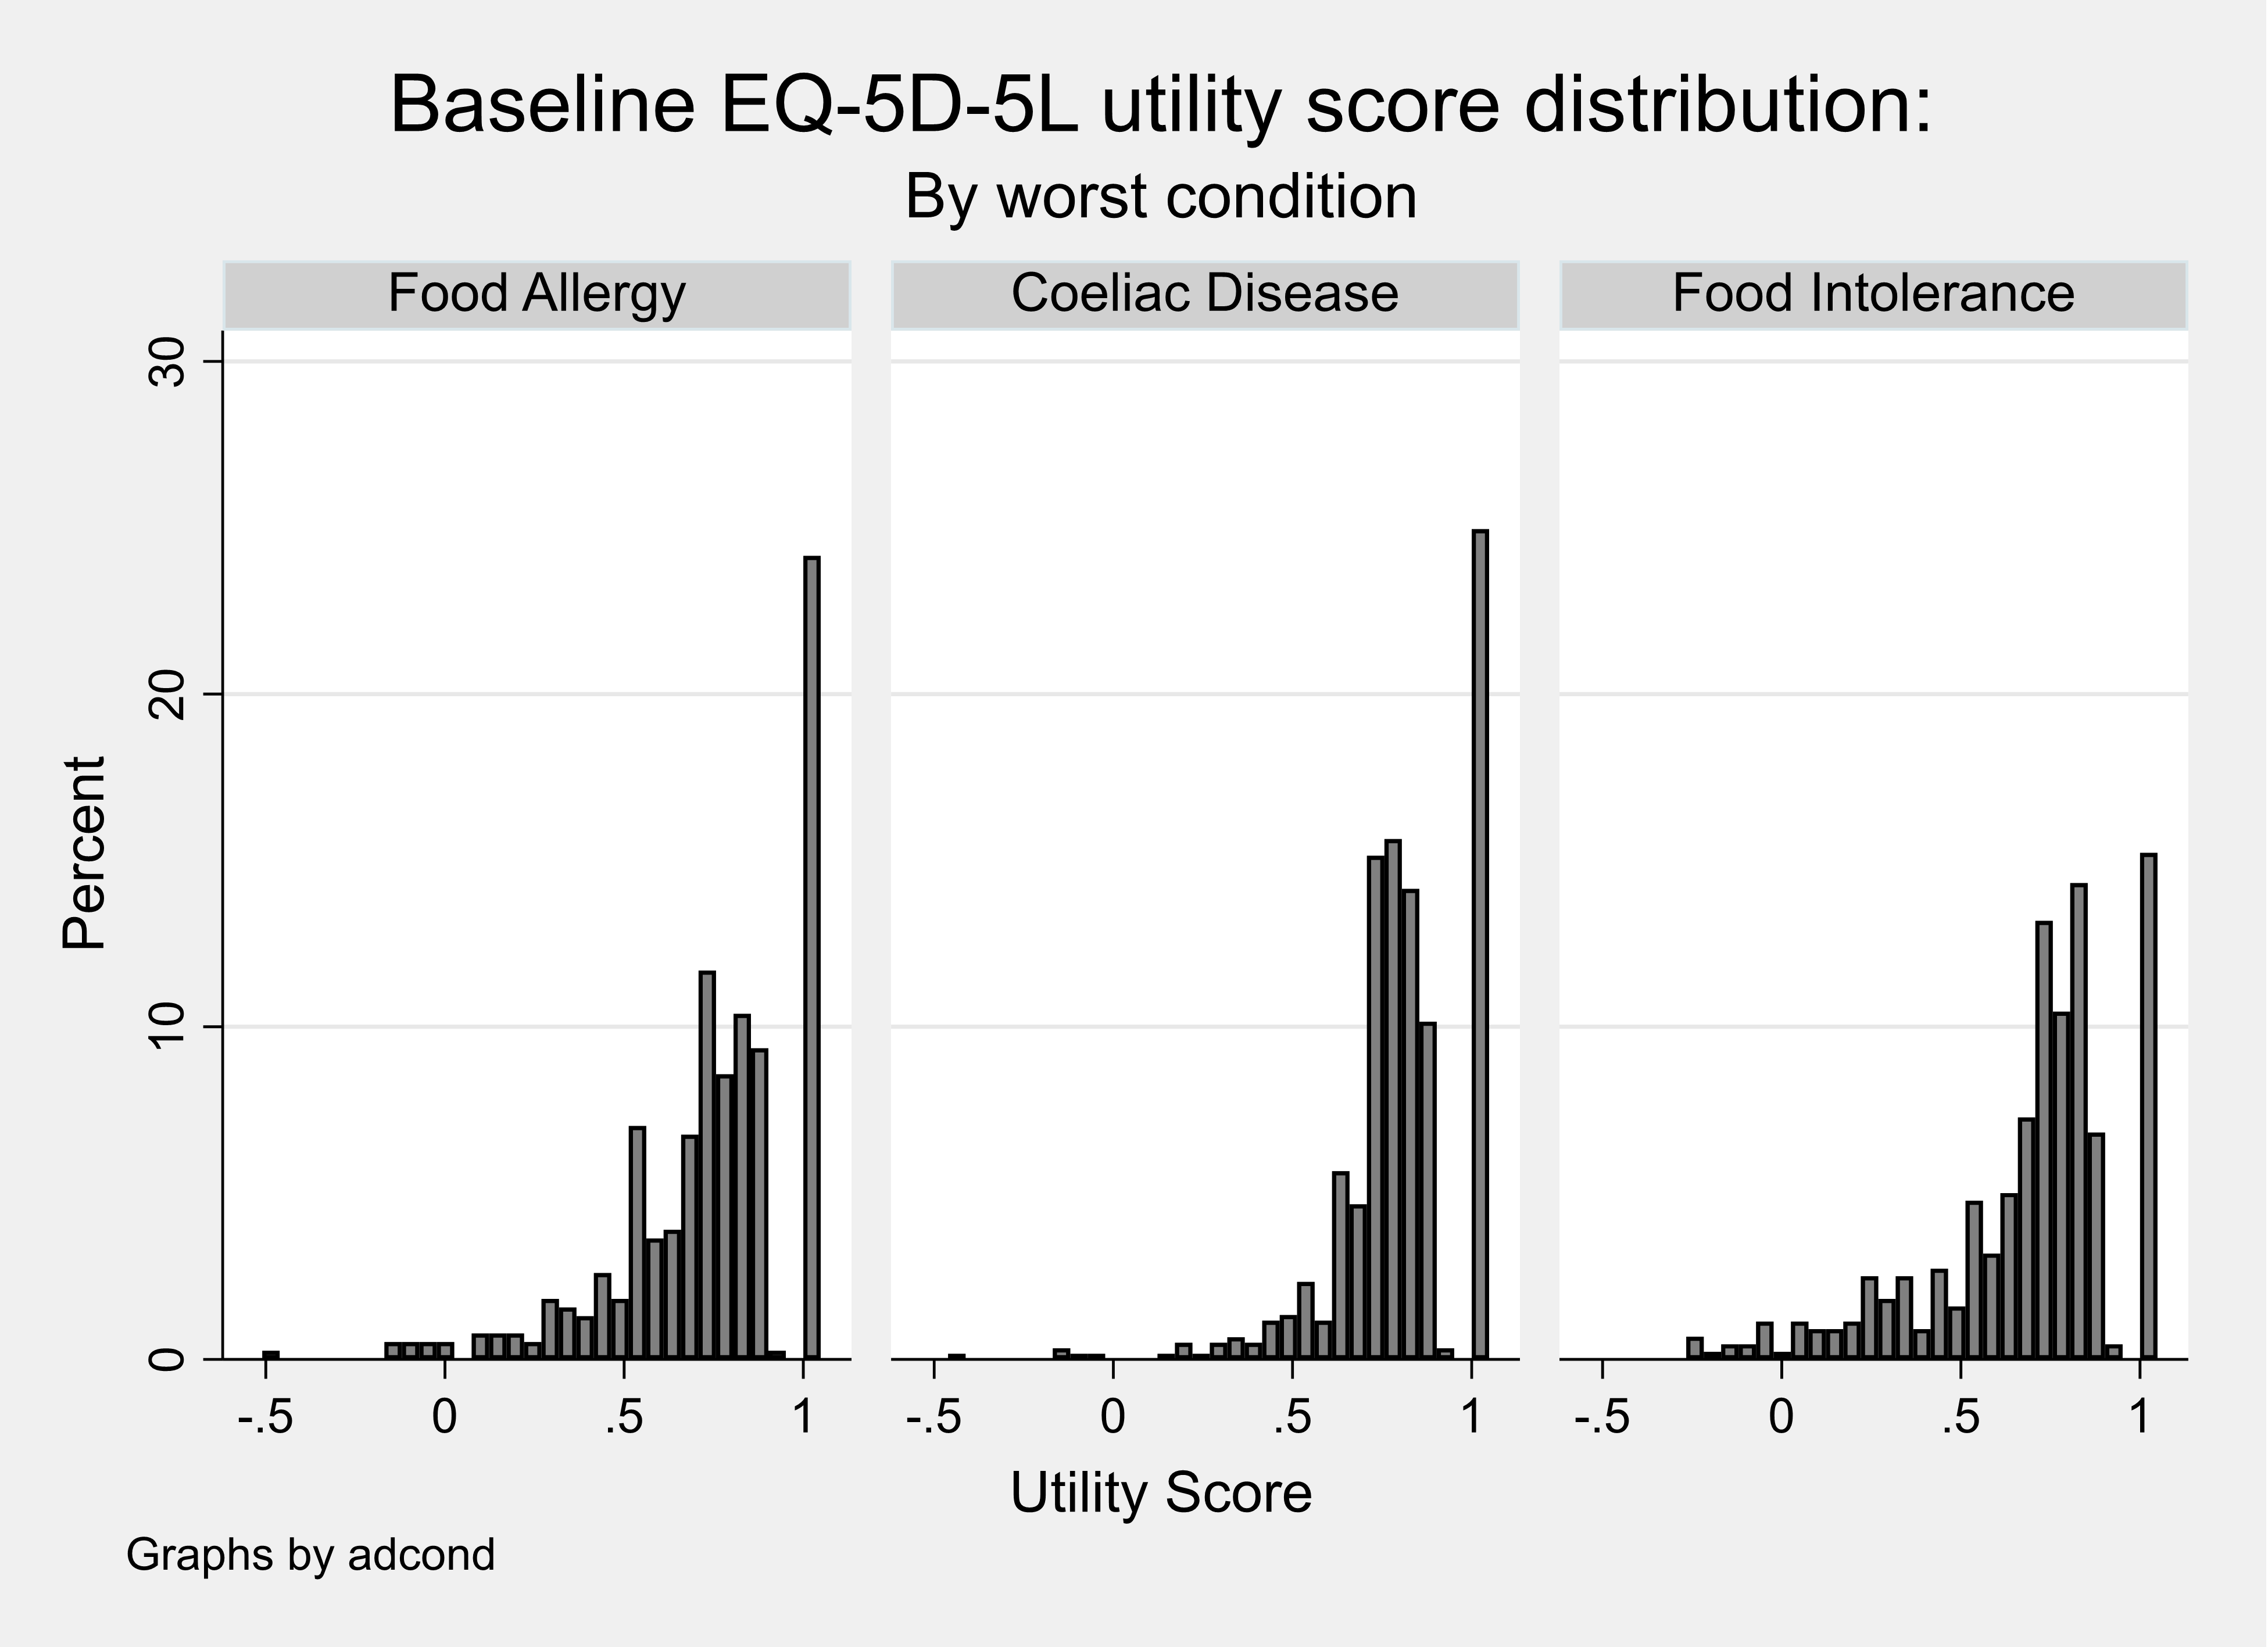
The distribution of the utility scores are characteristic of those from other populations that complete the EQ5D multi-attribute measure of health status; right bounded at a value of one (representing perfect health) with a substantial gap to the next set of observations, left bounded, and multi (often bi) modal [Hernández Alava et al (2012)].
Table 3 reports the mean utility score representing the health of the respondents estimated from the EQ5D-5L for adults living with one FHS and also multiple FHS.
Table 3. Summary statistics for the calculated utility score from EQ5D-5L for adults with one or multiple conditions
| Condition | Mean | sd | N | min | p25 | Median | p75 | Max |
|---|---|---|---|---|---|---|---|---|
| Coeliac Disease | 0.81 | .18 | 508 | -.44 | .74 | .84 | 1 | 1 |
| Food Allergy | 0.75 | .26 | 274 | -.51 | .65 | .8 | 1 | 1 |
| Food Intolerance | 0.7 | .26 | 365 | -.22 | .62 | .77 | .85 | 1 |
| Multiple | 0.68 | .23 | 279 | -.2 | .58 | .73 | .84 | 1 |
Figure 3 shows the distribution of the utility scores for the population of adult respondents living with one food hypersensitivity or multiple FHS. This Figure shows that a lower proportion (~12%) of adults living with multiple rather than one food hypersensitivity rated their health to be ‘perfect’ despite living with a FHS.
Figure 3. Distribution of utility scores representing the current health of adults with one or multiple conditions
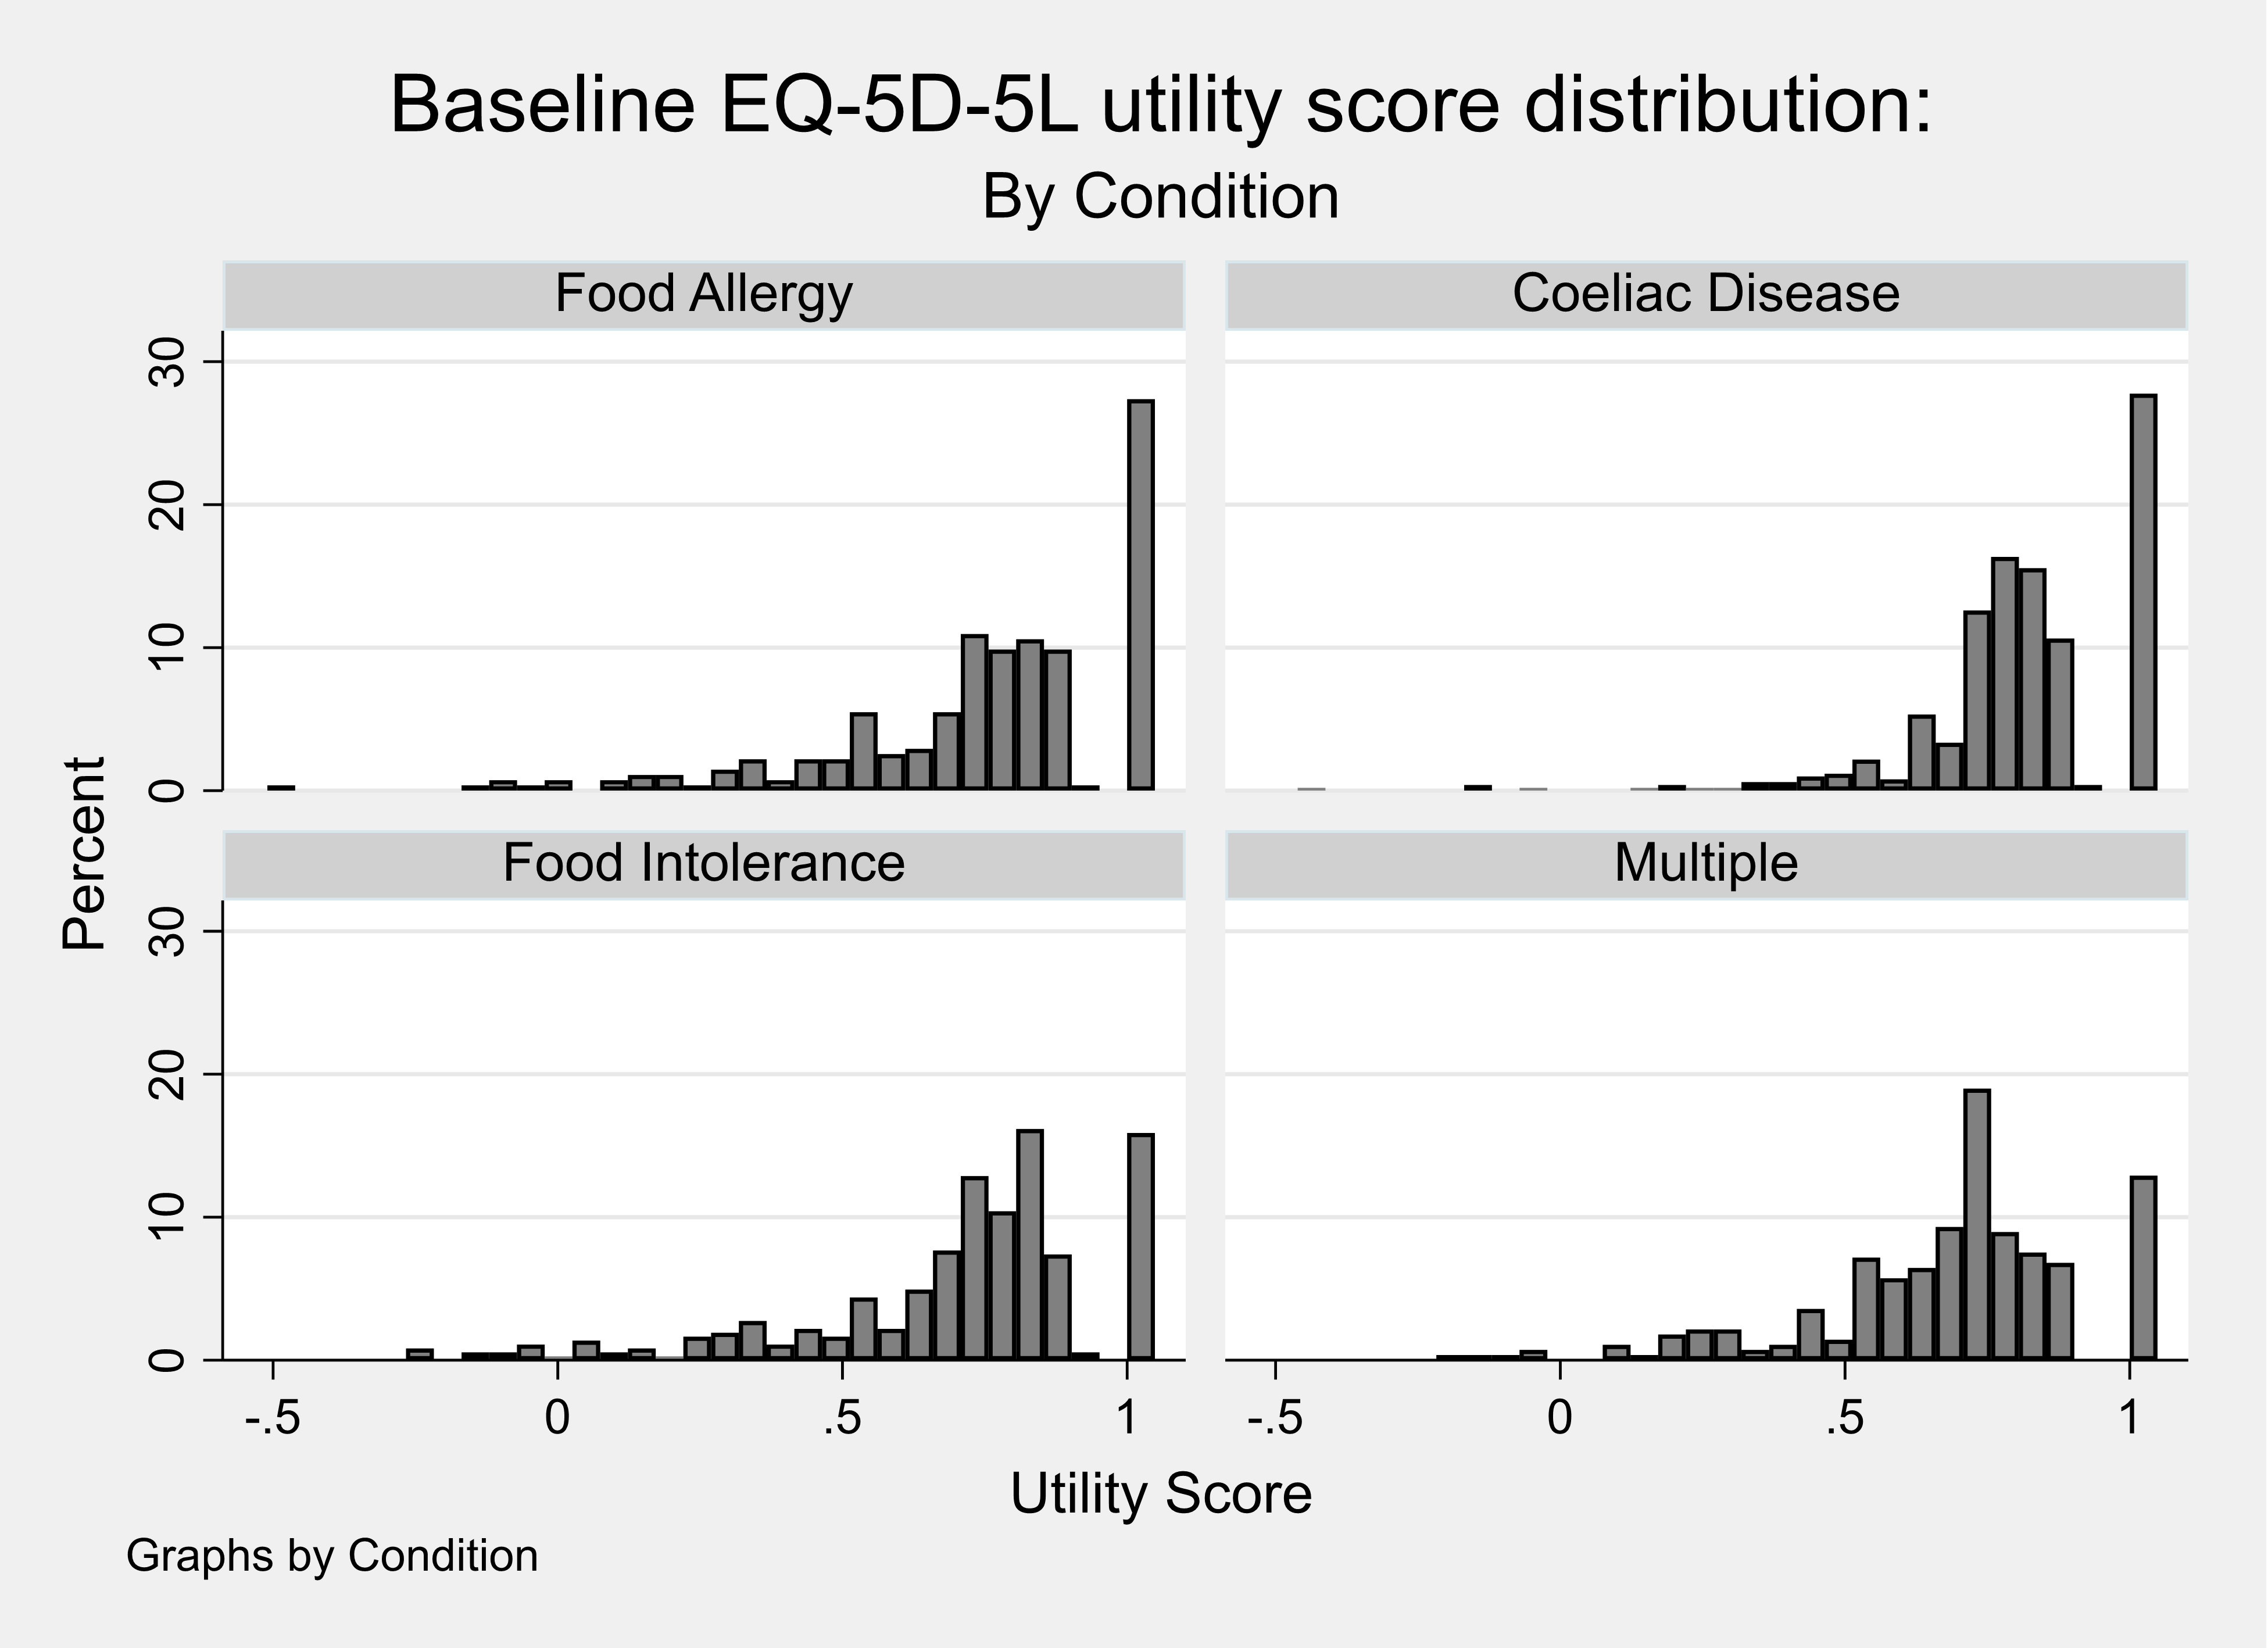
Adult results: Contingent health status using EQ5D-5L
Respondents were asked to consider what their health would be using the EQ5D-5L if their food hypersensitivity were removed. The utility scores for each completed EQ5D-5L (baseline or current health) were then compared with the contingent EQ5D-5L (contingent health). Table 4 reports the calculated utility scores for the baseline health and contingent health and the mean difference between these two utility scores (= 0.06). These results show that the respondents did not feel that removing the food hypersensitivity would increase their health to a perfect score of one implying that other conditions were also affecting their self-reported current health status.
Table 4. Calculated baseline and contingent health utility score from the EQ5D-5L for adults
| Utility Score | Mean | Std. Dev. | N | min | p25 | Median | p75 | max |
|---|---|---|---|---|---|---|---|---|
| Baseline utility | 0.74 | .24 | 1426 | -.51 | .66 | .77 | .88 | 1 |
| Contingent utility | 0.8 | .24 | 1426 | -.51 | .71 | .85 | 1 | 1 |
| Difference in utility | 0.06 | .11 | 1426 | -.45 | 0 | 0 | .11 | .8 |
A small proportion of respondents (6%) reported a value for their contingent health using the EQ5D-5L that was lower than their baseline and over half of respondents reported that their health would stay the same if the FHS were removed (see Table 5).
Table 5. Percentage difference between Baseline and Contingent Health utility scores, adult EQ5D-5L
| Percentage difference | Frequency | Percent | Cum. |
|---|---|---|---|
| -100 to -50 percent | 5 | 0.35 | 0.35 |
| -50 to -25 percent | 14 | 0.99 | 1.34 |
| -25 to -10 percent | 15 | 1.06 | 2.39 |
| -10 to -0.1 percent | 52 | 3.66 | 6.06 |
| No change | 763 | 53.73 | 59.79 |
| 0.1 to 10 percent | 157 | 11.06 | 70.85 |
| 10 to 25 percent | 274 | 19.30 | 90.14 |
| 25 to 50 percent | 112 | 7.89 | 98.03 |
| 50 to 100 percent | 20 | 1.41 | 99.44 |
| +100 percent | 8 | 0.56 | 100.00 |
| Total | 1420 | 100.00 | - |
The calculated difference in utility score was also summarised when considering the values for the perceived worst or only food hypersensitivity (see Table 6). These results show that adult respondents with coeliac disease reported the biggest improvement in mean utility score when their condition was ‘removed’.
As with any economic evidence, it is up to the decision-maker using these data in their jurisdiction to make the judgement whether the magnitude of this change in health (measured on the utility scale where a value of zero represents death and one represents perfect health) is meaningful.
Table 6. Calculated difference between baseline and contingent health utility score from the EQ5D-5L for the only or worst condition for adults
| Only or Worst Condition | mean | sd | N | p25 | min | Median | p75 | max |
|---|---|---|---|---|---|---|---|---|
| Coeliac Disease | 0.06 | .11 | 601 | -.44 | 0 | 0 | .12 | .76 |
| Food Allergy | 0.05 | .11 | 385 | -.25 | 0 | 0 | .06 | .8 |
| Food Intolerance | 0.05 | .12 | 440 | -.45 | 0 | 0 | .1 | .63 |
Contingent health status using EQ-VAS
Respondents were asked to consider what their health would be using the EQ-VAS if their food hypersensitivity were removed (see Table 7). The observed mean difference in the EQ-VAS comparing contingent health with baseline health was 7.1. These scores had a highly skewed distribution (see Figure 4) and the observed median difference in the EQ-VAS comparing contingent health with baseline health was 4.
Table 7. Calculated baseline and contingent health utility score from the EQ-VAS for adults
| Utility score type | Mean | Std. Dev. | N | min | p25 | Median | p75 | max |
|---|---|---|---|---|---|---|---|---|
| Baseline VAS | 69.36 | 23.5 | 1426 | 0 | 59 | 75 | 88 | 100 |
| Contingent VAS | 77.22 | 23.49 | 1426 | 0 | 70 | 85 | 94 | 100 |
| VAS diff | 7.86 | 12.26 | 1426 | -76 | 0 | 5 | 11 | 84 |
Figure 4. Distribution of the difference in calculated baseline and contingent health utility score from the EQ-VAS for adults
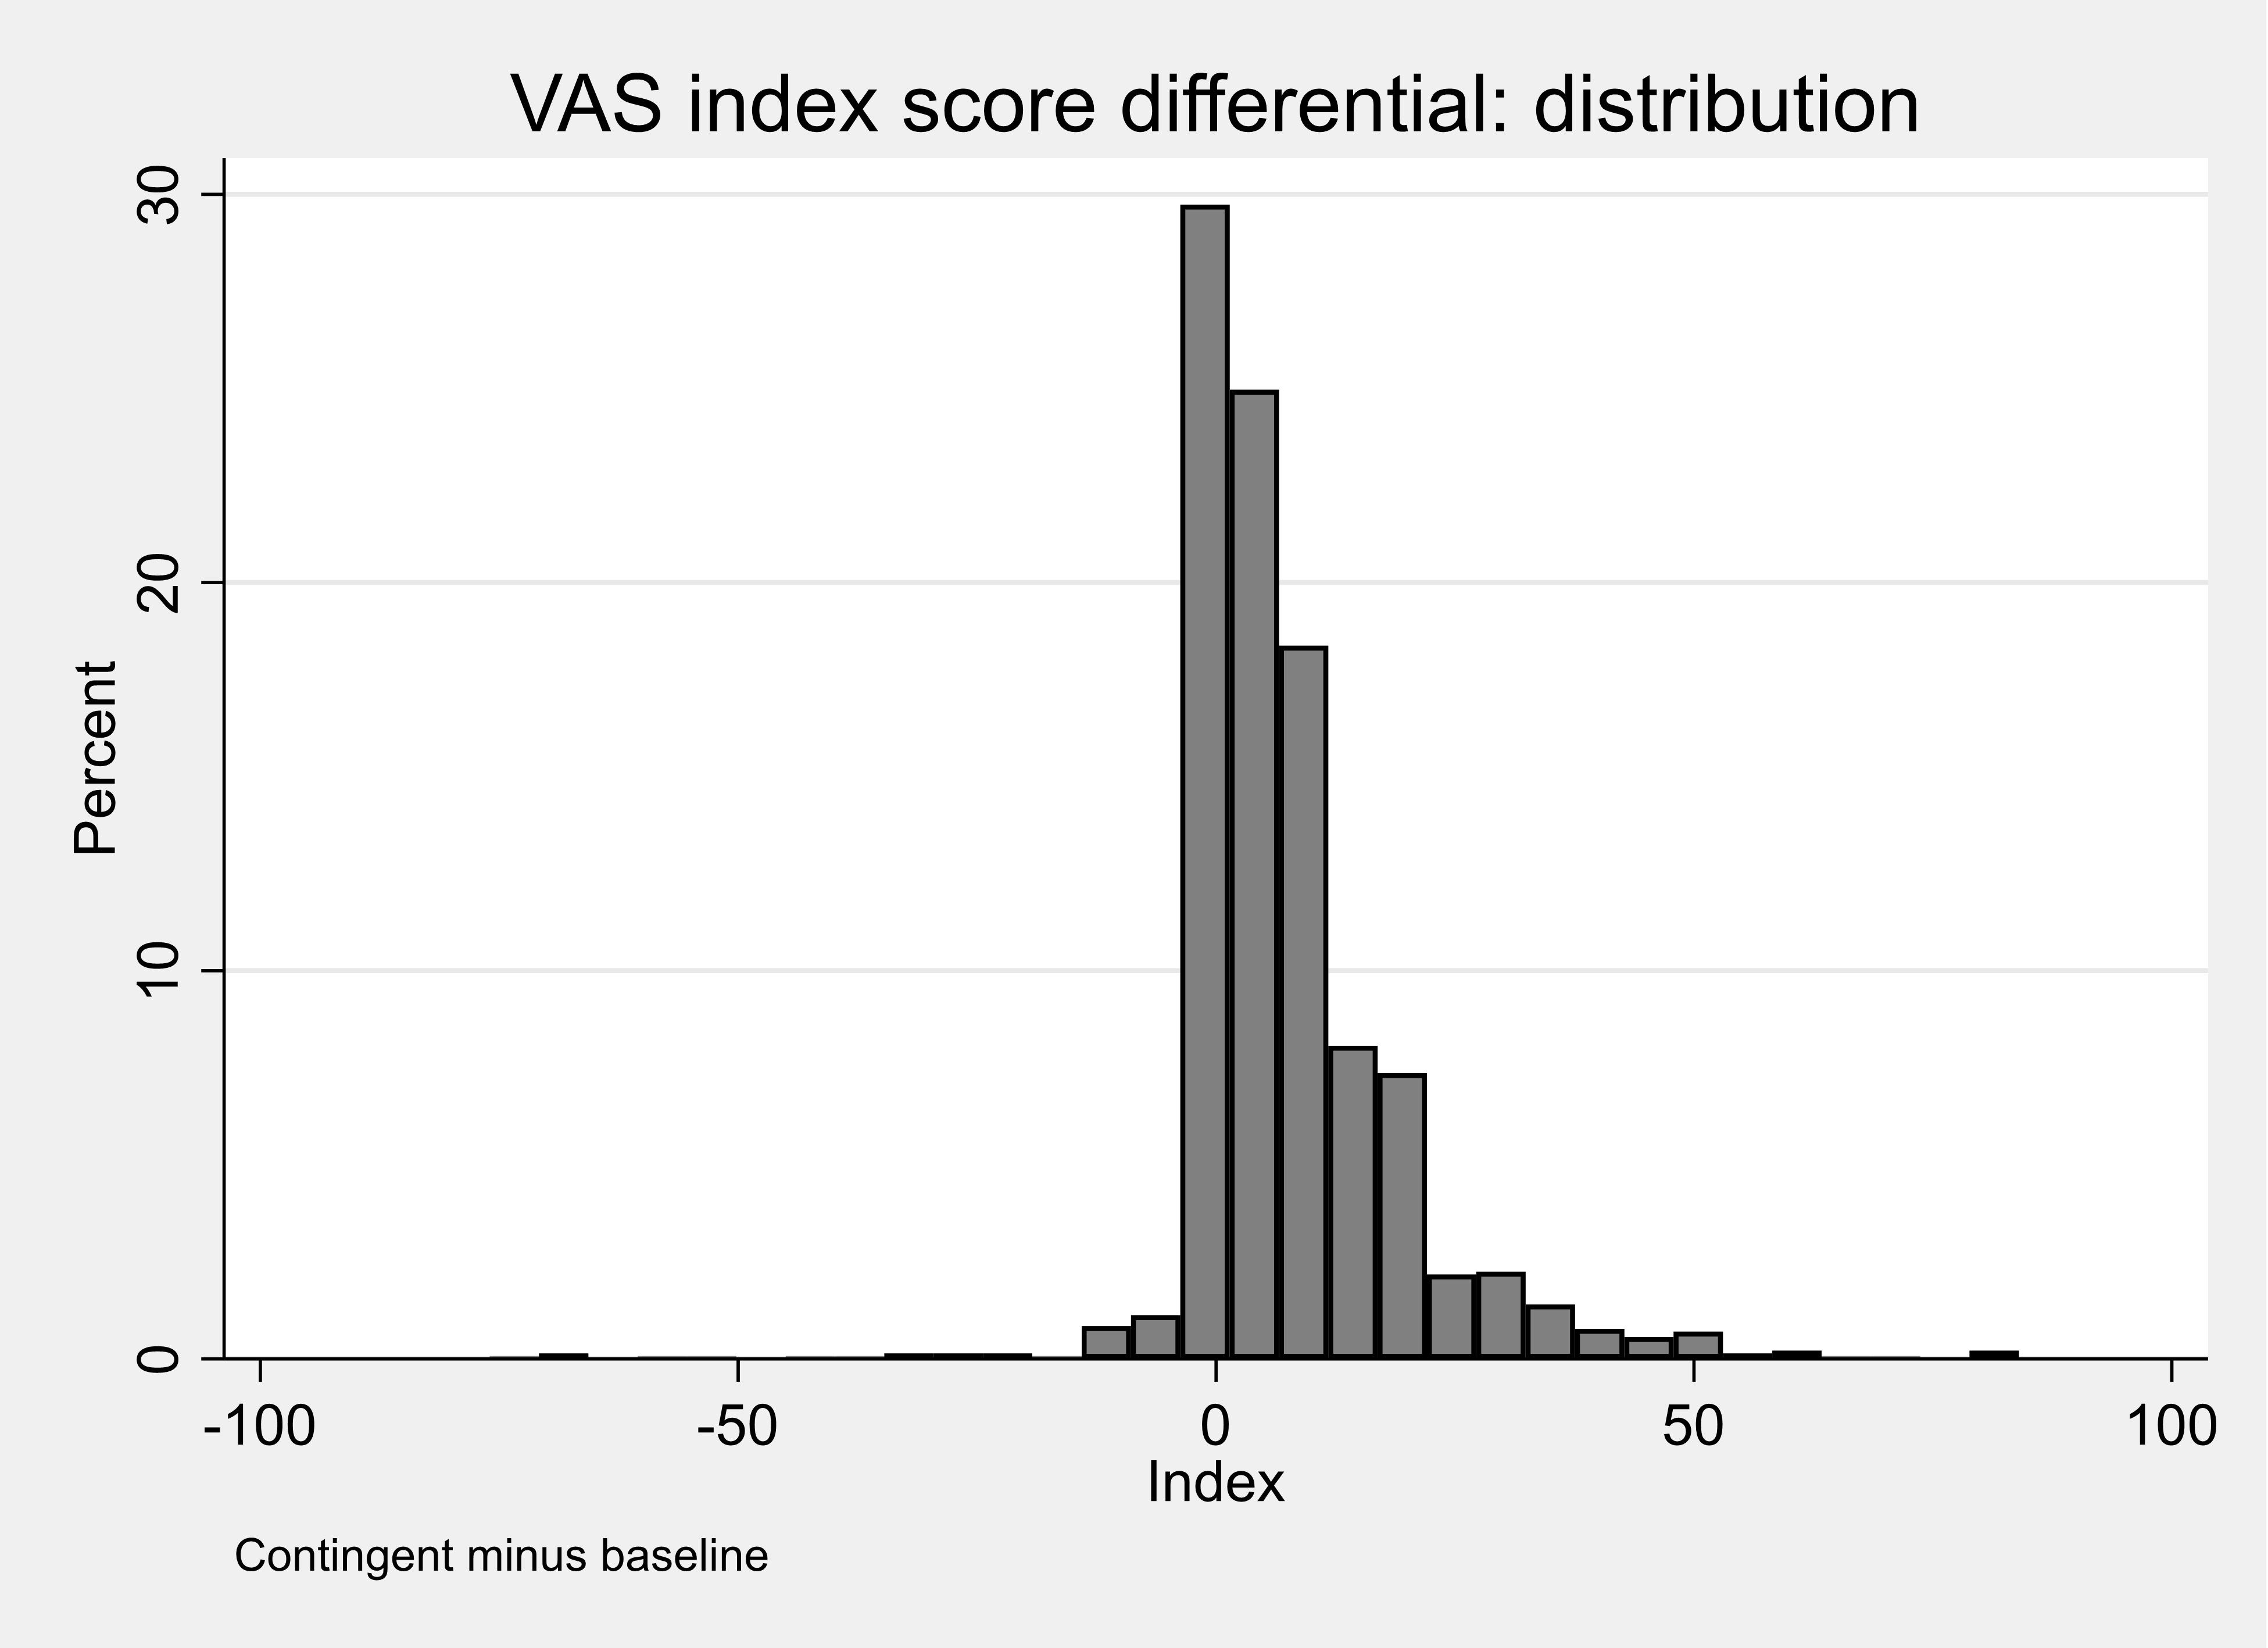
A small proportion of respondents (5%) reported a value for their contingent health using the EQ5D-5L that was lower than their baseline and one fifth of respondents reported that their health would stay the same if the food hypersensitivity were removed (see Table 10.8).
It is not informative to compare the estimates obtained from the EQ5D-5L and the EQ-VAS because these two measurement tools use different scales and different mechanisms to capture the results. A respondent completing the EQ-VAS can see and record an explicit movement on the 100-point scale. In contrast, a respondent completing the EQ5D-5L will indicate the change in health by a movement between five levels for each domain that is then translated into a utility score. It is possible to ‘nudge’ the VAS score a little higher when scoring contingent health whereas for the EQ5D the steps between 5 or 3 levels are far greater.
Table 8. Percentage difference between Baseline and Contingent VAS score, adults
| Percentage difference | Frequency | Percent | Cum. |
|---|---|---|---|
| -100 to -50 percent | 8 | 0.57 | 0.57 |
| -50 to -25 percent | 8 | 0.57 | 1.13 |
| -25 to -10 percent | 13 | 0.92 | 2.05 |
| -10 to -0.1 percent | 40 | 2.83 | 4.88 |
| No change | 203 | 21.36 | 26.24 |
| 0.1 to 10 percent | 446 | 31.54 | 57.78 |
| 10 to 25 percent | 333 | 23.55 | 81.33 |
| 25 to 50 percent | 162 | 11.46 | 92.79 |
| 50 to 100 percent | 65 | 4.60 | 97.38 |
| +100 percent | 37 | 2.62 | 100.00 |
| Total | 1414 | 100.00 | - |
The calculated difference in score using the EQ-VAS was also estimated when considering the values for the perceived worst or only FHS (see Table 9). These results show that adult respondents with food intolerance reported the biggest improvement (8.25) in mean utility score when their condition was ‘removed’.
Table 9. Calculated difference between adults’ baseline and contingent health utility score from the EQ-VAS, by condition.
Coeliac Disease
| Utility score | mean | sd | N | min | p25 | Median | p75 | max |
|---|---|---|---|---|---|---|---|---|
| Baseline VAS | 72.53 | 23.91 | 601 | 0 | 65 | 80 | 90 | 100 |
| Contingent VAS | 80.53 | 24.05 | 601 | 0 | 79 | 90 | 95 | 100 |
| VAS diff | 8 | 12.2 | 601 | -76 | 0 | 5 | 11 | 84 |
Food Allergy
| Utility score | mean | sd | N | min | p25 | Median | p75 | max |
|---|---|---|---|---|---|---|---|---|
| Baseline VAS | 69.68 | 22.76 | 385 | 0 | 56 | 75 | 88 | 100 |
| Contingent VAS | 76.85 | 22.27 | 385 | 0 | 70 | 82 | 93 | 100 |
| VAS diff | 7.17 | 11.29 | 385 | -33 | 0 | 4 | 10 | 64 |
Food Intolerance
| Utility score | mean | sd | N | min | p25 | Median | p75 | max |
|---|---|---|---|---|---|---|---|---|
| Baseline VAS | 64.76 | 22.85 | 440 | 0 | 50 | 70 | 81 | 100 |
| Contingent VAS | 73.01 | 23.1 | 440 | 0 | 61 | 80 | 90 | 100 |
| VAS diff | 8.25 | 13.14 | 440 | -70 | 1 | 5 | 12 | 82 |
Appendix J Figures 2 and 3 are scatterplots of calculated baseline and contingent health utility score from the EQ5D-5 L for adults (Appendix J Figure 2) and from the EQ-VAS (Appendix J Figure 3). These plots suggest a stronger level of association between the VAS Scores than there is between the EQ-5D-5L Utility scores. For this reason, the contingent improvement in EQ-VAS scores were used in the estimated aggregate models, where a common measure of condition is required.
Child results: EQ5D-3L (proxy) and EQ-VAS
Table 10 reports the mean utility score representing the health of the child as reported by the parents estimated from the EQ5D-3L (proxy). These utility scores were generated from the levels for each completed EQ5D shown in Appendix J.
Table 10. Summary statistics for the calculated utility score from EQ5D-3L (proxy) for children.
| Utility Score | Mean | Std. Dev. | N | min | p25 | Median | p75 | Max |
|---|---|---|---|---|---|---|---|---|
| EQ5D index | 0.86 | .14 | 592 | .52 | .77 | .88 | 1 | 1 |
Figure 5 shows the distribution of the utility scores for the population of children as rated by their parents. This Figure shows that over two-fifths of parent’s rated the health of their child to be ‘perfect’ despite living with a FHS.
Figure 5. Distribution of utility scores representing the current health of children as valued by parents
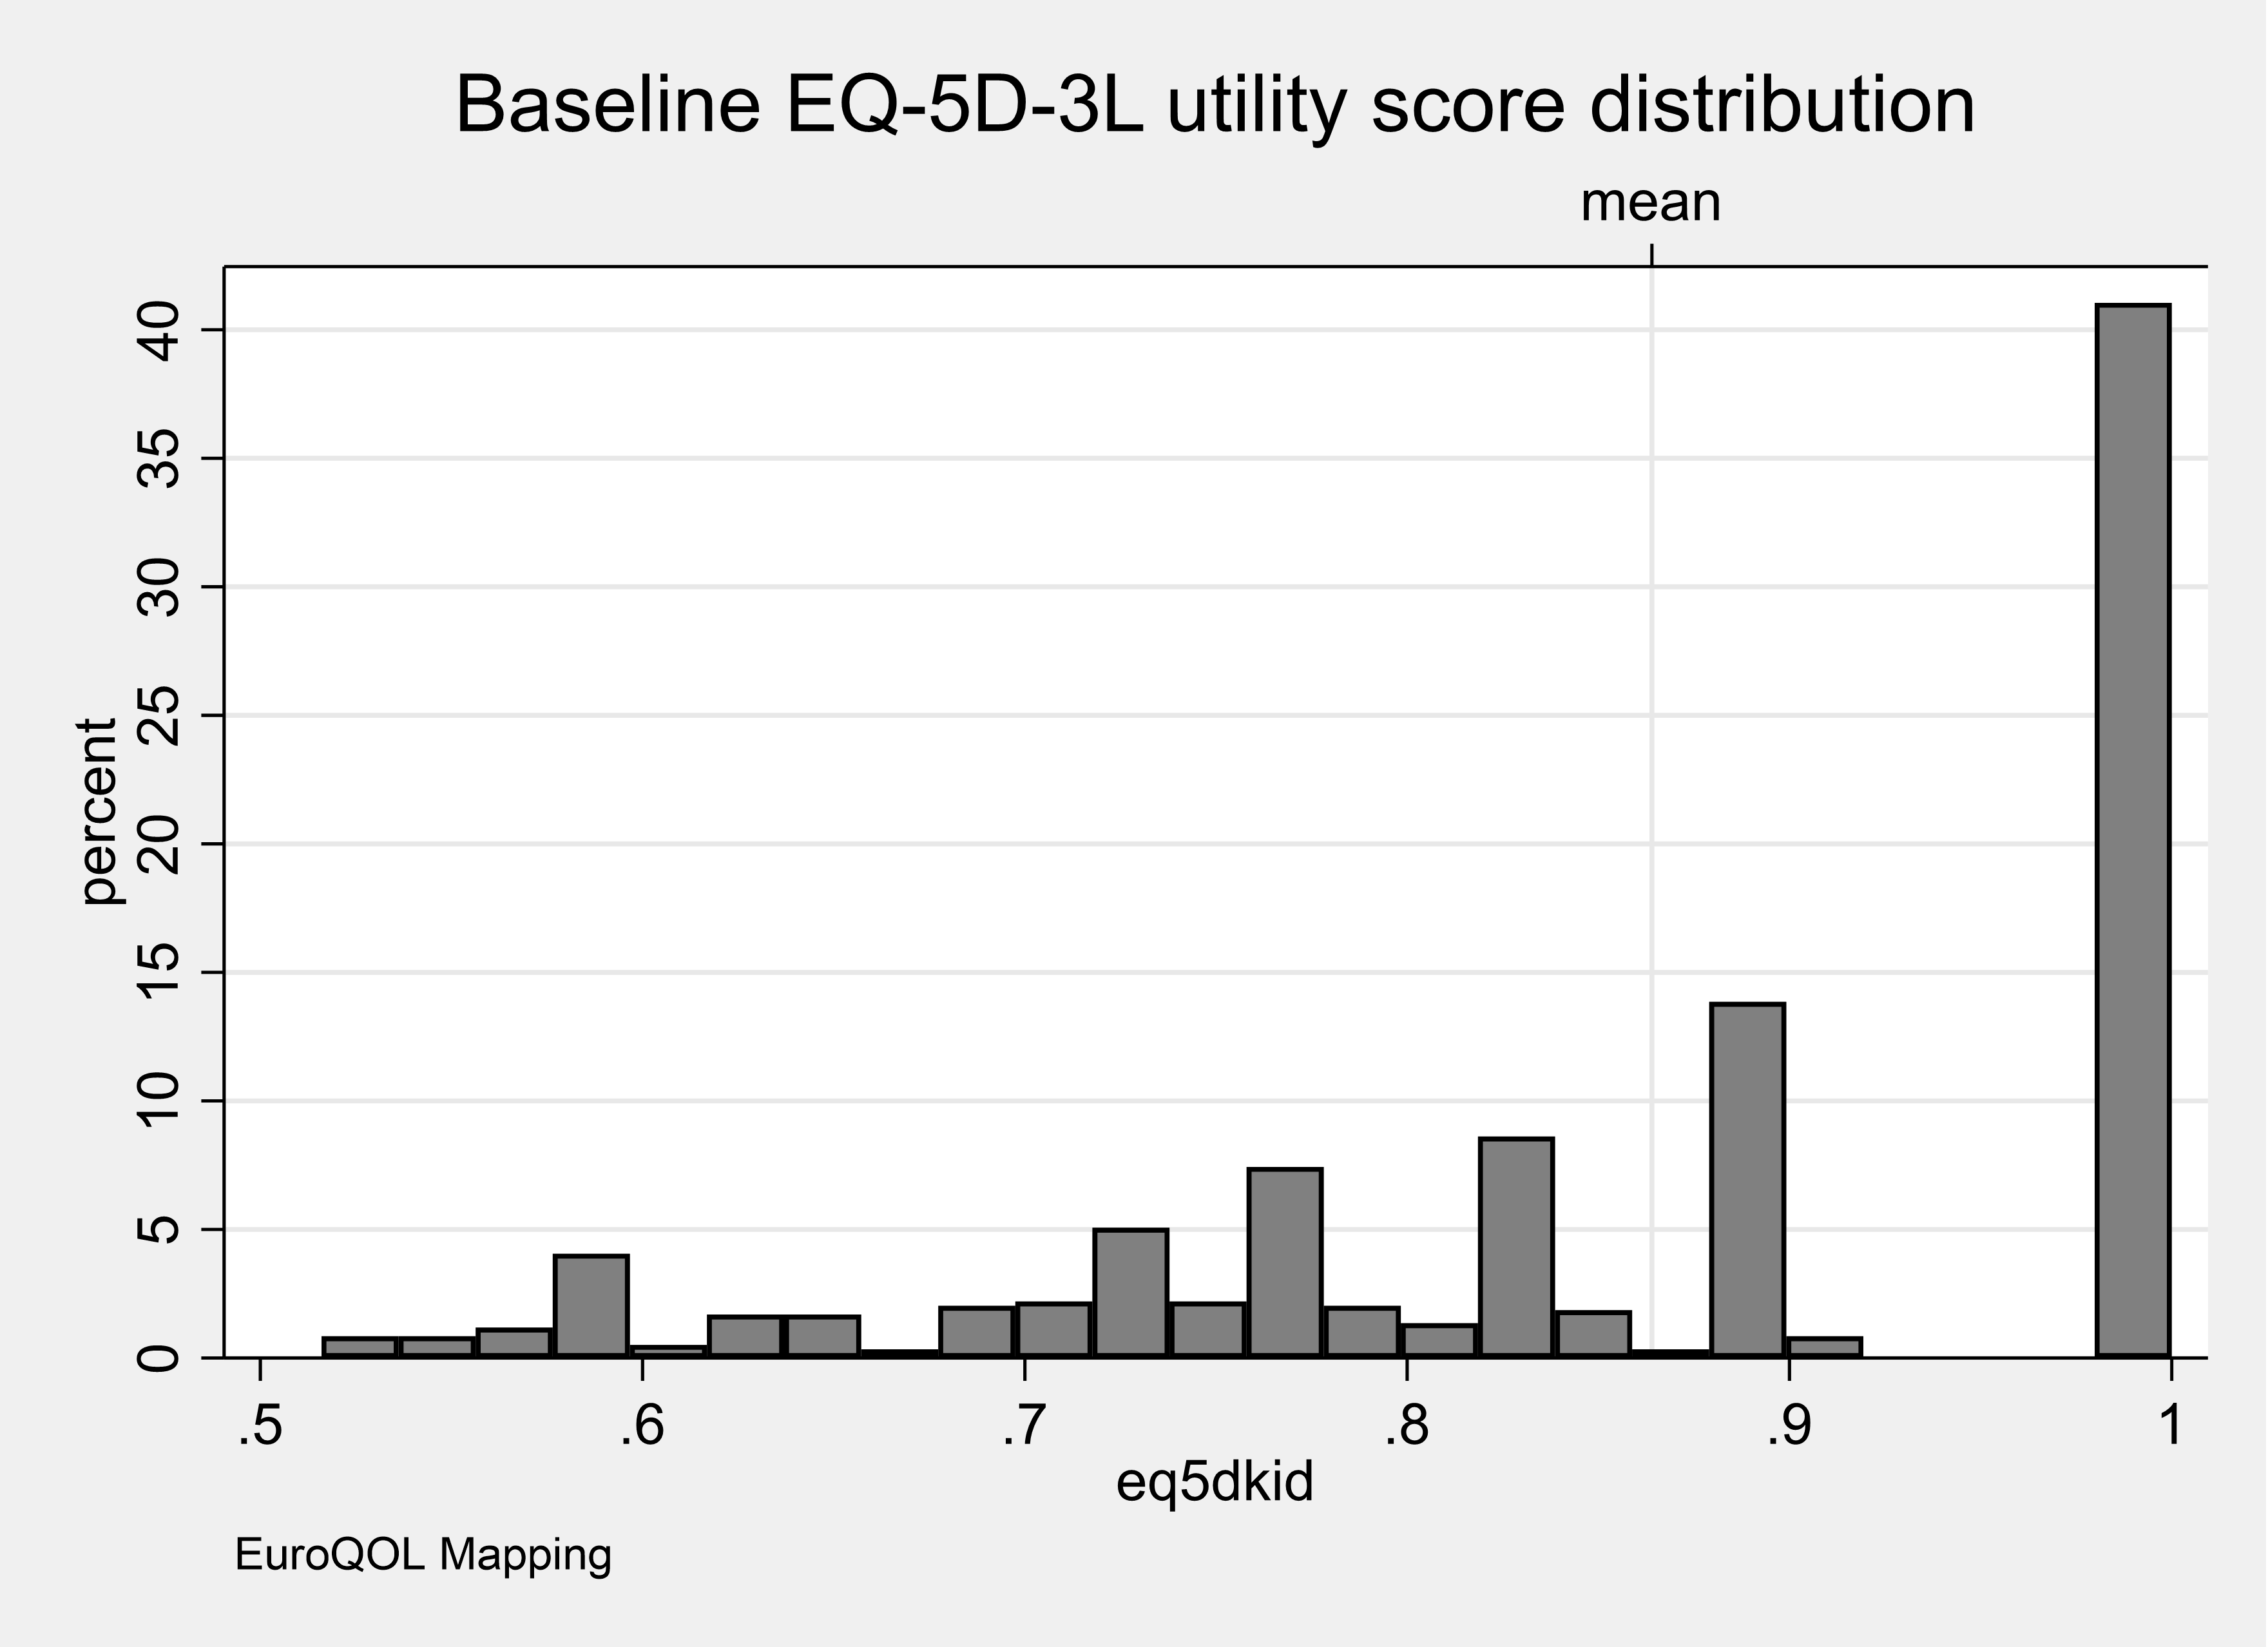
Parents were asked to identify the FHS that had the most substantial impact on their child. Table 11 reports the mean utility score representing the health of the respondents estimated from the EQ5D-3L (proxy) for each category of FHS. These utility scores were generated from the levels for each completed EQ5D shown in Appendix J.
Table 11. Summary statistics for the calculated utility score from EQ5D-3L(proxy) for a child for the worst or only FHS
| Only or Worst Condition | mean | sd | N | min | p25 | Median | p75 | max |
|---|---|---|---|---|---|---|---|---|
| Coeliac Disease | 0.81 | .16 | 67 | .56 | .62 | .84 | 1 | 1 |
| Food Allergy | 0.88 | .13 | 400 | .52 | .78 | .88 | 1 | 1 |
| Food Intolerance | 0.84 | .13 | 125 | .52 | .77 | .84 | 1 | 1 |
Figure 6 shows the distribution of the utility scores for the values rated by the parents for each category of FHS for the worst condition only. This Figure shows that over two-fifths of parents rated the health of their child living with a food allergy to be ‘perfect’ despite living with a FHS. In contrast, only around one-quarter of parents rated their child’s health to be ‘perfect’ if they were living with coeliac disease or food intolerance. This supports the view that the EQ-5D instrument may not be capturing features of the condition that influence quality of life (see Jansson et al,. 2013).
Figure 6. Distribution of utility scores representing the current health of a child for the worst or only FHS as valued by a parent.
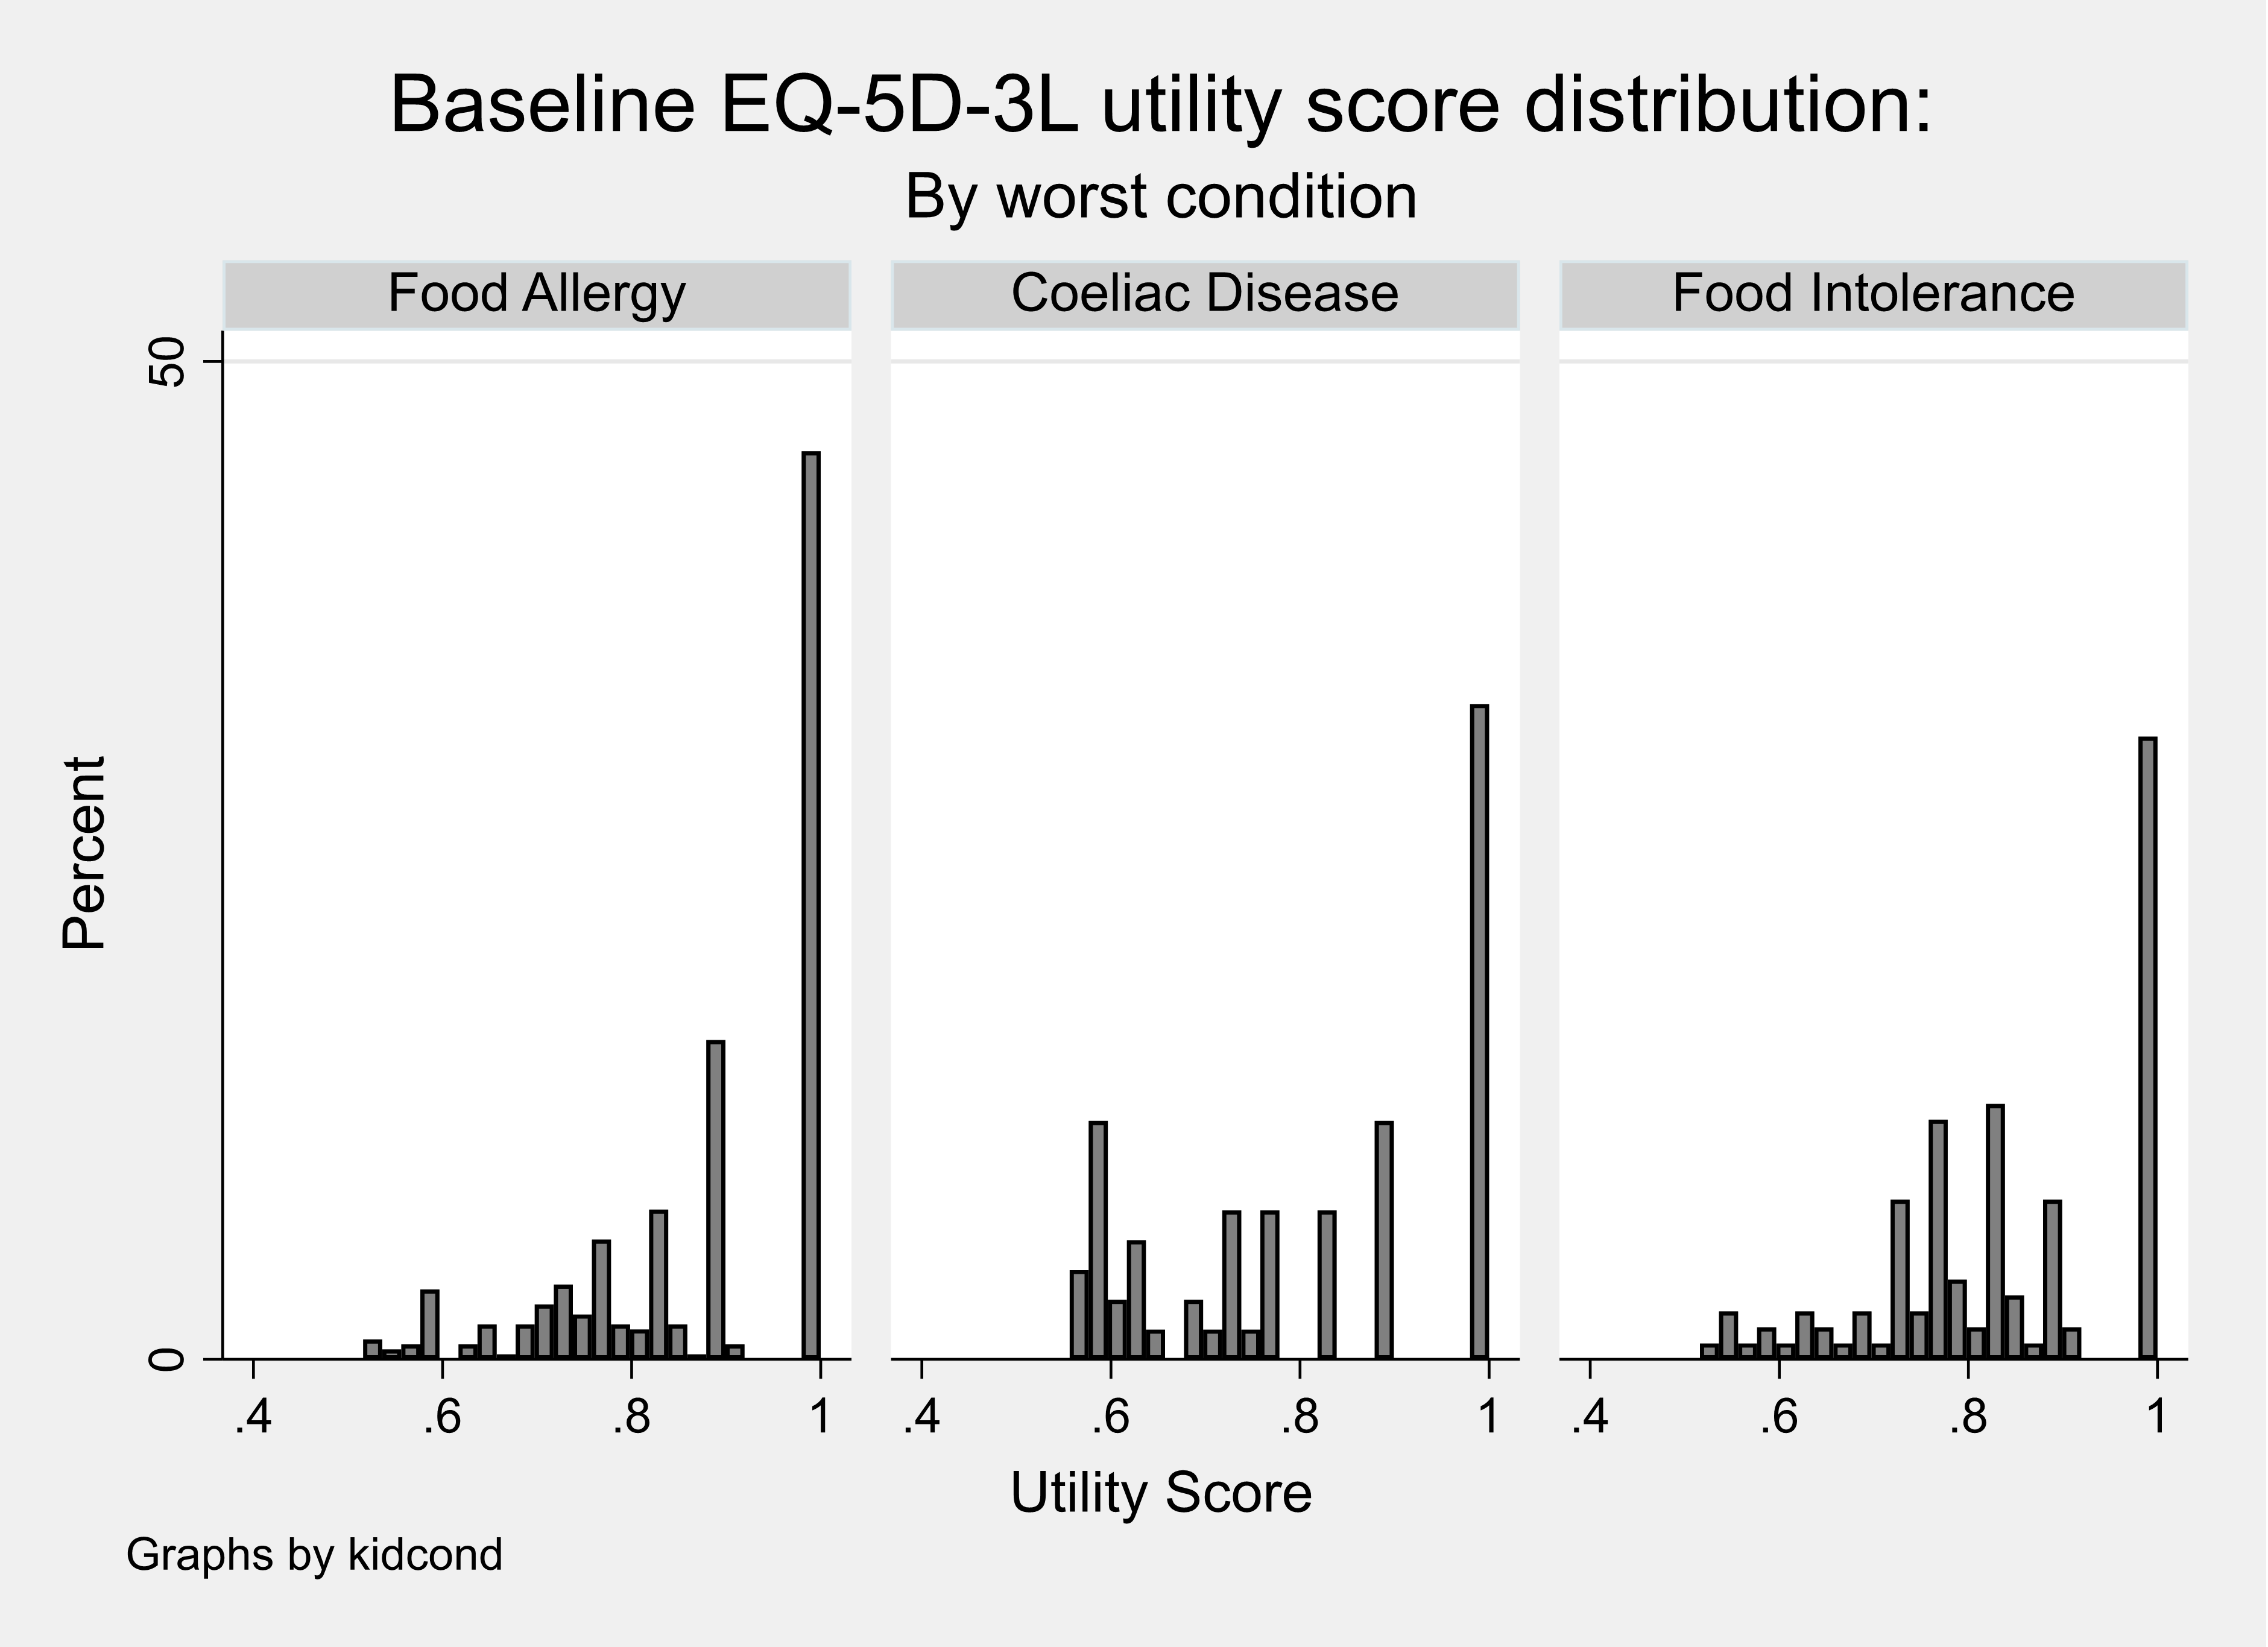
Table 12 reports the mean utility score representing the health of the child as rated by their parent estimated from the EQ5D-3L (proxy) living with one FHS and also multiple FHS.
Table 12. Summary statistics for the calculated utility score from EQ5D-3L (proxy) child with one or multiple conditions.
| Condition | Mean | sd | N | min | p25 | Median | p75 | max |
|---|---|---|---|---|---|---|---|---|
| Coeliac Disease | 0.81 | .17 | 56 | .52 | .62 | .84 | 1 | 1 |
| Food Allergy | 0.89 | .13 | 351 | .52 | .81 | .88 | 1 | 1 |
| Food Intolerance | 0.85 | .13 | 115 | .55 | .77 | .84 | 1 | 1 |
| Multiple | 0.79 | .14 | 70 | .55 | .71 | .78 | .88 | 1 |
Figure 7 shows the distribution of the utility scores for a child living with one FHS or multiple FHS as rated by a parent. This Figure shows that a lower proportion (~20%) of parents of a child living with multiple rather than one FHS rated their health to be ‘perfect’ despite living with a FHS.
Figure 7. Distribution of utility scores representing the current health of a child with one or multiple conditions.
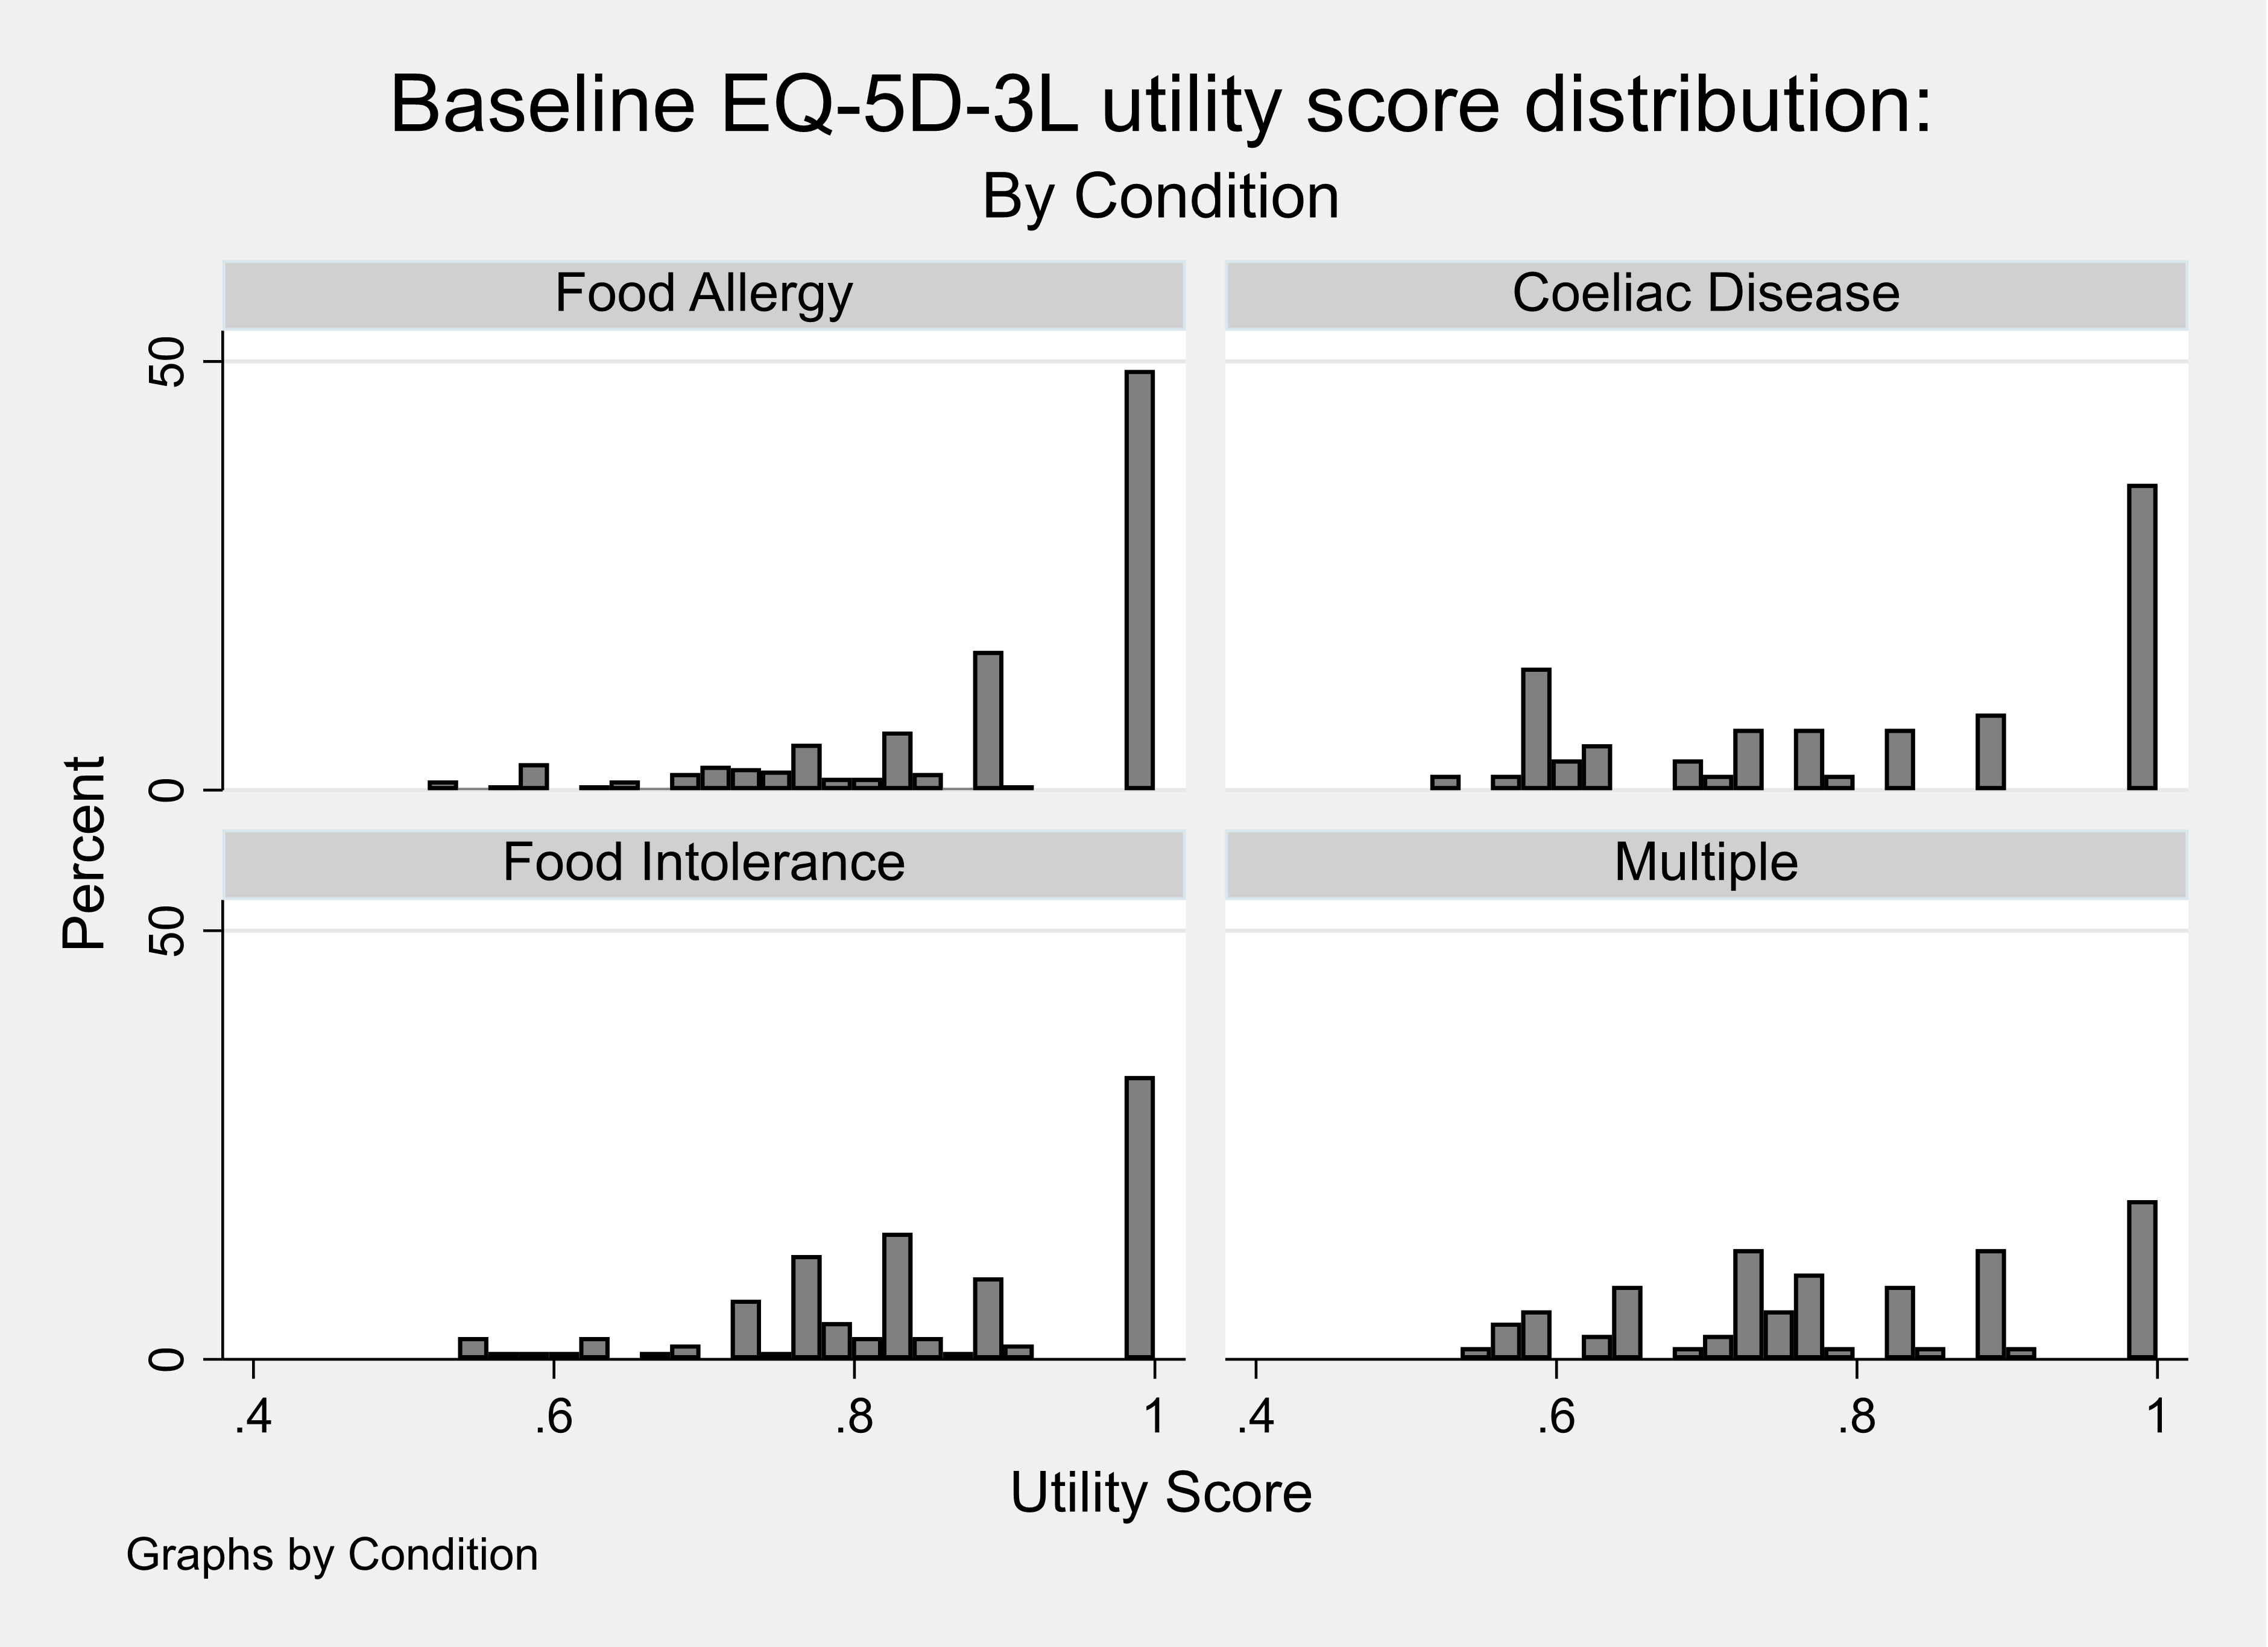
Child results: Contingent health status using EQ5D-3L (proxy)
Parents were asked to consider what the health of their child would be using the EQ5D-3L (proxy) if their FHS were removed. The utility scores for baseline and contingent EQ5D-3L scores, and the difference between them (‘EQ5D diff’), were calculated. Table 13 reports the calculated utility scores for the baseline health and contingent health. These results show that the parents did not feel that removing the FHS would increase their health to a perfect score of one implying that other conditions were also affecting the proxy reported current health status.
Table 13. Calculated baseline and contingent health utility score from the EQ5D-3L (proxy)
| Score Type | Mean | Std. Dev. | N | min | p25 | Median | p75 | max |
|---|---|---|---|---|---|---|---|---|
| Baseline Utility | 0.86 | .14 | 592 | .52 | .77 | .88 | 1 | 1 |
| Contingent Utility | 0.91 | .14 | 592 | .52 | .84 | 1 | 1 | 1 |
| EQ5D index | 0.04 | .1 | 592 | -.41 | 0 | 0 | .12 | .43 |
A proportion of parents (10%) reported a value for the contingent health of their child using the EQ5D-3L that was lower than their baseline and over half of parents reported that the health of their child would stay the same if the FHS were removed (see Table 14).
Table 14. Calculated Utility score for contingent health minus baseline health for a child from EQ5D-3L (proxy)
| Utility Score | Frequency | Percent | Cum. |
|---|---|---|---|
| -100 to -50 percent | 2 | 0.34 | 0.34 |
| -50 to -25 percent | 4 | 0.68 | 1.01 |
| -25 to -10 percent | 25 | 4.22 | 5.24 |
| -10 to -0.1 percent | 29 | 4.90 | 10.14 |
| No change | 318 | 53.72 | 63.85 |
| 0.1 to 10 percent | 43 | 7.26 | 71.11 |
| 10 to 25 percent | 144 | 24.32 | 95.44 |
| 25 to 50 percent | 27 | 4.56 | 100.00 |
| Total | 592 | 100.00 | - |
The calculated difference in utility score was also summarised when considering the values for the perceived worst or only FHS (see Table 15). These results show that children with coeliac disease were estimated to experience the biggest improvement in mean utility score when their condition was ‘removed’ although the values are very similar across the three conditions.
Table 15. Calculated difference between baseline and contingent health utility score from the EQ5D-3L for the only or worst condition for children
| Only or Worst Condition | mean | sd | N | min | p25 | Median | p75 | max |
|---|---|---|---|---|---|---|---|---|
| Coeliac Disease | 0.06 | .11 | 601 | -.44 | 0 | 0 | .12 | .76 |
| Food Allergy | 0.05 | .11 | 385 | -.22 | 0 | 0 | .06 | .8 |
| Food Intolerance | 0.05 | .12 | 440 | -.45 | 0 | 0 | .1 | .63 |
Child results: Contingent health status using EQ-VAS (proxy)
Parents were asked to consider what the health of their child would be using the EQ-VAS if their FHS were removed (see Table 16). The observed mean difference in the EQ-VAS comparing contingent health with baseline health was 8.4. These scores had a highly skewed distribution (see Figure 8) and the observed median difference in the EQ-VAS comparing contingent health with baseline health was 6.
Table 16. Calculated baseline and contingent health utility score from the EQ-VAS (proxy)
| Calculated Score | Mean | Std. Dev. | N | min | p25 | Median | p75 | max |
|---|---|---|---|---|---|---|---|---|
| Baseline VAS | 77.64 | 19.88 | 592 | 0 | 68 | 81 | 92 | 100 |
| Contingent VAS | 86 | 18.95 | 592 | 0 | 80 | 94 | 100 | 100 |
| VAS diff | 8.36 | 15.64 | 592 | -100 | 0 | 6 | 14 | 89 |
Figure 8. Distribution of the difference in calculated baseline and contingent health utility score from the EQ-VAS (proxy)
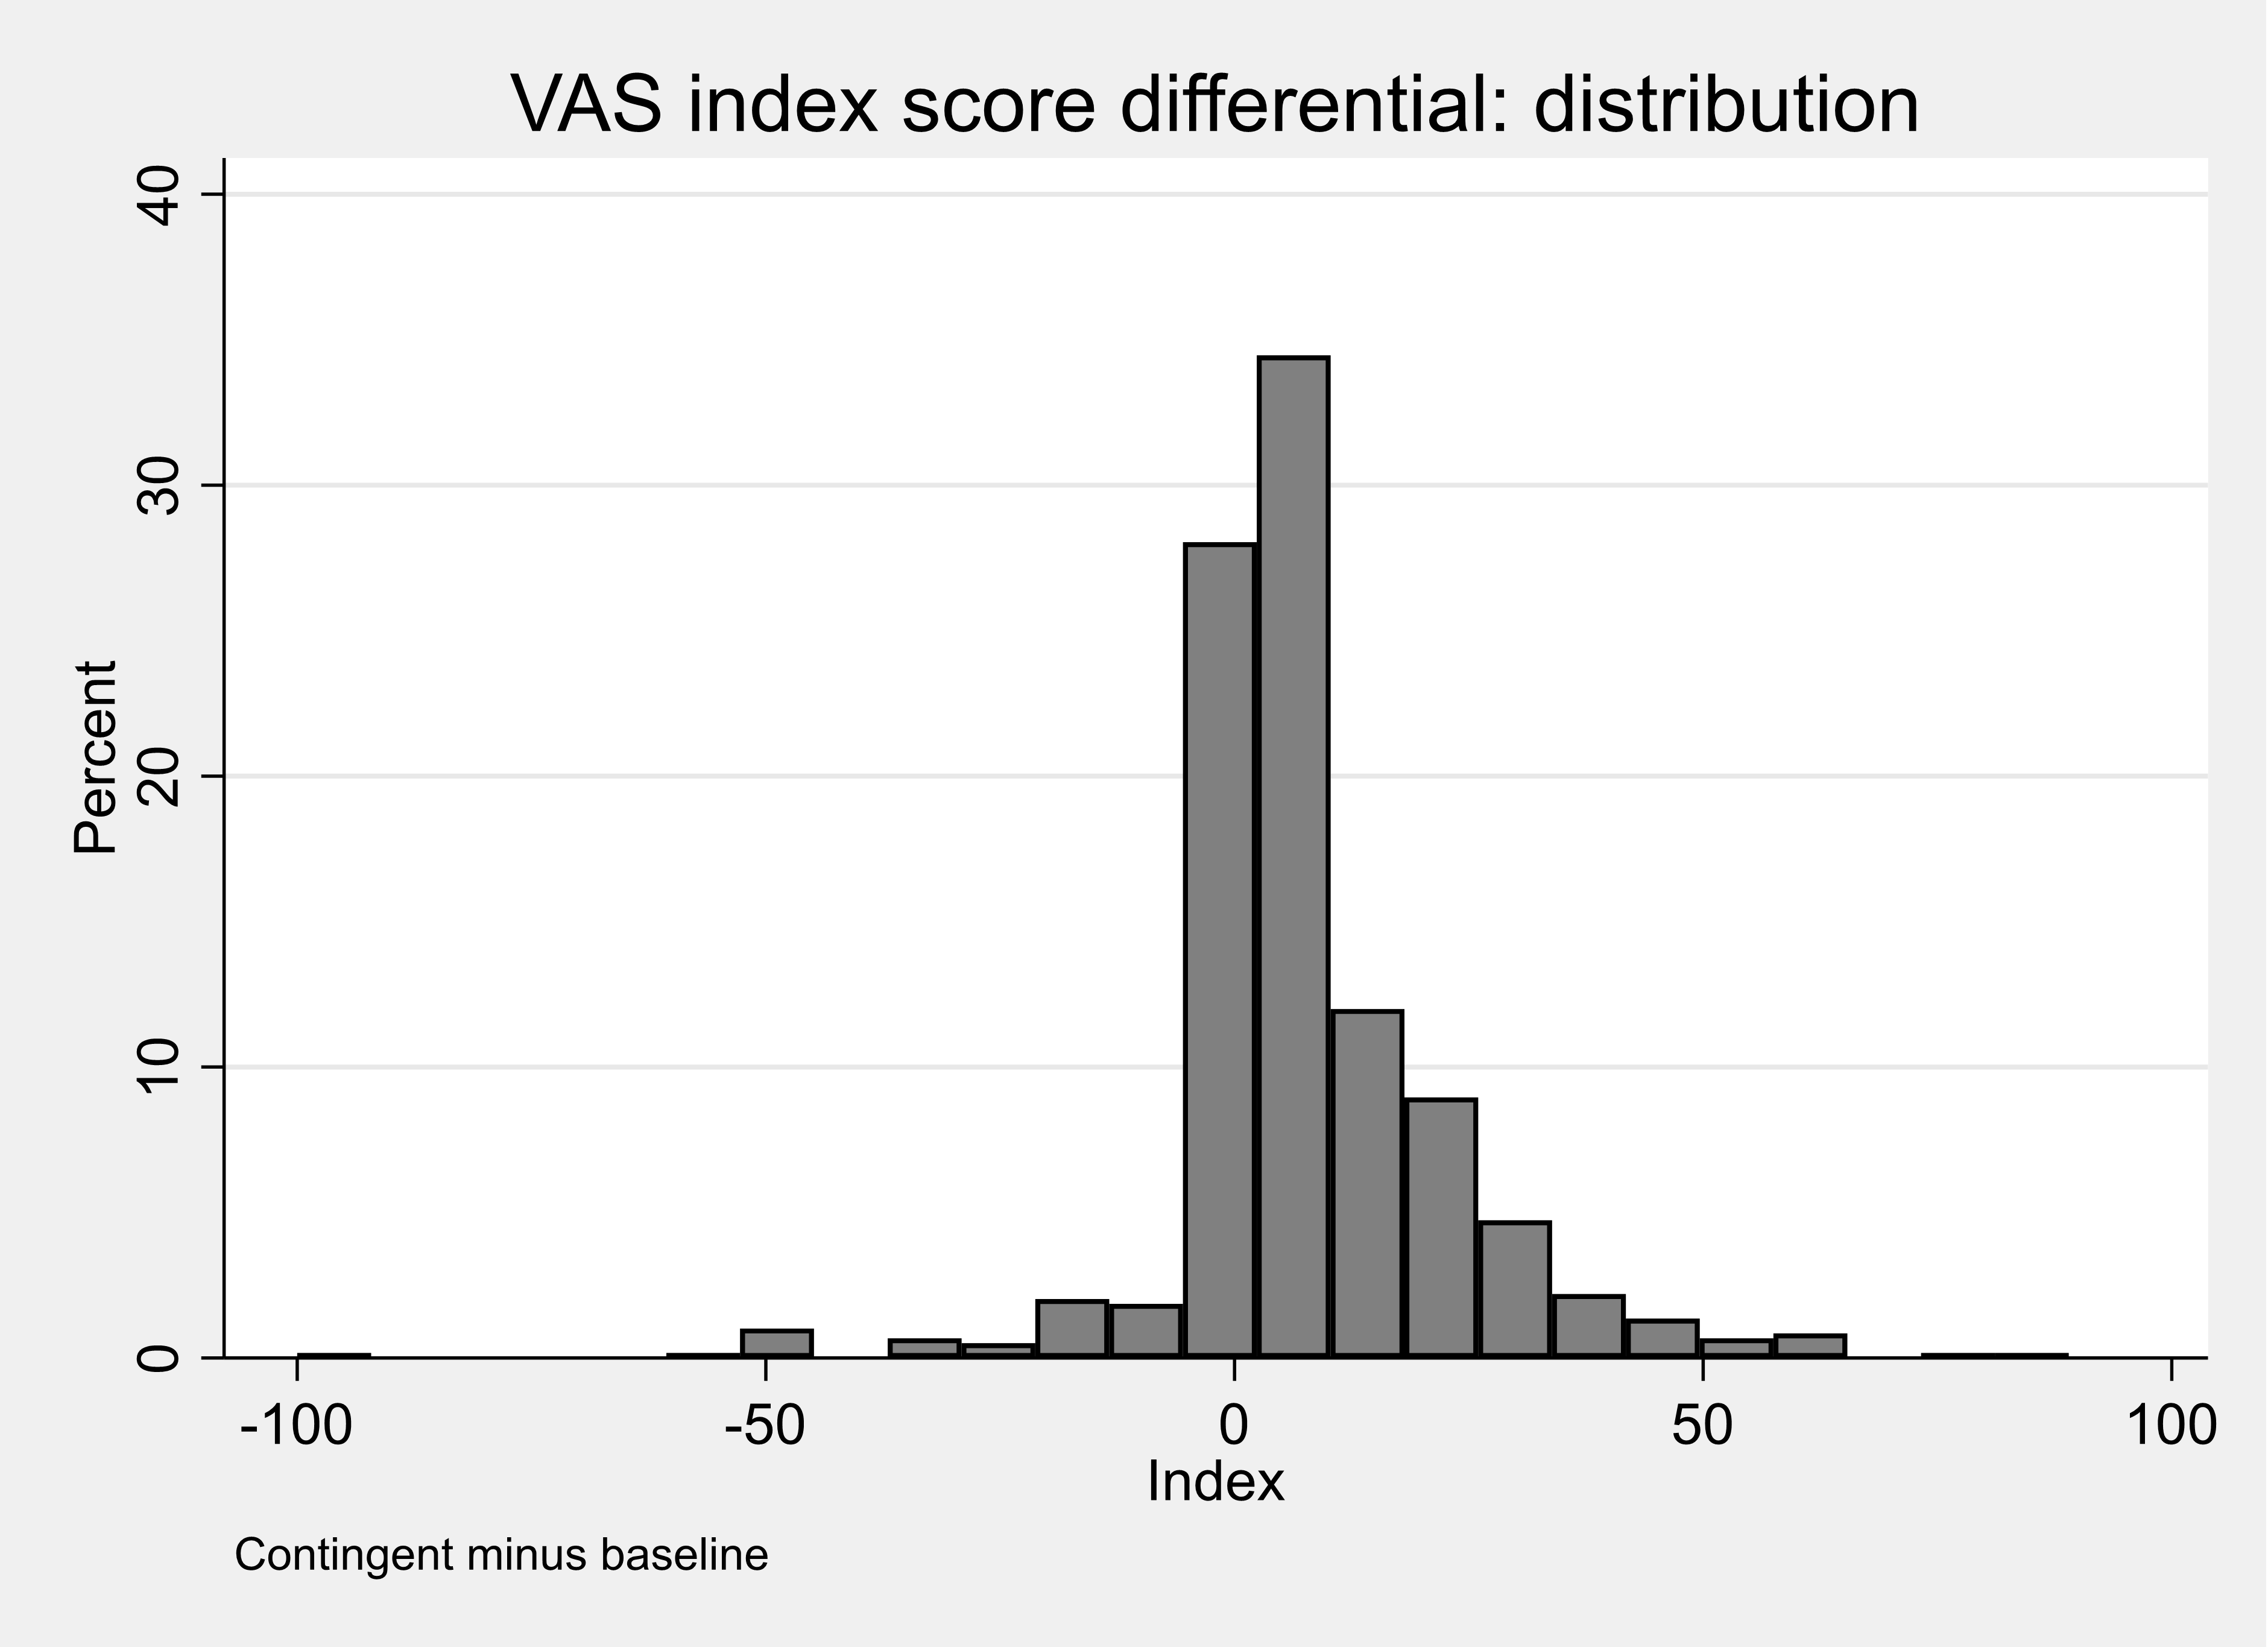
A proportion of parents (8%) reported a proxy value for the contingent health of their child using the EQ5D-3L that was lower than their baseline and less than one fifth of parents reported that the health of their child would stay the same if the FHS were removed (see Table 17).
Table 17. Percentage difference between baseline and contingent child health score from the VASEQ-VAS
| Percentage Difference | Frequency | Percent | Cum. |
|---|---|---|---|
| -100 to -50 percent | 9 | 1.53 | 1.53 |
| -50 to -25 percent | 10 | 1.70 | 3.23 |
| -25 to -10 percent | 15 | 2.55 | 5.78 |
| -10 to -0.1 percent | 13 | 2.21 | 7.99 |
| No change | 100 | 17.01 | 25.00 |
| 0.1 to 10 percent | 180 | 30.61 | 55.61 |
| 10 to 25 percent | 148 | 25.17 | 80.78 |
| 25 to 50 percent | 67 | 11.39 | 92.18 |
| 50 to 100 percent | 27 | 4.59 | 96.77 |
| +100 percent | 19 | 3.23 | 100.00 |
| Total | 588 | 100.00 | - |
The calculated difference in score using the EQ-VAS (proxy) was also summarised when parents considered the values for the perceived worst FHS or only FHS (see Table 18). These results show that parents of a child with coeliac disease reported the biggest improvement in mean utility score when their condition was ‘removed’.
Table 18. Baseline and contingent health utility scores from the EQ-VAS (proxy) for the only or worst condition
Coeliac Disease
| Utility score | mean | sd | N | min | p25 | Median | p75 | max |
|---|---|---|---|---|---|---|---|---|
| Baseline VAS | 75.09 | 20.02 | 67 | 34 | 60 | 77 | 93 | 100 |
| Contingent VAS | 87.51 | 20.39 | 67 | 3 | 85 | 96 | 100 | 100 |
| VAS diff | 12.42 | 15.42 | 67 | -31 | 1 | 8 | 20 | 60 |
Food Allergy
| Utility score | mean | sd | N | min | p25 | Median | p75 | max |
|---|---|---|---|---|---|---|---|---|
| Baseline VAS | 80.14 | 18.26 | 400 | 0 | 71.5 | 85 | 94 | 100 |
| Contingent VAS | 87.66 | 16.64 | 400 | 0 | 81.5 | 95 | 100 | 100 |
| VAS diff | 7.52 | 15.07 | 400 | -100 | 0 | 5 | 13 | 64 |
Food Intolerance
| Utility score | mean | sd | N | min | p25 | Median | p75 | max |
|---|---|---|---|---|---|---|---|---|
| Baseline VAS | 70.97 | 22.99 | 125 | 0 | 61 | 72 | 90 | 100 |
| Contingent VAS | 79.87 | 23.49 | 125 | 0 | 71 | 90 | 99 | 100 |
| VAS diff | 8.9 | 17.23 | 125 | -45 | 1 | 6 | 14 | 89 |
Appendix J Figures 5 and 6 are scatter plots of calculated baseline and contingent health utility score from the proxy EQ5D-3L for children (Appendix J Figure 5) and from the EQ-VAS (Appendix J Figure 6). These plots suggest a weaker level of association between the VAS Scores than there is between the EQ-5D-3L Utility scores.
Table 1. Adult respondents reporting the domain level for each FHS and for multiple FHS
| Domain | Level | % of respondents reporting: Food Allergy | % of respondents reporting: Coeliac Disease | % of respondents reporting: Food Intolerance | % of respondents reporting: Multiple | % of respondents reporting: Total |
|---|---|---|---|---|---|---|
| Mobility | 1 | 69.34 | 77.36 | 60.55 | 52.33 | 66.62 |
| Mobility | 2 | 17.15 | 15.94 | 19.45 | 27.60 | 19.35 |
| Mobility | 3 | 7.66 | 4.13 | 13.42 | 12.54 | 8.84 |
| Mobility | 4 | 5.47 | 2.36 | 6.30 | 7.17 | 4.91 |
| Mobility | 5 | 0.36 | 0.20 | 0.27 | 0.36 | 0.28 |
| Selfcare | 1 | 85.04 | 94.88 | 78.08 | 77.06 | 85.20 |
| Selfcare | 2 | 5.47 | 3.15 | 13.15 | 13.62 | 8.20 |
| Selfcare | 3 | 7.66 | 1.57 | 6.85 | 8.24 | 5.40 |
| Selfcare | 4 | 1.09 | 0.39 | 1.92 | 1.08 | 1.05 |
| Selfcare | 5 | 0.73 | 0.00 | 0.00 | 0.00 | 0.14 |
| Usual Activity | 1 | 65.33 | 71.65 | 56.44 | 43.01 | 60.94 |
| Usual Activity | 2 | 17.15 | 19.29 | 23.84 | 29.03 | 21.95 |
| Usual Activity | 3 | 10.95 | 6.89 | 12.60 | 18.28 | 11.36 |
| Usual Activity | 4 | 4.01 | 2.17 | 6.85 | 8.96 | 5.05 |
| Usual Activity | 5 | 2.55 | 0.00 | 0.27 | 0.72 | 0.70 |
| Pain | 1 | 55.84 | 66.34 | 47.95 | 44.80 | 55.40 |
| Pain | 2 | 23.36 | 25.00 | 29.04 | 29.39 | 26.58 |
| Pain | 3 | 14.60 | 6.50 | 15.34 | 16.85 | 12.34 |
| Pain | 4 | 4.74 | 1.57 | 4.93 | 7.17 | 4.14 |
| Pain | 5 | 1.46 | 0.59 | 2.74 | 1.79 | 1.54 |
| Anxiety | 1 | 43.43 | 52.56 | 42.74 | 35.13 | 44.88 |
| Anxiety | 2 | 27.74 | 33.27 | 28.49 | 37.63 | 31.84 |
| Anxiety | 3 | 18.61 | 11.02 | 17.26 | 21.15 | 16.06 |
| Anxiety | 4 | 8.03 | 2.56 | 7.40 | 5.38 | 5.40 |
| Anxiety | 5 | 2.19 | 0.59 | 4.11 | 0.72 | 1.82 |
Table 2. Adult respondents reporting the domain level for the worst FHS or only FHS
| Domain | Level | % of respondents reporting: Food Allergy | % of respondents reporting: Coeliac Disease | % of respondents reporting: Food Intolerance | % of respondents reporting: Multiple |
|---|---|---|---|---|---|
| Mobility | 1 | 65.19 | 73.88 | 57.95 | 66.62 |
| Mobility | 2 | 20.00 | 17.97 | 20.68 | 19.35 |
| Mobility | 3 | 8.05 | 5.32 | 14.32 | 8.84 |
| Mobility | 4 | 6.49 | 2.50 | 6.82 | 4.91 |
| Mobility | 5 | 0.26 | 0.33 | 0.23 | 0.28 |
| Selfcare | 1 | 83.64 | 93.01 | 75.91 | 85.20 |
| Selfcare | 2 | 7.27 | 4.33 | 14.32 | 8.20 |
| Selfcare | 3 | 7.27 | 2.16 | 8.18 | 5.40 |
| Selfcare | 4 | 1.30 | 0.50 | 1.59 | 1.05 |
| Selfcare | 5 | 0.52 | 0.00 | 0.00 | 0.14 |
| Usual Activity | 1 | 60.52 | 67.22 | 52.73 | 60.94 |
| Usual Activity | 2 | 20.00 | 21.30 | 24.55 | 21.95 |
| Usual Activity | 3 | 12.47 | 8.99 | 13.64 | 11.36 |
| Usual Activity | 4 | 5.19 | 2.33 | 8.64 | 5.05 |
| Usual Activity | 5 | 1.82 | 0.17 | 0.45 | 0.70 |
| Pain | 1 | 53.25 | 63.06 | 46.82 | 55.40 |
| Pain | 2 | 25.71 | 26.62 | 27.27 | 26.58 |
| Pain | 3 | 14.55 | 7.82 | 16.59 | 12.34 |
| Pain | 4 | 4.68 | 2.00 | 6.59 | 4.14 |
| Pain | 5 | 1.82 | 0.50 | 2.73 | 1.54 |
| Anxiety | 1 | 40.26 | 50.42 | 41.36 | 44.88 |
| Anxiety | 2 | 31.43 | 34.11 | 29.09 | 31.84 |
| Anxiety | 3 | 19.22 | 12.48 | 18.18 | 16.06 |
| Anxiety | 4 | 7.53 | 2.50 | 7.50 | 5.40 |
| Anxiety | 5 | 1.56 | 0.50 | 3.86 | 1.82 |
Figure 1. Reported domain levels for the adult respondents compared with the UK population
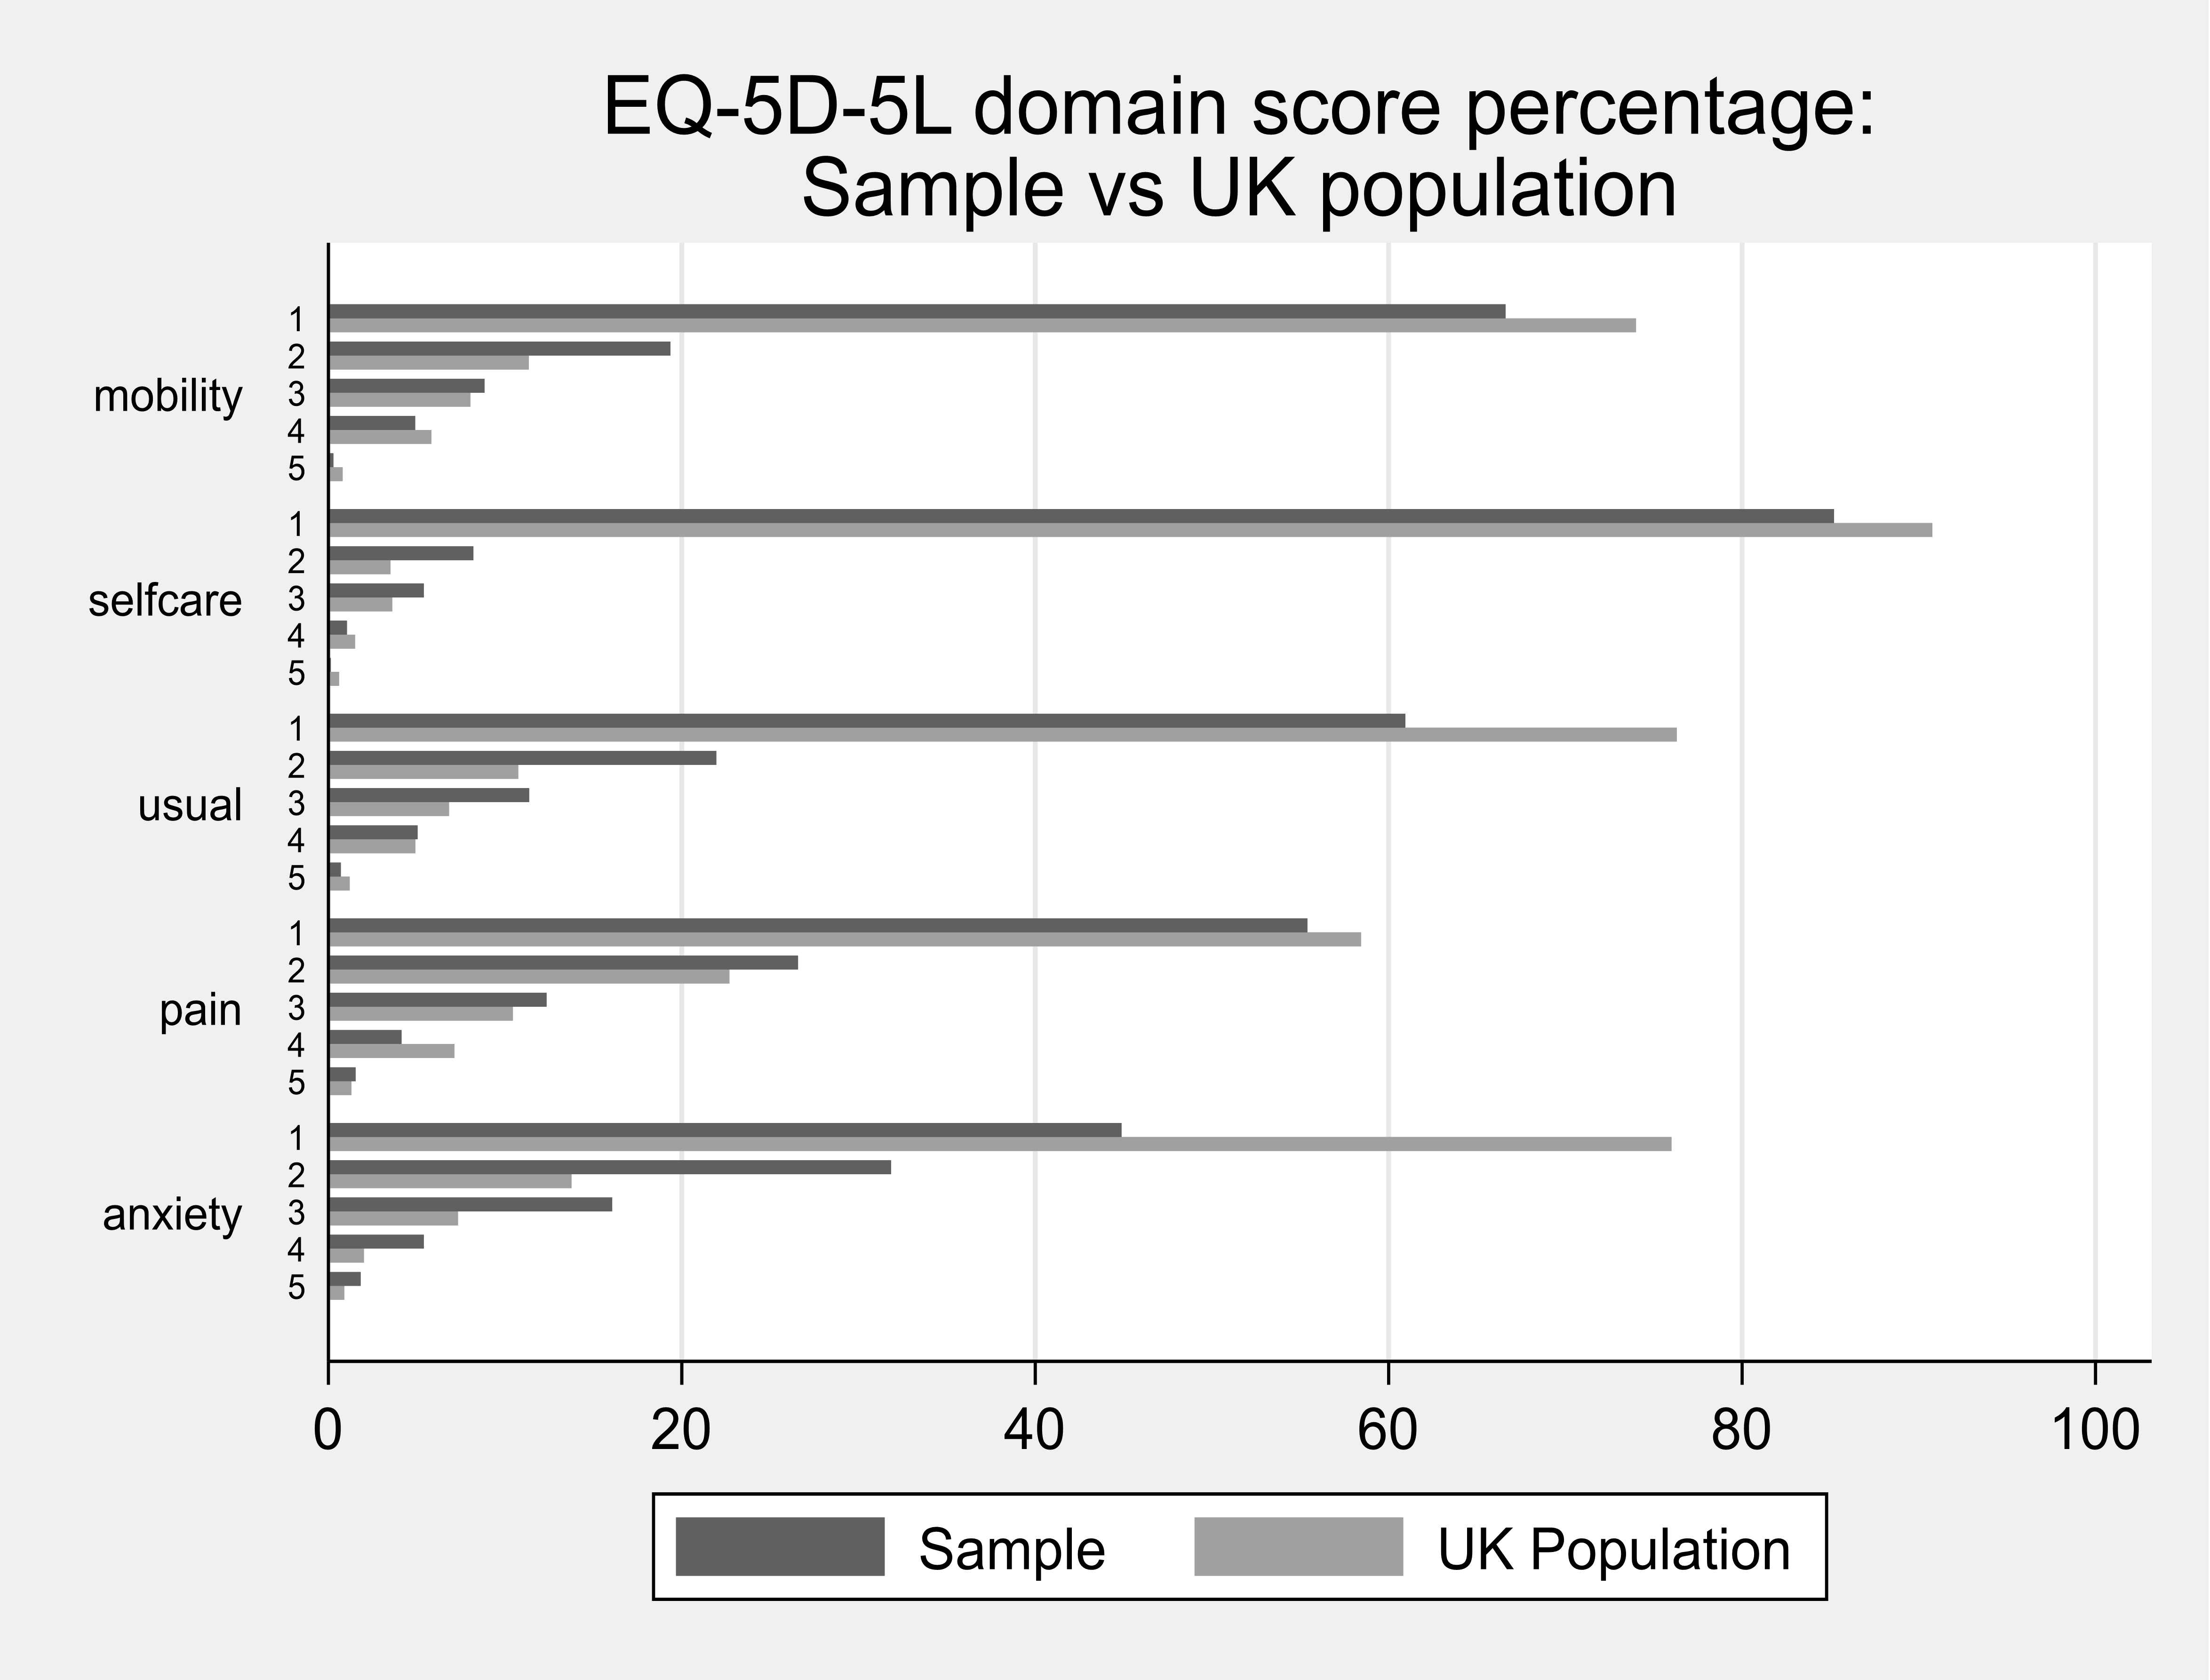
Table 3. Reported domain levels for the adult respondents compared with the UK population
| Domain | Level | Sample: Frequency | Sample: Percent | UK Population: Frequency | UK Population: Percent |
|---|---|---|---|---|---|
| Mobility | 1 | 950 | 66.6 | 737 | 74.0 |
| Mobility | 2 | 276 | 19.4 | 113 | 11.3 |
| Mobility | 3 | 126 | 8.8 | 80 | 8.0 |
| Mobility | 4 | 70 | 4.9 | 58 | 5.8 |
| Mobility | 5 | 4 | 0.3 | 8 | 0.8 |
| Selfcare | 1 | 1215 | 85.2 | 861 | 92.1 |
| Selfcare | 2 | 117 | 8.2 | 39 | 4.2 |
| Selfcare | 3 | 77 | 5.4 | 26 | 2.8 |
| Selfcare | 4 | 15 | 1.1 | 7 | 0.7 |
| Selfcare | 5 | 2 | 0.1 | 2 | 0.2 |
| Usual Activity | 1 | 869 | 60.9 | 708 | 75.7 |
| Usual Activity | 2 | 313 | 21.9 | 122 | 13.0 |
| Usual Activity | 3 | 162 | 11.4 | 77 | 8.2 |
| Usual Activity | 4 | 72 | 5.0 | 22 | 2.4 |
| Usual Activity | 5 | 10 | 0.7 | 6 | 0.6 |
| Pain | 1 | 526 | 36.9 | 426 | 45.5 |
| Pain | 2 | 526 | 36.9 | 293 | 31.3 |
| Pain | 3 | 272 | 191.1 | 159 | 17.0 |
| Pain | 4 | 76 | 5.3 | 45 | 4.8 |
| Pain | 5 | 26 | 1.8 | 13 | 1.4 |
| Anxiety | 1 | 640 | 44.9 | 442 | 47.2 |
| Anxiety | 2 | 454 | 31.8 | 266 | 28.4 |
| Anxiety | 3 | 229 | 16.1 | 162 | 17.3 |
| Anxiety | 4 | 77 | 5.4 | 47 | 5.0 |
| Anxiety | 5 | 26 | 1.8 | 20 | 2.1 |
Source: UK population values taken from Feng, Y., Devlin, N., & Herdman, M. (2015). Assessing the health of the general population in England: how do the three- and five-level versions of EQ-5D compare?. Health and quality of life outcomes, 13, 171.
Figure 2. Scatter plot of calculated baseline and contingent health utility score from the EQ5D-5 L for adults
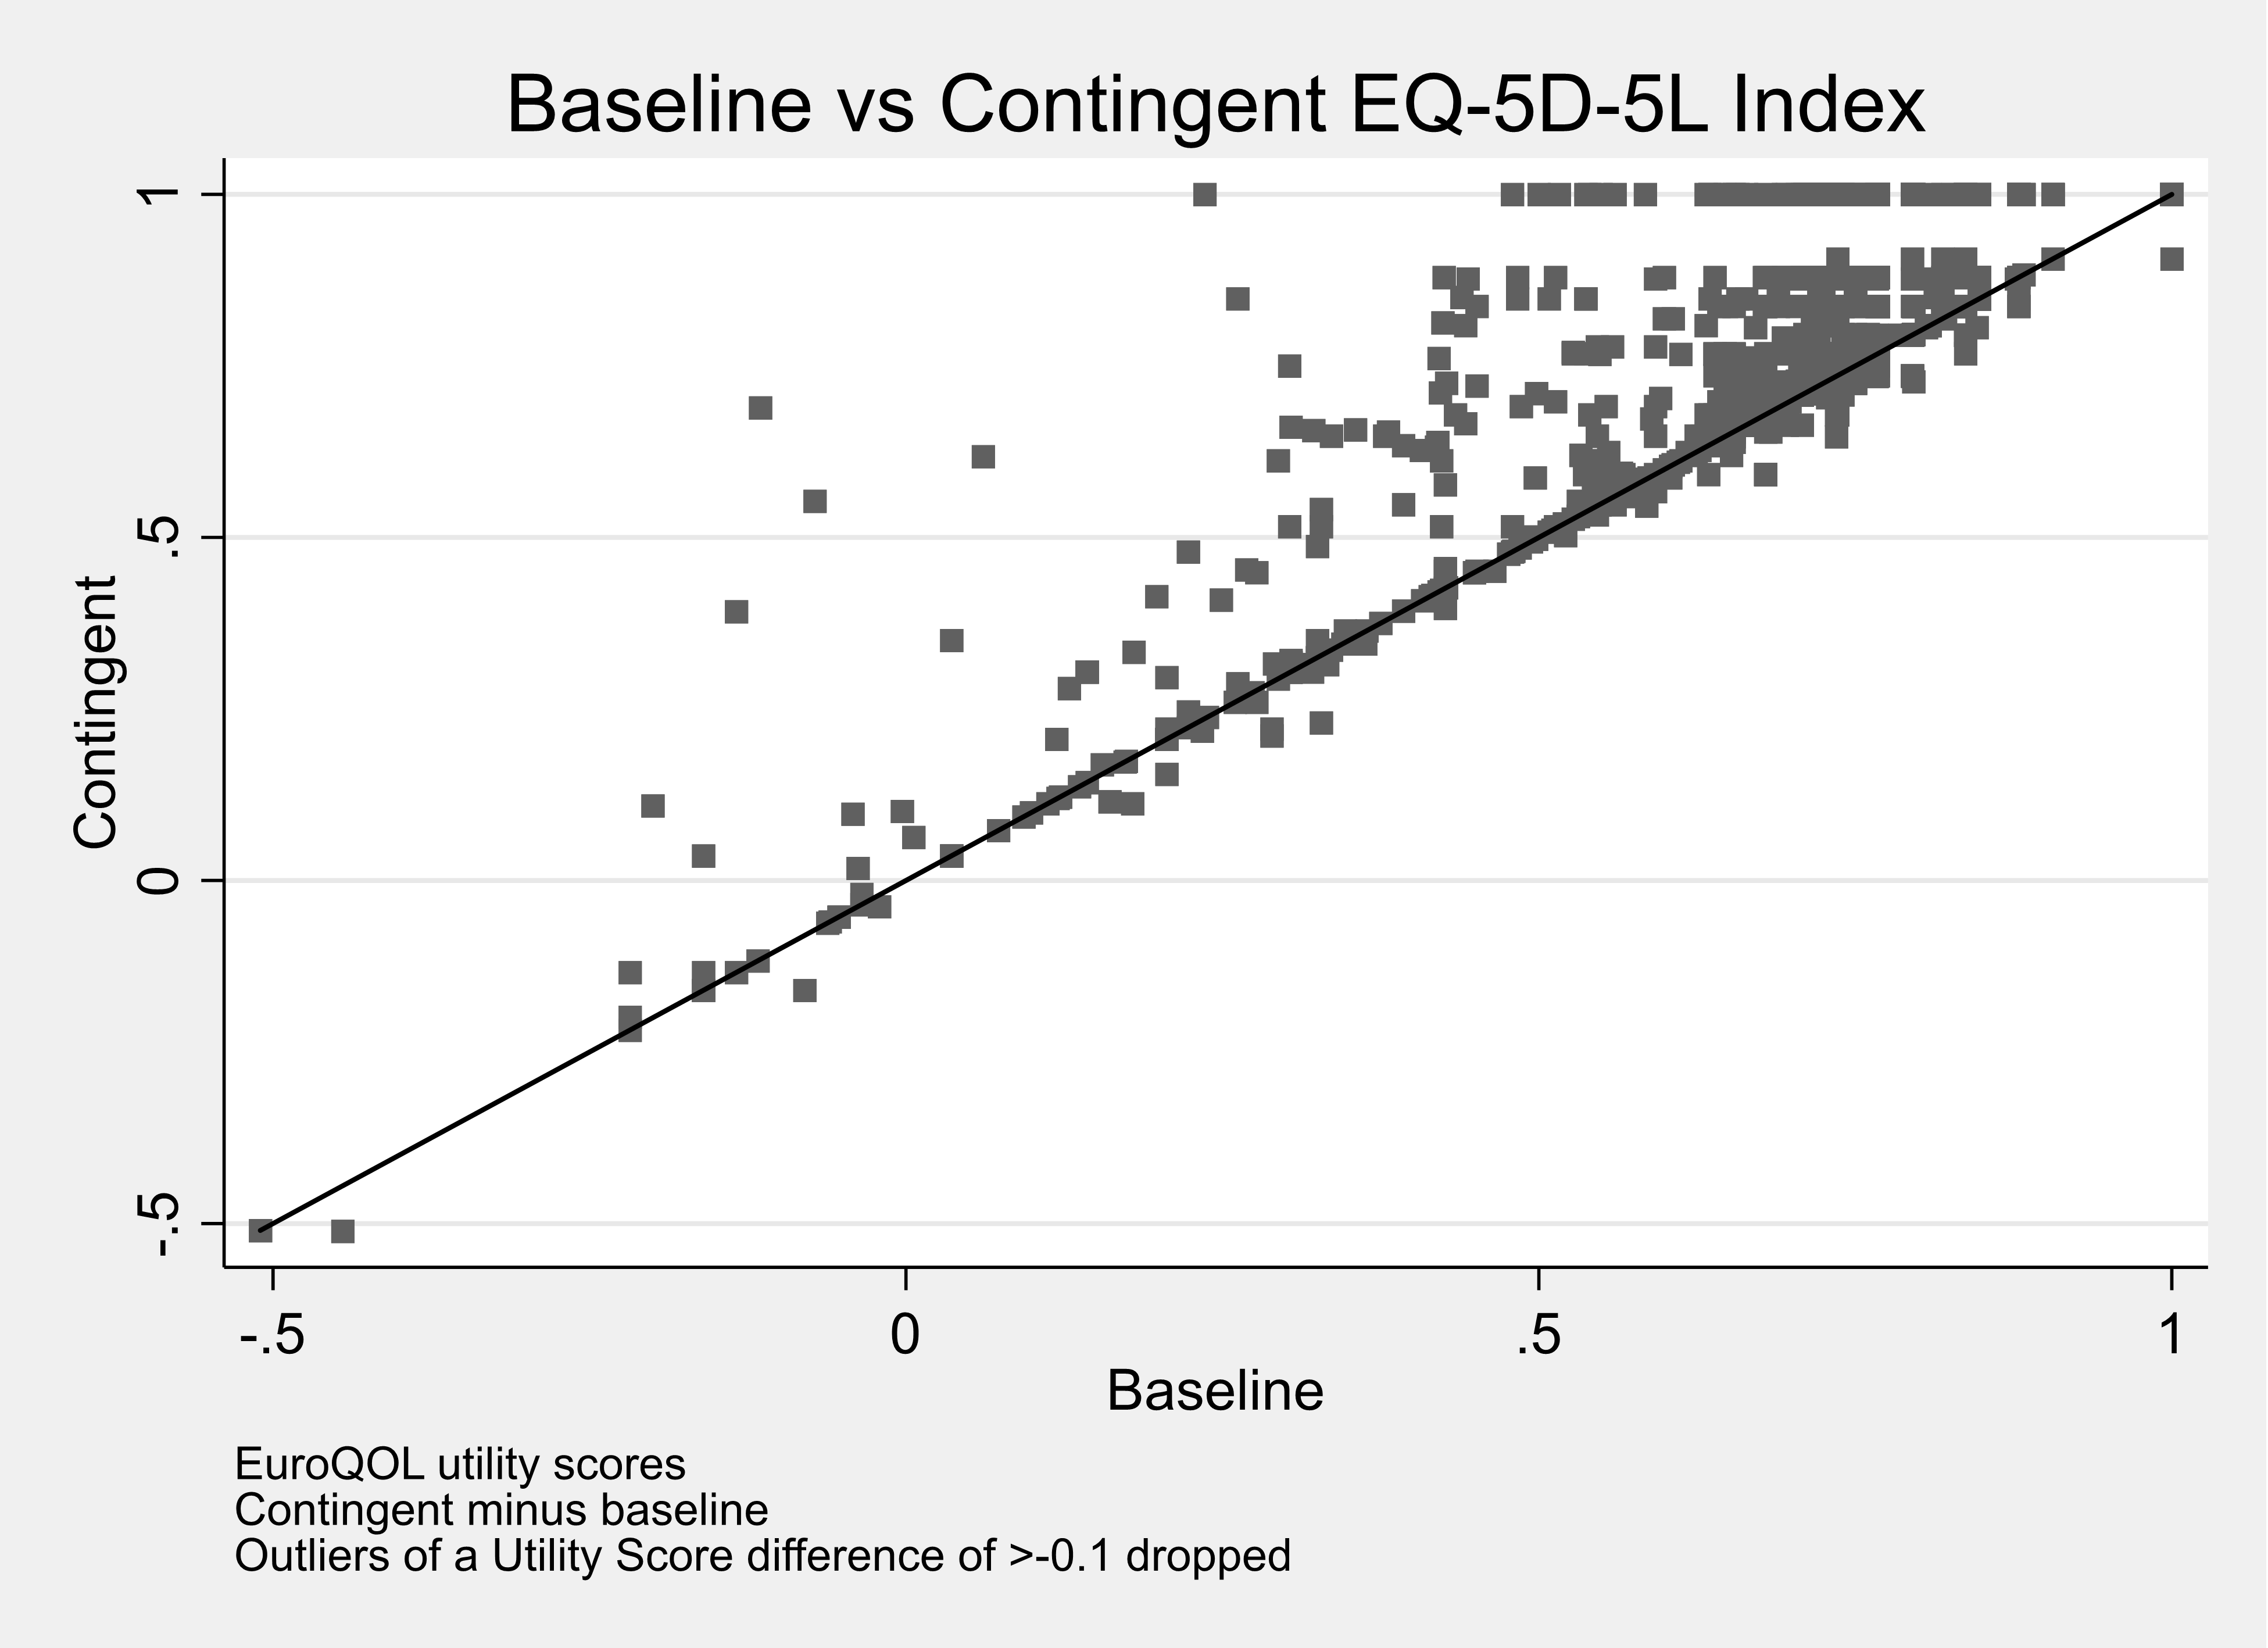
Footnote: Matrix of correlations
| Variables | (1) baseline health | (2) contingent health |
|---|---|---|
| (1) baseline health | 1.000 | - |
| (2) contingent health | 0.889 | 1.000 |
Figure 3. Scatter plot of calculated baseline and contingent health utility score from the EQ-VAS for adults
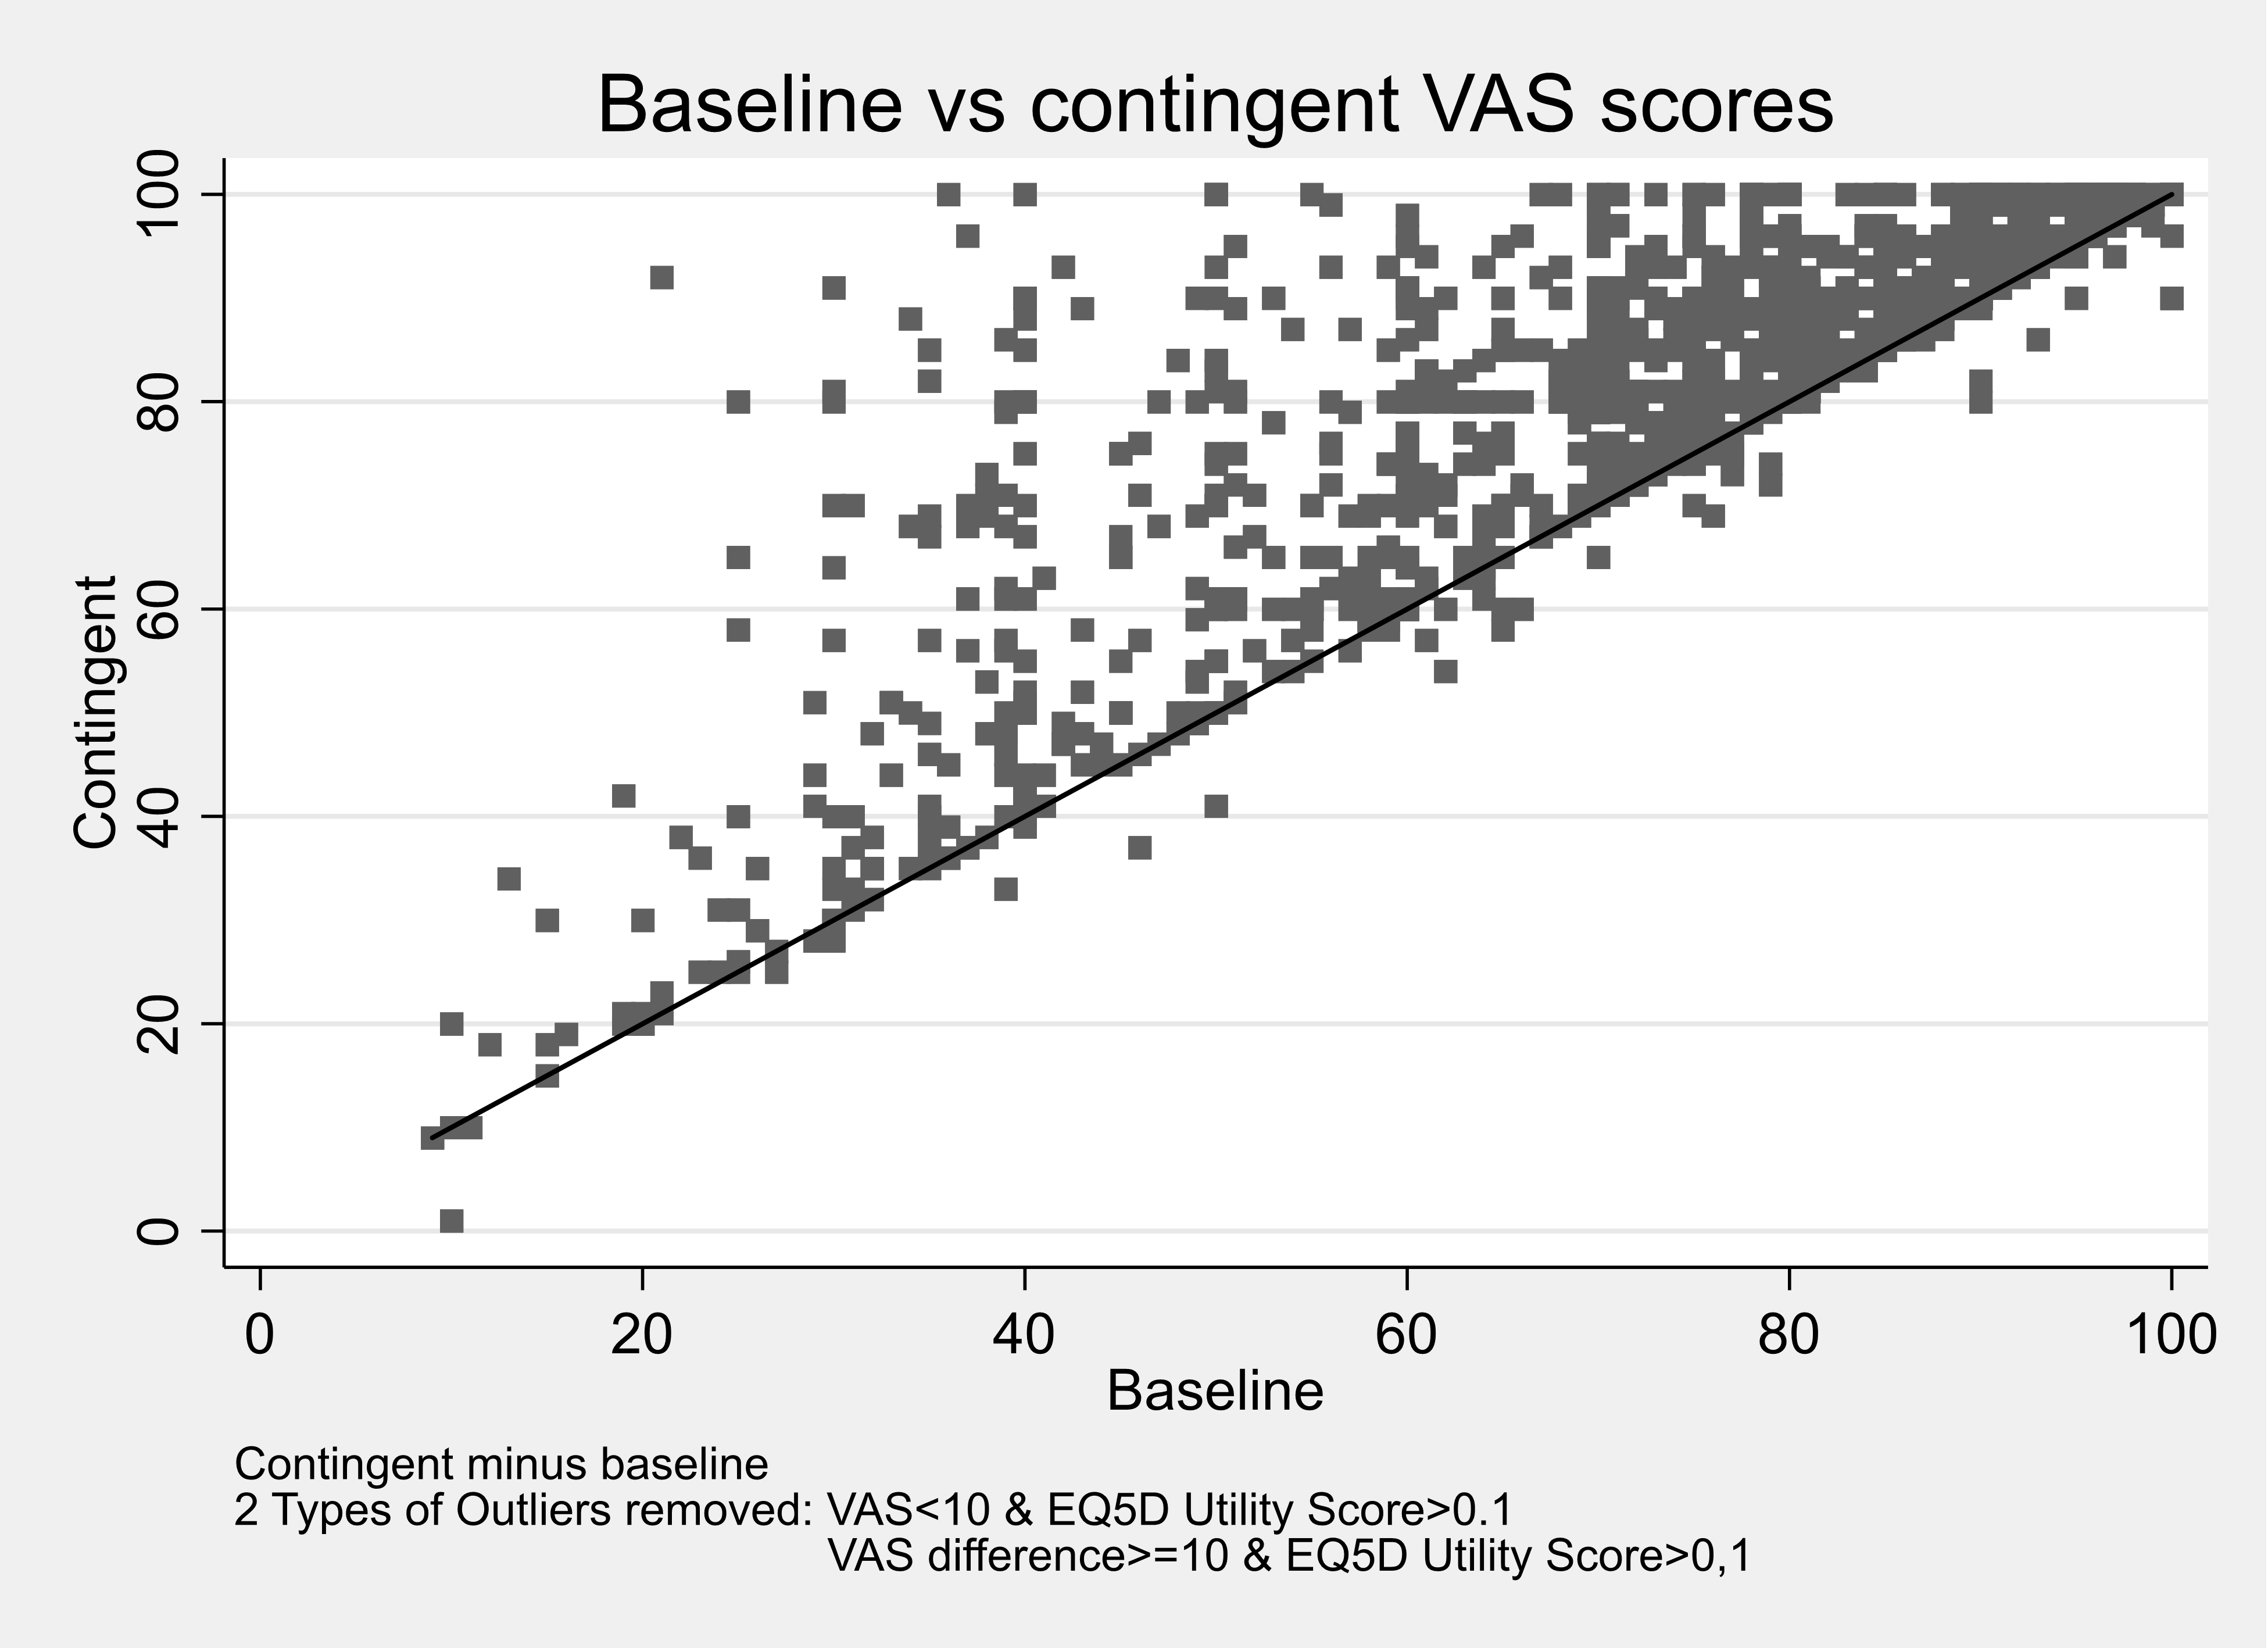
Footnote: Matrix of correlations
| Variables | (1) baseline health | (2) contingent health |
|---|---|---|
| (1) baseline health | 1.000 | - |
| (2) contingent health | 0.86 | 1.000 |
Table 4. Parent proxy values for children reporting the domain level for each FHS and for multiple FHS
| Domain | Level | % of respondents reporting the level: Food Allergy | % of respondents reporting the level: Coeliac Disease | % of respondents reporting the level: Food Intolerance | % of respondents reporting the level: Multiple | Total |
|---|---|---|---|---|---|---|
| Mobility | 1 | 90.88 | 67.86 | 91.30 | 75.71 | 86.99 |
| Mobility | 2 | 7.98 | 25.00 | 6.96 | 20.00 | 10.81 |
| Mobility | 3 | 1.14 | 7.14 | 1.74 | 4.29 | 2.20 |
| Selfcare | 1 | 85.19 | 71.43 | 84.35 | 71.43 | 82.09 |
| Selfcare | 2 | 13.39 | 25.00 | 13.04 | 24.29 | 15.71 |
| Selfcare | 3 | 1.42 | 3.57 | 2.61 | 4.29 | 2.20 |
| Usual Activity | 1 | 82.05 | 66.07 | 75.65 | 58.57 | 76.52 |
| Usual Activity | 2 | 14.81 | 26.79 | 20.00 | 34.29 | 19.26 |
| Usual Activity | 3 | 3.13 | 7.14 | 4.35 | 7.14 | 4.22 |
| Pain | 1 | 74.07 | 48.21 | 54.78 | 41.43 | 64.02 |
| Pain | 2 | 23.36 | 48.21 | 40.87 | 52.86 | 32.60 |
| Pain | 3 | 2.56 | 3.57 | 4.35 | 5.71 | 3.88 |
| Anxiety | 1 | 61.25 | 46.43 | 57.39 | 38.57 | 56.42 |
| Anxiety | 2 | 33.05 | 46.43 | 34.78 | 44.29 | 35.98 |
| Anxiety | 3 | 5.70 | 7.14 | 7.83 | 17.14 | 7.60 |
Table 5. Parent proxy values for children reporting the domain level for each FHS and for the worst FHS or only FHS
| Domain | Level | % of respondents reporting the level: Food Allergy | % of respondents reporting the level: Coeliac Disease | % of respondents reporting the level: Food Intolerance | % of respondents reporting the level: Multiple |
|---|---|---|---|---|---|
| Mobility | 1 | 90.00 | 70.15 | 86.40 | 86.99 |
| Mobility | 2 | 8.75 | 22.39 | 11.20 | 10.81 |
| Mobility | 3 | 1.25 | 7.46 | 2.40 | 2.20 |
| Selfcare | 1 | 83.75 | 71.64 | 82.40 | 82.09 |
| Selfcare | 2 | 14.00 | 26.87 | 15.20 | 15.71 |
| Selfcare | 3 | 2.25 | 1.49 | 2.40 | 2.20 |
| Usual Activity | 1 | 79.50 | 65.67 | 72.80 | 76.52 |
| Usual Activity | 2 | 17.25 | 26.87 | 21.60 | 19.26 |
| Usual Activity | 3 | 3.25 | 7.46 | 5.60 | 4.22 |
| Pain | 1 | 70.75 | 49.25 | 50.40 | 64.02 |
| Pain | 2 | 26.75 | 47.76 | 43.20 | 32.60 |
| Pain | 3 | 2.50 | 2.99 | 6.40 | 3.38 |
| Anxiety | 1 | 59.00 | 41.79 | 56.00 | 56.42 |
| Anxiety | 2 | 34.50 | 49.25 | 33.60 | 35.98 |
| Anxiety | 3 | 6.50 | 8.96 | 10.40 | 7.60 |
Figure 4. Reported domain levels for a child as valued by a parent compared with the UK population
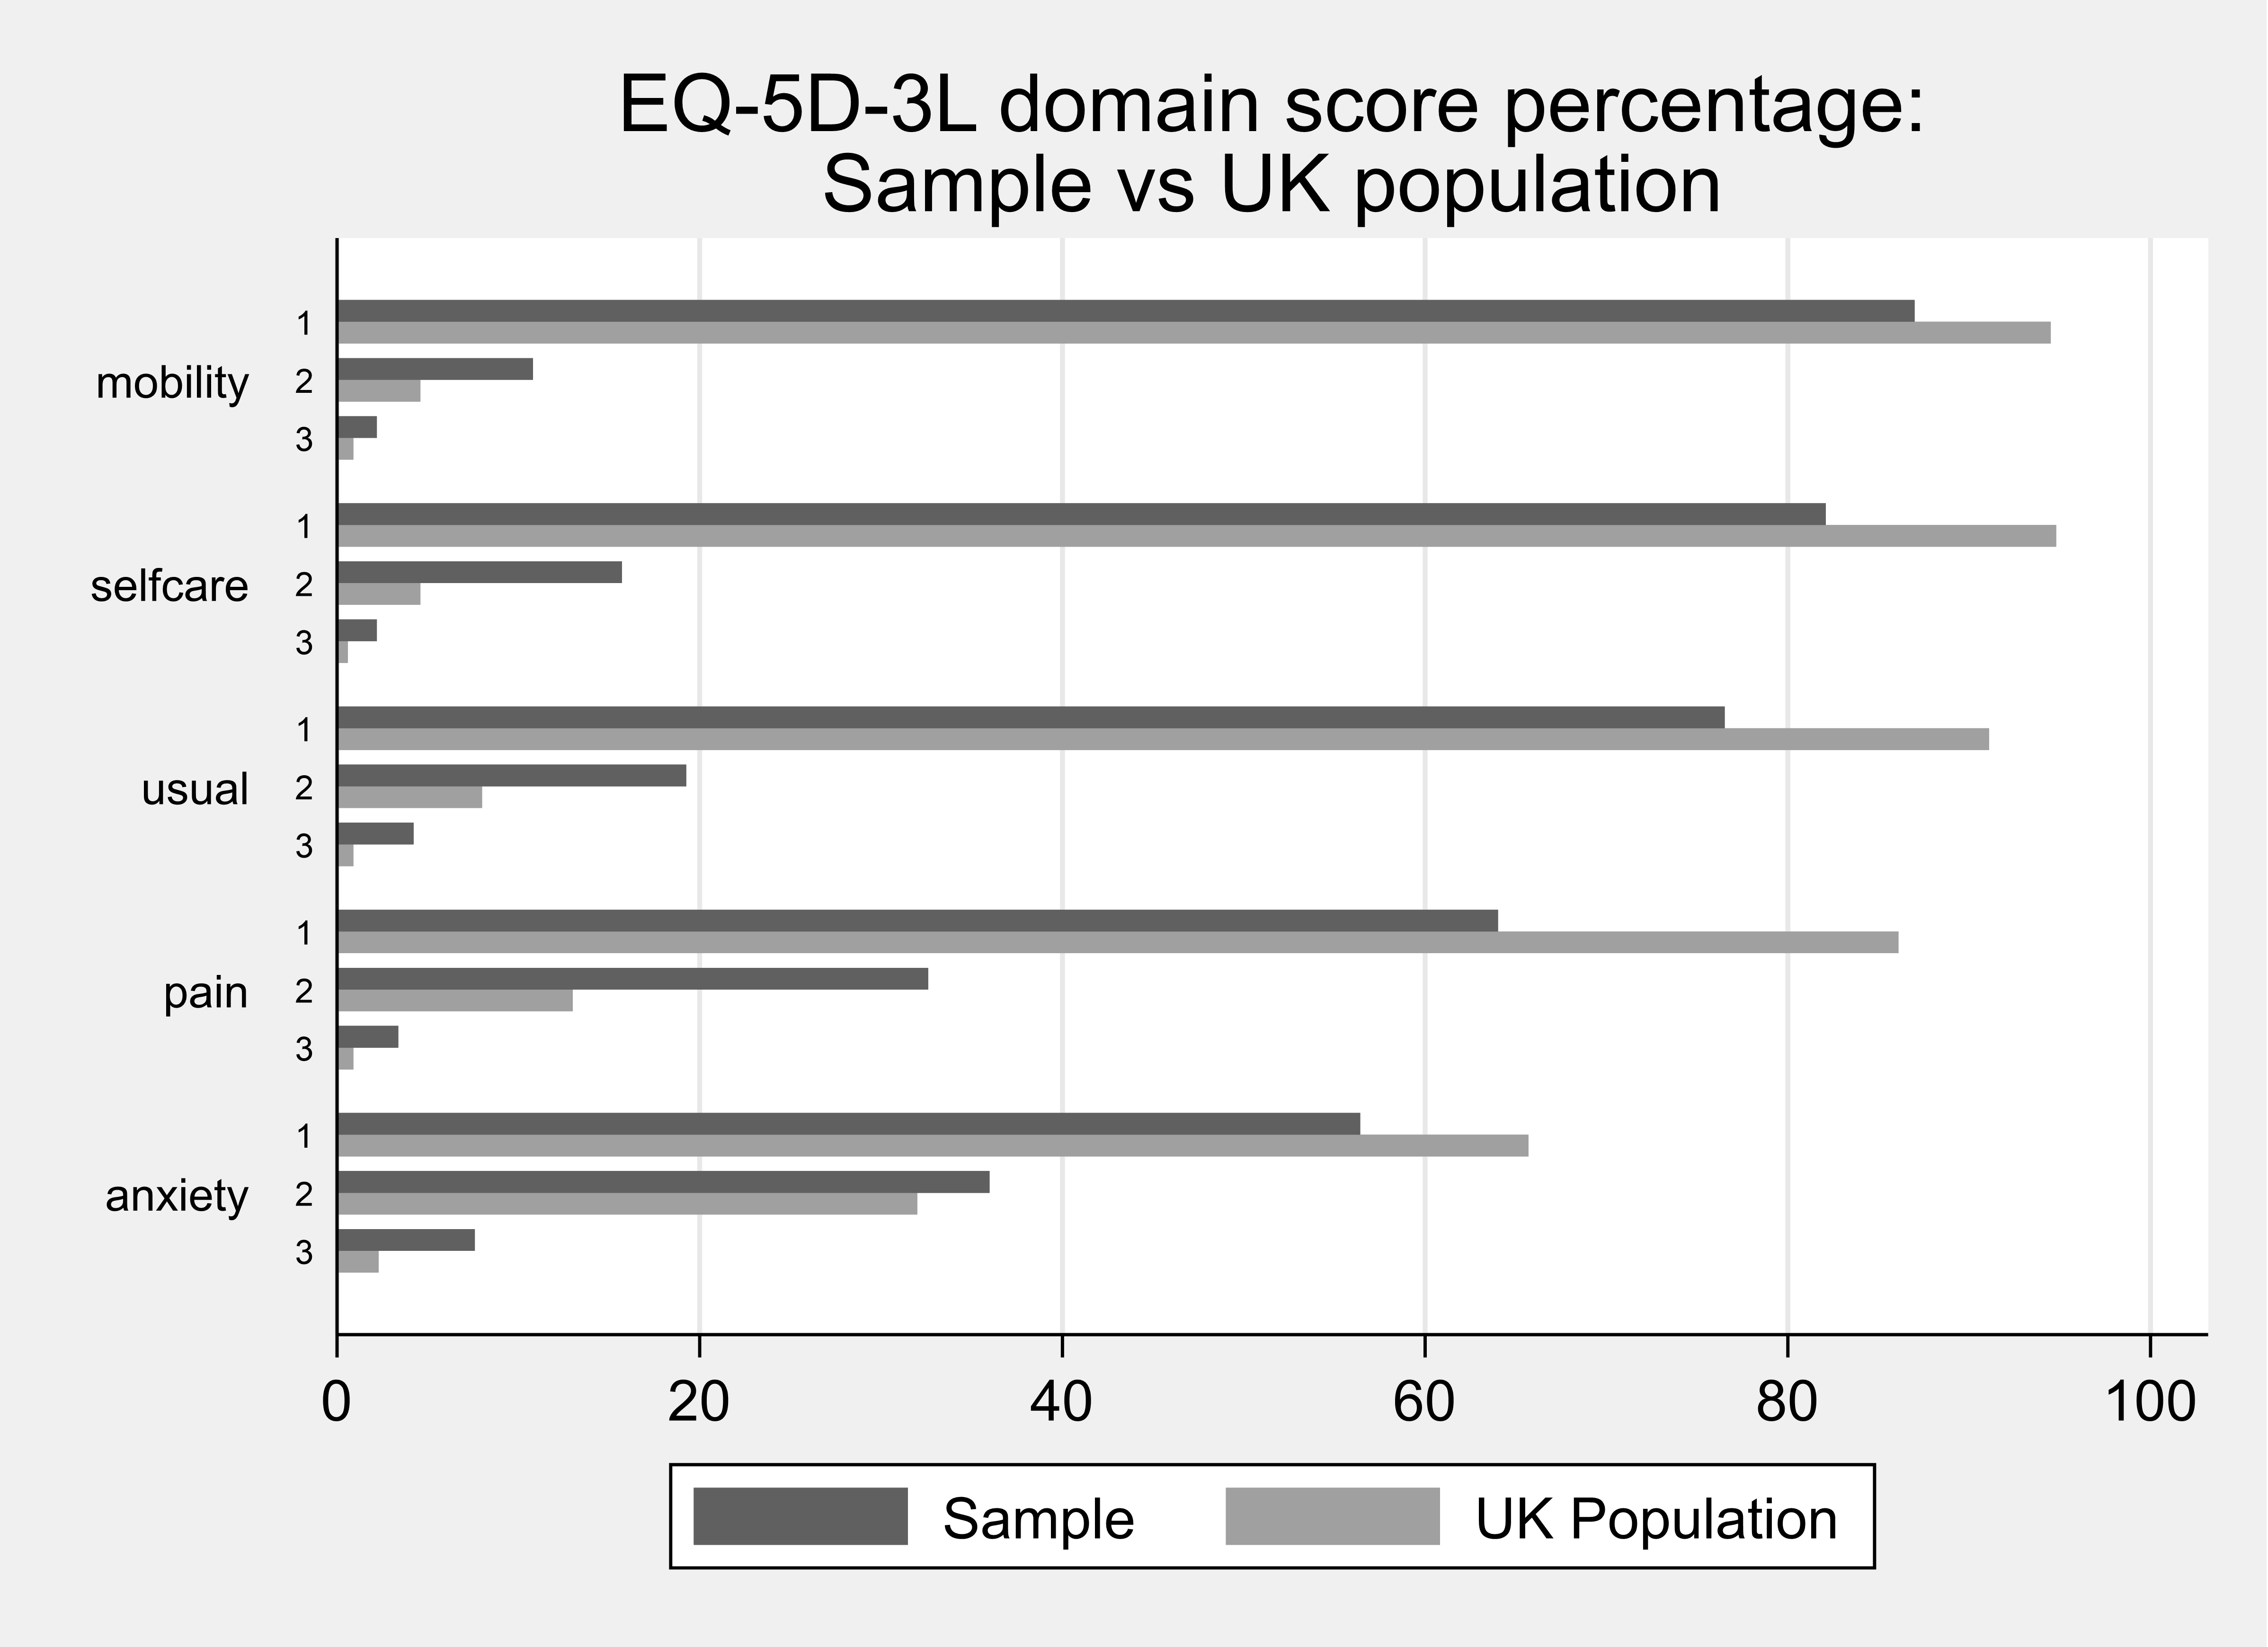
Table 6. Reported domain levels for a child as valued by a parent compared with the UK population
| Domain | Sample: Level | Sample: Frequency | Sample: Percent | UK Population: Frequency | UK Population: Percent |
|---|---|---|---|---|---|
| Mobility | 1 | 950 | 66.6 | 950 | 86.99 |
| Mobility | 2 | 276 | 19.4 | 46 | 10.81 |
| Mobility | 3 | 126 | 8.8 | 9 | 2.20 |
| Selfcare | 1 | 1215 | 85.2 | 953 | 82.09 |
| Selfcare | 2 | 117 | 8.2 | 46 | 15.71 |
| Selfcare | 3 | 77 | 5.4 | 6 | 2.20 |
| Usual Activity | 1 | 869 | 60.9 | 916 | 76.52 |
| Usual Activity | 2 | 313 | 21.9 | 80 | 19.26 |
| Usual Activity | 3 | 162 | 11.5 | 9 | 4.22 |
| Pain | 1 | 526 | 36.9 | 865 | 64.02 |
| Pain | 2 | 526 | 36.9 | 131 | 32.60 |
| Pain | 3 | 272 | 19.1 | 9 | 3.38 |
| Anxiety | 1 | 640 | 44.9 | 660 | 56.42 |
| Anxiety | 2 | 454 | 31.8 | 322 | 35.98 |
| Anxiety | 3 | 229 | 16.1 | 23 | 7.60 |
Source: UK population values taken from EQ5D-Youth
Figure 5. Scatter plot of calculated baseline and contingent health utility score from the EQ5D-3L (proxy)
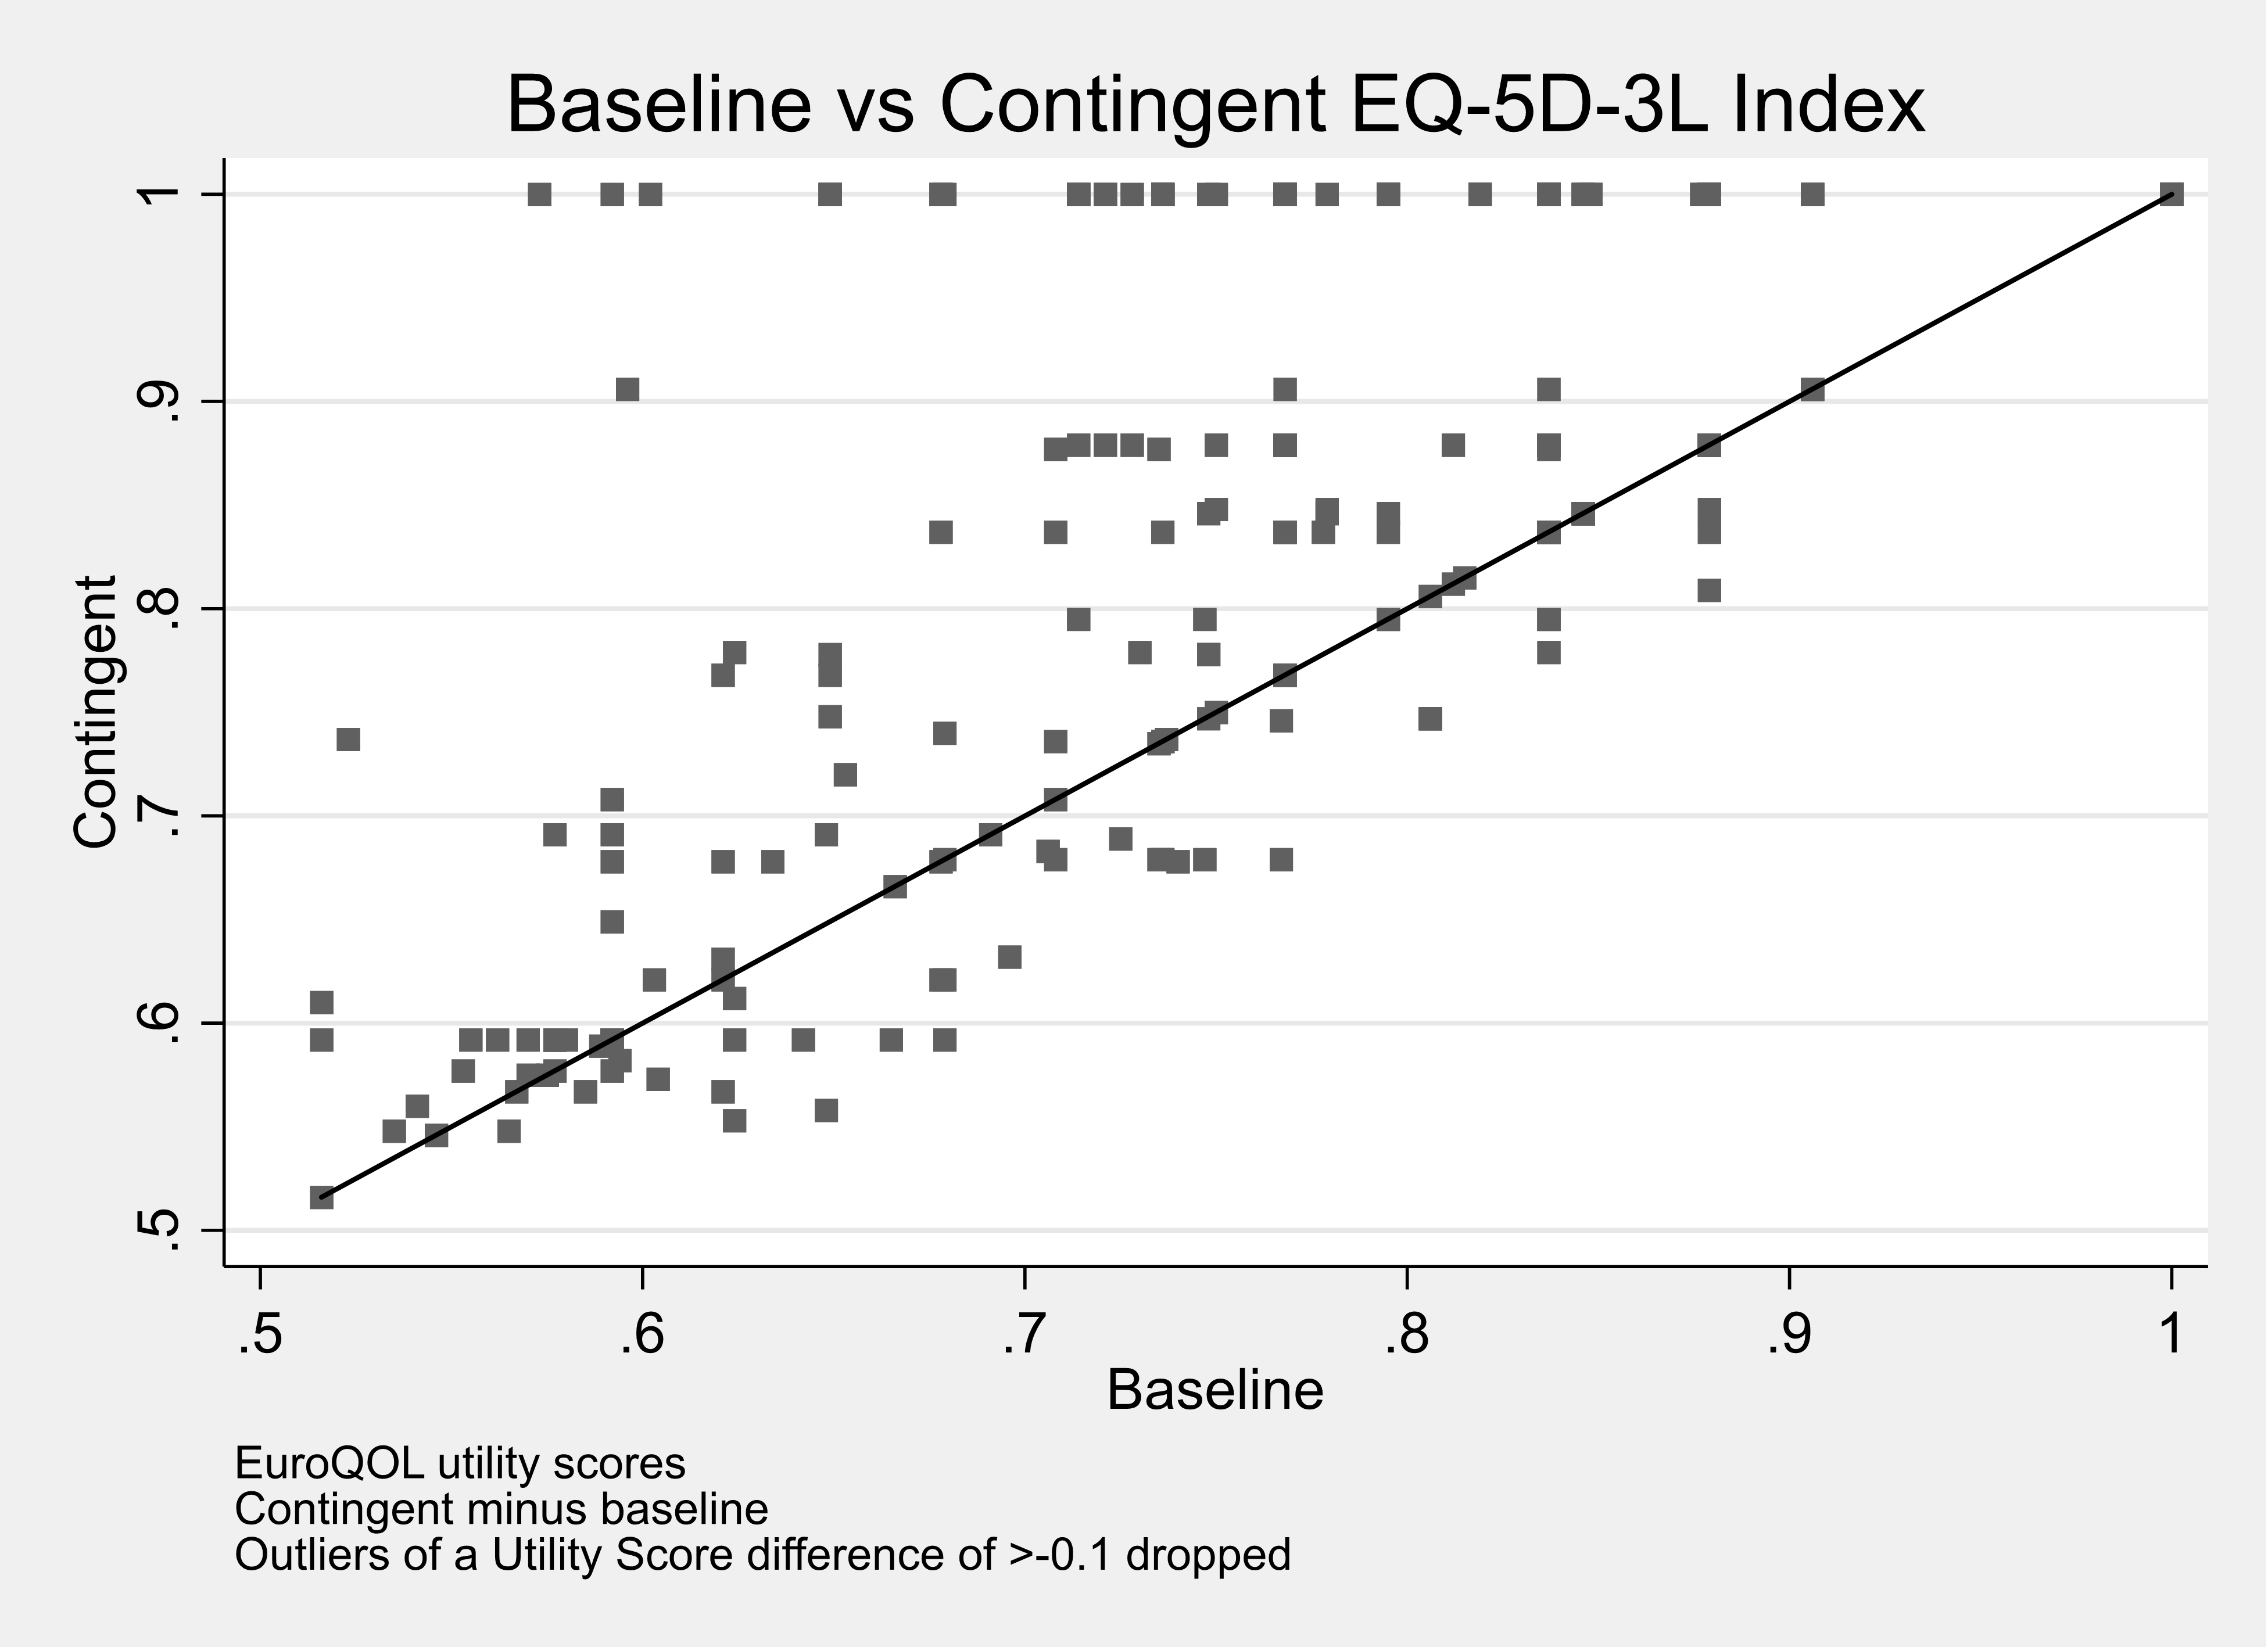
Footnote: Matrix of correlations
| Variables | (1) baseline health | (2) contingent health |
|---|---|---|
| (1) baseline health | 1.000 | - |
| (2) contingent health | 0.75 | 1.000 |
Figure 6. Scatter plot of calculated baseline and contingent health utility score from the EQ-VAS (proxy)
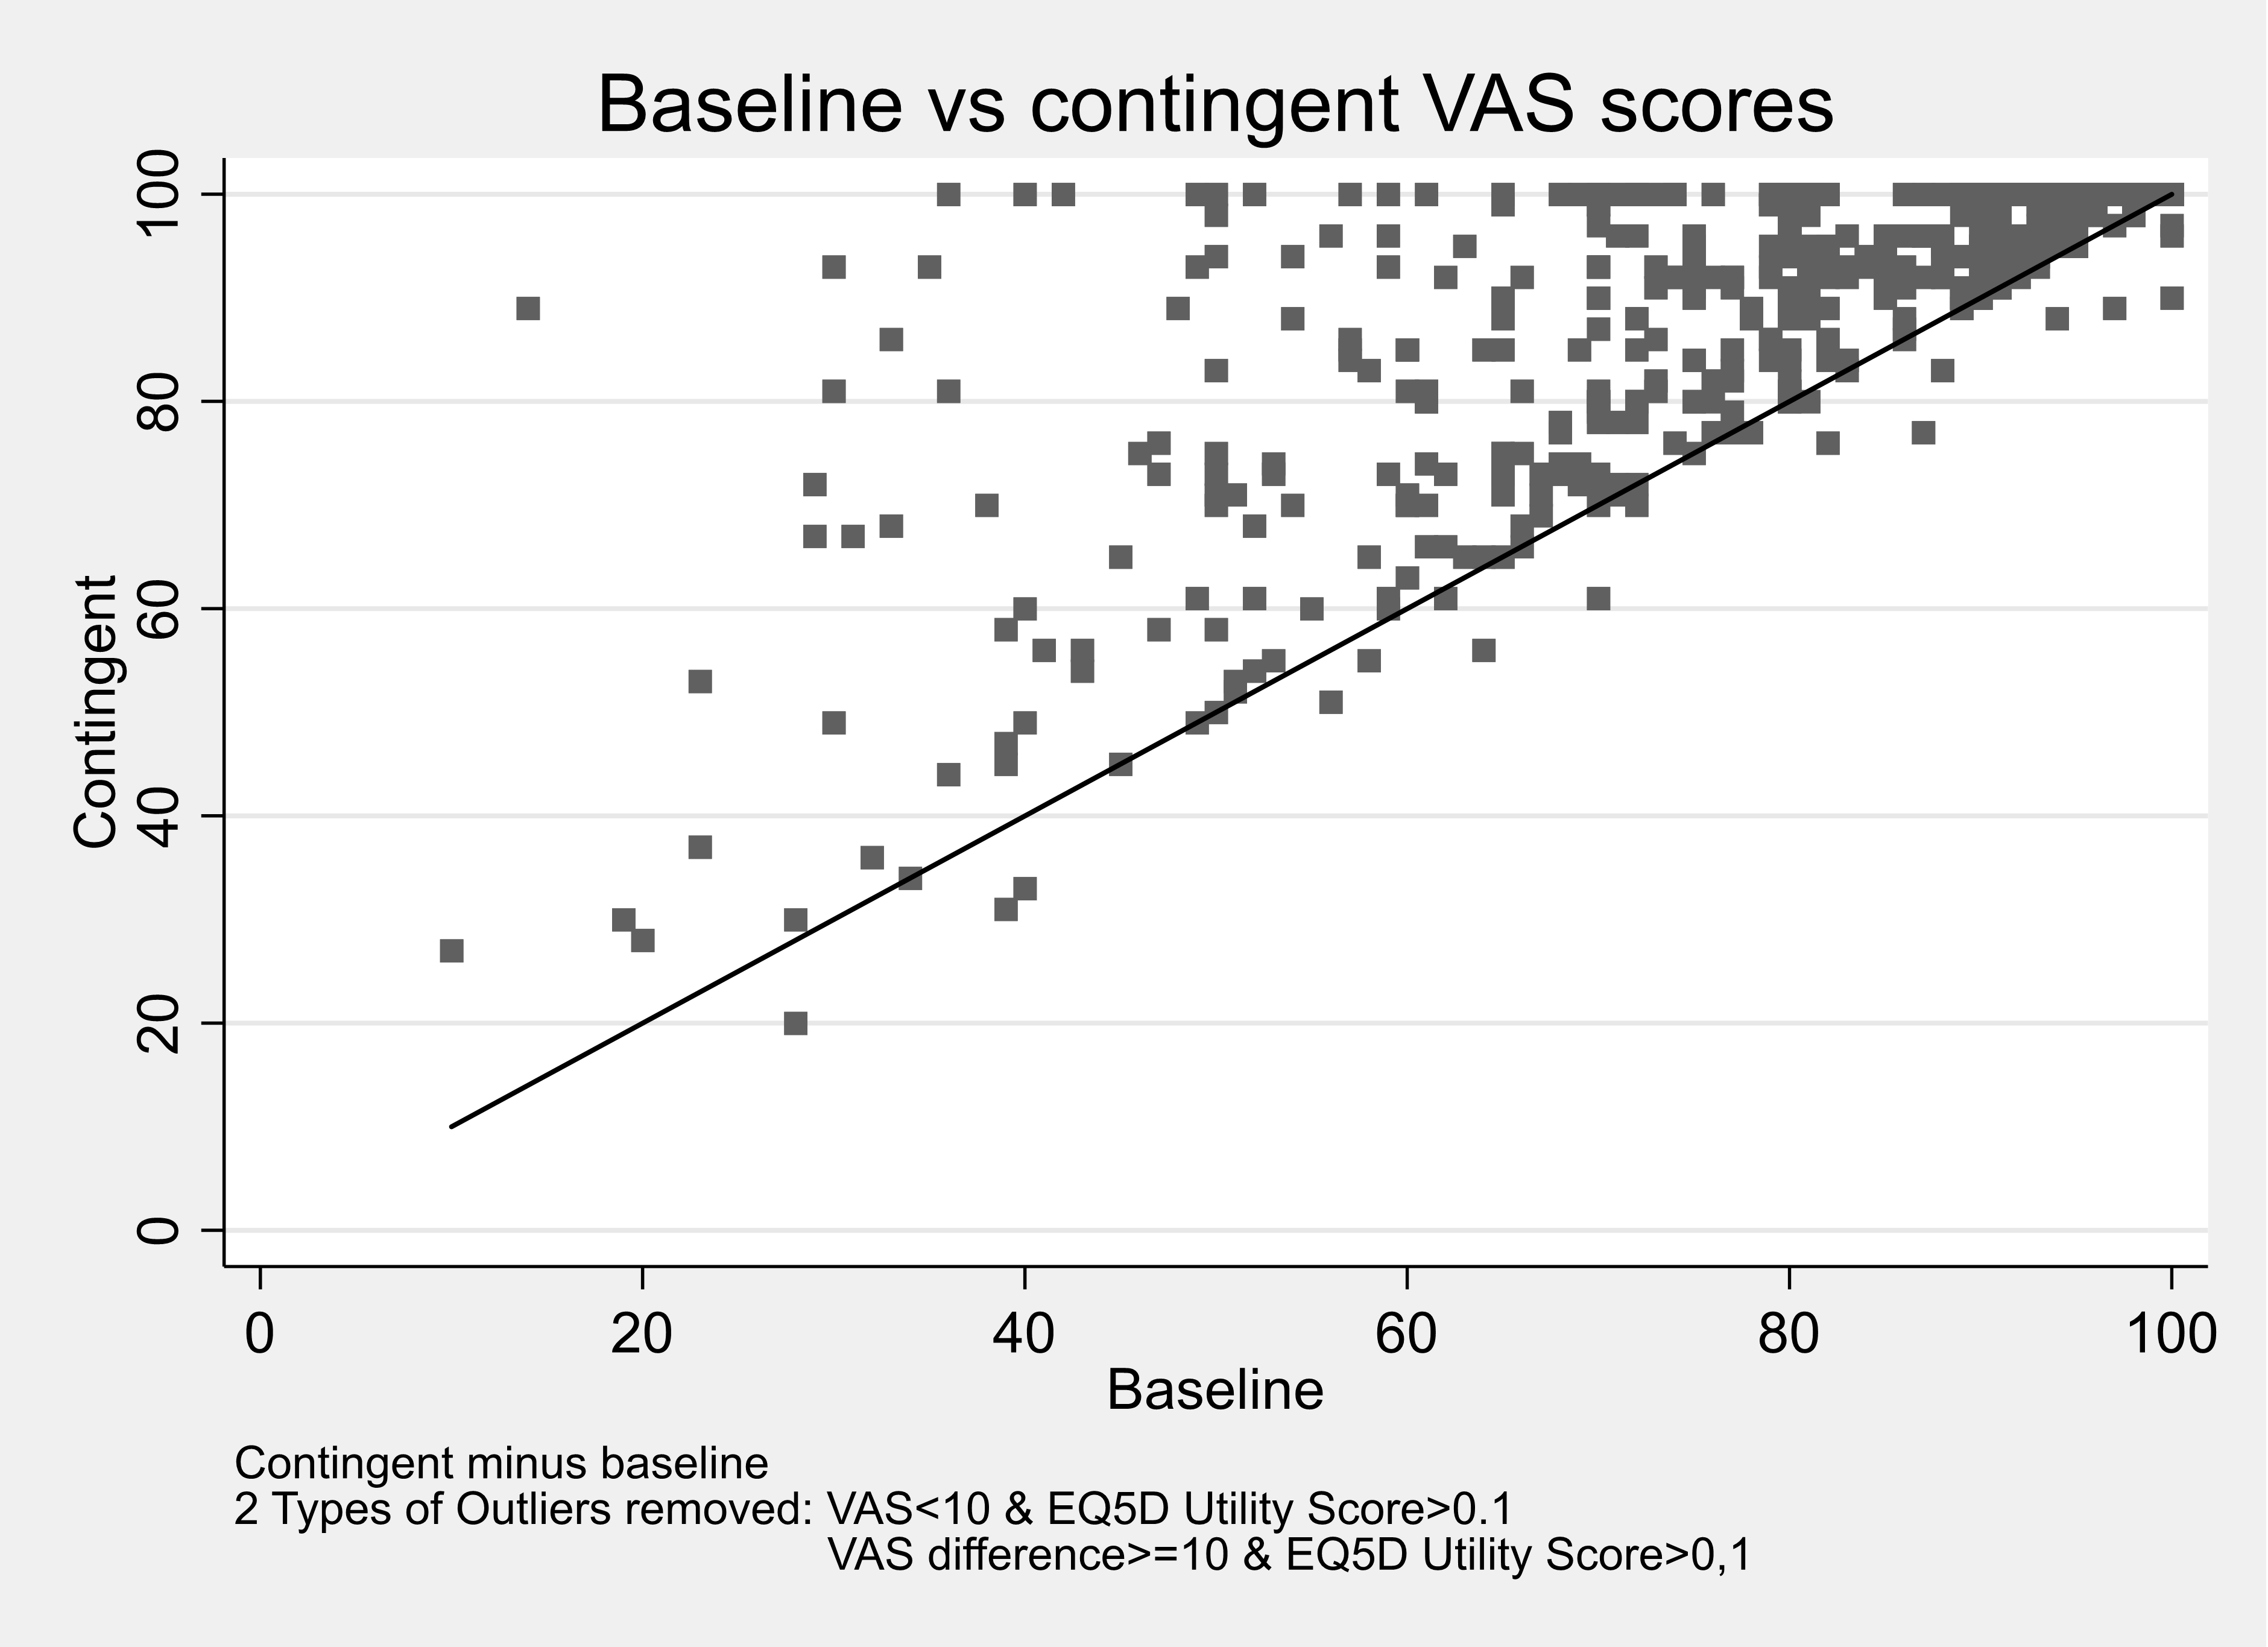
Footnote: Matrix of correlations
| Variables | (1) baseline health | (2) contingent health |
|---|---|---|
| (1) baseline health | 1.000 | - |
| (2) contingent health | 0.68 | 1.000 |
The impact of living with a food hypersensitivity, and hence the gain to be valued if it was removed, was captured using three approaches:
• Baseline and contingent EQ-5D;
• Baseline and contingent Visual Analogue Scale (VAS);
• Condition-specific measures (FAQLQ, FIQLQ, or CDQ) for children.
This section of the report covers condition-specific measures (FAQLQ, FIQLQ, and CDQ).
Adult Results: FAQLQ, FIQLQ, and CDQ
Food Allergy: FAQLQ
The FAQLQ is scored between 1 and 7 - the mean score in the adult sample was 4.8 and the median score was 5.1.
Table 1. Summary statistics: FAQLQ index
| - | Mean | Std. Dev | N | min | p25 | Median | p75 | max |
|---|---|---|---|---|---|---|---|---|
| FAQ total | 4.76 | 1.49 | 385 | 1.14 | 3.66 | 5.1 | 6 | 7 |
The adult distribution of FAQLQ scores is shown in Figure 1
Figure 1 Distribution of FAQLQ scores (adult allergy)
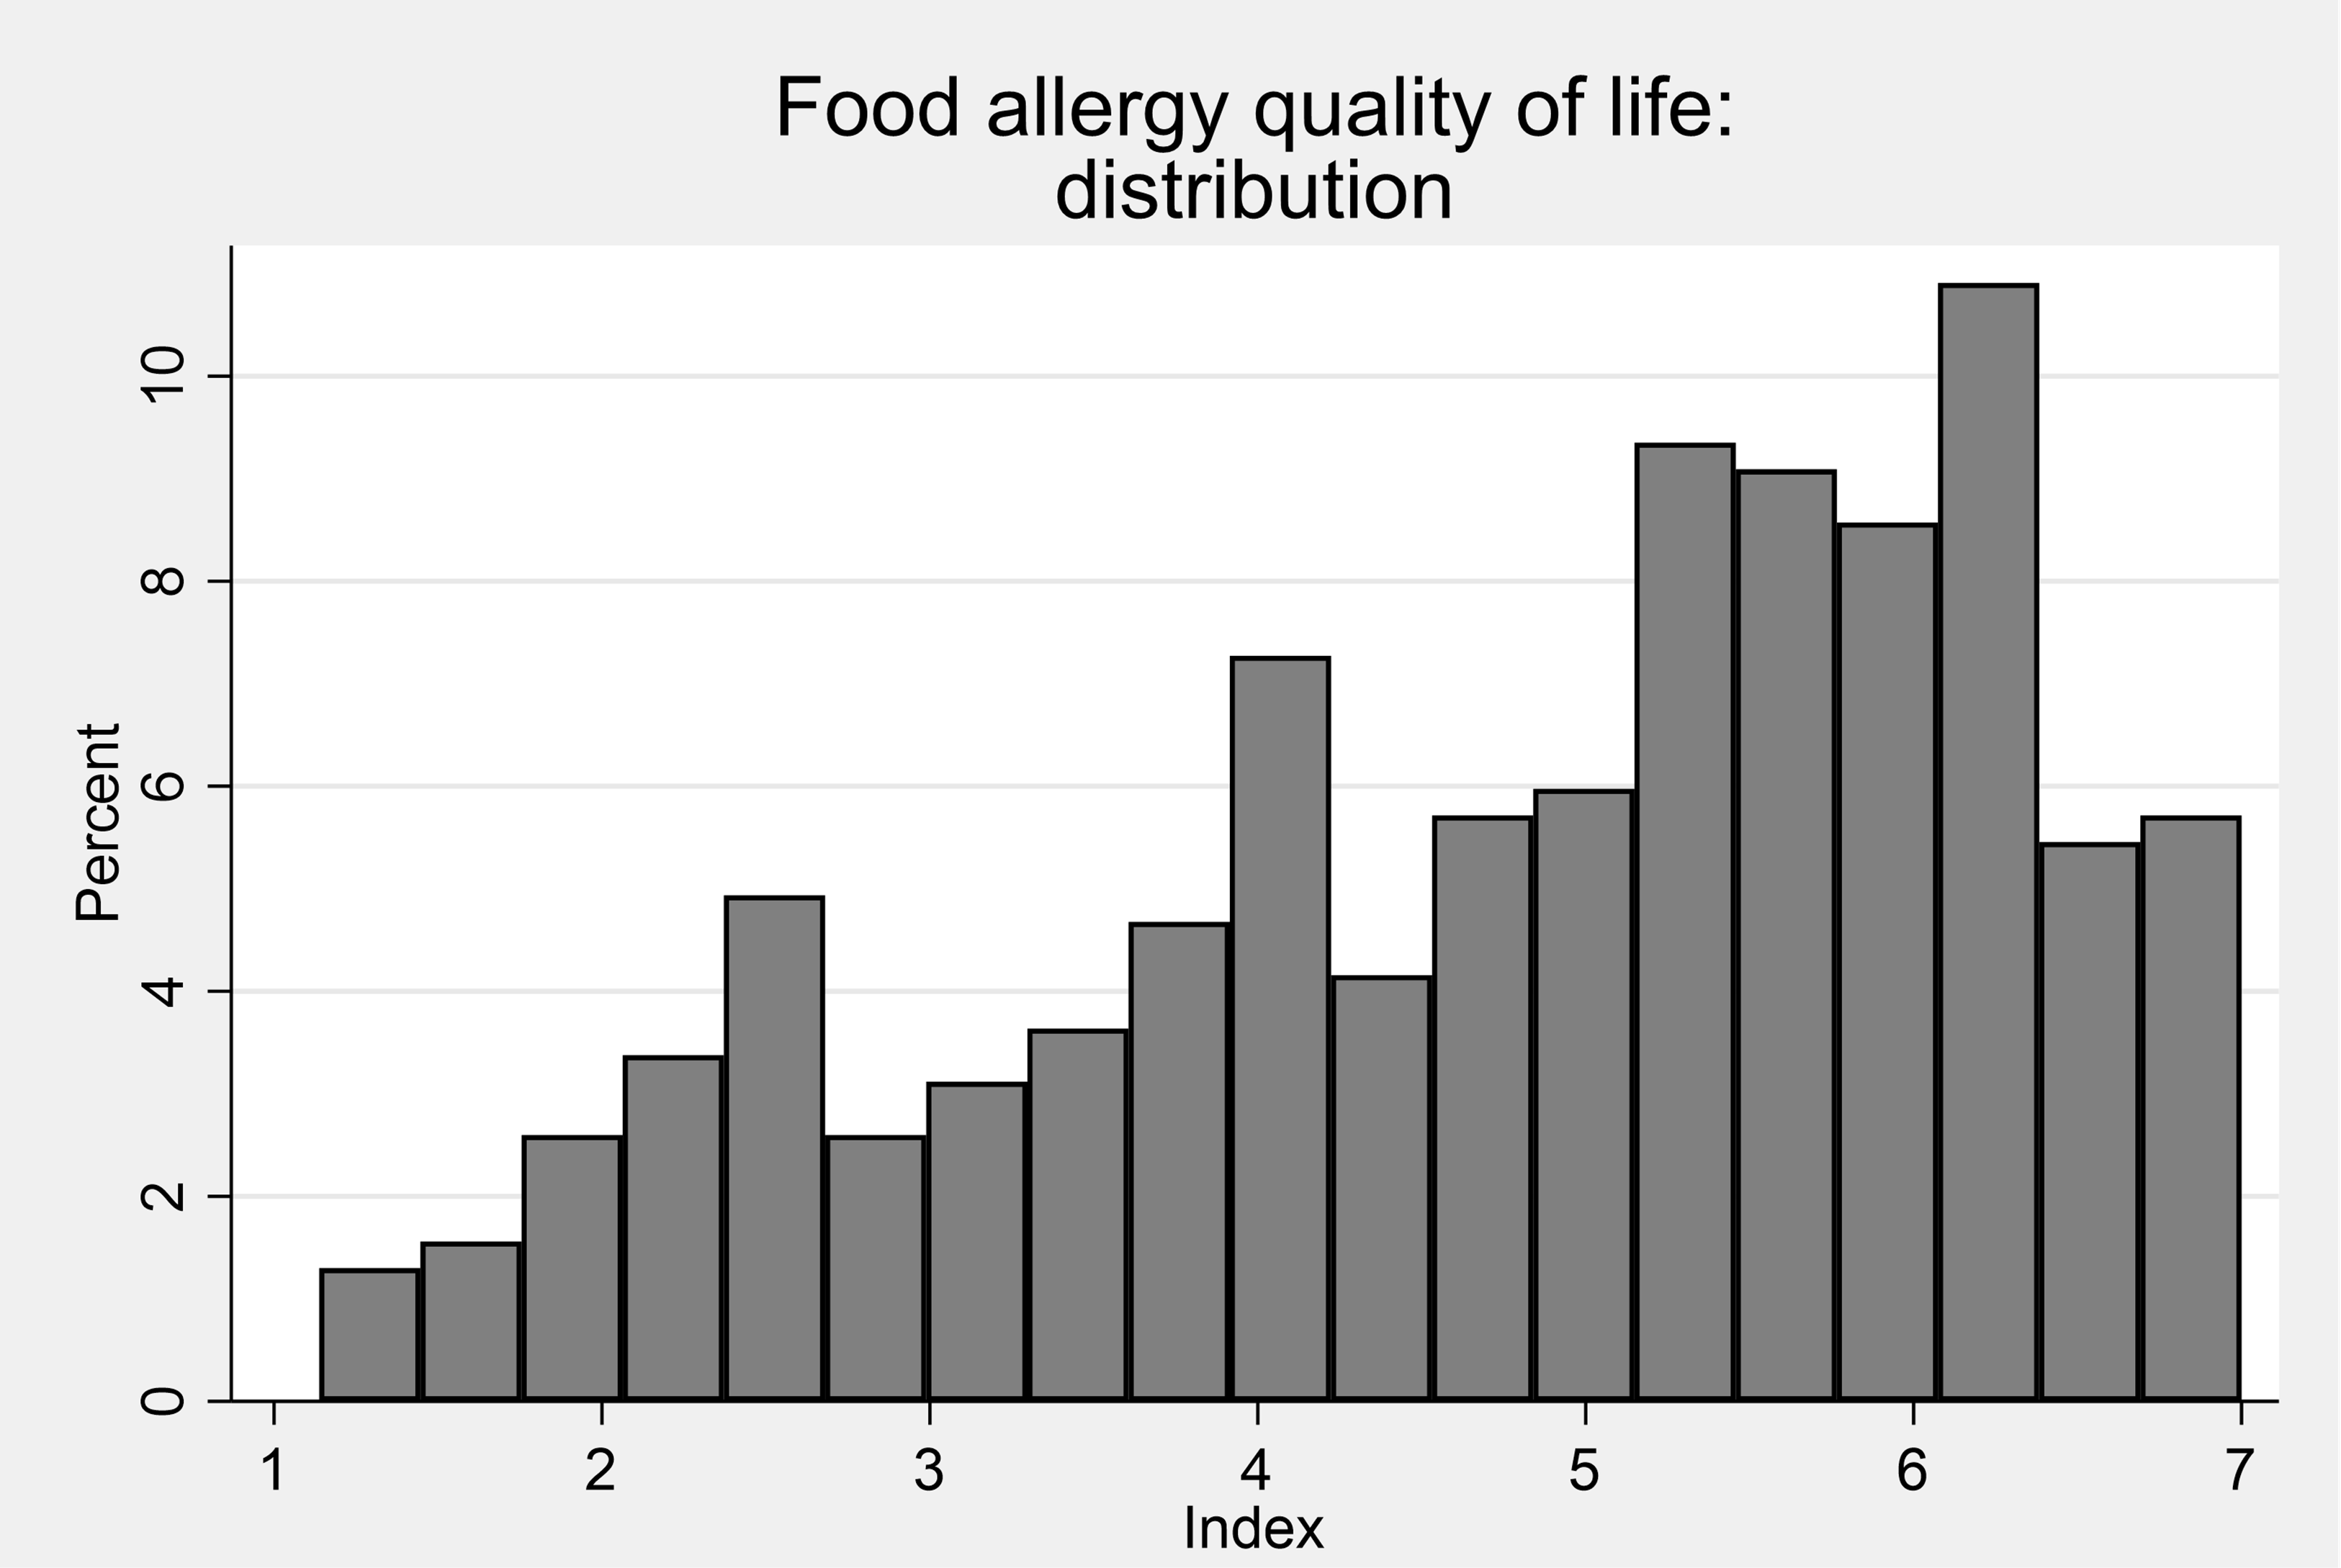
Women’s FAQLQ scores were on average than men’s, mean their allergy impacts were greater than those for men.
Table 2. Summary statistics: FAQLQ Index by sex
| Sex | mean | sd | N | min | p25 | Median | p75 | max |
|---|---|---|---|---|---|---|---|---|
| Female | 4.96 | 1.44 | 226 | 1.31 | 3.93 | 5.38 | 6.1 | 7 |
| Male | 4.18 | 1.47 | 85 | 1.21 | 3.17 | 4.24 | 5.28 | 7 |
The FAQLQ scores were similar across age groups except for those over 65 whose scores were lower than the younger age groups.
Table 3 Summary statistics: FAQLQ Index by age
| Age | mean | sd | N | min | p25 | Median | p75 | max |
|---|---|---|---|---|---|---|---|---|
| Below 35 years old | 4.9 | 1.3 | 104 | 1.79 | 3.91 | 5.22 | 5.97 | 7 |
| 35-54 years old | 4.87 | 1.59 | 140 | 1.21 | 3.62 | 5.38 | 6.12 | 7 |
| 55-64 years old | 1.9 | 1.41 | 71 | 1.76 | 3.97 | 5.07 | 6.21 | 6.97 |
| 65 years old and above | 4.23 | 1.56 | 69 | 1.14 | 2.83 | 4.59 | 5.45 | 7 |
Coeliac Disease: CDQ
The 20 items of the CDQ are scored 1 to 5 meaning that the instrument can takes values between 20 and 100. The mean CDQ score in the sample was 48 and the median score was 47.
Table 4. Summary statistics: CDQ index
| - | Mean | Std. Dev. | N | min | p25 | Median | p75 | max |
|---|---|---|---|---|---|---|---|---|
| CDQ total | 48.35 | 16.91 | 601 | 20 | 34 | 47 | 61 | 95 |
The distribution of CDQ scores is shown in Figure 2.
Figure 2 Distribution of CDQ scores (adult coeliacs)
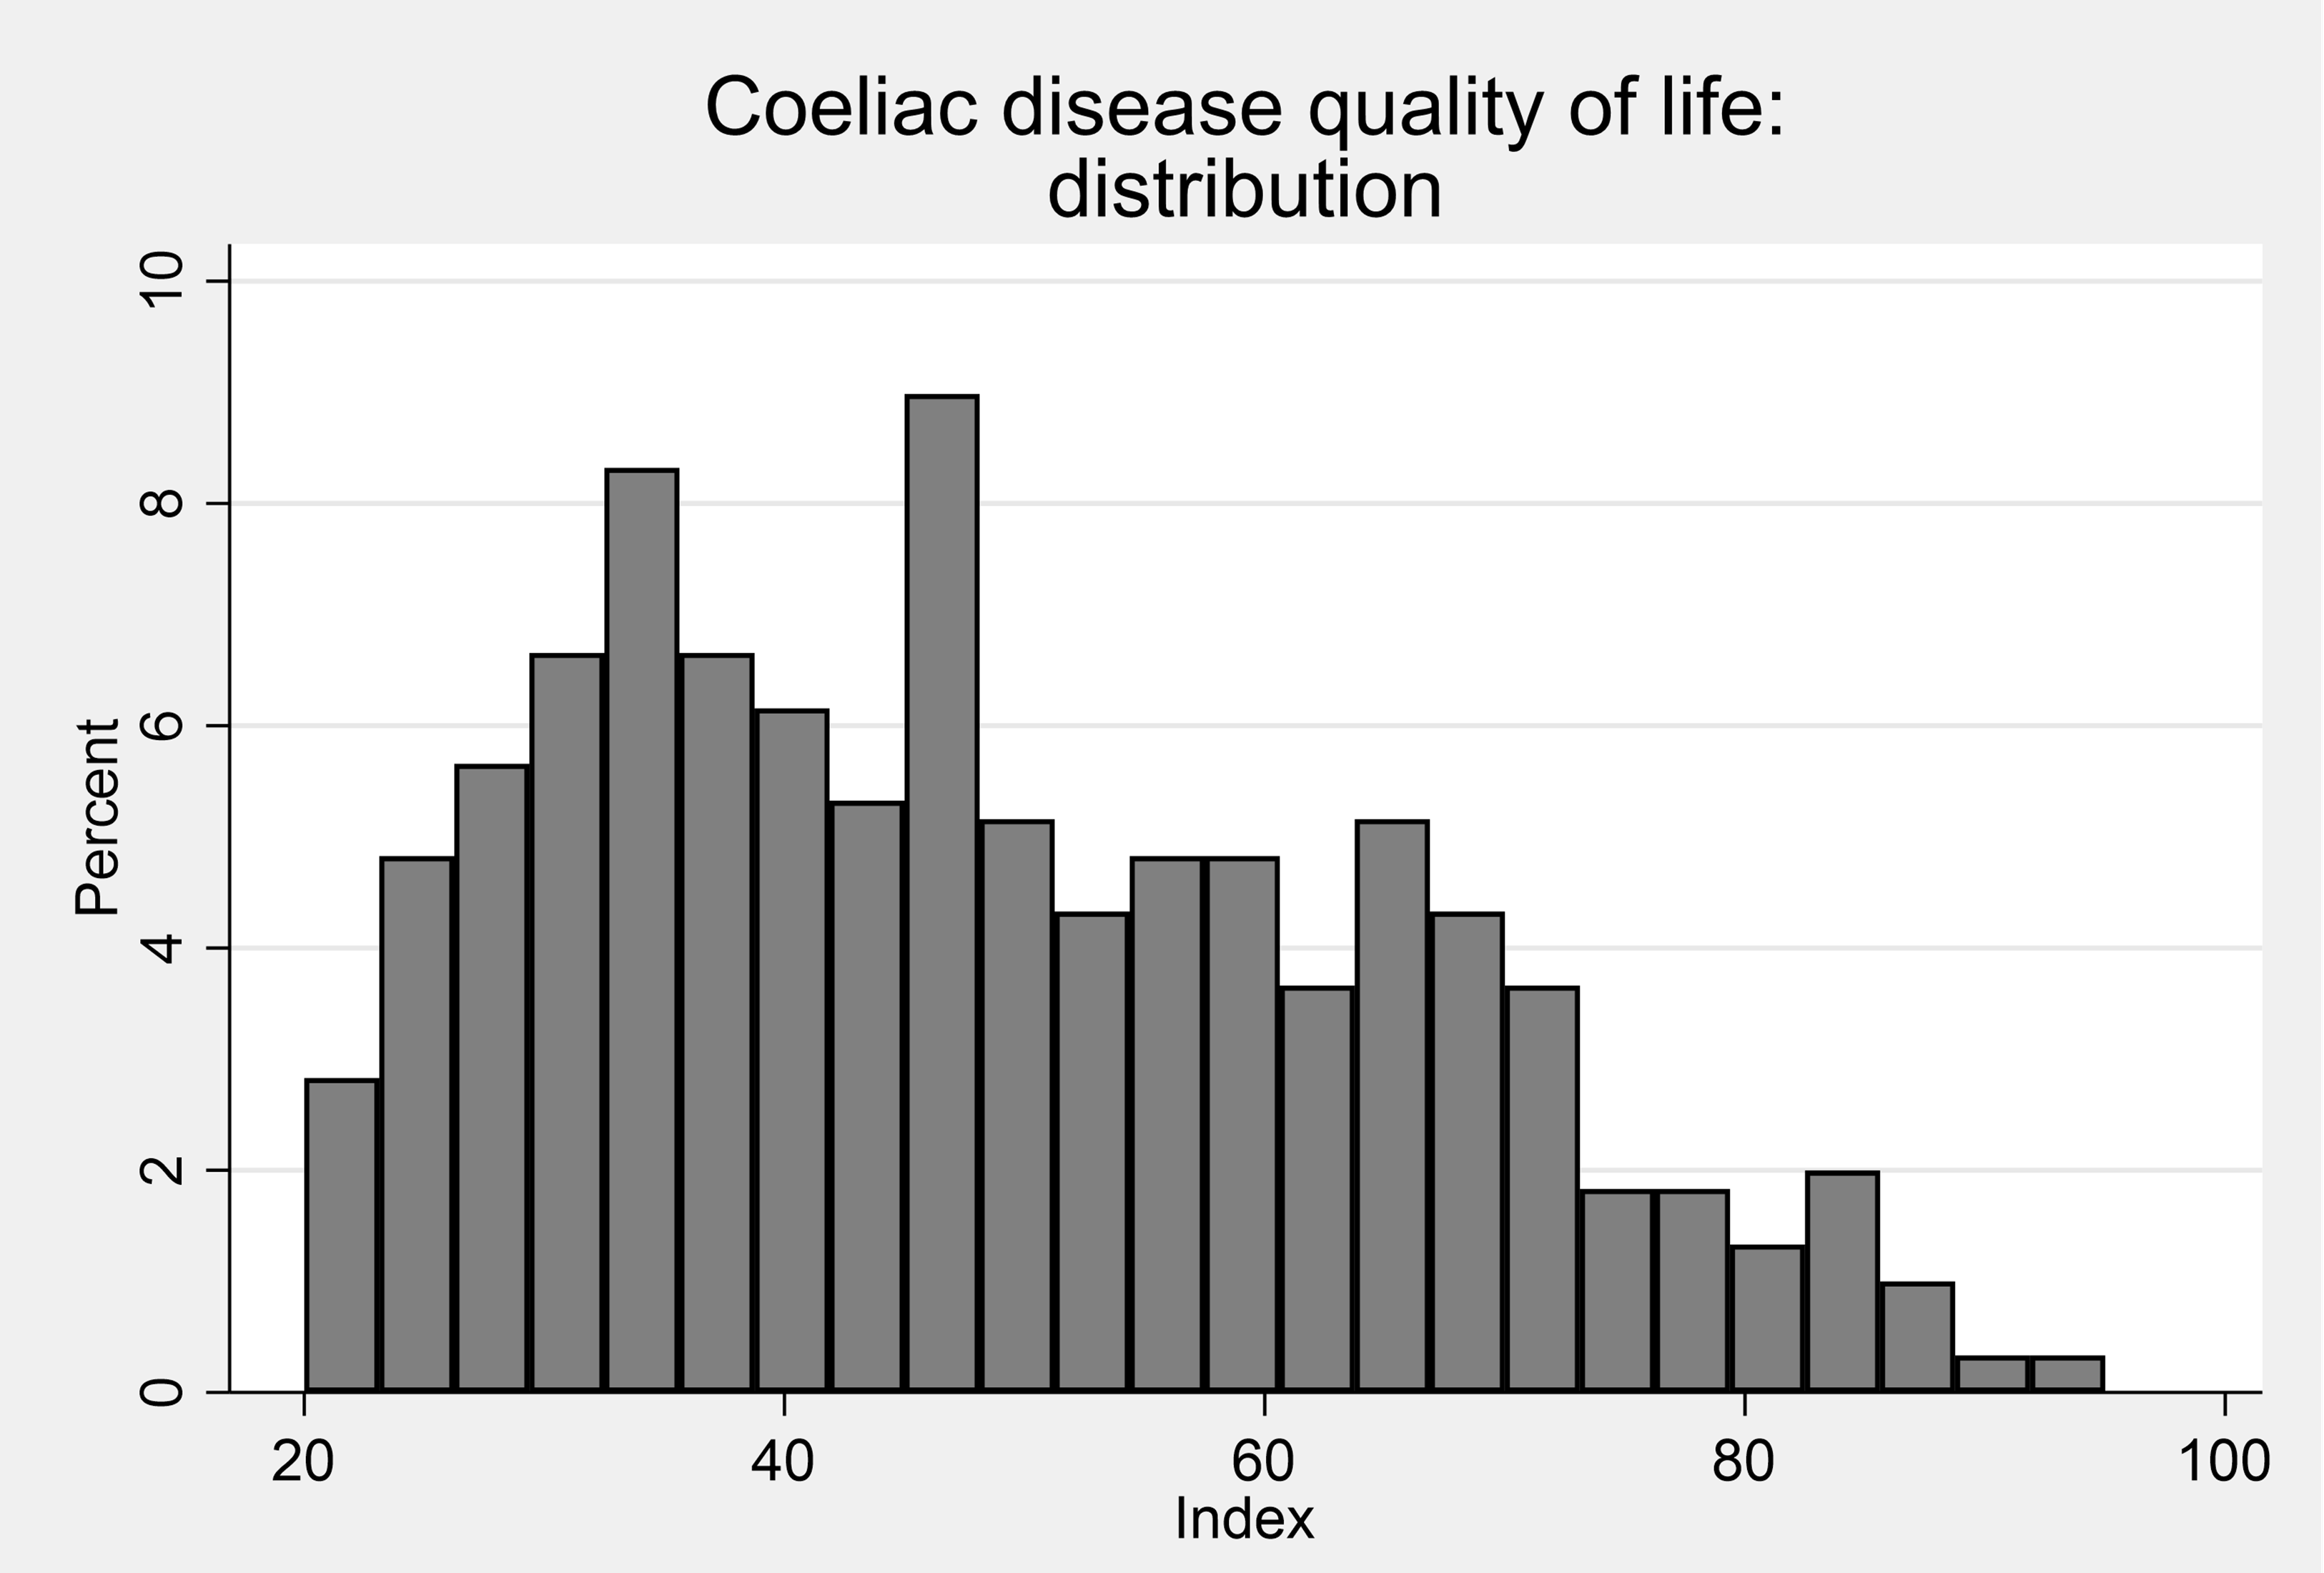
Male and female CDQ scores are very similar
Table 5. Summary statistics: CDQ Index by sex
| Sex | mean | sd | N | min | p25 | Median | p75 | max |
|---|---|---|---|---|---|---|---|---|
| Female | 50.263 | 16.648 | 293 | 21 | 37 | 48 | 63 | 89 |
| Male | 49.355 | 17.139 | 76 | 20 | 35 | 48 | 61.5 | 88 |
The CDQ scores declined as age increases- older people typically report less severe impacts of coeliac disease on their life. Epidemiological studies support that coeliac disease can develop at any age in the lifecourse [Dube et al (2005)]. The non-specific symptoms and/or asymptomatic nature of coeliac disease mean it is often diagnosed later (~ 40 to 50 years of age) in life but as people age they may adjust to living with their diagnosis such that it impacts less on day-to-day activities and wellbeing (see Table 6) [Paez et al (2017); Zipser et al (2003); Ludvigsson et al (2014)].
Table 6. Summary statistics: CDQ Index by age
| Age | mean | sd | N | min | p25 | Median | p75 | max |
|---|---|---|---|---|---|---|---|---|
| Below 35 years old | 57 | 15.42 | 79 | 27 | 44 | 58 | 67 | 89 |
| 35-54 years old | 51.31 | 17.36 | 164 | 21 | 37 | 51 | 65 | 95 |
| 55-64 years old | 46.65 | 15.99 | 177 | 20 | 34 | 44 | 55 | 90 |
| 65 years old and above | 43.42 | 16.06 | 180 | 20 | 30 | 41 | 54 | 88 |
Food Intolerance: FIQLQ
The FIQLQ is scored between 1 and 7 - the mean score in the adult sample was 4.5 and the median score was 4.7.
Table 7 Summary statistics: FIQLQ Index
| - | Mean | Std. Dev. | N | min | p25 | Median | p75 | max |
|---|---|---|---|---|---|---|---|---|
| FIQ total | 4.49 | 1.53 | 440 | 1.06 | 3.28 | 4.67 | 5.72 | 7 |
Figure 3 Distribution of FIQLQ scores (adult intolerance)
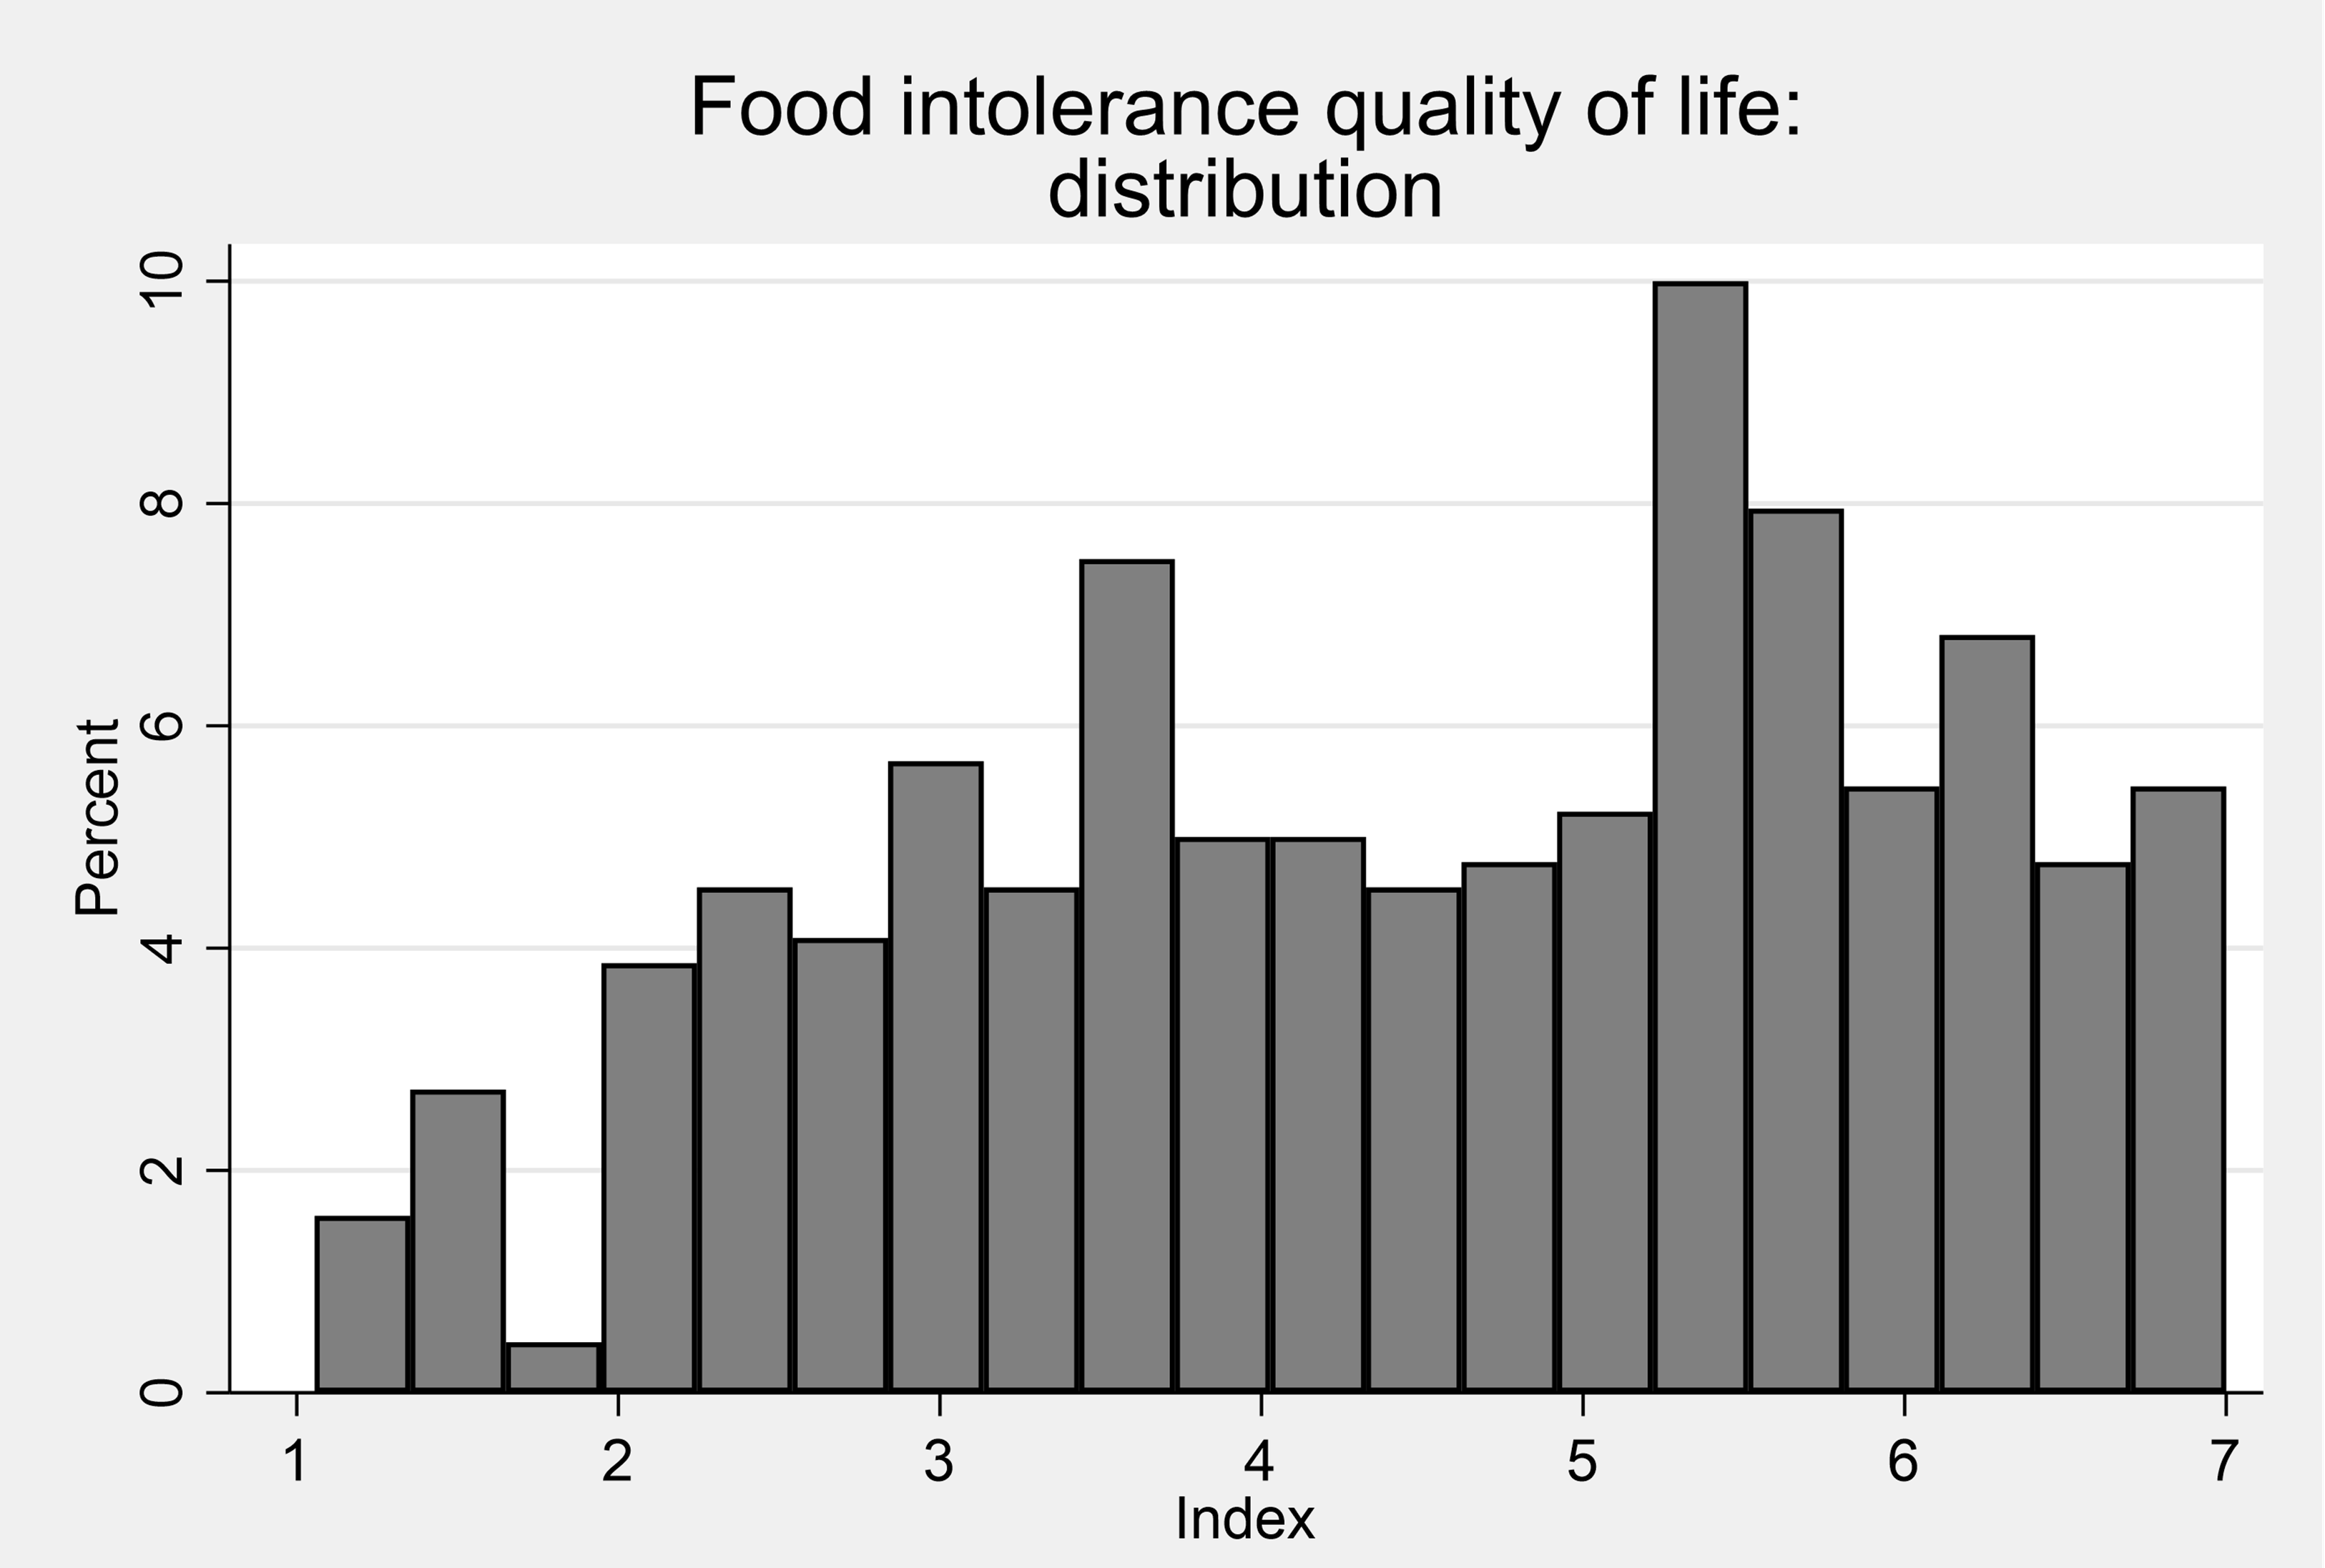
Women’s FIQLQ scores were on average higher than men’s, mean their food intolerance impacts were greater than those for men.
Table 8. Summary statistics: FIQLQ Index by sex
| Sex | mean | sd | N | min | p25 | Median | p75 | max |
|---|---|---|---|---|---|---|---|---|
| Female | 4.46 | 1.46 | 276 | 1.17 | 3.39 | 4.56 | 5.61 | 7 |
| Male | 4.18 | 1.56 | 92 | 1.06 | 2.97 | 4.33 | 5.47 |
6.72 |
The scores were similar across age groups except for those over 65 whose scores were lower than the younger age groups.
The FIQLQ scores increased as age increases - older people typically report more severe impacts of their food intolerance.
Table 9. Summary statistics: FIQLQ Index by age
| Age | mean | sd | N | min | p25 | Median | p75 | max |
|---|---|---|---|---|---|---|---|---|
| Below 35 years old | 4.27 | 1.49 | 62 | 1.56 | 3.06 | 4.17 | 5.5 | 6.94 |
| 35-54 years old | 4.46 | 1.5 | 158 | 1.06 | 3.22 | 4.72 | 5.61 | 7 |
| 55-64 years old | 4.51 | 1.49 | 124 | 1.17 | 3.39 | 4.69 | 5.67 | 7 |
| 65 years old and above | 4.66 | 1.68 | 93 | 1.06 | 3.56 | 5.11 | 6.11 | 7 |
Child Results:
Child Food Allergy: FAQLQ-PF and FAQLQ-PFT
The Food Allergy Quality of Life Questionnaire-Parent Form (FAQLQ-PF) was used for children aged 0-12 and the Food Allergy Quality of Life Questionnaire – Parent Form – for Adolescents (FAQLQ-PFT) was used for adolescents aged 13-17. These forms were completed by parents.
Both instruments, like the adult FAQLQ, comprises multiple items scored 1 to 7. The scores are averaged across the items to generate an individual-level score between 1 and 7.
The child/youth mean and median FAQLQ scores was 4.1.
Table 10. Summary statistics: child/youth FAQLQ index
| - | Mean | Std. Dev. | N | min | p25 | Median | p75 | max |
|---|---|---|---|---|---|---|---|---|
| FAQ | 4.1 | 1.41 | 496 | 1 | 3.04 | 4.07 | 5.15 | 7 |
Figure 4. Distribution of FAQLQ scores (child, allergy)
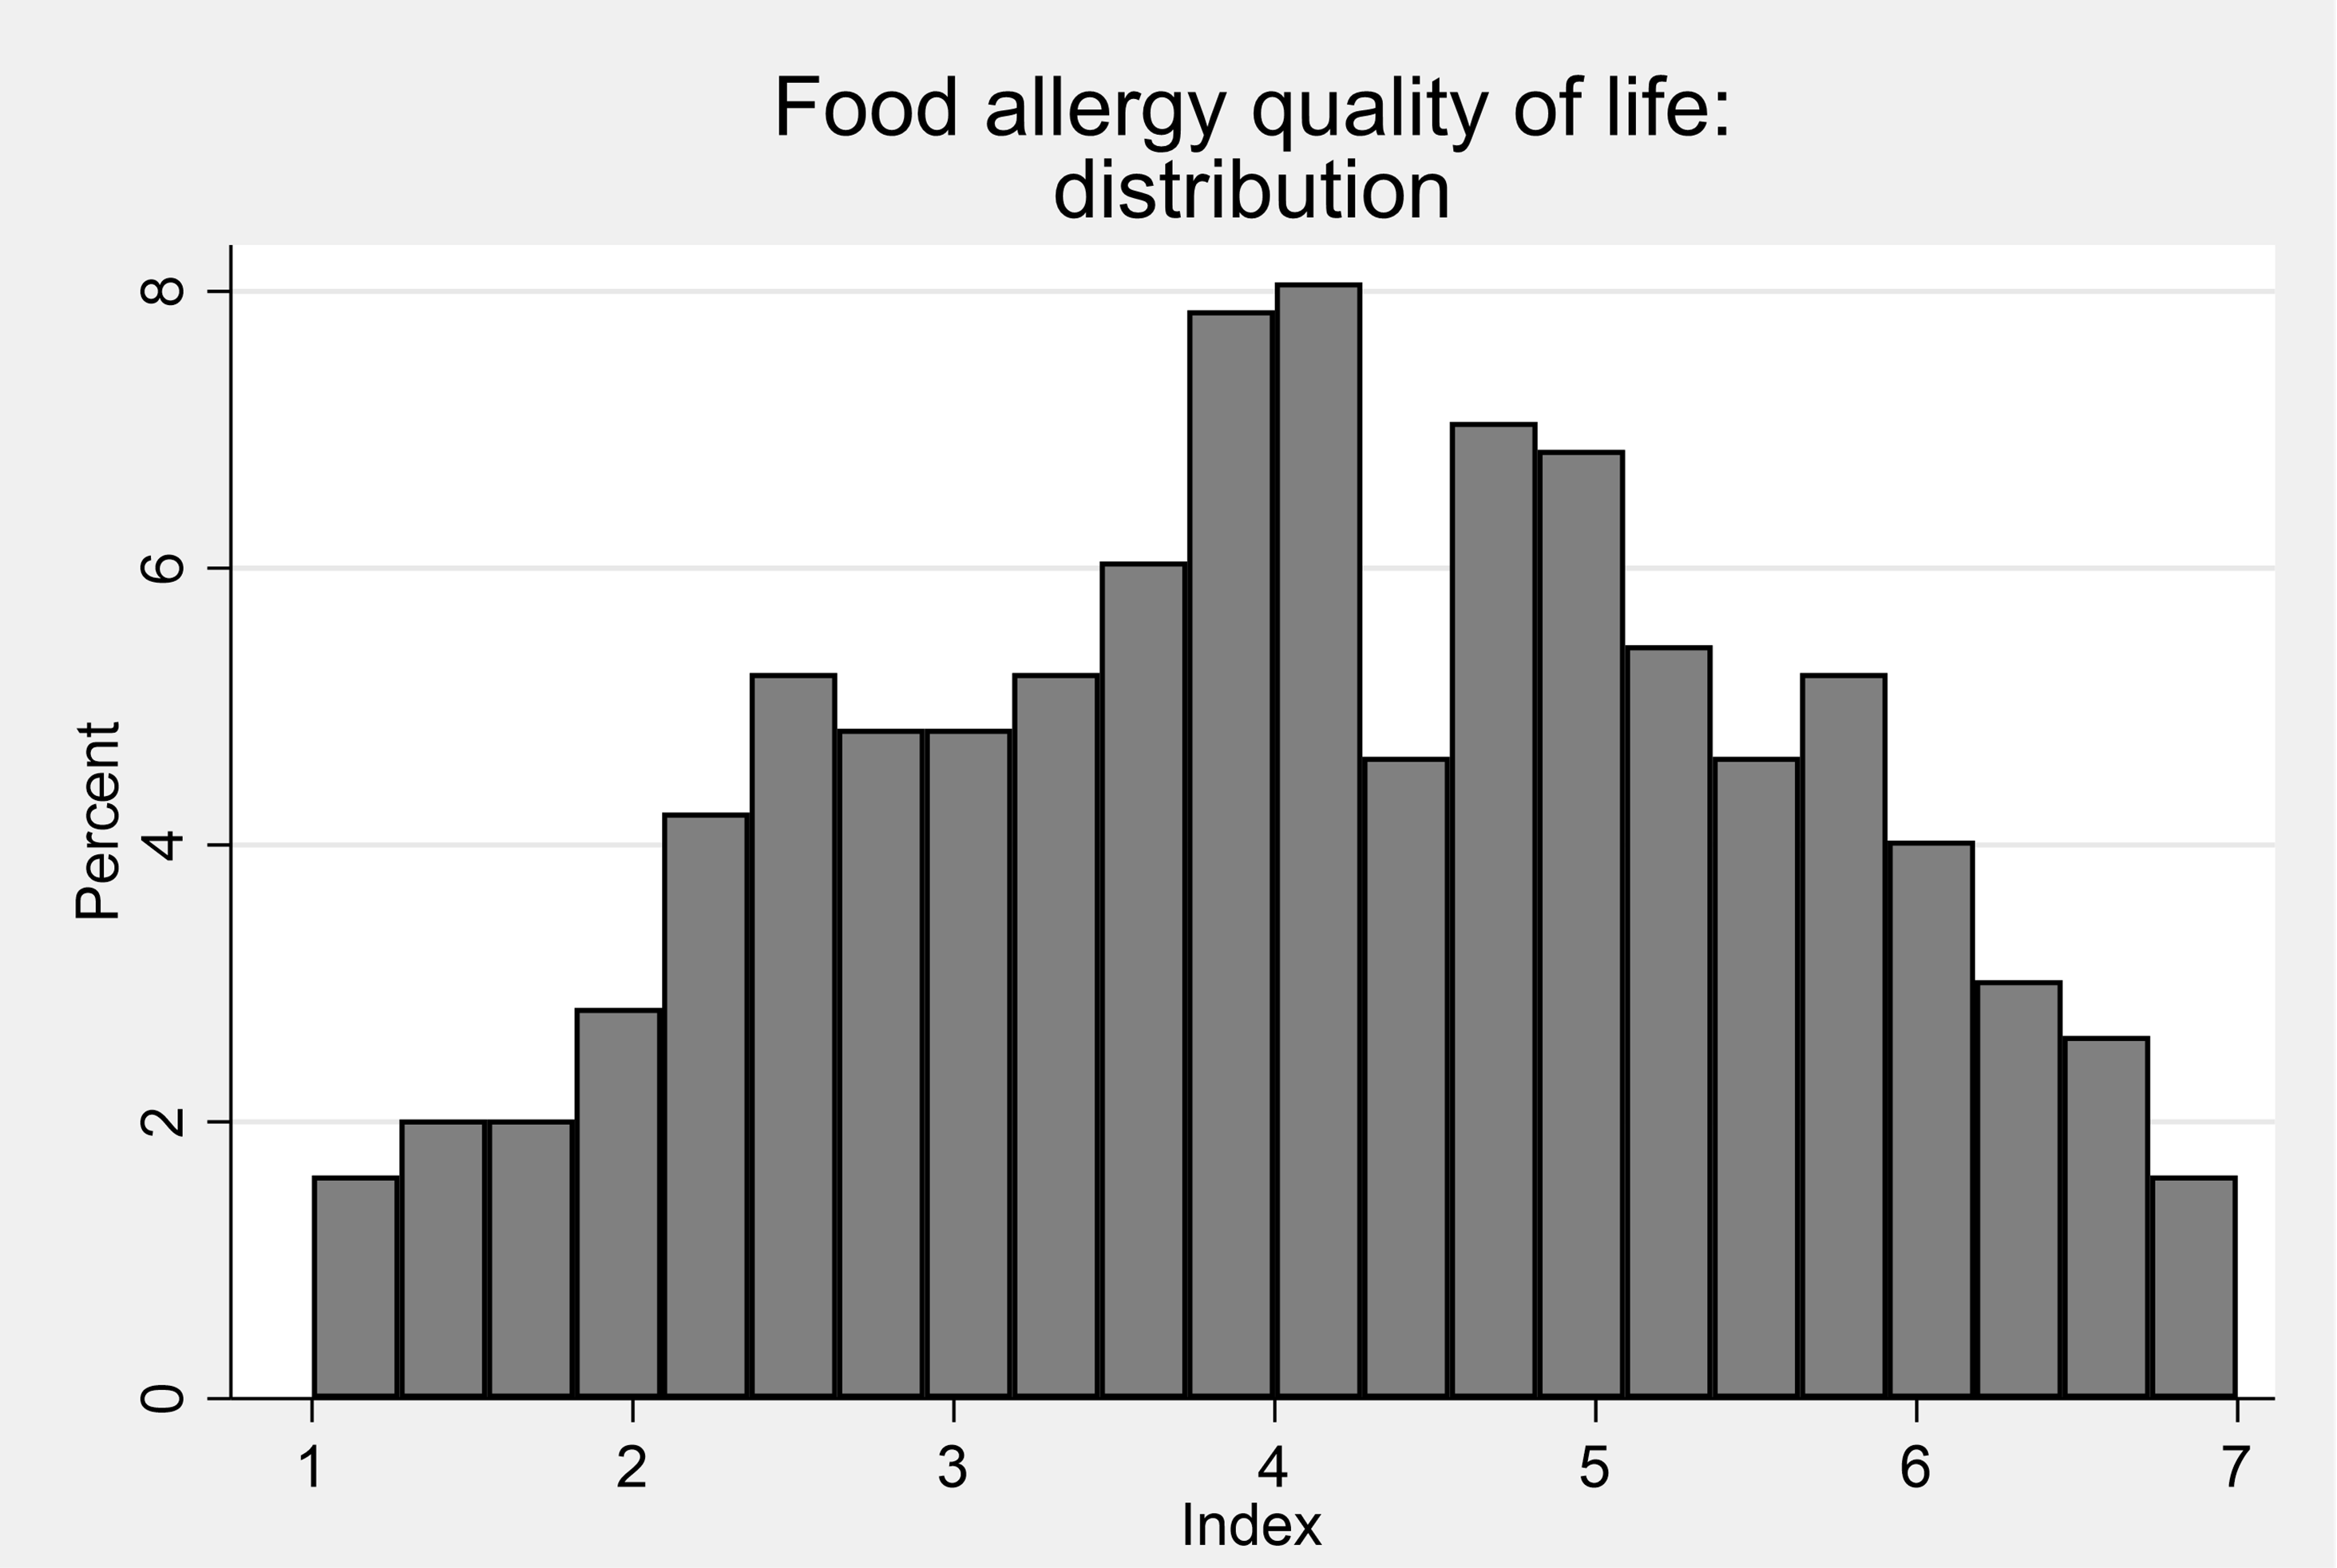
Child Food Intolerance: FIQLQ-PF
The Food Intolerance Quality of Life Questionnaire- Parent Form (FIQLQ-PF) was used for all children (although the questions used differ according to the age of the child). These assessments were completed by parents. The mean FIQLQ-PF score was 3.6 and the distribution of scores is shown in Figure 5.
Table 11. Summary statistics: FIQLQ-PF Index
| - | Mean | Std. Dev. | N | min | p25 | Median | p75 | max |
|---|---|---|---|---|---|---|---|---|
| FIQ | 3.63 | 1.4 | 147 | 1.16 | 2.55 | 3.5 | 4.68 | 6.8 |
Figure 5. Distribution of FIQLQ scores (child, intolerance)
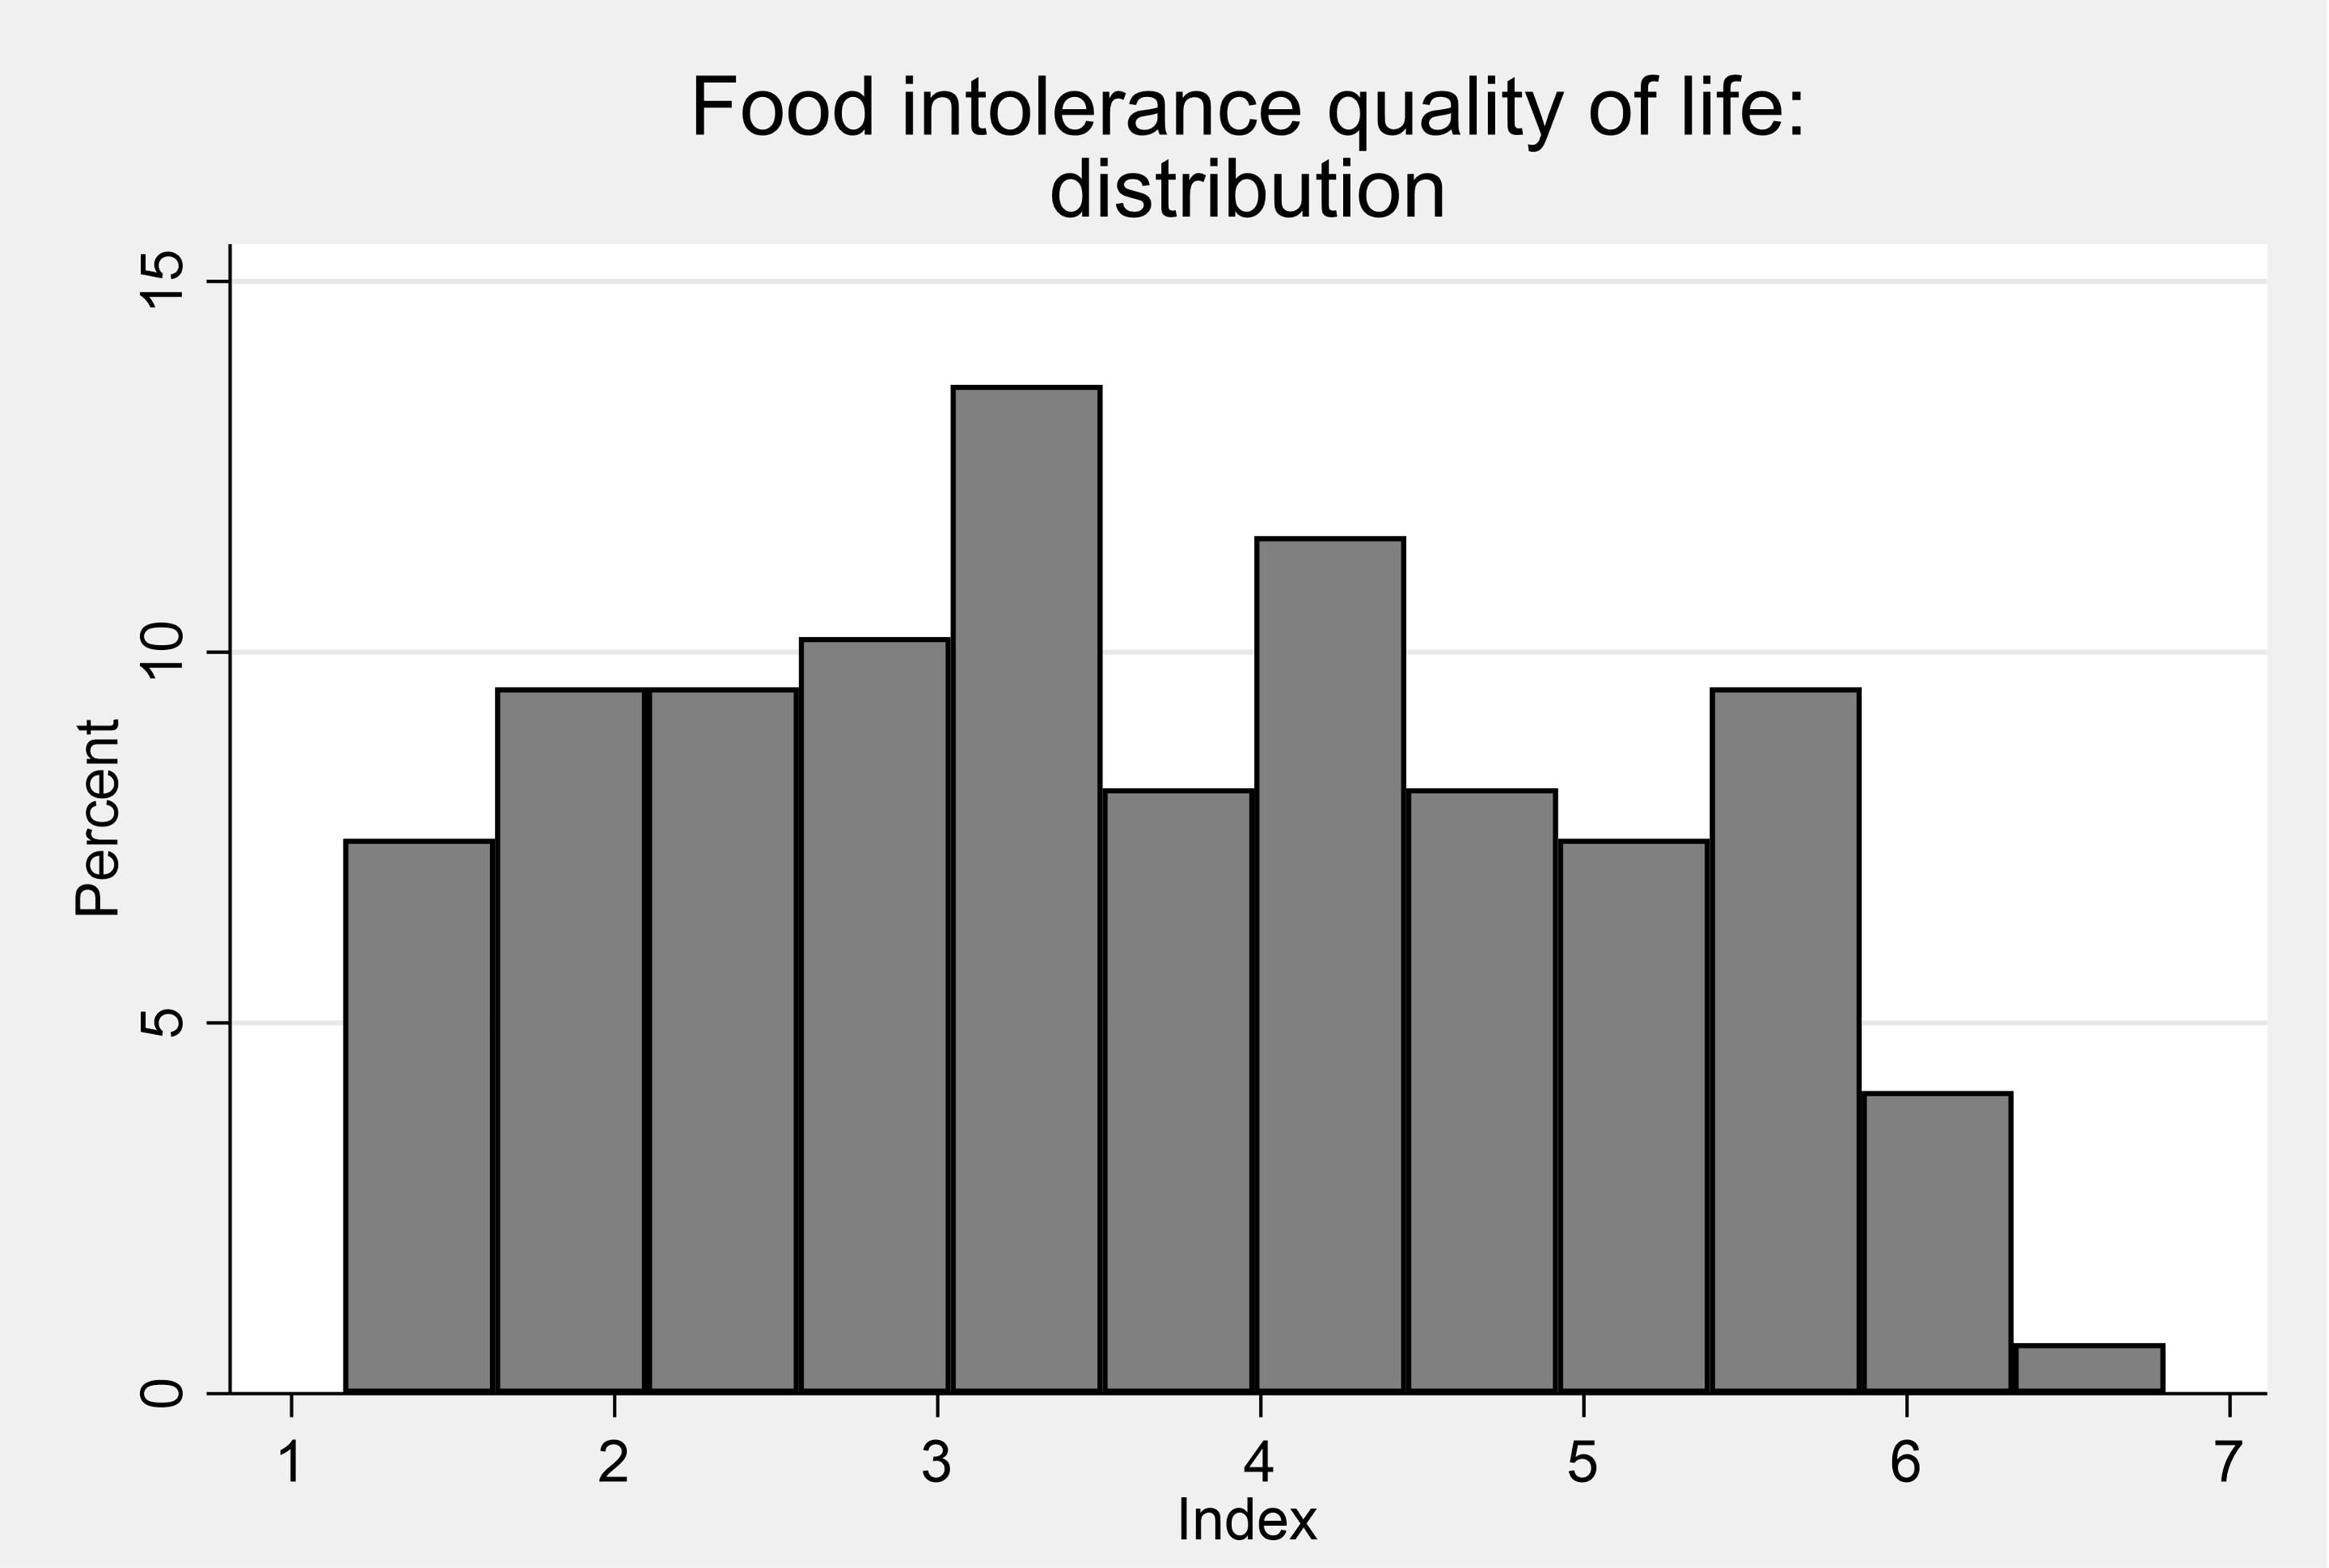
Child Coeliac Disease: Celiac Disease DUX (CCDUX)
The Coeliac Disease DUX (CCDUX) is a validated HRQOL proxy questionnaire that parents complete about their children's condition. Responses are rated on a five-picture facial expression Likert scale on which a higher score indicates a worse quality of life.
Table 12. Summary statistics: CCDUX index
| - | Mean | Std. Dev. | N | min | p25 | Median | p75 | max |
|---|---|---|---|---|---|---|---|---|
| CCDUX | 41.66 | 9.18 | 73 | 15 | 36 | 42 | 48 | 60 |
Figure 6. Distribution of CCDUX scores (child, coeliac)
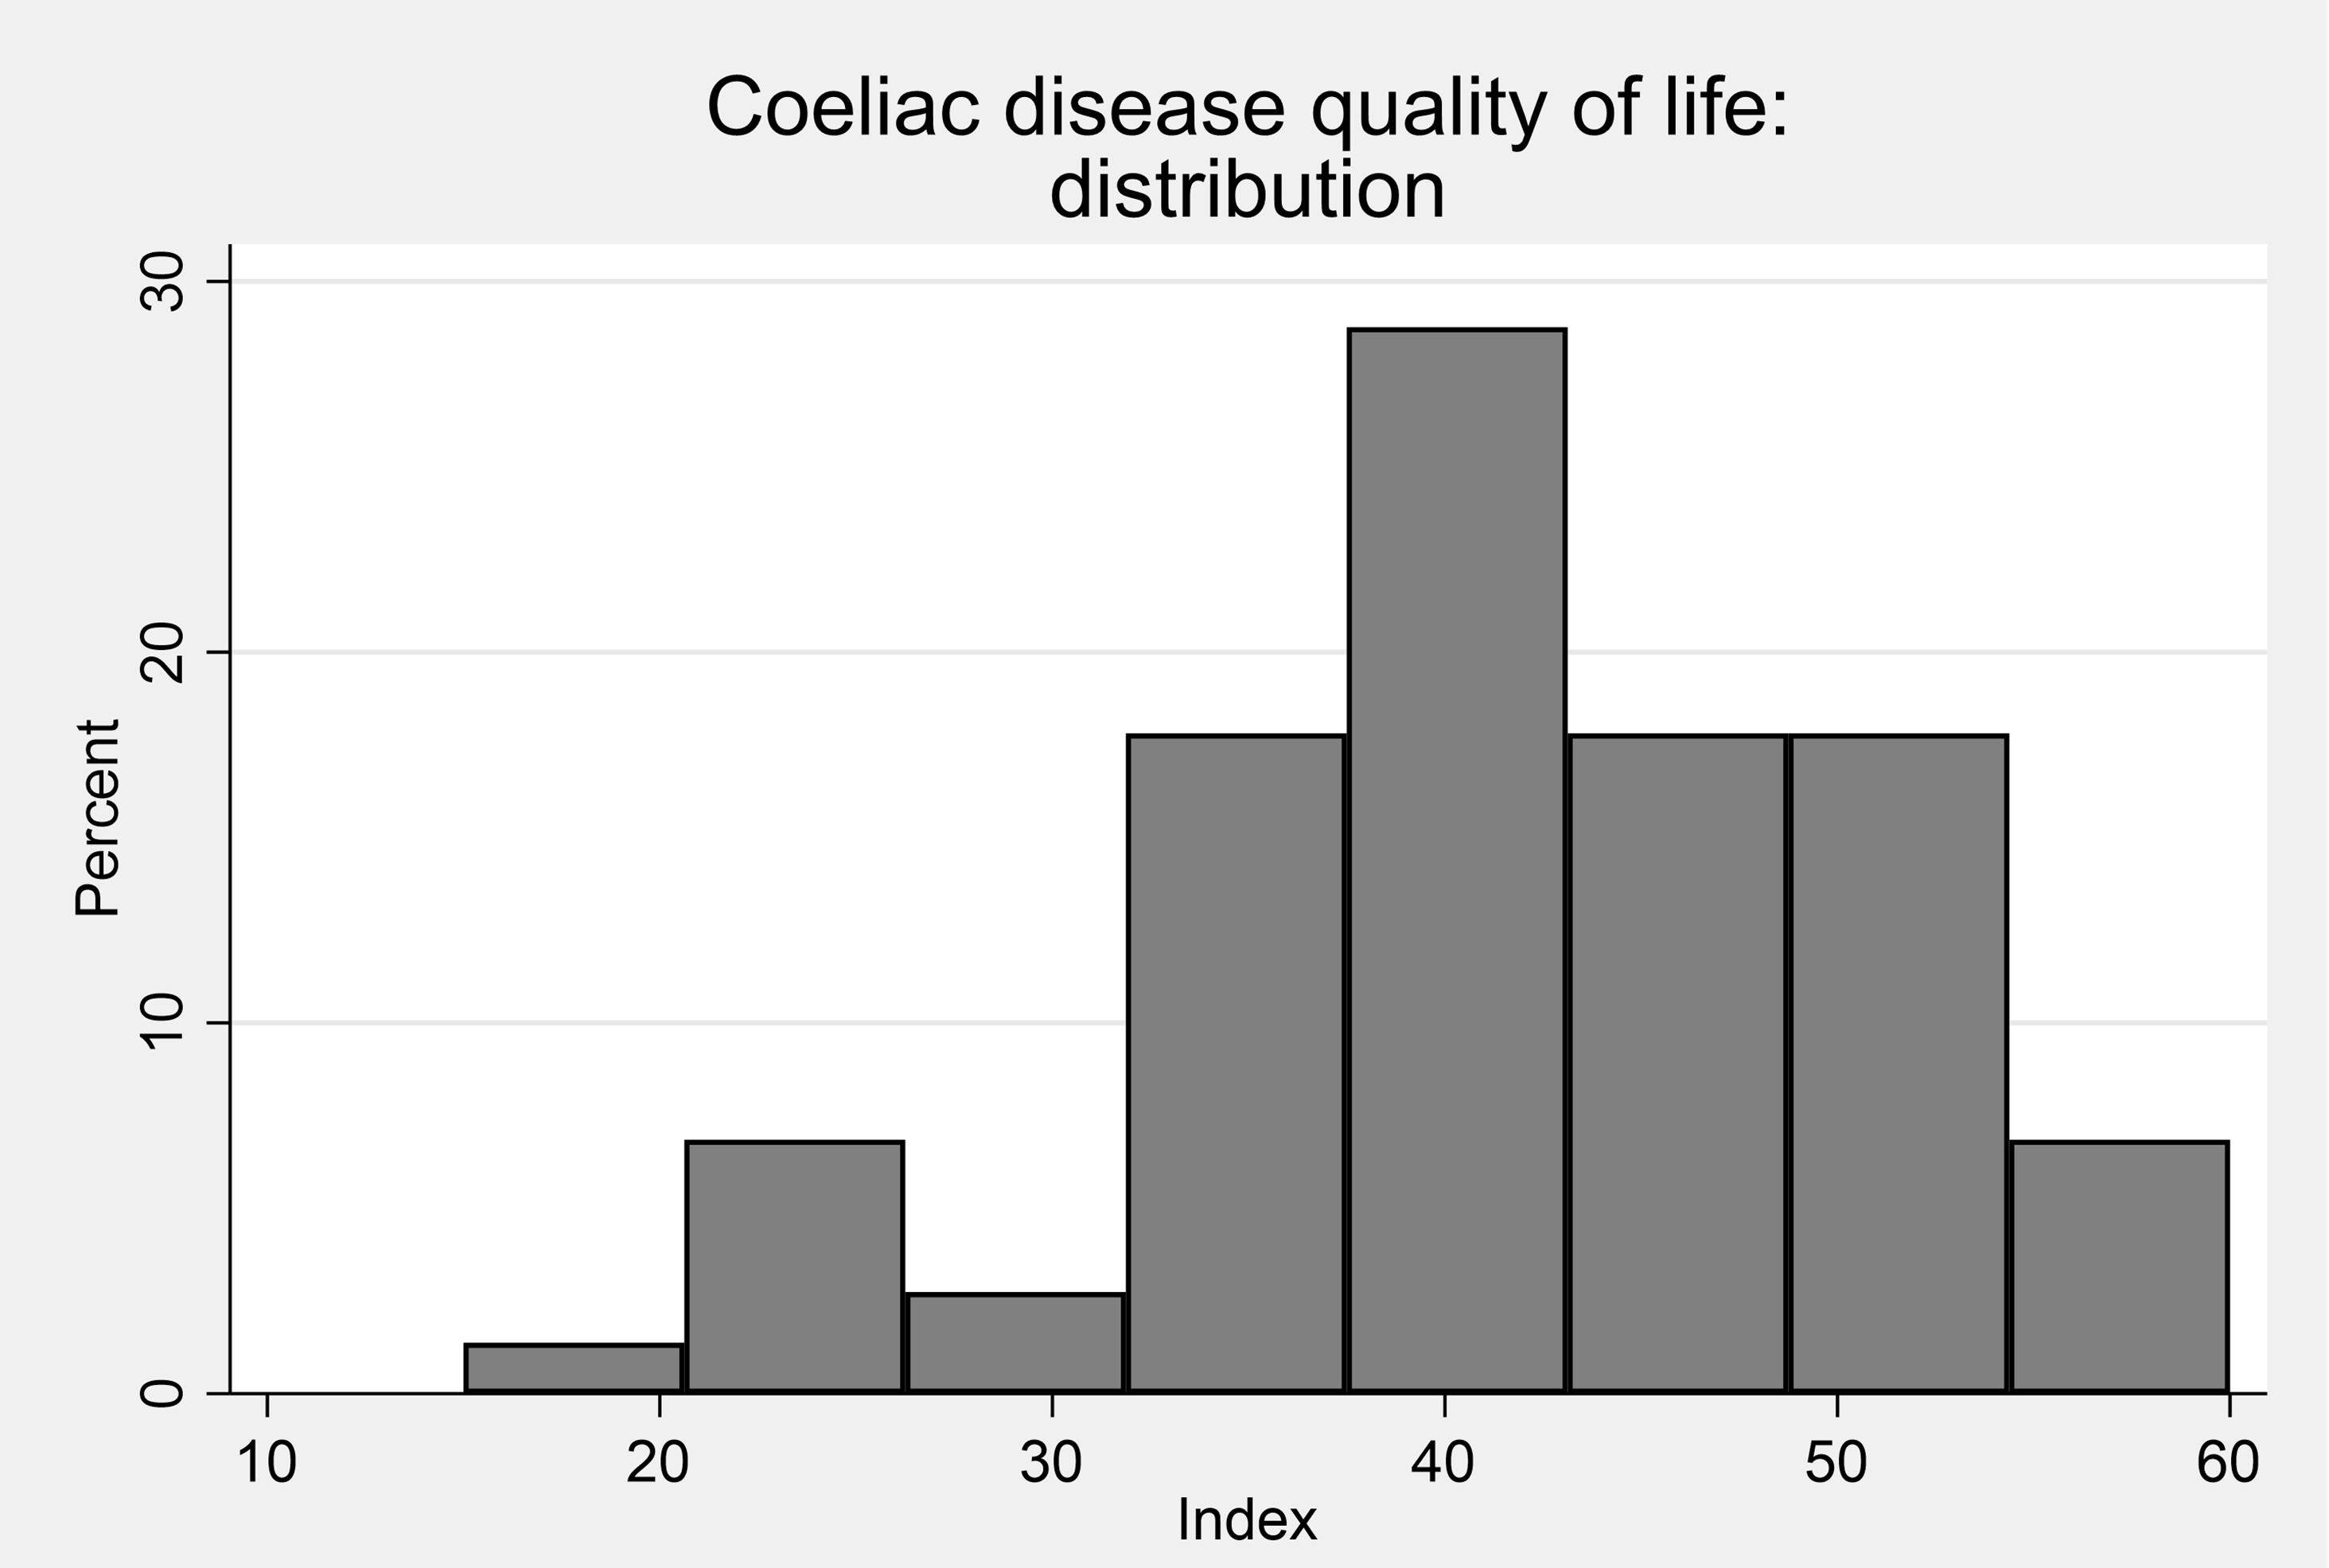
Respondents were asked to complete a health-related quality of life scale appropriate to their self-reported food hypersensitivity:
- Food Allergy Quality of Life Questionnaire (FAQLQ) for food allergy.
- Food Intolerance Quality of Life Questionnaire (FIQLQ) for food intolerance.
- Coeliac Disease Quality of Life scale (CDQoL) for coeliac disease.
The FAQLQ and FIQLQ are rated on a scale from 1 (least impairment on quality of life) to 7 (maximal impairment on quality of life).
The CDQ is rated on a five-point scale, with the 20 items scores summed – having a range of 20-100.
Each scale consists of food hypersensitivity specific subscales.
For those completing the FAQLQ, these are:
- Allergen Avoidance and Dietary Restrictions (AADR), which considers the impact that a restrictive diet has on quality of life and the impact this also has on social activities;
- Emotional Impact (EI) relating to the worries and concerns about having an allergic reaction or consuming allergens;
- Risk of Accidental Exposure (RAE), relating to vigilance and awareness needed to avoid ingesting allergens; and
- Food Allergy related Health (FAH), relating to specific health anxiety about having an allergy or reaction.
For the CDQ, subscales comprise of:
- limitations, relating to social and dietary limitations of having coeliac disease;
- Dysphoria, related to negative feelings of having coeliac disease;
- Health Concerns, concerns about the wider impact having coeliac disease will have on health; and
- Inadequate treatment, feelings that there are not enough treatment options for the disease.
For the FIQLQ scale, subscales comprise:
- Emotional Impact (EI), related to the stresses and concerns of having to be aware of foods that could cause a reaction;
- Social and Dietary restrictions (SDR), related to the impact that having an intolerance has on diet and social activities (for example, eating out); and
- Reactions and Avoidance (RAv), related to negative feelings about having a reaction (for example, embarrassment and discouragement).
The distribution of the subscales, in aggregate and by characteristics are displayed in this Appendix.
FAQLQ subscales
Table 1. Summary statistics: FAQLQ Index by domain
| Domain | Mean | Std. Dev. | N | min | p25 | Median | p75 | max |
|---|---|---|---|---|---|---|---|---|
| FAQ total | 4.76 | 1.49 | 385 | 1.14 | 3.66 | 5.1 | 6 | 7 |
| FAQ AADR | 4.87 | 1.57 | 385 | 1 | 3.73 | 5.09 | 6.18 | 7 |
| FAQ EI | 4.88 | 1.62 | 385 | 1 | 3.71 | 5.14 | 6.29 | 7 |
| FAQ AE | 4.78 | 1.63 | 385 | 1 | 3.5 | 5.13 | 6.13 | 7 |
| FAQ FAH | 4.06 | 1.63 | 385 | 1 | 3 | 4 | 5.33 | 7 |
Figure 1. FAQLQ Index by domain
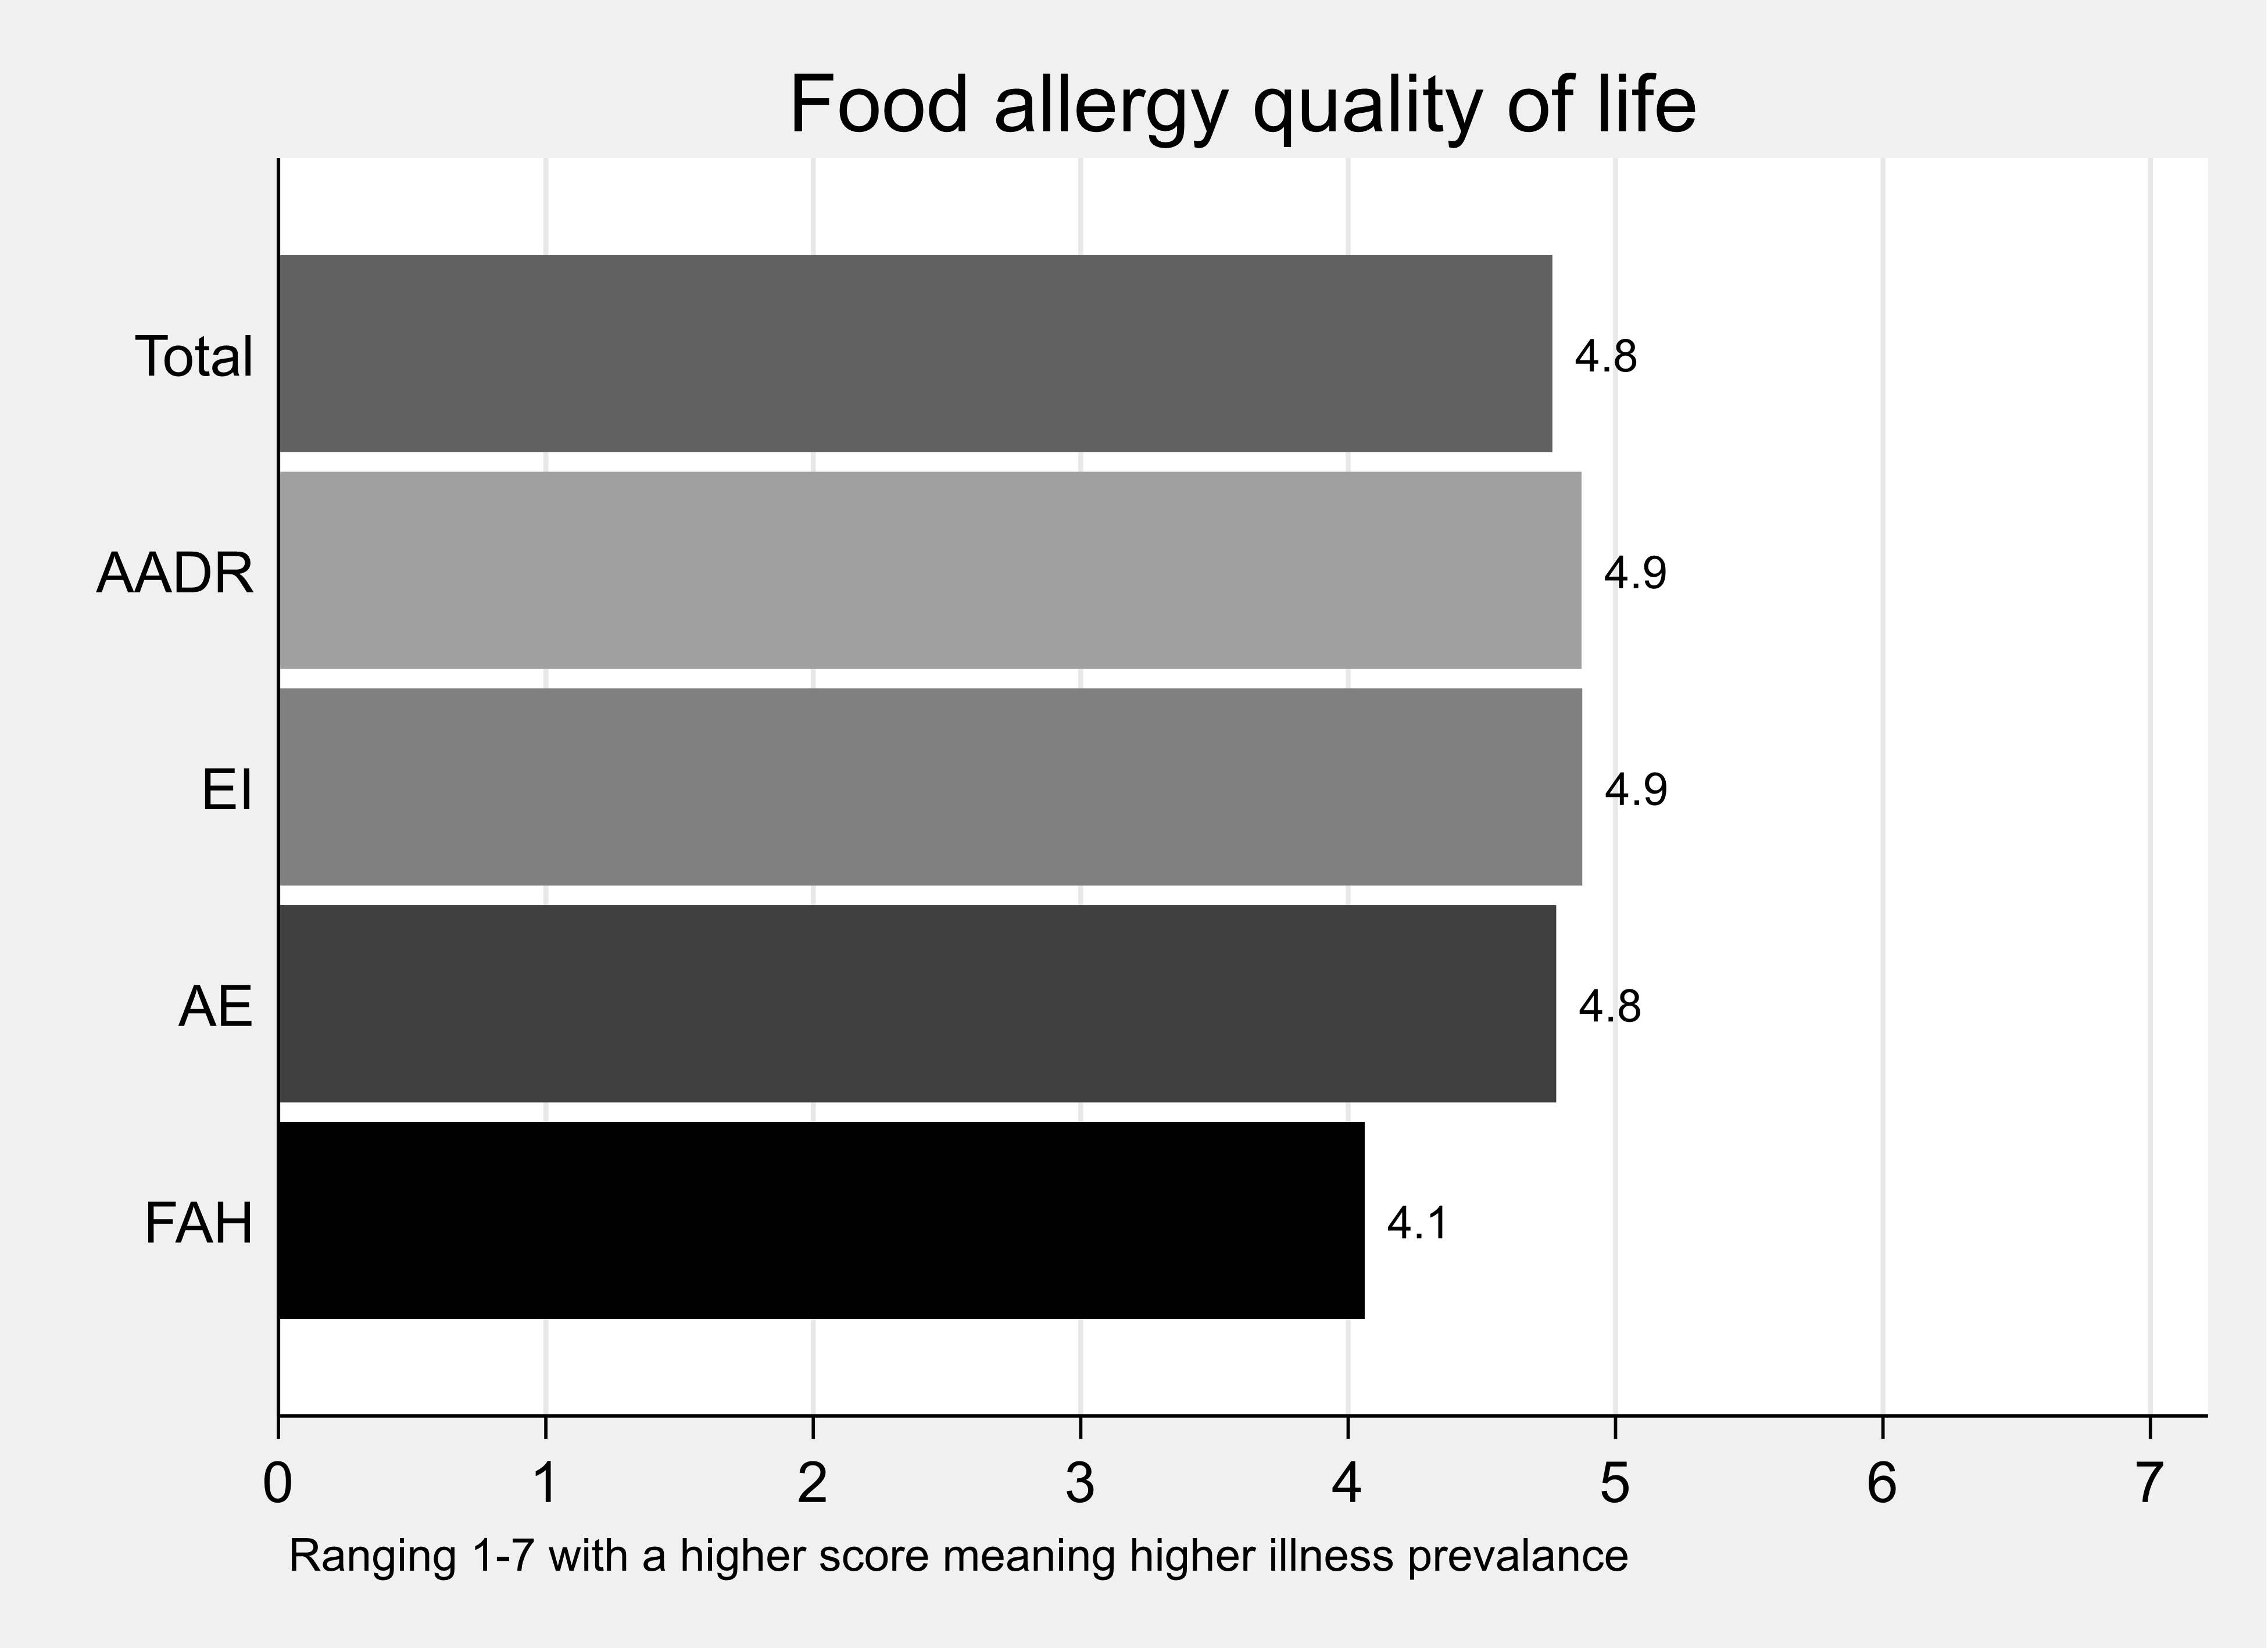
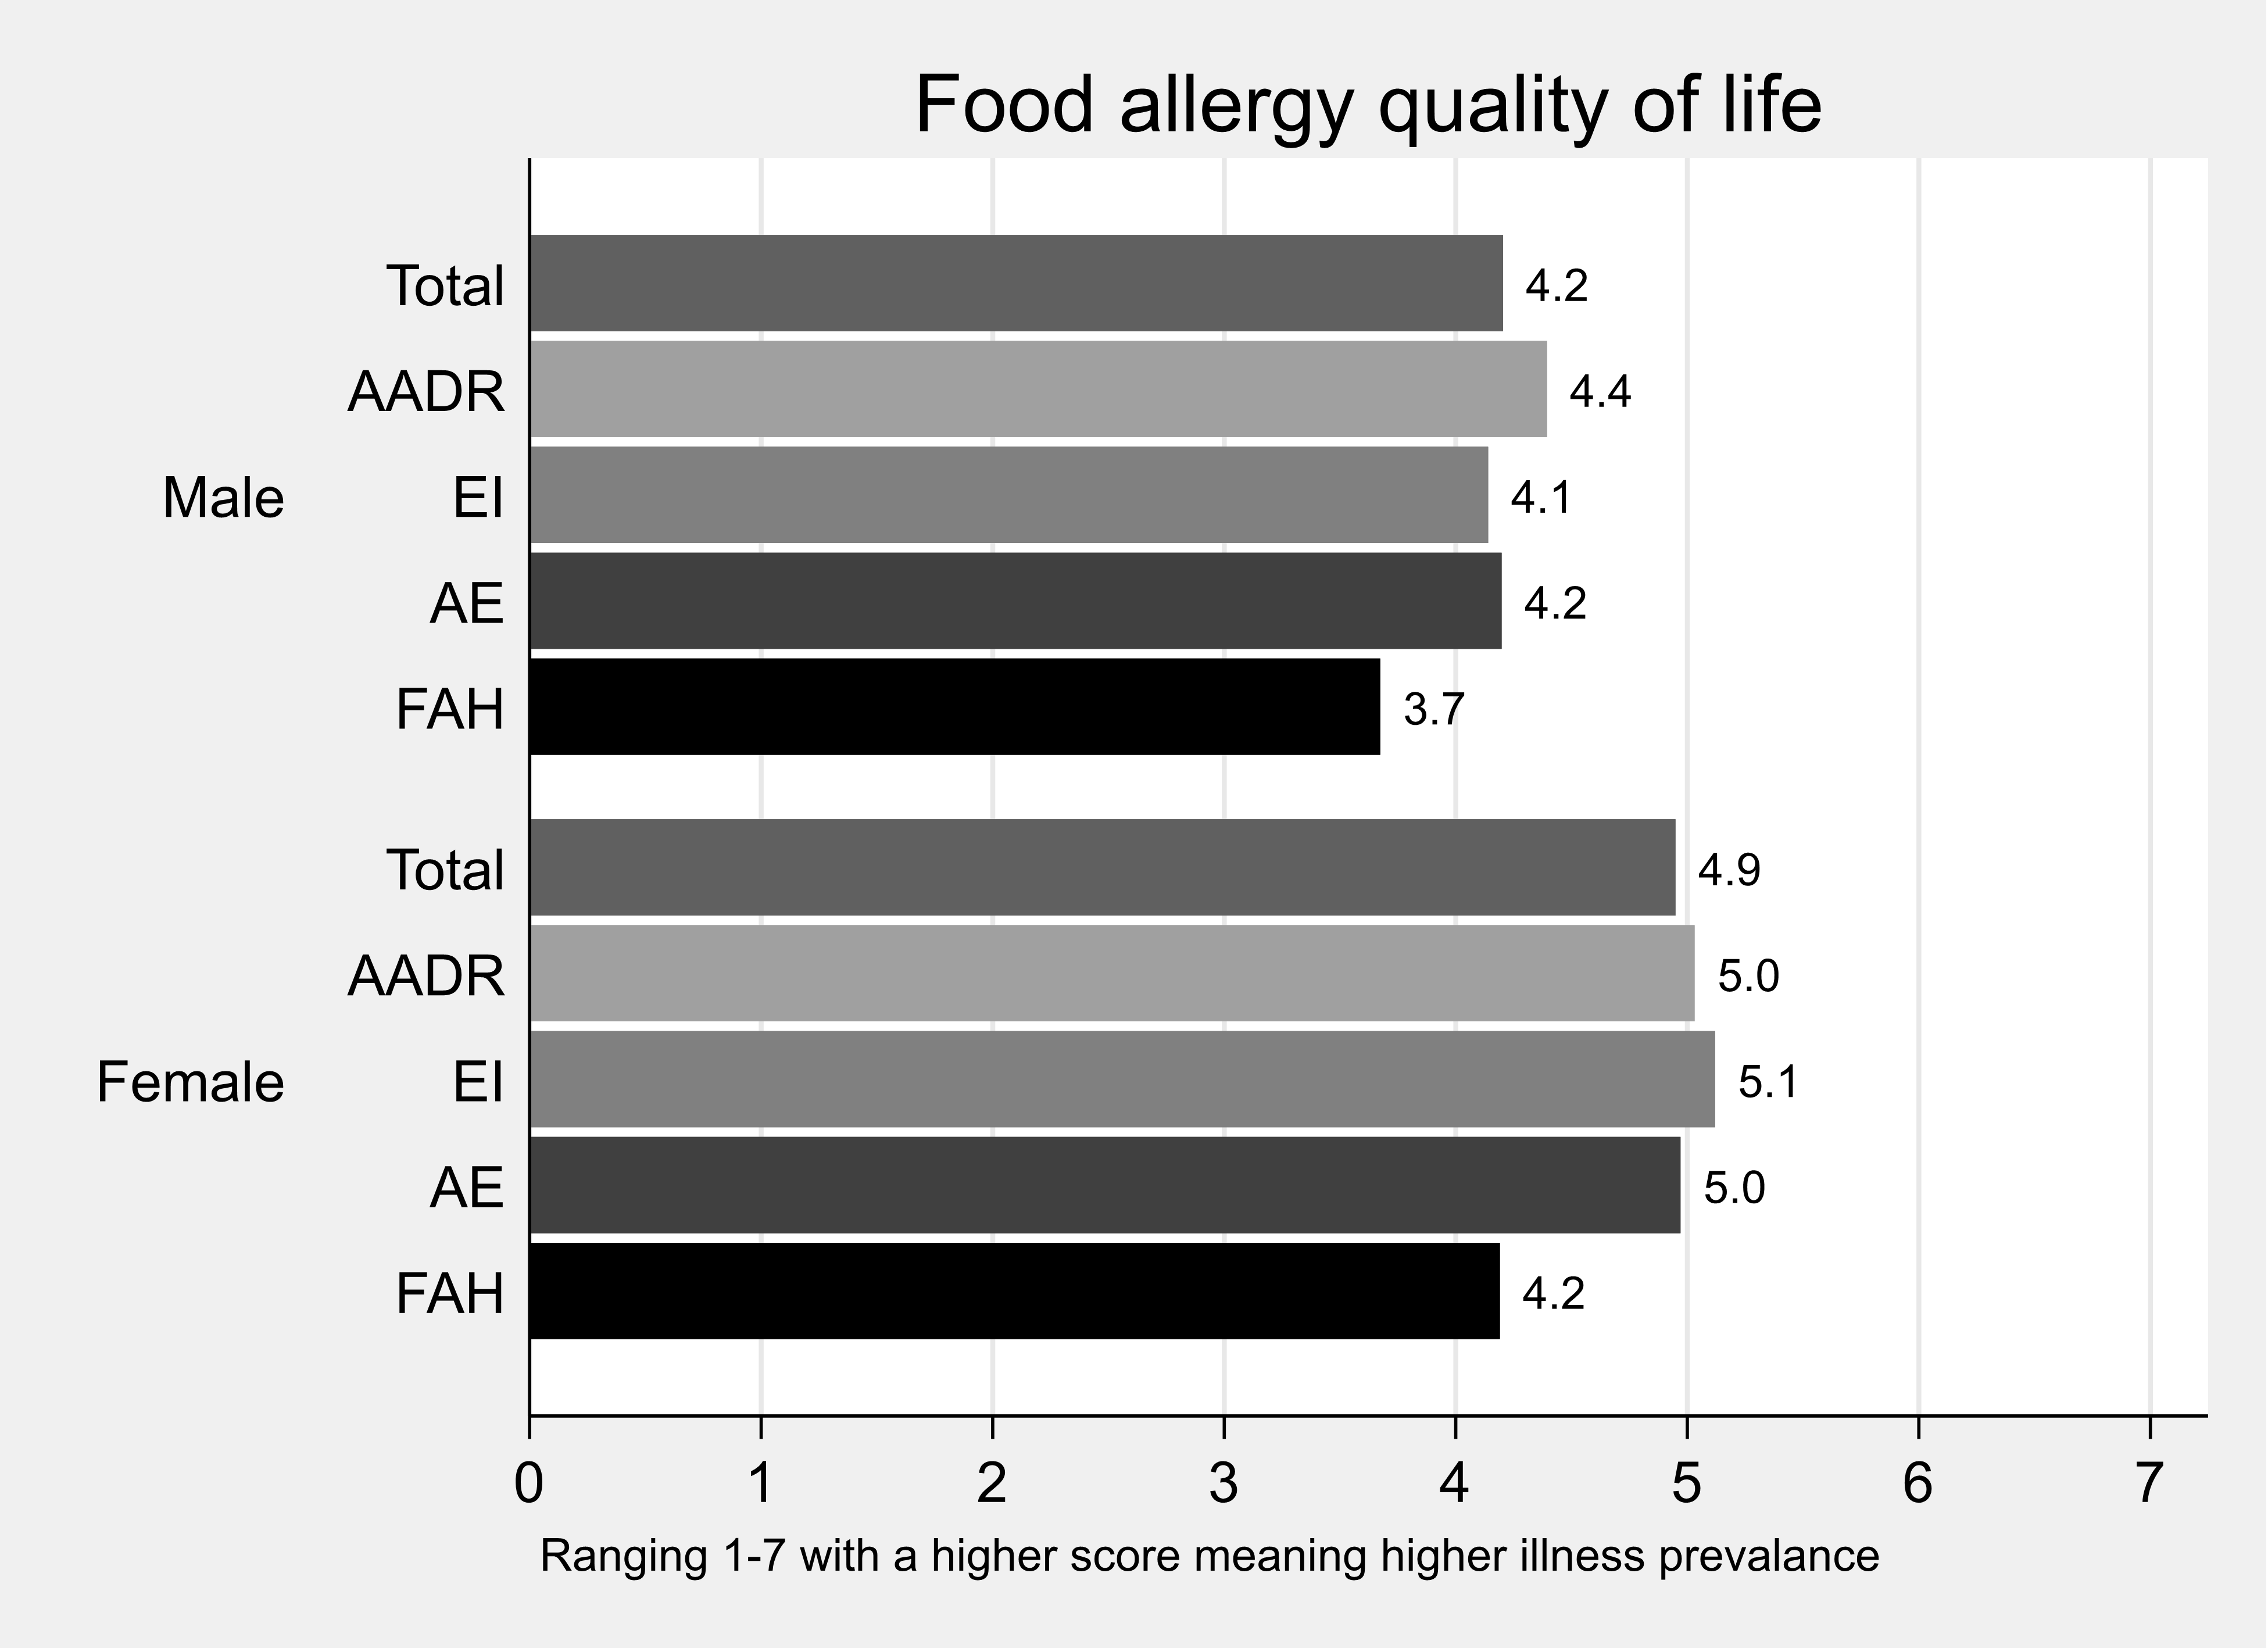
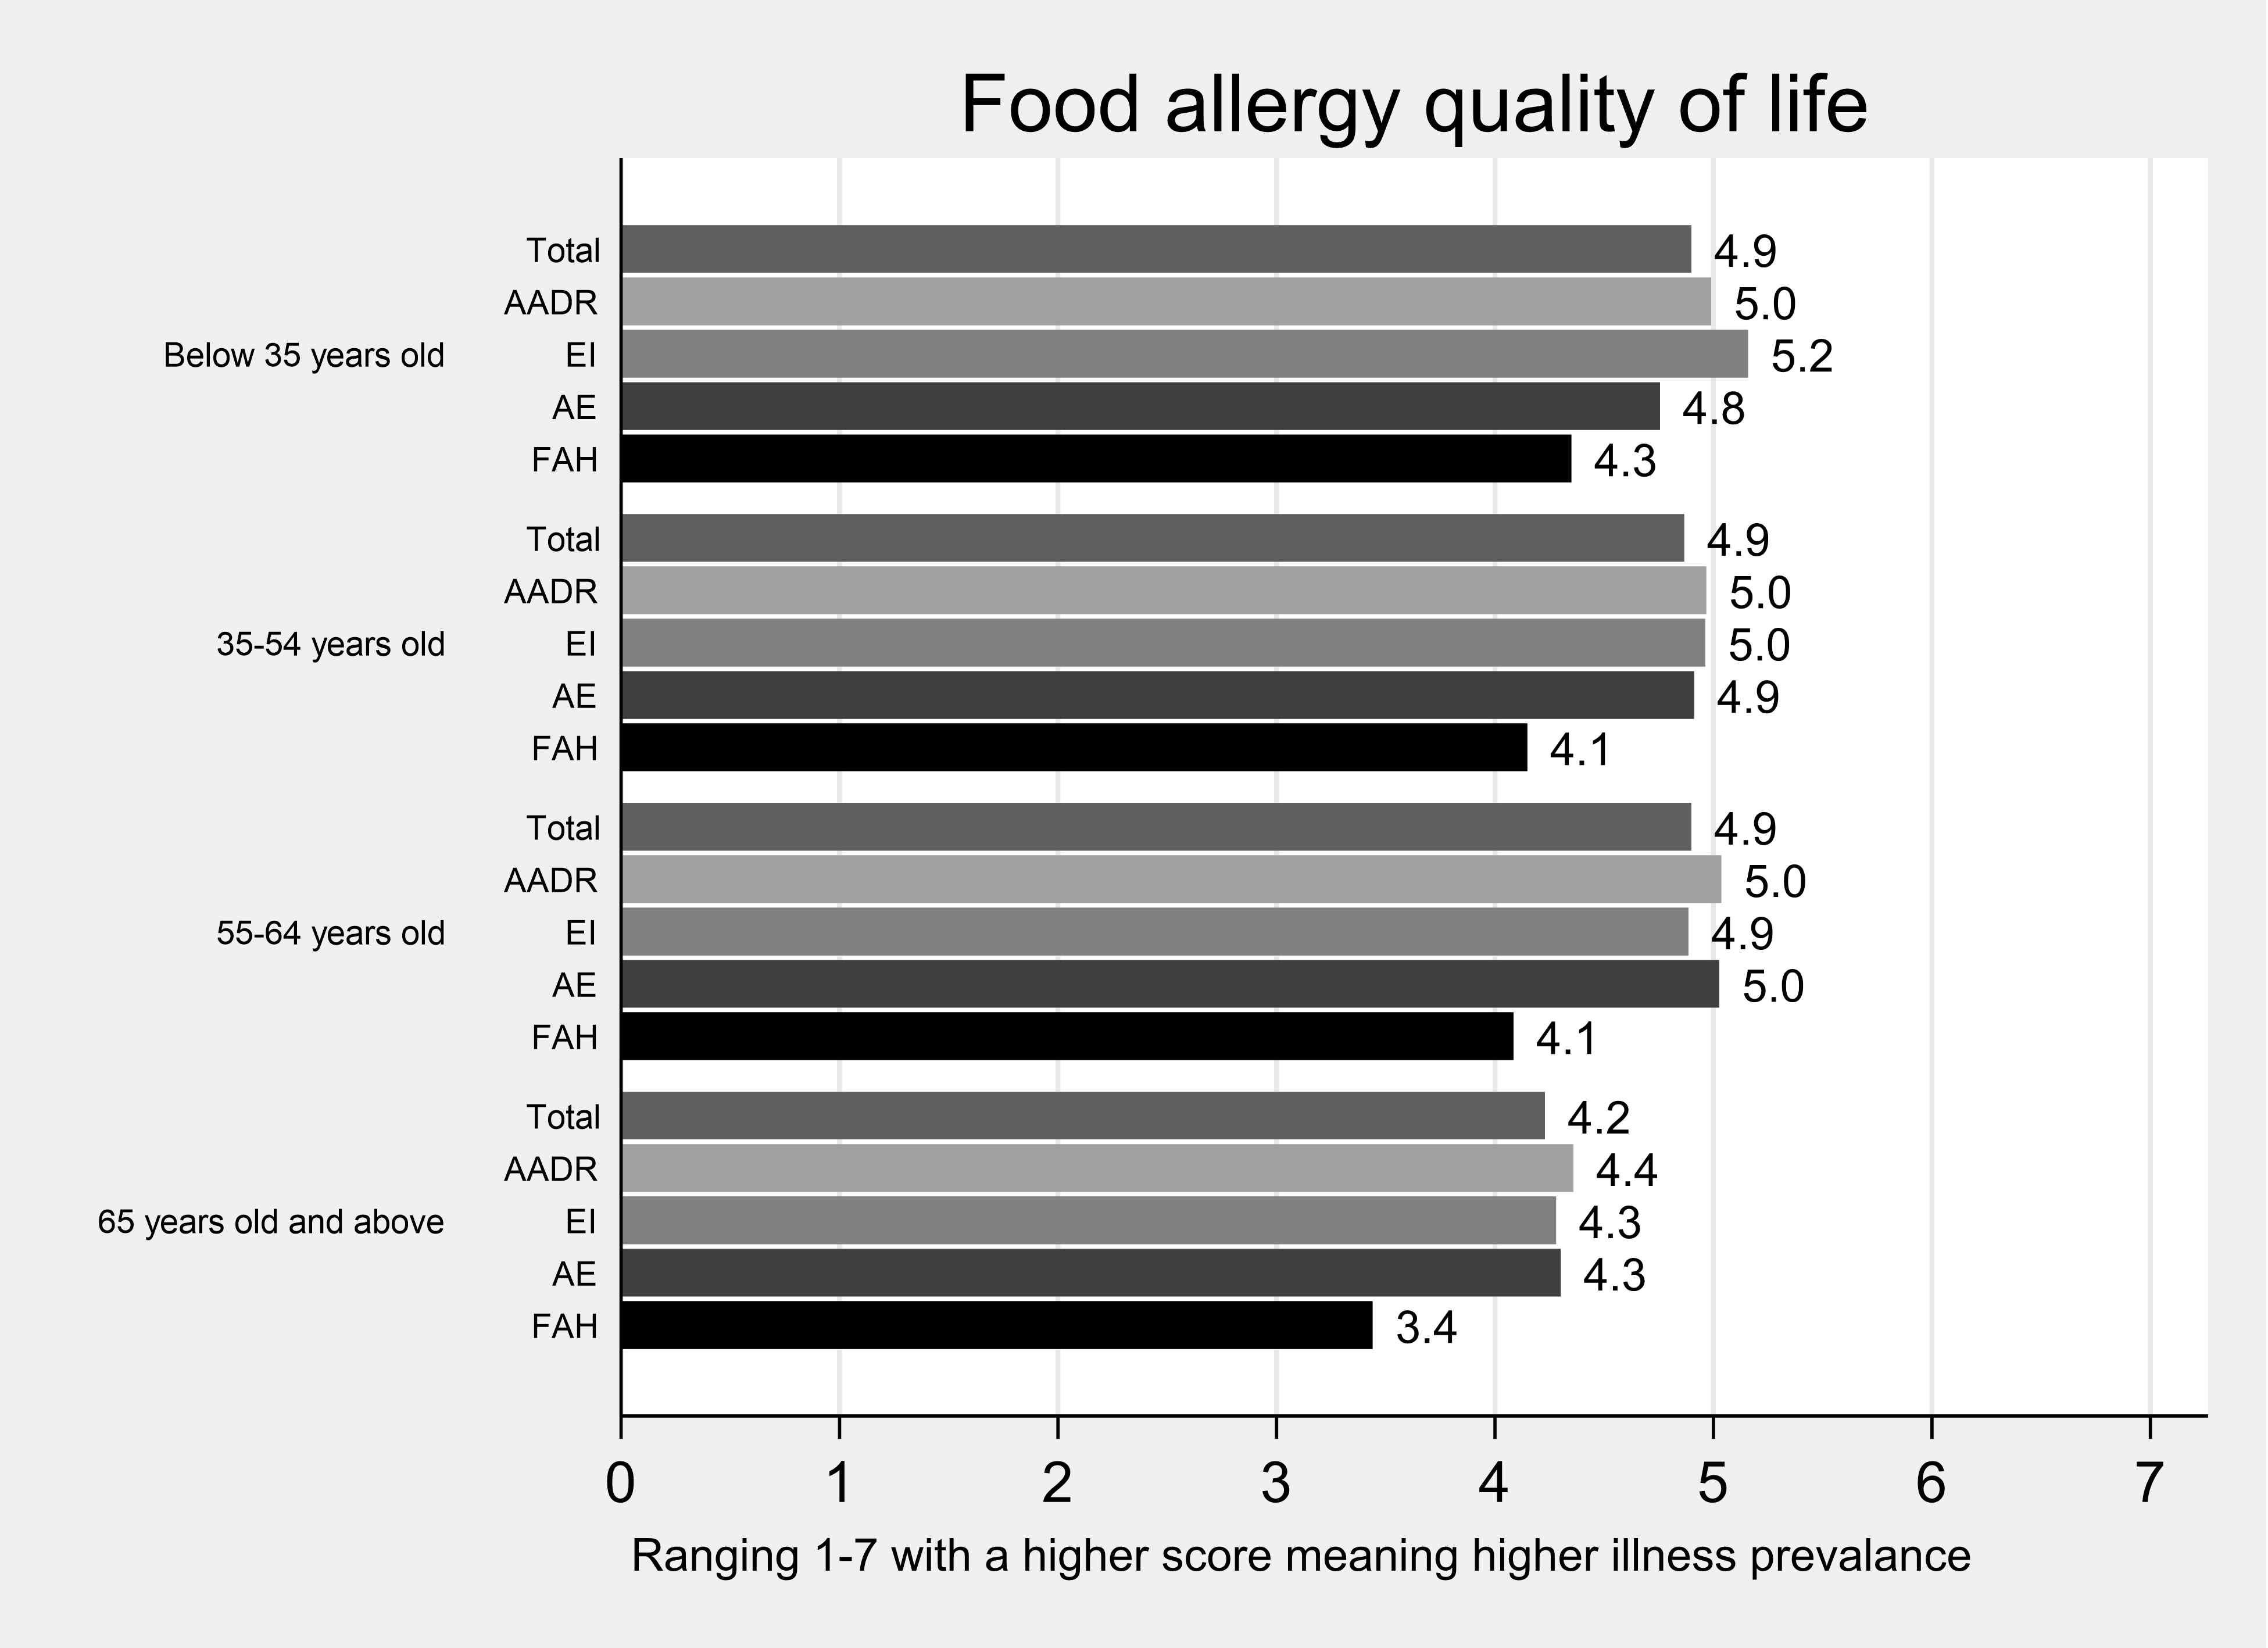
CDQ subscales
Table 2. Summary statistics: CDQ Index by domain
| Domain | Mean | Std. Dev. | N | min | p25 | Median | p75 | max |
|---|---|---|---|---|---|---|---|---|
| CDQ total | 48.35 | 16.91 | 601 | 20 | 34 | 47 | 61 | 95 |
| CDQ Limitations | 24.74 | 9.12 | 601 | 9 | 17 | 24 | 31 | 44 |
| CDQ Dysphoria | 6.66 | 3.1 | 601 | 4 | 4 | 5 | 8 | 19 |
| CDQ Health | 12.2 | 4.61 | 601 | 5 | 9 | 11 | 15 | 25 |
| CDQ Inadequate | 4.76 | 2.51 | 601 | 2 | 2 | 4 | 7 | 10 |
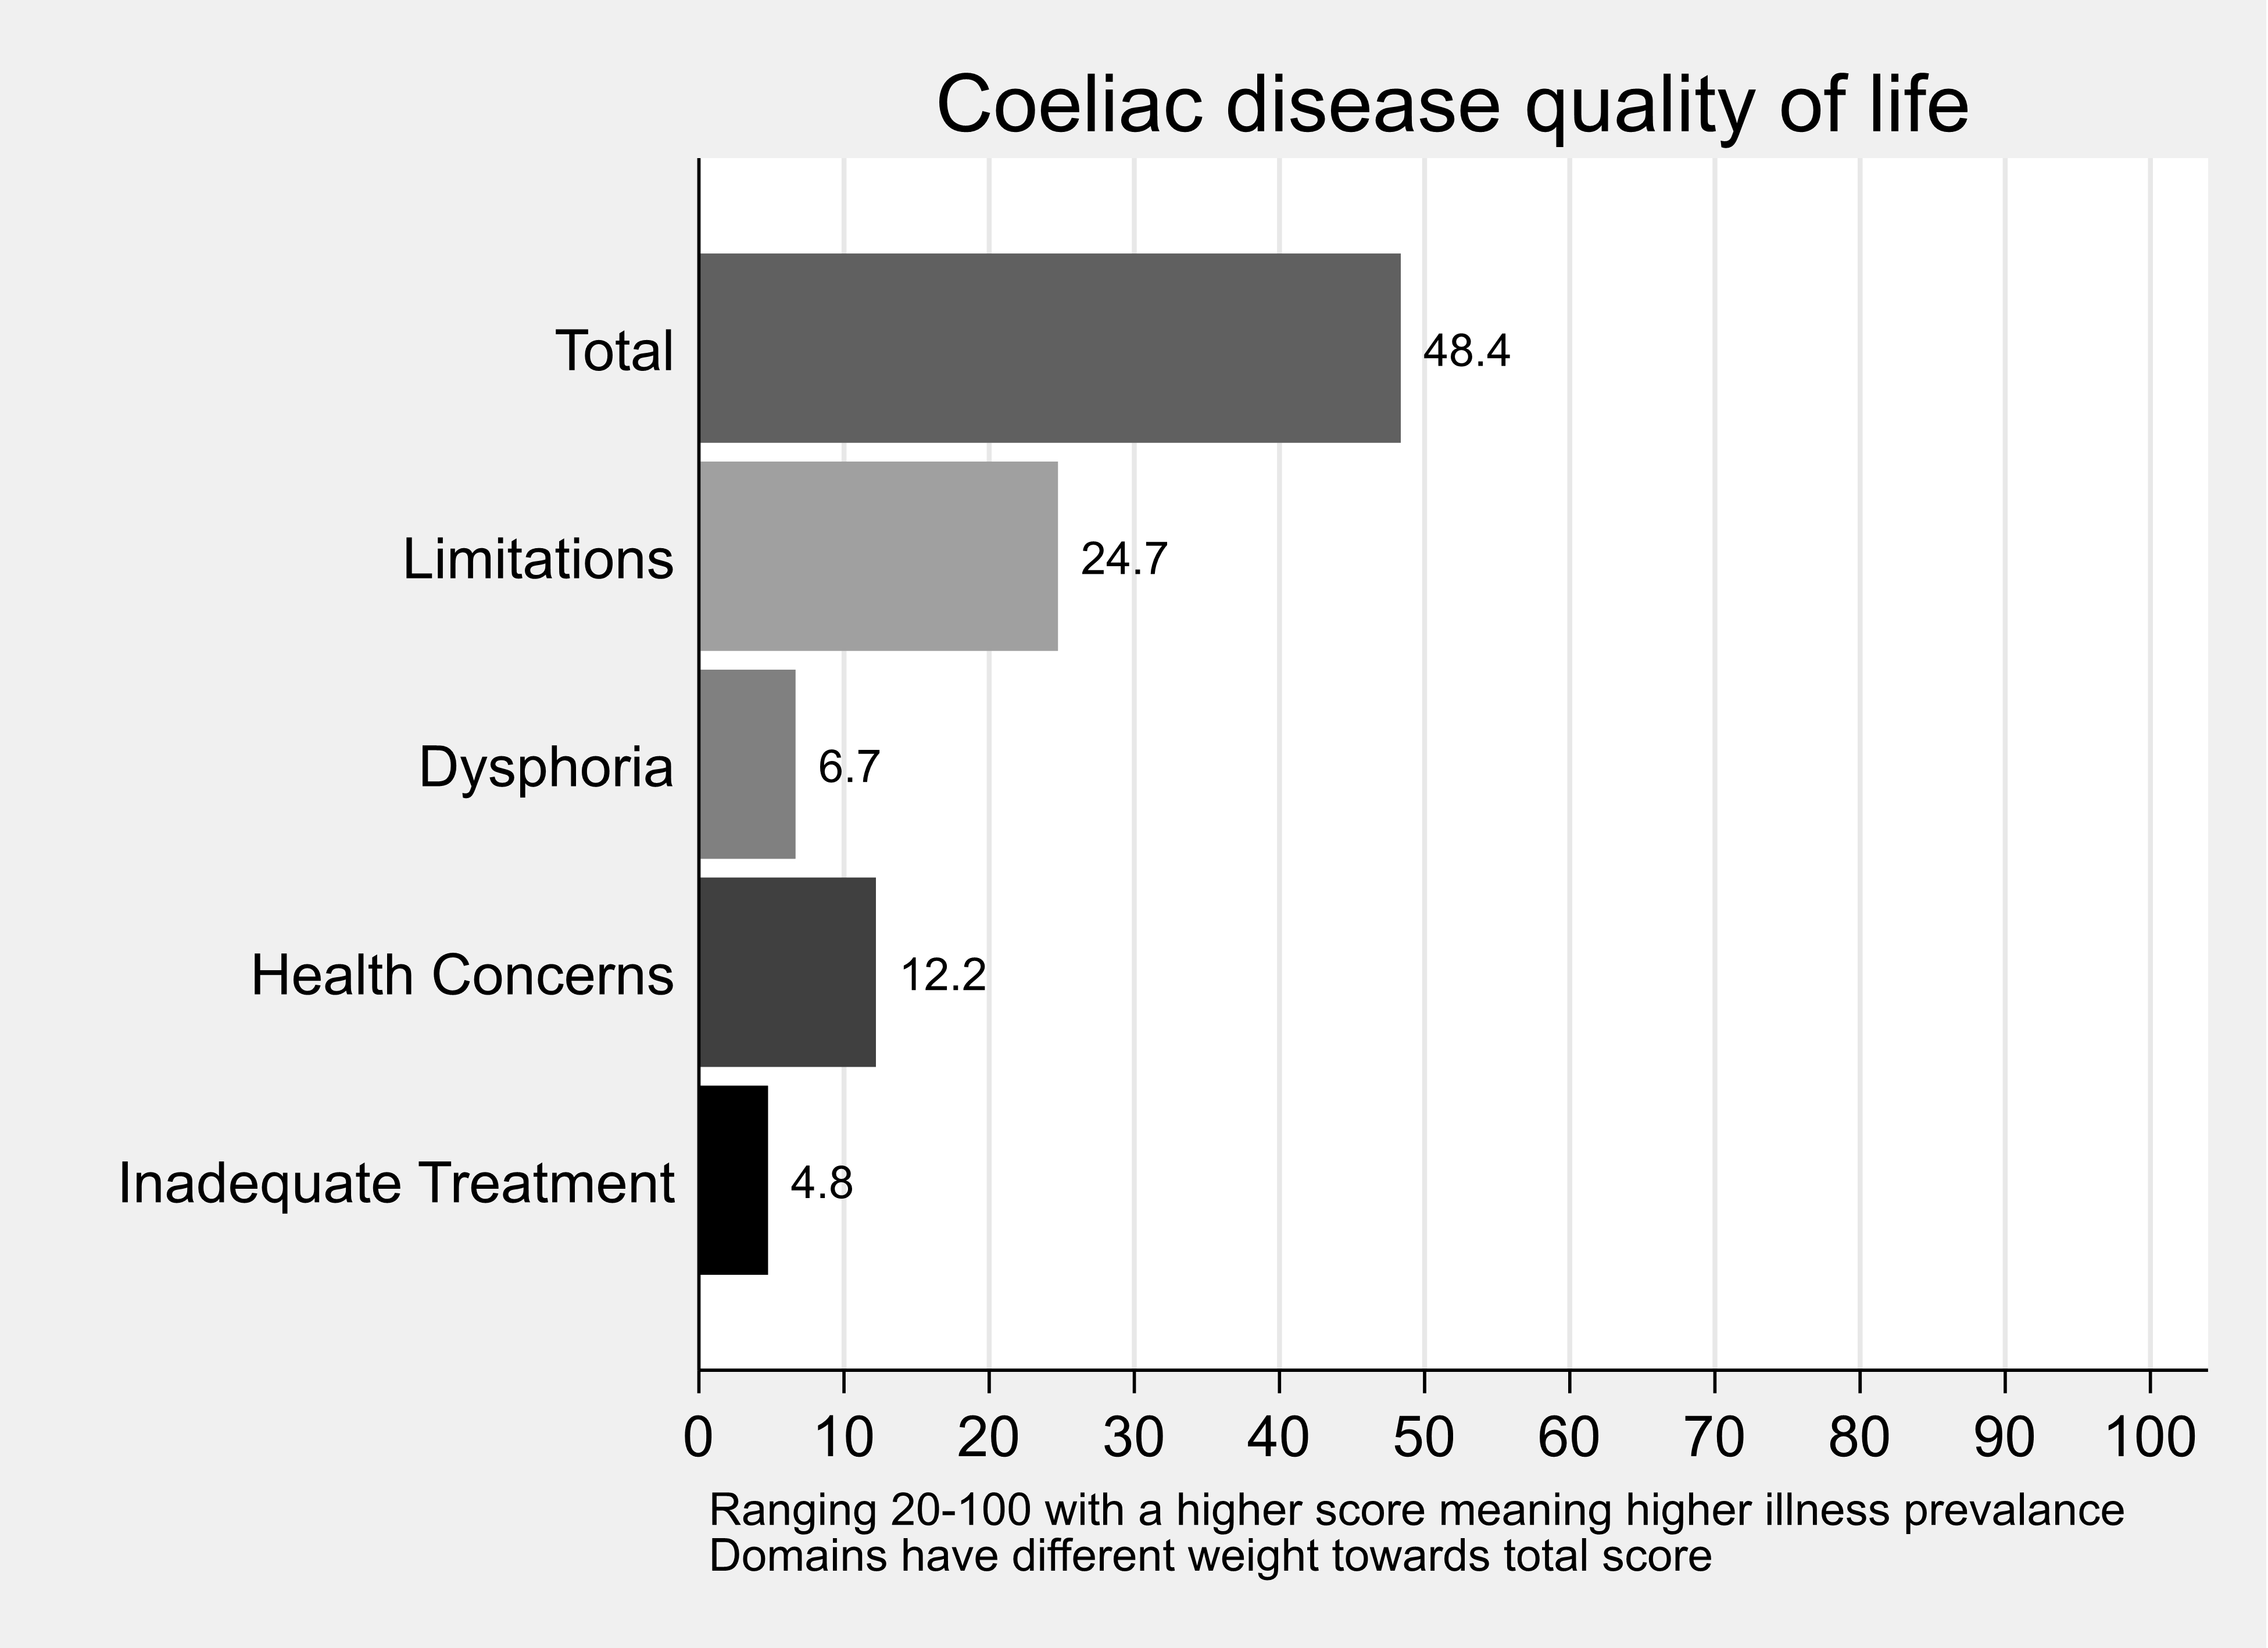
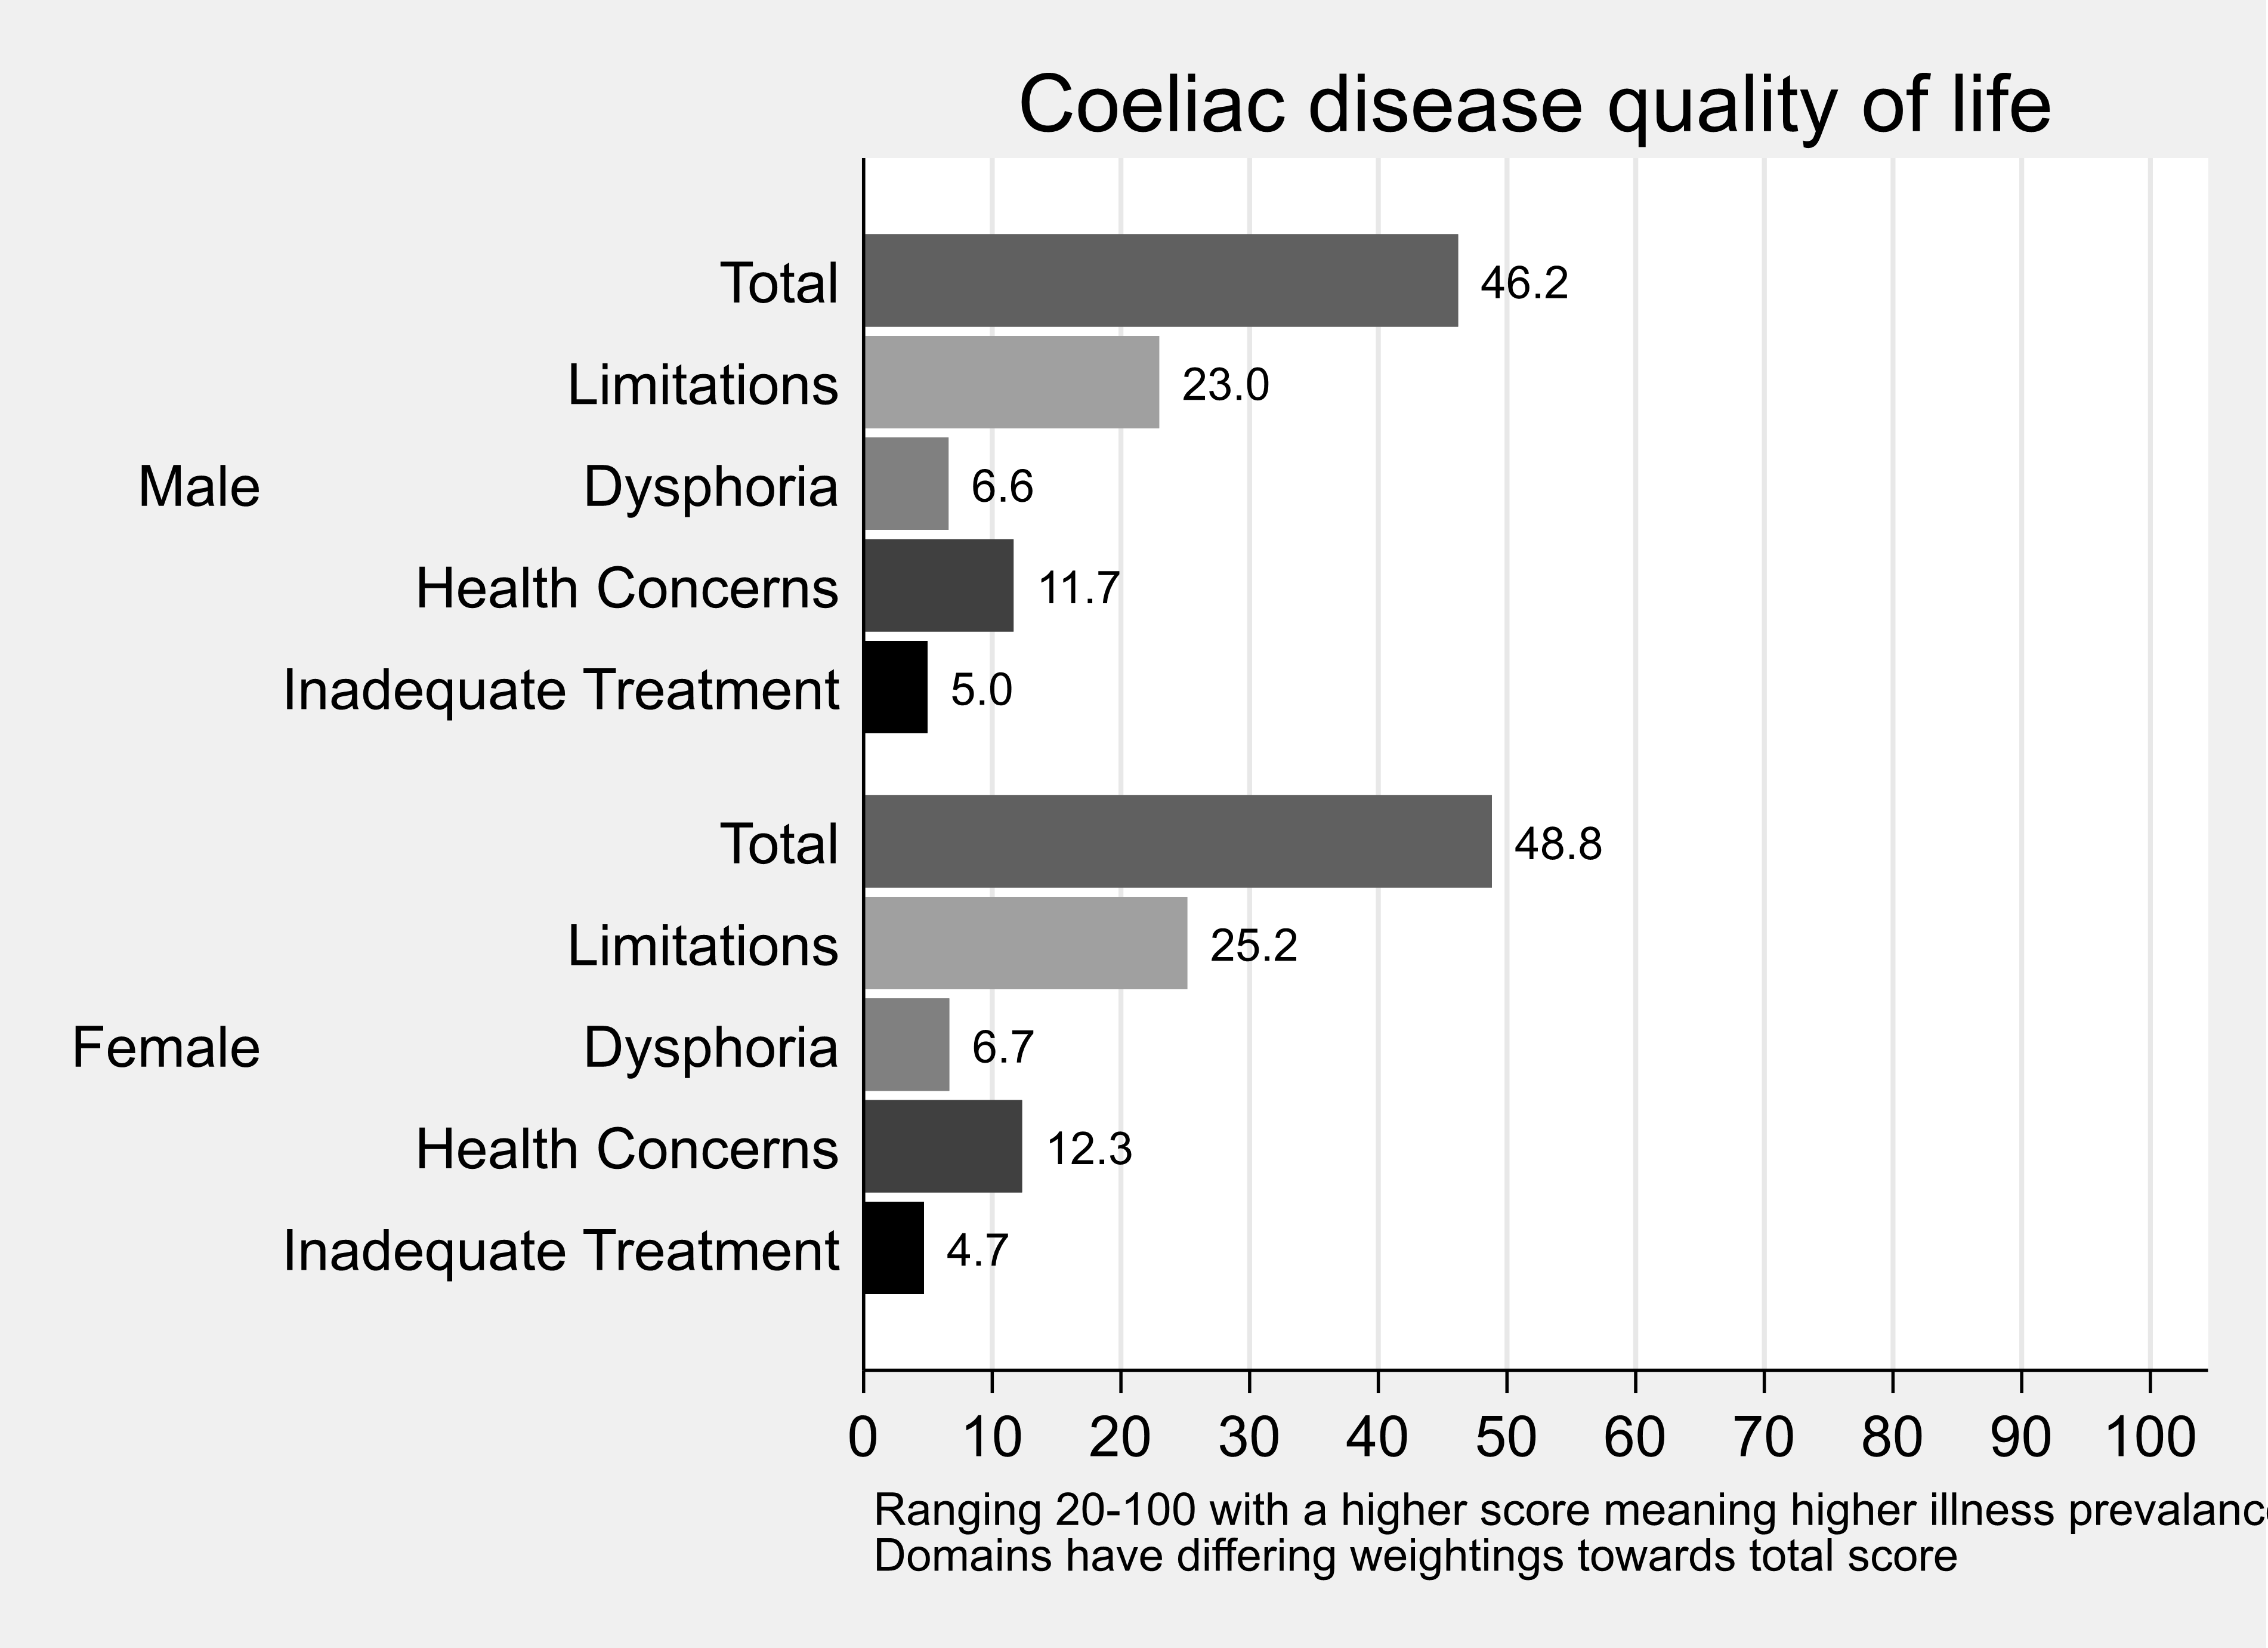
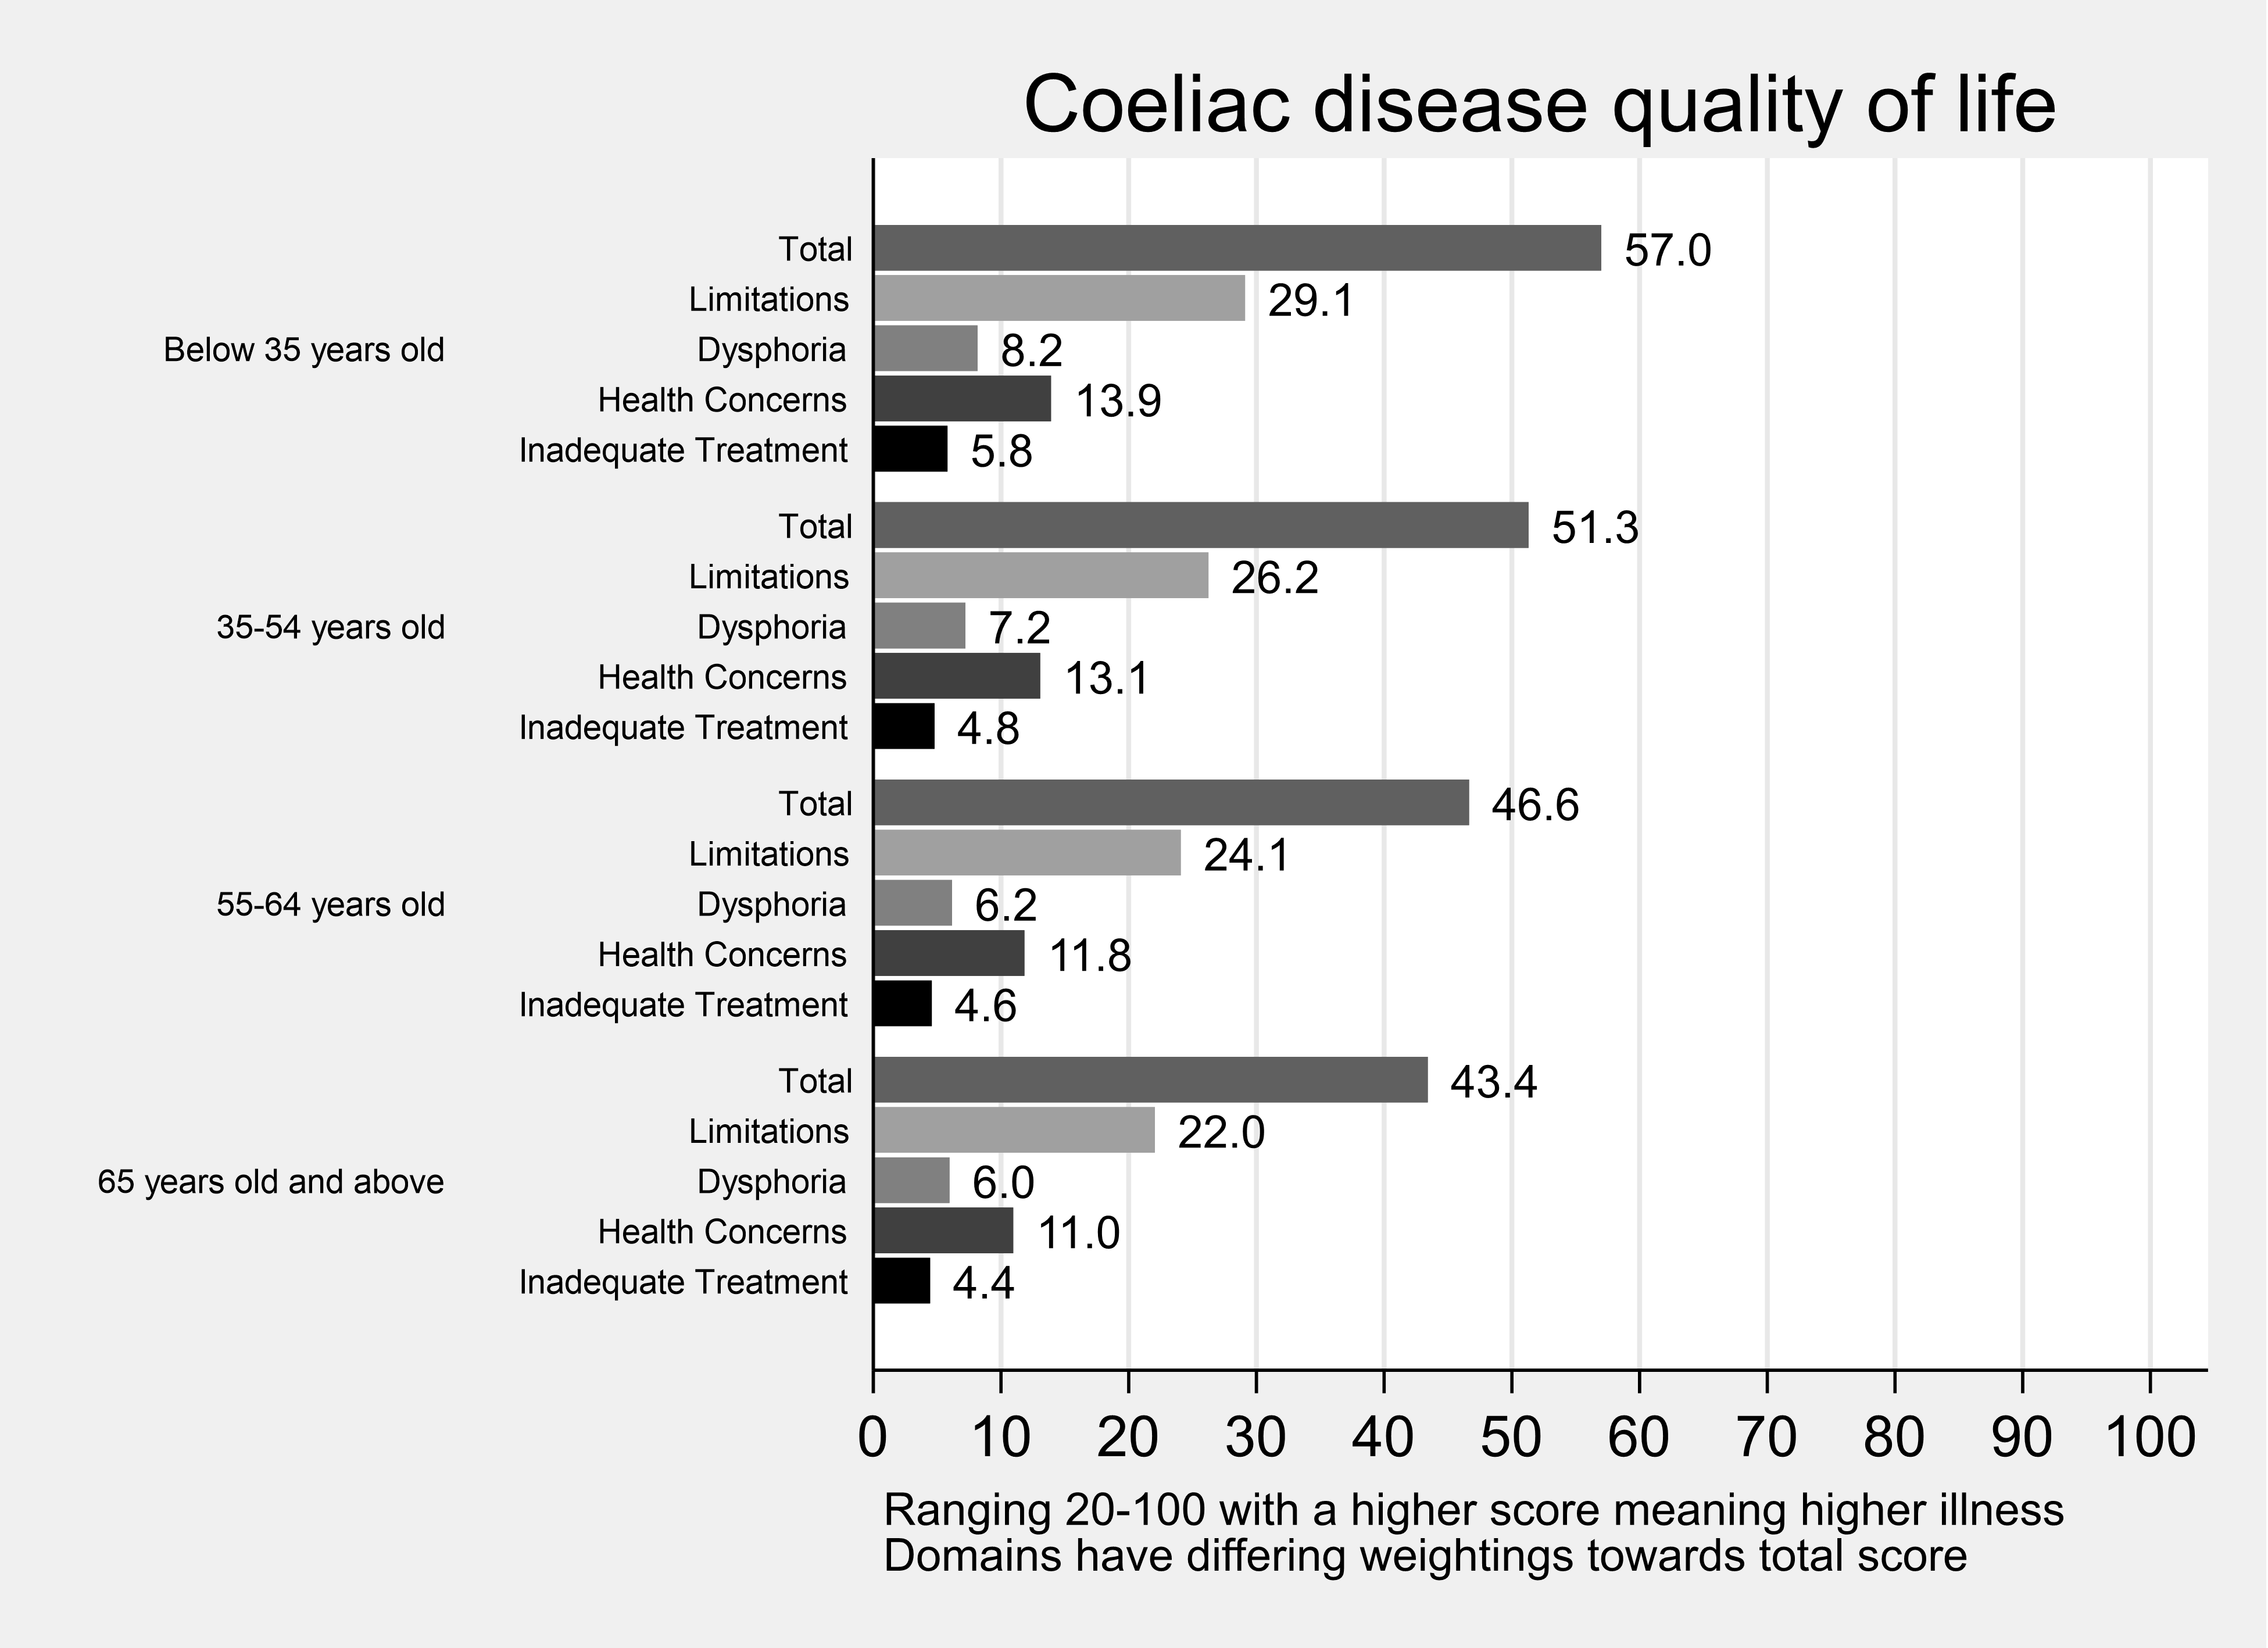
FIQLQ subscales
Table 3. Summary statistics: FIQLQ Index by domain
| Domain | Mean | Std. Dev. | N | min | p25 | Median | p75 | Max |
|---|---|---|---|---|---|---|---|---|
| FIQ total | 4.49 | 1.53 | 440 | 1.06 | 3.28 | 4.62 | 5.72 | 7 |
| FIQ EI | 4.55 | 1.55 | 440 | 1 | 3.38 | 4.81 | 5.75 | 7 |
| FIQ SDR | 4.5 | 1.69 | 440 | 1 | 3 | 4.67 | 6 | 7 |
| FIQ RA | 4.34 | 1.57 | 440 | 1 | 3 | 4.5 | 5.5 | 7 |
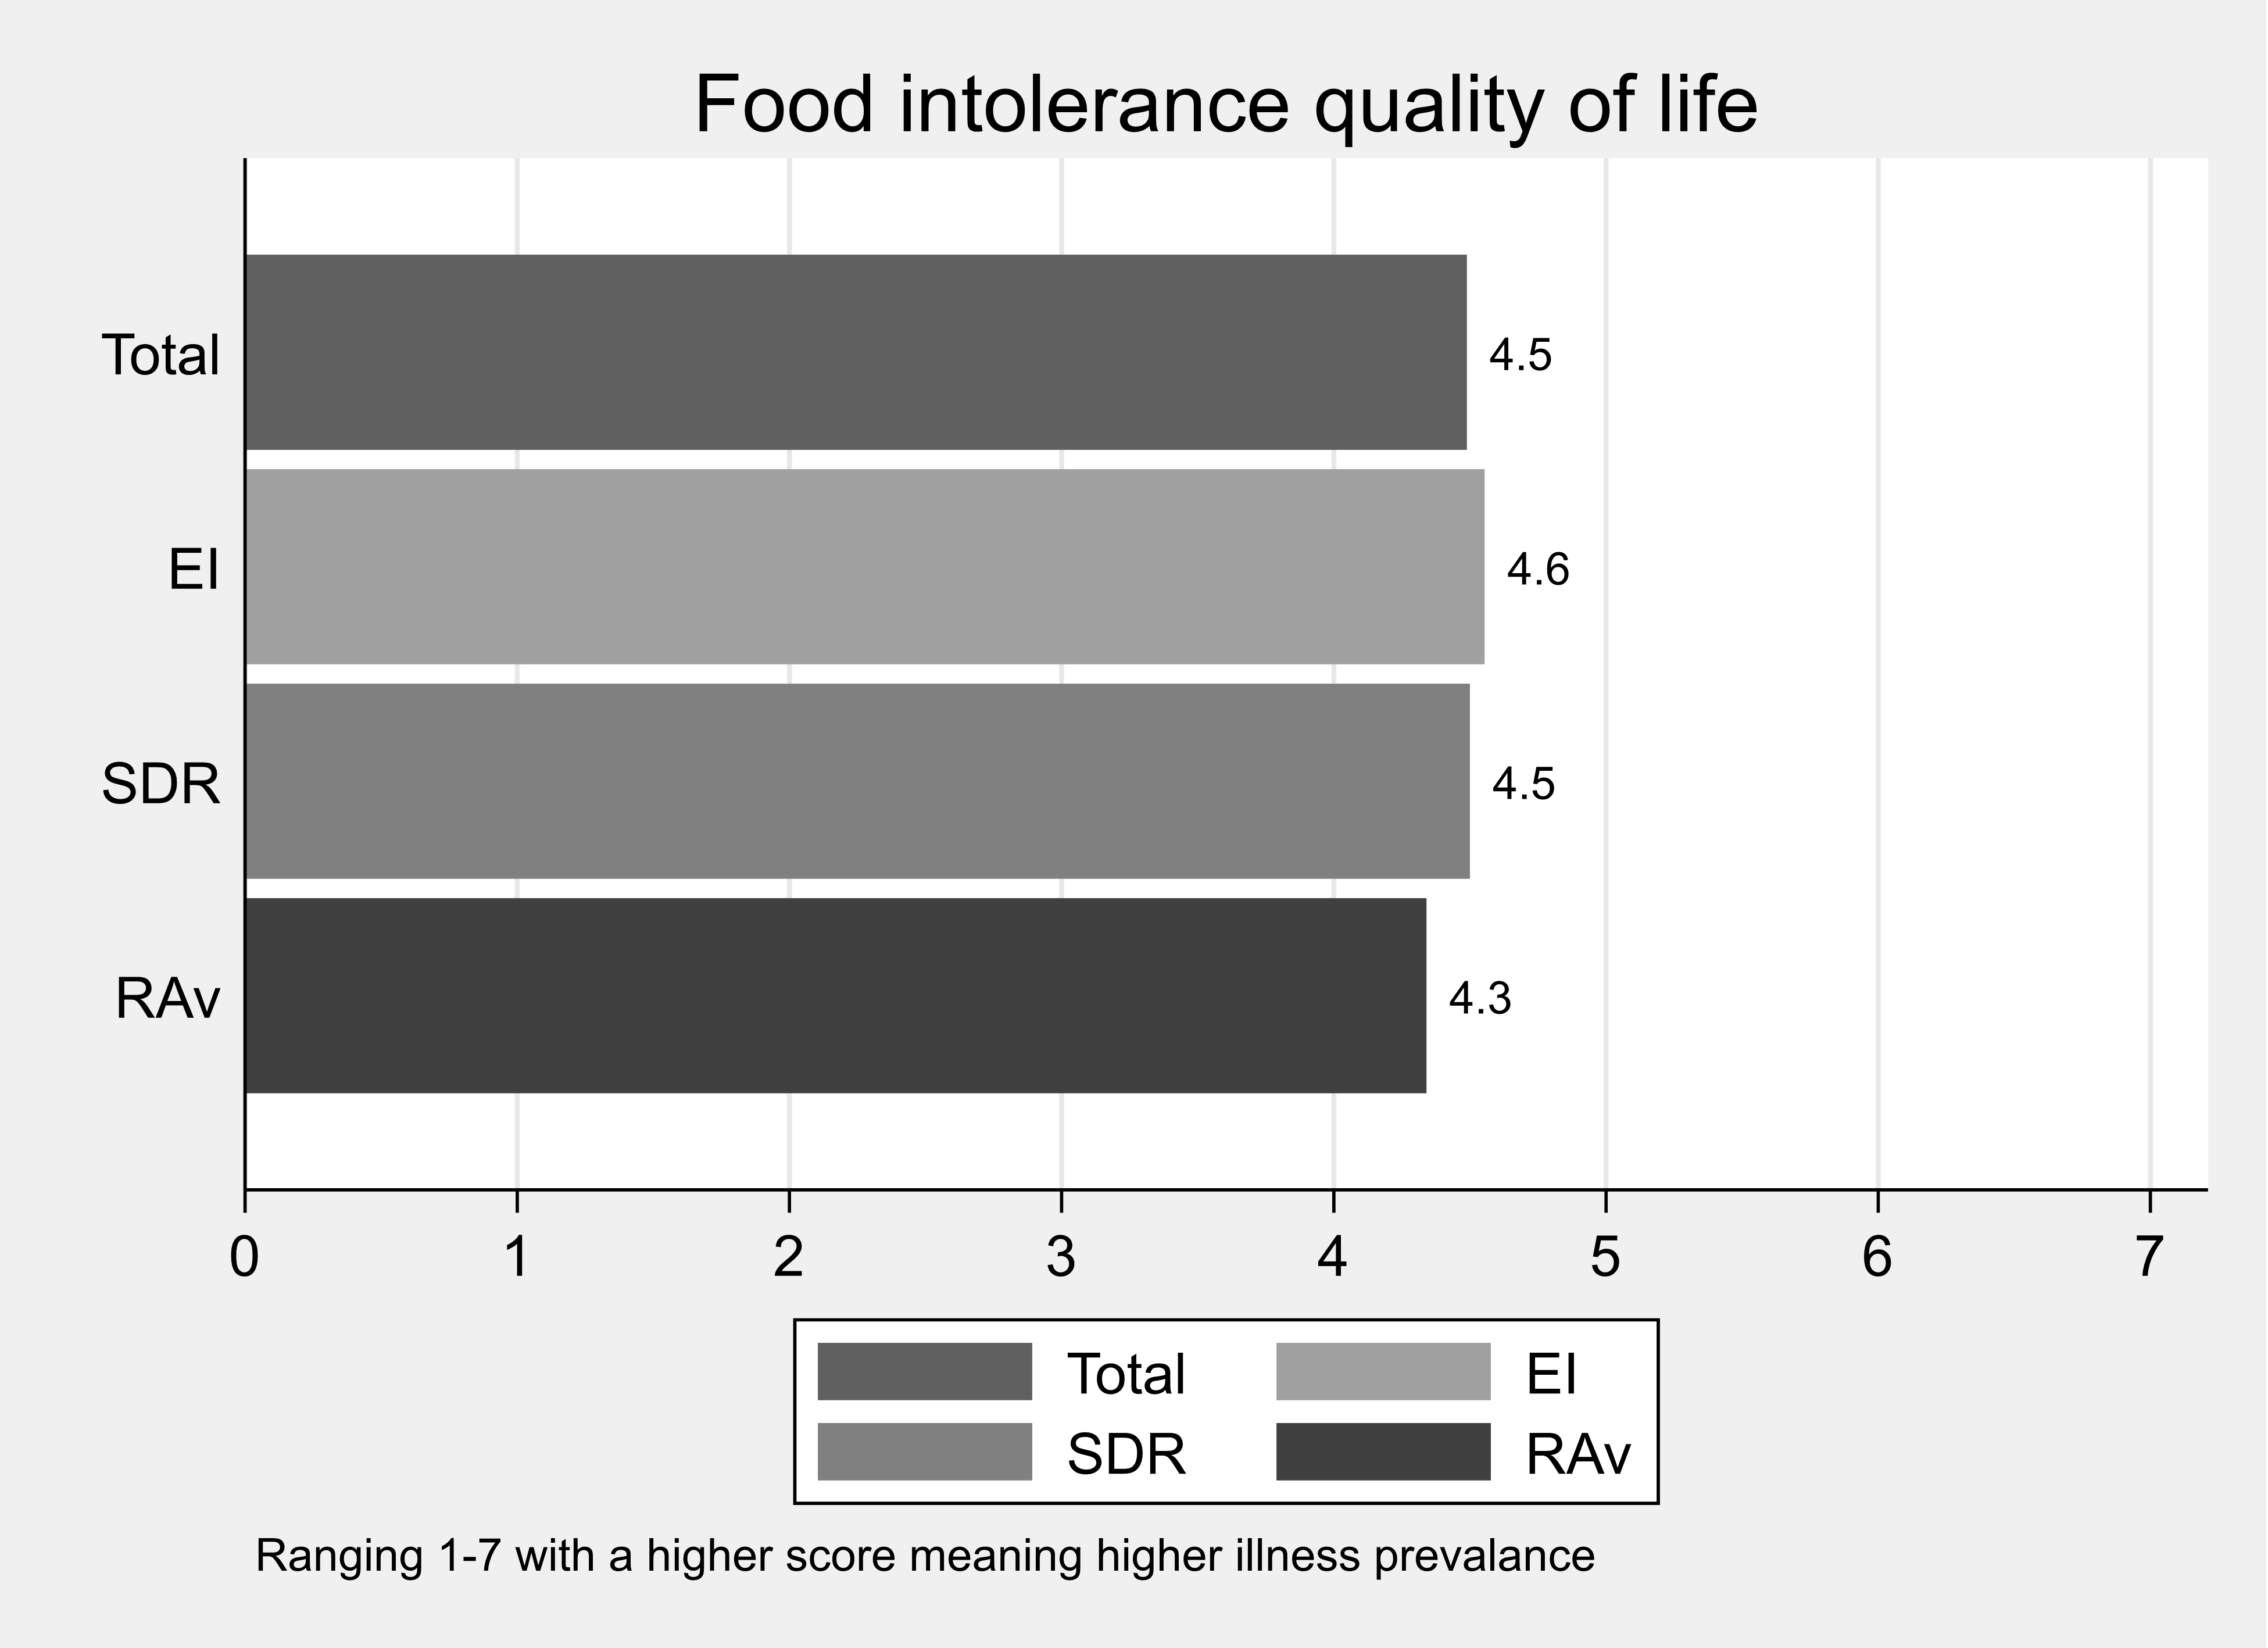
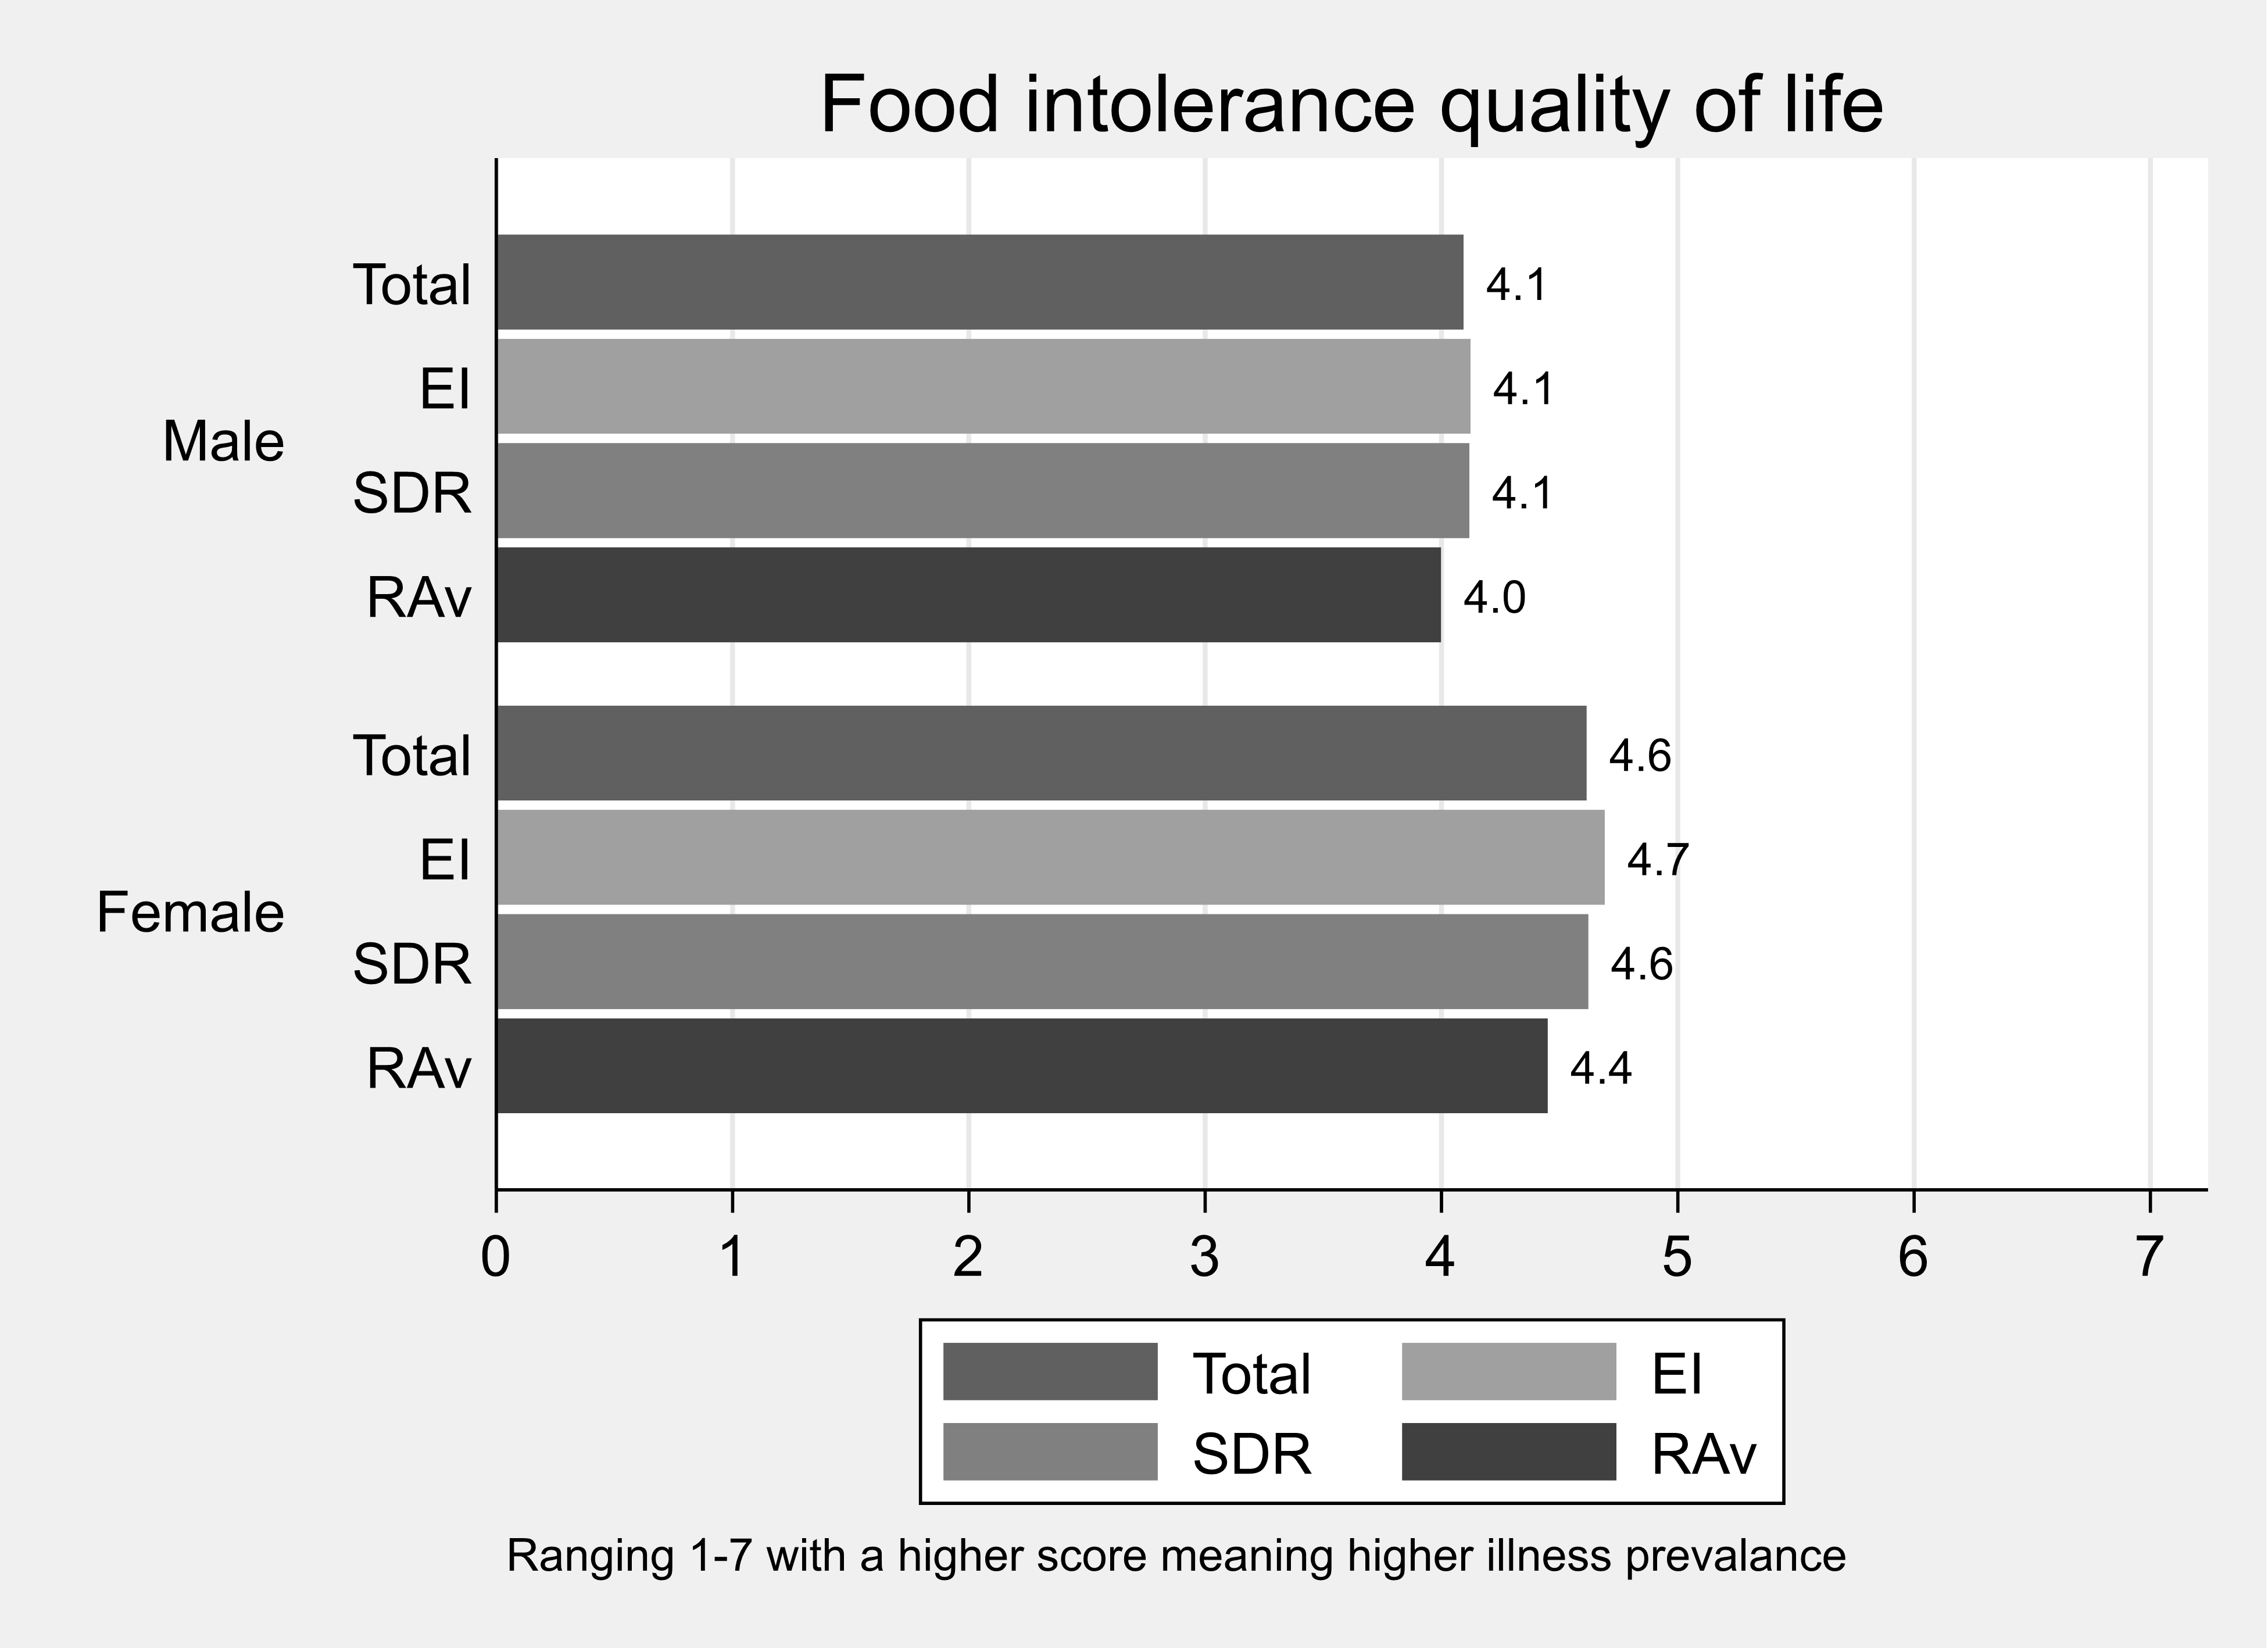
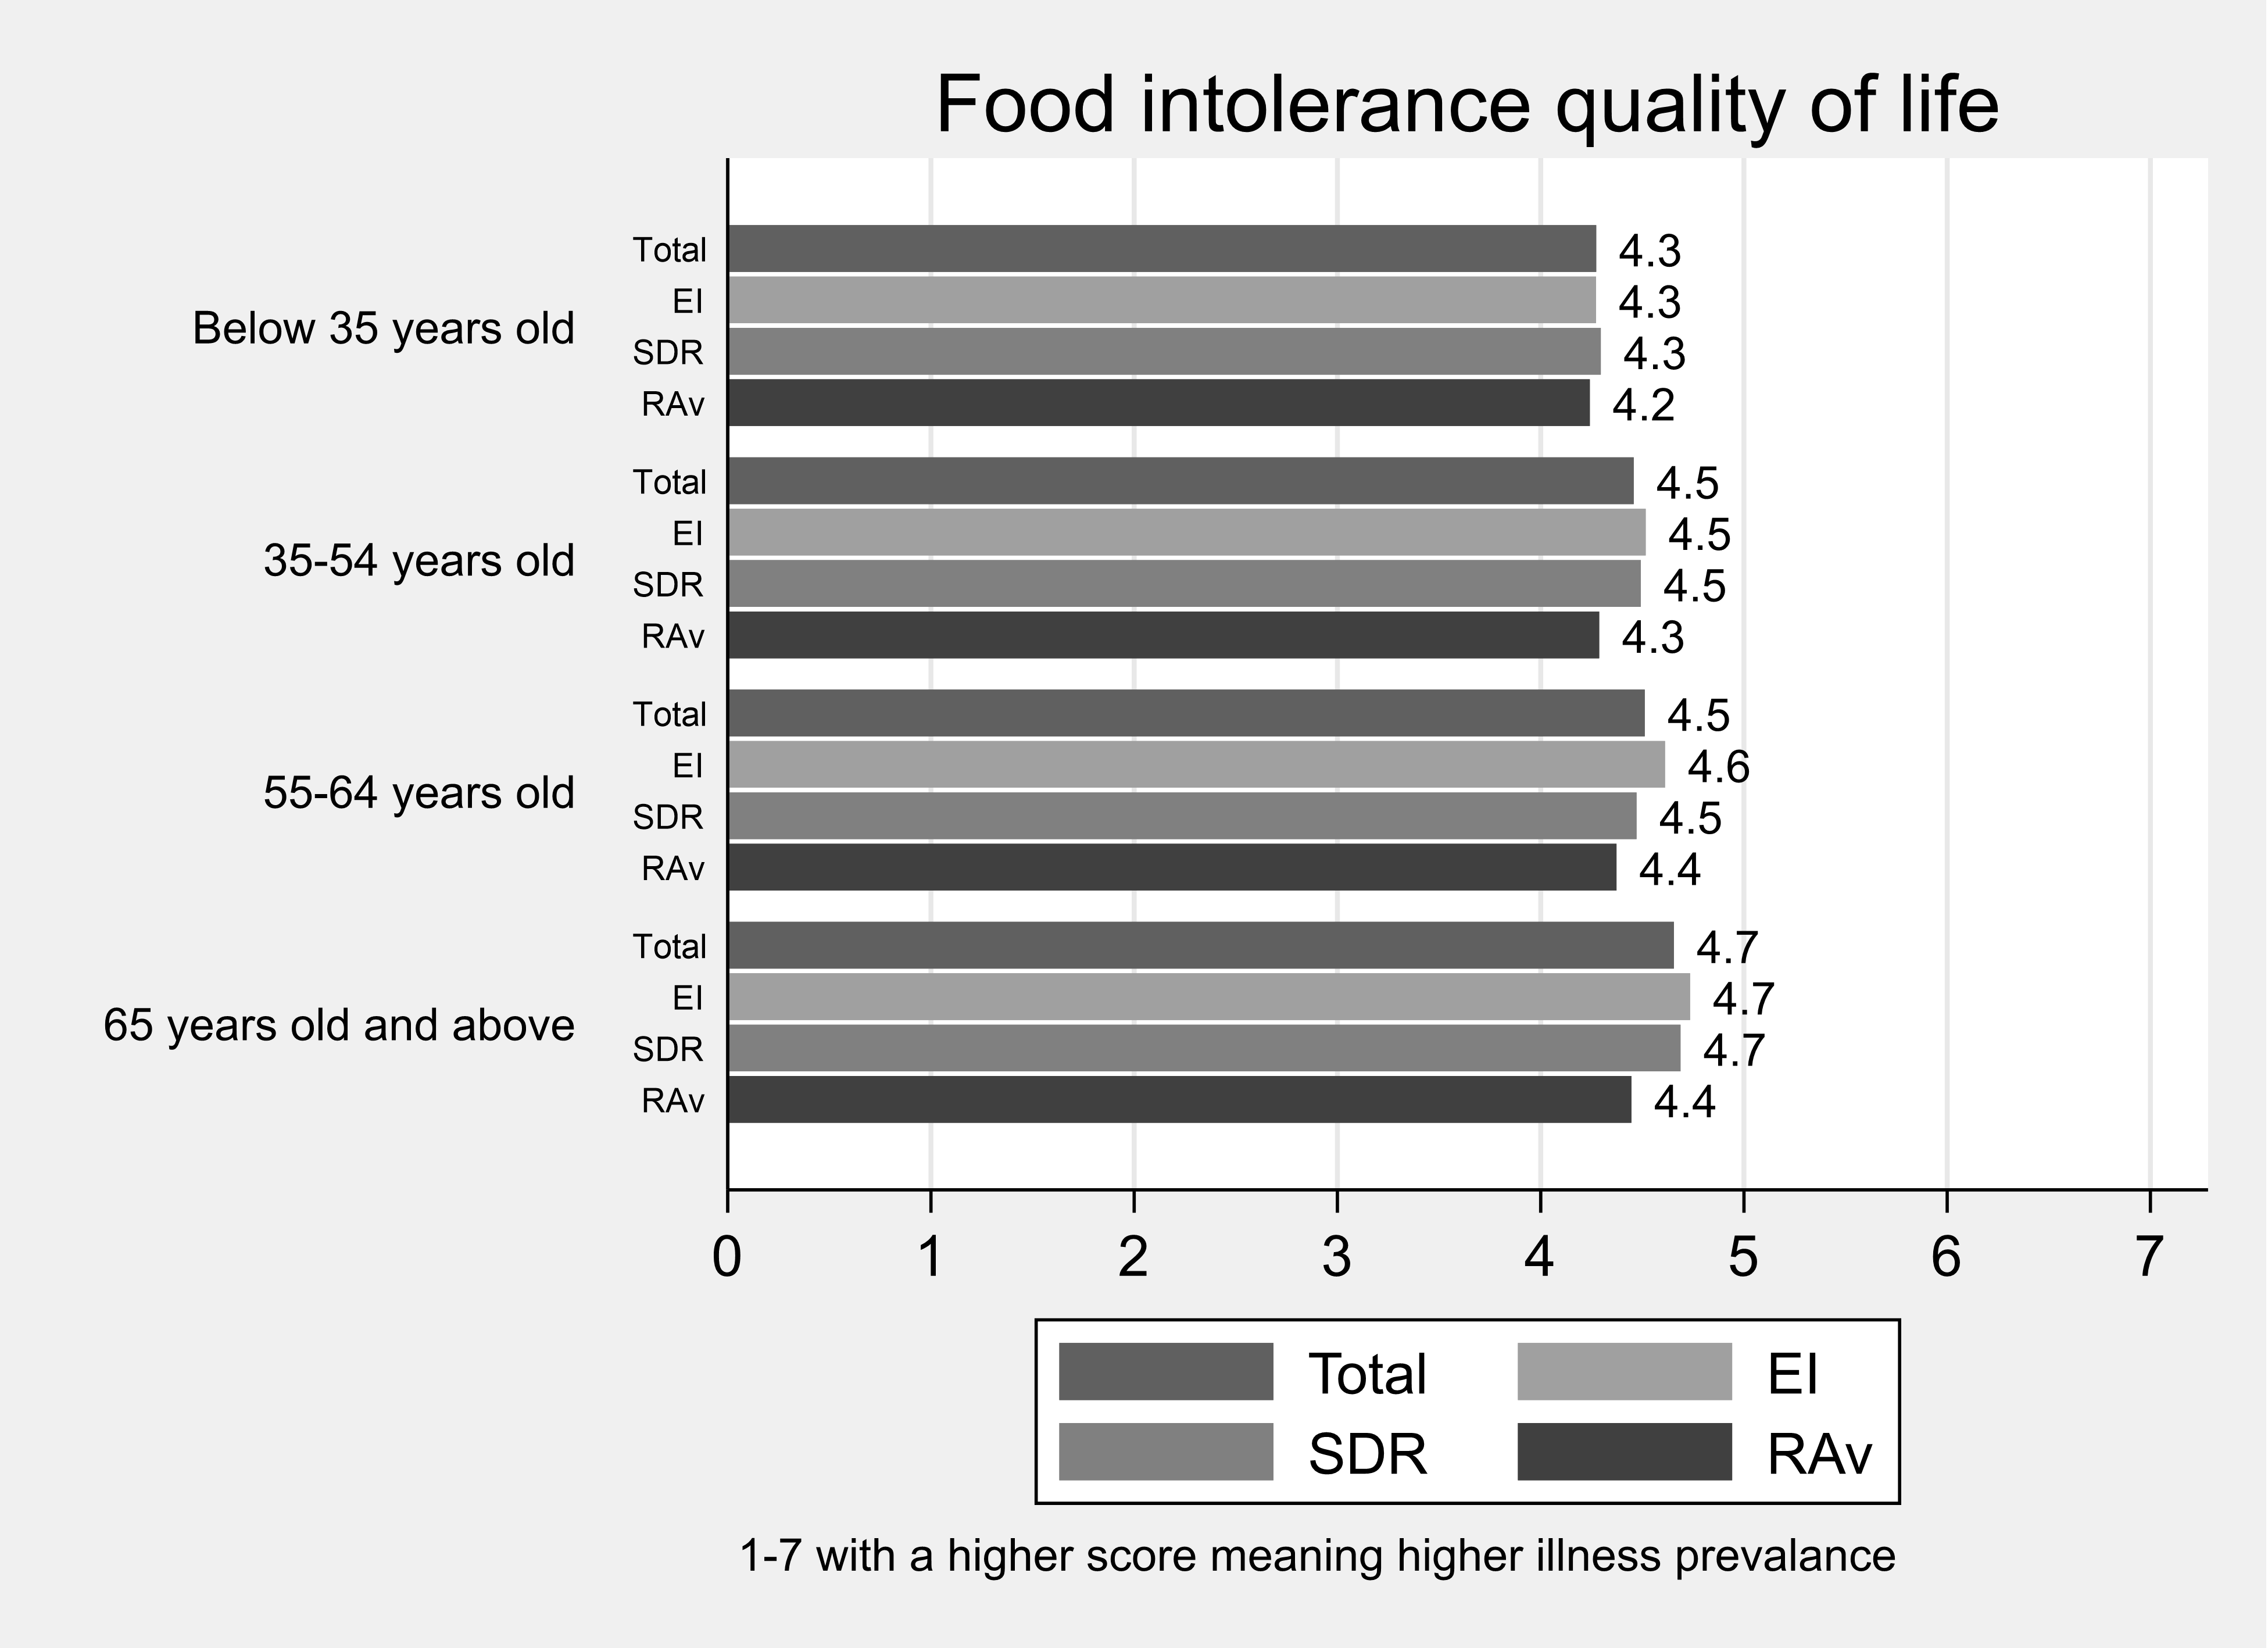
We required an established instrument which was also concise and hence adopted the widely cited Brief Illness Perception Questionnaire (Brief IPQ) (Broadbent at al., 2006) which uses 9 questions on a single, 11-point, scale.
The data collected sing this scale was not used in the choice models analysed since the EQ-VAS and FAQLQ / FIQLQ / CDQ proved highly effective in explaining heterogeneity in preferences.
For completeness, we report descriptive information about the distribution of those Brief IPQ scores among the adult sample.
How much does your condition affect your life?

The bar chart shows the distribution of responses to the Subjective Perception of Illness question: ‘How much does your condition affect your life?’. When asked ‘how much does you condition affect your life?’ around 80% of respondents provided a score of 5 or more.
How long do you think your condition will continue?

The bar chart shows the distribution of responses to the Subjective Perception of Illness question: How long do you think your condition will continue? When asked ‘how long do you think your condition will continue?’ almost 90% of respondents said forever.
How much control do you feel you have over your condition?

The bar chart shows the distribution of responses to the Subjective Perception of Illness question: ‘how much control do you feel you have over your condition? When asked ‘how much control do you feel you have over your condition?’ around 80% of respondents provided a score of 5 or more, whereby 0 is no control and 11 is complete control.
How much do you think treatment can help your condition?

The bar chart shows the distribution of responses to the Subjective Perception of Illness question: ‘how much control do you think treatment can help your condition?’ When asked ‘how much control do you think treatment can help your condition?’ around 25% of respondents indicted ‘no help at all’ (score 0), 15% of respondents gave a score of 6 and around 12% of respondents indicated ‘completely help my condition (score 11).
How much do you experience symptoms from your condition?

The bar chart shows the distribution of responses to the Subjective Perception of Illness question: ‘how much do you experience symptoms from your condition?’ When asked ‘how much do you experience symptoms from your condition?’ almost 15% of respondents indicated score 6 whereby 0 is ‘no symptoms at all’ and score 11 is ‘severely affects my life’.
How concerned are you about your condition?

The bar chart shows the distribution of responses to the Subjective Perception of Illness question: ‘how concerned are you about your condition?’
How well do you feel you understand your condition?

The bar chart shows the distribution of responses to the Subjective Perception of Illness question: ‘well do you feel you understand your condition?’
How much does your condition affect you emotionally? (for example, does it make you angry, scared, upset or depressed?)

The bar chart shows the distribution of responses to the Subjective Perception of Illness question: ‘How much does your condition affect you emotionally?’
The propensity to commit to (one’s child) taking a pill to eliminate a food hypersensitivity was hypothesised to potentially be affected by one’s attitude to risk as well as characteristics such as the severity of the condition.
To derive a measure of risk preferences, questions from the SOEP (German Socioeconomic Panel) were included in the severe. These questions (below) ask about willingness to take risks overall, and in specific domains.
Figure 1 SOEP Risk Attitude question

Figure 1 SOEP Risk Attitude question (accessible version)
Are you generally a person who is fully prepared to take risks or do you try to avoid taking risk? (please choose an option where 0 means 'risk averse' and 10 means fully prepared to take risks'.
People can behave differently in different situations.
How would you rate your willingness to take risks in the following areas?
- while driving...
- in financial matters
- during leisure and sports...
- in your occupation...
- with your health...
- your faith in other people
The scores were transformed to range from 1-11 and the distribution of responses is displayed here – with a skew towards risk aversion evident.
Figure 2 Distribution of risks responses

Table 3: Tabulation of how risk averse are you?
| Risk scale | Frequency | Percent | Cumulative |
|---|---|---|---|
| 1 (risk averse) | 167 | 11.71 | 11.71 |
| 2 | 89 | 6.24 | 17.95 |
| 3 | 151 | 10.59 | 28.54 |
| 4 | 160 | 11.22 | 39.76 |
| 5 | 115 | 8.06 | 47.83 |
| 6 | 263 | 18.44 | 66.27 |
| 7 | 153 | 10.73 | 77.00 |
| 8 | 161 | 11.29 | 88.29 |
| 9 | 98 | 6.87 | 95.16 |
| 10 | 25 | 1.75 | 96.91 |
| 11 (fully prepared to take risks) | 44 | 3.09 | 100.00 |
| Total | 1426 | 100.00 | - |
The mean score was computed across all 7 questions (the distribution of scores for the 6 additional risk questions are below).
The distribution of the aggregated risk attitude scores is shown here – with a skew to the left (risk aversion evident).
Figure 3 Distribution of Aggregated risk score

Figure 4 Distribution of the responses to the six specific risk questions
How risk averse are you while driving?

How risk averse are you in financial matters?

How risk averse are you during leisure and sports?

How risk averse are you in your occupation?

How risk averse are you with your health?

How risk averse are you with your faith in other people?

If people declined free removal in all 3 training sets (ie including the removal of FHS for 20 years for free) they were skipped past the priced DCE – since they had declined the ‘best’ offer (20 years) at zero price.
People who always chose to buy the pill in the 9 sets were presented with debrief questions to allow identification of protest or problematic behaviour – for example people not taking the price seriously. Likewise, people who never chose to buy the pill in the 9 sets, in this case problematic responses included not thinking that the pill would be safe and therefore not considering buying it.
Everyone who completed the 9 priced choice sets were asked debrief questions on
- how hard it was to understand the DCE choices
- how hard it was to make the DCE choices.
DCE Adults
Declining 3 zero price options: Adults
53% accepted the free removal in all 3 choice sets, but 16% declined removal of their FHS in one choice set and 11% rejected free removal in all 3 training sets, one of which was for a duration of 20 years.
Table 1: Number of Free Options Declined
| Number of options | Frequency | Percent | Cumulative |
|---|---|---|---|
| 0 | 754 | 52.88 | 52.88 |
| 1 | 222 | 15.57 | 68.44 |
| 2 | 289 | 20.27 | 88.71 |
| 3 | 161 | 11.29 | 100.00 |
| Total | 1426 | 100.00 | - |
The finding that 11% of adults with a FHS would not accept its removal for 20 years at zero cost was not anticipated at the start of the research process. The issue of adjustment costs had featured in the focus groups which had prompted the researchers to increase the maximum duration used in the zero price DCE training sets to 20 years – to identify people who would never buy in the priced DCE sets.
Figure 1. Number of zero price removals of FHS declined, adults.

The 161 people declining all 3 free removals were excluded from the priced DCE experiment. This group were asked what was the minimum duration (if any) that they would accept for unpriced removal of their FHS condition.
Table 2: What is the minimum period that would induce you to accept free removal?
| Period of time | Frequency | Percent | Cumulative |
|---|---|---|---|
| 25 years | 3 | 1.86 | 1.86 |
| 35 years | 4 | 2.48 | 4.35 |
| 40 years | 4 | 2.48 | 6.83 |
| 45 years | 1 | 0.62 | 7.45 |
| 50 years | 4 | 2.48 | 9.94 |
| Permanent removal only | 88 | 54.66 | 64.60 |
| Decline removal | 57 | 35.40 | 100.00 |
| Total | 161 | 100.00 | - |
Of the 161 people who always rejected free removal, 10% would choose removal if it was for a longer, but still temporary, period, 55% would only accept permanent removal and 35% (57 people) did not want their FHS removed at all.
Protest Choices: Adults
People who had accepted the free removal but who never bought the pill in any of the 9 choice sets that followed were directed to a question asking why that was. This was in part to distinguish potential buyers who could be included in the DCE analysis (ie potential buyers who could not afford the prices shown) from people who rejected the premise of the choice tasks, would never buy and should be excluded from the DCE analysis.
Table 3: Why did you never pay for the pill?
| Reason for not paying | Frequency | Percent | Cumulative |
|---|---|---|---|
| Cost too high for benefit | 149 | 36.79 | 36.79 |
| I did not trust it's safety | 9 | 2.22 | 39.01 |
| I did not trust it would work | 10 | 2.47 | 41.48 |
|
I could not afford what was asked |
124 | 30.62 | 72.10 |
| Removal length was not worthwhile | 34 | 8.40 | 80.49 |
| The government should pay | 37 | 9.14 | 89.63 |
| Other | 42 | 10.37 | 100.00 |
| Total | 405 | 100.00 | - |
Responses in bold (the pill regarded as not safe, or ineffective, or a view that the government should pay) were treated as indicating rejection of the valuation process and excluded from the choice models estimated on the DCE data.
People who always bought the pill in all 9 choice sets were directed to a question asking why that was.
Table 4: Why did you always pay for the pill?
| Reasons for not paying | Frequency | Percent | Cumulative |
|---|---|---|---|
| Prices unrealistic so ignored | 7 | 10.77 | 10.77 |
| The cost was small compared to benefit | 46 | 70.77 | 81.54 |
| Other | 12 | 18.46 | 100.00 |
| Total | 65 | 100.00 | - |
Ignoring the price was regarded as a rejection of the valuation process and people citing that as a reason for always ‘buying’ were excluded from the choice models estimated on the DCE data.
A total of (56 + 7) 63 people who completed the priced DCE were therefore excluded from the analysis, this is less than 4.5%.
DCE Debriefs: Adults
Aggregating across the three conditions 88% of the adult sample regarded the DCE as “easy” or “very easy” to understand and less than 10% of the sample regarded the DCE as “difficult” or “very difficult”.
Table 5. How easy was it to understand the WTP questions? – Full Sample
| Understand scale | Frequency | Percent | Cumulative |
|---|---|---|---|
| Very difficult | 14 | 1.11 | 1.11 |
| Difficult | 99 | 7.83 | 8.93 |
| No opinion | 85 | 6.72 | 15.65 |
| Easy | 561 | 44.35 | 60.00 |
| Very easy | 506 | 40.00 | 100.00 |
| Total | 1265 | 100.00 | - |
The pattern was consistent across the FHS conditions, as shown in Figure 2.
Figure 2: Ease of understanding DCE choices, adults

A separate question was regarding the difficulty of making the DCE choices. Fewer than 3.5% of the sample found making the DCE choices “very difficult” but about a quarter did find them difficult. This response pattern is not in itself a cause of concern, in fact researchers want people to have to exert to make their choices as it suggests respondents are considering the tradeoffs when making their choices, and that the attribute levels are such that tradeoffs have to be considered carefully when making choices. For example, if the prices were excessively low then people would find the choices ‘easy’, but the price term would likely be insignificant and WTP estimates not retrievable).
Table 6: How easy was it to decide your responses to the WTP questions? Full sample
| Understand scale | Frequency | Percent | Cumulative |
|---|---|---|---|
| Very difficult | 41 | 3.24 | 3.24 |
| Difficult | 305 | 24.11 | 27.35 |
| No opinion | 77 | 6.09 | 33.44 |
| Easy | 556 | 43.95 | 77.39 |
| Very easy | 286 | 22.61 | 100.00 |
| Total | 1265 | 100.00 | - |
The pattern is similar when disaggregated by condition, as shown in Figure 3. The percentage reporting the choices as “very difficult” ranged between 1.6% and 4.1%. The proportion reporting the choices as “easy” or “very easy” ranged from 62% (allergy) to 73% (coeliac disease).
Figure 3. Ease of making DCE choices, adults.

DCE: Children
Declining 3 zero price options: Children
If people declined the unpriced removal of their FHS in all 3 choice sets, even for the longest period of 20 years, they were not presented with the priced choice sets which are the basis of the WTP analysis presented below.
In the Parent sample 18% declined removal of their child’s FHS in one choice set, 26% declined removal of their FHS in two choice sets and 17% of respondents declined all 3 free removal options. The probability of declining the free removal declines as the duration increases.
Table 7. Number of Free Options Declined
| Number of options | Frequency | Percent | Cumulative |
|---|---|---|---|
| 0 | 277 | 38.69 | 38.69 |
| 1 | 129 | 18.02 | 56.70 |
| 2 | 188 | 26.26 | 82.96 |
| 3 | 122 | 17.04 | 100.00 |
| Total | 716 | 100.00 | - |
Figure 4. Number of zero price removals of FHS declined, children

Those who declined all three free removal options were asked the minimum period of removal of their child’s FHS which would induce them to opt for removal.
Of the 122 people who always rejected free removal in the training sets, one fifth specified a period of temporary removal they would accept, 65% indicated they would only accept permanent removal and 15% (18 people) did not want their child’s FHS removed at all.
Table 8. What is the minimum period that would induce you to accept free removal?
| Number of years | Frequency | Percent | Cumulative |
|---|---|---|---|
| 25 years | 10 | 8.20 | 8.20 |
| 30 years | 4 | 3.28 | 11.48 |
| 35 years | 3 | 2.46 | 13.93 |
| 40 years | 3 | 2.46 | 16.39 |
| 50 years | 5 | 4.10 | 20.49 |
| Permanent removal only | 79 | 64.75 | 85.25 |
| Decline removal | 18 | 14.75 | 100.00 |
| Total | 122 | 100.00 | - |
Protest Choices: Children
People who never bought the pill in any of the 9 choice sets were directed to a question asking why that was. This was in part to distinguish potential buyers who could be included in the DCE analysis (for example, potential buyers who could not afford the prices shown) from people who rejected the premise of the choice tasks, would never buy and should be excluded from the DCE analysis.
Table 9. Why did you never pay for the pill?
| Reasons for not paying for the pill | Frequency | Percent | Cumulative |
|---|---|---|---|
| Cost too high for benefit | 19 | 21.59 | 21.59 |
| I could not afford what was asked | 26 | 29.55 | 51.14 |
| Removal length was not worthwhile | 5 | 5.68 | 56.82 |
| My child would have to re adjust | 22 | 25.00 | 81.82 |
| I did not trust it's safety | 2 | 2.27 | 84.09 |
| I did not trust it would work | 1 | 1.14 | 85.23 |
| The government should pay | 7 | 7.95 | 93.18 |
| Other | 6 | 6.82 | 100.00 |
| Total | 88 | 100.00 | - |
Responses in bold (the pill regarded as not safe, or ineffective, or a view that the government should pay) were treated as indicating rejection of the valuation process and excluded from the choice models estimated on the DCE data.
People who always bought the pill in all 9 choice sets were directed to a question asking why that was.
Table 10. Why did you always pay for the pill?
| Reasons for always paying for the pill | Frequency | Percent | Cumulative |
|---|---|---|---|
| Prices unrealistic so ignored | 7 | 10.77 | 10.77 |
| The cost was small compared to benefit | 46 | 70.77 | 81.54 |
| Other | 12 | 18.46 | 100.00 |
| Total | 65 | 100.00 | - |
Ignoring the price was regarded as a rejection of the valuation process and people citing that as a reason for always ‘buying’ were excluded from the choice models estimated on the DCE data.
A total of (10 + 7) 17 parents who completed the priced DCE were therefore excluded from the analysis, this is less than 3%.
DCE Debriefs: Children
Aggregating across the three conditions 70% of the adult sample regarded the DCE as “easy” or “very easy” to understand and less than 4% of the sample regarded the DCE as “very difficult”.
Table 11: How easy was it to understand the WTP questions? Full sample
| Understand scale | Frequency | Percent | Cumulative |
|---|---|---|---|
| Very difficult | 23 | 3.87 | 3.87 |
| Difficult | 86 | 14.48 | 18.35 |
| No opinion | 67 | 11.28 | 29.63 |
| Easy | 265 | 44.61 | 74.24 |
| Very easy | 153 | 25.76 | 100.00 |
| Total | 594 | 100.00 | - |
The pattern was consistent across the FHS conditions, as shown in Figure 5.
Figure 5: Easy of understanding DCE choices, children

A separate question was regarding the difficulty of making the DCE choices. 11% of the sample found making the DCE choices “very difficult” and a third found them difficult.
As discussed regarding Adult sample, this response pattern is not in itself a cause of concern.
Table 12. How easy was it to decide your response to the WTP questions? – Full Sample
| Easy to decide | Frequency | Percent | Cumulative |
|---|---|---|---|
| Very difficult | 66 | 11.11 | 11.11 |
| Difficult | 195 | 32.83 | 43.94 |
| No opinion | 52 | 8.75 | 52.69 |
| Easy | 195 | 32.83 | 85.52 |
| Very easy | 86 | 14.48 | 100.00 |
| Total | 594 | 100.00 | - |
The pattern is similar when disaggregated by condition, as shown in Figure 6.
Figure 6. Ease of making DCE choices, children.

BWS Debriefs
The BWS tasks were completed only by adults, not by parents (in part because the components of the child FIQLQ and FAQLQ instruments vary by child age and so a single BWS design was not possible for the Parent survey). It is the debrief data from the adults that is presented here.
Understanding the BWS Choices.
Figure 7. Ease of understanding BWS allergy choices, adults.

Table 13: BWS understanding Food Allergy
| Easy to decide | Frequency | Percent | Cumulative |
|---|---|---|---|
| Very difficult | 12 | 3.12 | 3.12 |
| Difficult | 38 | 9.87 | 12.99 |
| No opinion | 48 | 12.47 | 25.45 |
| Easy | 176 | 45.71 | 71.17 |
| Very easy | 111 | 28.83 | 100.00 |
| Total | 385 | 100.00 | - |
Figure 8. Ease of understanding BWS coeliac disease choices, adults.

Table 14: BWS understanding Coeliac disease
| BWS choice difficulty | Frequency | Percent | Cumulative |
|---|---|---|---|
| Very difficult | 8 | 1.33 | 1.33 |
| Difficult | 73 | 12.15 | 13.48 |
| No opinion | 102 | 16.97 | 30.45 |
| Easy | 282 | 46.92 | 77.37 |
| Very easy | 136 | 22.63 | 100.00 |
| Total | 601 | 100.00 | - |
Figure 9: Ease of understanding BWS intolerance choices, adults

Table 15: BWS understanding Food intolerance
| BWS choice difficulty | Frequency | Percent | Cumulative |
|---|---|---|---|
| Very difficult | 8 | 1.82 | 1.82 |
| Difficult | 64 | 14.55 | 16.36 |
| No opinion | 53 | 12.05 | 28.41 |
| Easy | 202 | 45.91 | 74.32 |
| Very easy | 113 | 25.68 | 100.00 |
| Total | 440 | 100.00 | - |
Making the BWS Choices
Figure 10: Ease of making BWS allergy choices, adults

Table 16: BWS choice difficulty Food Allergy
| BWS choice difficulty | Frequency | Percent | Cumulative |
|---|---|---|---|
| Very difficult | 25 | 6.49 | 6.49 |
| Difficult | 124 | 32.21 | 38.70 |
| No opinion | 37 | 9.61 | 48.31 |
| Easy | 138 | 35.84 | 84.16 |
| Very easy | 61 | 15.84 | 100.00 |
| Total | 385 | 100.00 | - |
Figure 11: Ease of making BWS coeliac disease choices, adults

Table 17: BWS choice difficulty: coeliac disease
| BWS choice difficulty | Frequency | Percent | Cumulative |
|---|---|---|---|
| Very difficult | 22 | 3.66 | 3.66 |
| Difficult | 206 | 34.28 | 37.94 |
| No opinion | 86 | 14.31 | 52.25 |
| Easy | 228 | 37.94 | 90.18 |
| Very easy | 59 | 9.82 | 100.00 |
| Total | 601 | 100.00 | - |
Figure 12: Ease of making BWS intolerance choices, adults

Table 18: BWS choice difficulty: Food intolerance
| BWS choice difficulty | Frequency | Percent | Cumulative |
|---|---|---|---|
| Very difficult | 16 | 3.64 | 3.64 |
| Difficult | 133 | 30.23 | 33.86 |
| No opinion | 50 | 11.36 | 45.23 |
| Easy | 179 | 40.68 | 85.91 |
| Very easy | 62 | 14.09 | 100.00 |
| Total | 440 | 100.00 | - |
Summary
The survey was characterised by low levels of protest behaviour in the price DCE, although significant numbers were not included in the priced DCE because of their rejection of the 20-year removal at zero cost in the training choice sets.
The extent to which people found the DCE choice sets easy to understand was regarded as a positive finding. Finding those choices difficult to make was a more common occurrence, but was not regarded as problematic, given the feedback from the focus groups and the statistic results derived from the choice data.
A similar pattern was observed for the BWS choice sets – making the choices was harder than understanding the choice required.
First, they were asked what is the most they would be willing and able to pay to remove their FHS for a temporary period. They were randomly assigned a duration of 1 year, 3 years or 5 years.
They were then asked what is the most they would be willing and able to pay to remove their condition permanently.
Adult CVM Results: Temporary Removal
CVM Results: Temporary Removal in Aggregate
The mean WTP values for 1 year, 3 years or 5 years of removal for the pooled data are £696, £1678 and £2174 respectively, the median values are £100, £300 and £500 respectively – these median values correspond to a WTP value of £100/year.
Table 1. Summary statistics: Whole Sample by Removal Period
| Removal period | mean | sd | N | min | p25 | Median | p75 | Max |
|---|---|---|---|---|---|---|---|---|
| 1 year | 696.13 | 2559.23 | 424 | 0 | 0 | 100 | 500 | 40000 |
| 3 year | 1678.01 |
6230.84 |
423 | 0 | 5 | 300 | 1200 | 100000 |
| 5 year | 2173.51 | 4585.68 | 418 | 0 | 10 | 500 | 2500 | 50000 |
CVM Results: Temporary Removal by Condition
The mean WTP values for 1 year, 3 years or 5 years of removal for adults with a food allergy are £716, £1681, £2135 respectively, the median values are £100, £300 and £500 respectively – these median values correspond to a WTP value of £100/year.
Table 2. Summary statistics: Food Allergy by Removal Period
| Removal period | mean | sd | N | min | p25 | Median | p75 | Max |
|---|---|---|---|---|---|---|---|---|
| 1 year | 716.16 | 1869 | 117 | 0 | 0 | 100 | 500 | 15000 |
| 3 year | 1680.85 |
4266.34 |
109 | 0 | 1 | 300 | 1000 | 30000 |
| 5 year | 2135.45 | 4248.54 | 97 | 0 | 15 | 500 | 2500 | 30000 |
The mean WTP values for 1 year, 3 years or 5 years of removal for adults with coeliac disease are £682, £1713 and £2011 respectively, the median values are £100, £300 and £875 respectively.
Table 3. Summary statistics: Coeliac Disease by Removal Period
| Removal period | mean | sd | N | min | p25 | Median | p75 | Max |
|---|---|---|---|---|---|---|---|---|
| 1 year | 682.03 | 1919.42 | 179 | 0 | 0 | 100 | 500 | 15000 |
| 3 year | 1712.81 |
4814.34 |
183 | 0 | 0 | 300 | 1500 | 50000 |
| 5 year | 2011.41 | 3435.62 | 192 | 0 | 0 | 875 | 2500 | 25000 |
The mean WTP values for 1 year, 3 years or 5 years of removal for adults with a food intolerance are £698, £1627 and £2443, the median values are £100, £250 and £500 respectively.
Table 4. Summary statistics: Food Intolerance by Removal Period
| Removal period | mean | sd | N | min | p25 | Median | p75 | Max |
|---|---|---|---|---|---|---|---|---|
| 1 year | 697.53 | 3668.8 | 128 | 0 | .5 | 100 | 250 | 40000 |
| 3 year | 1627.04 | 8857.31 | 131 | 0 | 50 | 250 | 1000 | 100000 |
| 5 year | 2443.41 | 6102.64 | 129 | 0 | 30 | 500 | 2000 | 50000 |
The relationship between the mean WTP and the removal period is monotonic, with evidence of declining value of additional years (annual value is lower for 3 or 5 years of removal, than for 1 year).
Table 5. CVM WTP Values, in aggregate and by Condition
| Value | years | Mean, £ | /year | years | Median, £ | /year |
|---|---|---|---|---|---|---|
| Aggregate | 1 | 696 | 696 | 1 | 100 | 100 |
| Aggregate | 3 | 1678 | 559 | 3 | 300 | 100 |
| Aggregate | 5 | 2174 | 435 | 5 | 500 | 100 |
| Allergy | 1 | 716 | 716 | 1 | 100 | 100 |
| Allergy | 3 | 1681 | 560 | 3 | 300 | 100 |
| Allergy | 5 | 2135 | 427 | 5 | 500 | 100 |
| Coeliac | 1 | 682 | 682 | 1 | 100 | 100 |
| Coeliac | 3 | 1713 | 571 | 3 | 300 | 100 |
| Coeliac | 5 | 2011 | 402 | 5 | 875 | 175 |
| Intolerance | 1 | 698 | 698 | 1 | 100 | 100 |
| Intolerance | 3 | 1627 | 542 | 3 | 250 | 83 |
| Intolerance | 5 | 2443 | 489 | 5 | 500 | 100 |
Figure 1 Distribution of open ended WTP by period: adults


CVM Results: Permanent Removal
The mean WTP value for permanent removal for the pooled data was £5367, the median value was £1000.
Table 6. What is the most you are willing to pay for permanent removal of your condition?
| - | mean | std. Dev | N | Min | p25 | Median | p75 | max |
|---|---|---|---|---|---|---|---|---|
| Maximum WTP | 5366.8 | 11203.133 | 299 | 0 | 300 | 1000 | 5000 | 100000 |
The mean WTP value for permanent removal of food allergy, coeliac disease and food intolerance conditions are £6184, £6996 and £4054 respectively.
Table 7. What is the most you are willing to pay for permanent removal of your condition? By Only or Worst Condition
| Only or worst condition | mean | sd | N | min | p25 | Median | p75 | max |
|---|---|---|---|---|---|---|---|---|
| Food allergy | 6183.7 | 13166.96 | 366 | 0 | 70 | 5000 | 5000 | 100000 |
| Coeliac disease | 6996.3 | 14326.14 | 584 | 0 | 500 | 2500 | 7000 | 100000 |
| Food intolerance | 4054.3 | 9796.37 | 419 | 0 | 100 | 1000 | 5000 | 100000 |
First, they were asked what is the most they would be willing and able to pay to remove their child’s FHS for a temporary period. They were then asked what is the most they would be willing and able to pay to remove their child’s condition permanently.
Child CVM Results: Temporary Removal
Respondents were asked what is the most they are willing to pay for the removal of their child’s FHS for a predefined number of years removal. They were randomly assigned one of: 1 year, 3 years and 5 years.
Child CVM Results: Temporary Removal, Aggregate
The mean WTP values for 1 year, 3 years or 5 years of removal for the pooled data (not disaggregated by condition) are £1603, £4134 and £6581 respectively, the median values are £250, £1000 and £1500 respectively
Table 1. Summary statistics: Whole Sample by Removal Period
| Removal period | mean | sd | N | min | p25 | Median | p75 | max |
|---|---|---|---|---|---|---|---|---|
| 1 year | 1603.32 | 4383.3 | 201 | 0 | 2 | 250 | 1000 | 30000 |
| 3 years | 4134.48 | 11205.04 | 196 | 0 | 4.5 | 1000 | 3000 | 100000 |
| 5 years | 6581.04 | 16403.43 | 197 | 0 | 5 | 1500 | 5000 | 100000 |
Child CVM Results: Temporary Removal, by Condition
The mean WTP values for 1 year, 3 years or 5 years of removal of food allergy for a child are £716, £1681, £2135 respectively, the median values are £100, £300 and £500 respectively – these median values correspond to a WTP value of £100/year.
Table 2. Summary statistics: Food Allergy by Removal Period
| Removal period | mean | sd | N | min | p25 | Median | p75 | max |
|---|---|---|---|---|---|---|---|---|
| 1 year | 2117.3 | 5132.63 | 141 | 0 | 0 | 500 | 1200 | 30000 |
| 3 years | 4134.02 | 11648.04 | 127 | 0 | 0 | 1000 | 3000 | 100000 |
| 5 years | 6745.29 | 16437.02 | 137 | 0 | 4 | 1200 | 5000 | 100000 |
The mean WTP values for 1 year, 3 years or 5 years of removal of coeliac disease for a child are £342, £7504 and £10833 respectively, the median values are £75, £1500 and £1500 respectively. As reported elsewhere, we note the small sample size of parents of children with coeliac disease and these small numbers were randomly assigned to one of three temporary durations, further reducing the sample size for specific durations of removal.
Table 3. Summary statistics: Coeliac Disease by Removal Period
| Removal period | mean | sd | N | min | p25 | Median | p75 | max |
|---|---|---|---|---|---|---|---|---|
| 1 year | 342.3 | 451.91 | 20 | 0 | 0 | 75 | 500 | 1500 |
| 3 years | 7504.3 | 15765.21 | 24 | 0 | 51 | 1500 | 5000 | 75000 |
| 5 years | 10833.6 | 26867.3 | 21 | 0 | 0 | 1500 | 5000 | 100000 |
The mean WTP values for 1 year, 3 years or 5 years of removal of food intolerance for a child are £422, £2339 and £3714, the median values are £125, £300 and £2500 respectively.
Table 4. Summary statistics: Food Intolerance by Removal Period
| Removal period | mean | sd | N | min | p25 | Median | p75 | max |
|---|---|---|---|---|---|---|---|---|
| 1 year | 422.1 | 812.98 | 40 | 0 | 75 | 125 | 500 | 5000 |
| 3 years | 2338.6 | 5337.22 | 45 | 0 | 15 | 300 | 2000 | 30000 |
| 5 years | 3714.2 | 4738.6 | 39 | 0 | 500 | 2500 | 5000 | 25000 |
The relationship between the amount a respondent is willing to pay and the removal period is monotonic. For the adults there was greater consistency between the annualized WTP values across the condition than is the case for parents responding regarding temporary relief for their children: the WTP values for food intolerance are lower than for food allergy or coeliac disease.
Figure 2 Distribution of open ended WTP by period: children


Child CVM Results: Permanent Removal
The mean WTP value for permanent removal of the child’s condition for the pooled data is £16912, the median value was £5000.
Table 5: Maximum willingness to pay for permanent removal of child’s only/worst condition, aggregate.
| - | mean | Std. Dev. | N | min | p25 | Median | p75 | Max |
|---|---|---|---|---|---|---|---|---|
| Maximum WTP | 16912.15 | 27294.25 | 698 | 0 | 500 | 5000 | 20000 | 100000 |
The mean WTP values for permanent removal of a child’s food allergy, coeliac disease and food intolerance are £16982, £19820 and £6648 respectively.
Table 6: Maximum willingness to pay for permanent removal of child’s only/worst condition.
| Only or worst condition | mean | sd | N | min | p25 | Median | p75 | max |
|---|---|---|---|---|---|---|---|---|
| Coeliac disease | 16981.6 | 26893.22 | 70 | 0 | 1000 | 5500 | 20000 | 100000 |
| Food Allergy | 19819.7 | 29458.99 | 489 | 0 | 1000 | 5000 | 25000 | 100000 |
| Food Intolerance | 6648.4 | 14004.47 | 139 | 0 | 200 | 1000 | 10000 | 100000 |
The WTP values of parents regarding their children are significantly higher than those for adults regarding their own conditions. As with temporary removal the parents WTP regarding food intolerance were much lower than those for food allergy or coeliac disease which were of a similar magnitude.
Preference Differences between Recruitment Pools
The first relates to whether the different samples had different preferences. We investigate this using the preferred models as reported in the main text, as there may differences in condition across the samples, and one does not want to ascribe differences in preferences per se to differences in condition.
We consider 3 samples: repeats from wave 1 (WAVE1), the Pure Profile sample (PURE), and new recruits (SUPPORT). We conduct a simple Log Likelihood test, comparing the aggregate sample model LL with the sum of the LL from three independent models. For all conditions we reject the null that parameters across the sample can be restricted to be the same. We then investigated where these effects may manifest, by estimating a model with interactions on the years, cost and mean of the SQ distribution. These are reported below. In all cases it is possible to accept that these interaction models are acceptable restrictions to the unrestricted models (p values of 0.34, 0.44 and 0.12 for the allergy, coeliac and intolerance models respectively).
Table 1. Models by condition, with recruitment method dummies interacting with attributes.
| Condition | Allergy | Coeliac | Intolerance |
|---|---|---|---|
| years | 0.3023*** | 0.404*** | -0.0033 |
| years | (0.0977) | (0.0504) | (0.0470) |
| PURE x years | -0.4335*** | -0.419*** | 0.0716*** |
| PURE x years | (0.1066) | (0.0901) | (0.0297) |
| SUPPORT x years | 00.2315** | -0.219*** | -0.661** |
| SUPPORT x years | (0.1021) | (0.0700) | (0.0349) |
| FIQ x years | - | - | 0.0268*** |
| FIQ x years | - | - | (0.00757) |
| FAQ x years | 0.0198** | - | - |
| FAQ x years | (0.0088) | - | - |
| years2 | -0.0121*** | -0.0109*** | - |
| years2 | (0.0039) | (0.00212) | - |
| PURE x years2 | 0.0139*** | 0.0124*** | - |
| PURE x years2 | (0.0048) | (0.00401) | - |
| SUPPORT x years2 | 0.0094** | 0.00855*** | - |
| SUPPORT x years2 | (0.0047) | (0.00286) | - |
| cost | -0.000338*** | -0.000339*** | -0.000371*** |
| cost | (4.53e-05) | (3.87e-05) | (4.98e-05) |
| PURE x cost | 0.000154*** | 0.000293*** | 0.00028*** |
| PURE x cost | (4.57e-05) | (4.06e-005) | (4.91e-05) |
| SUPPORT x cost | 0.000154*** | 0.000171 | 0.000258*** |
| SUPPORT x cost | (0.0000472) | (0.00005) | (5.12e-05) |
| SQ (Mean) | 4.1444*** | 2.678*** | 3.974*** |
| SQ (Mean) | (1.124) | (0.459) | (0.991) |
| PURE x SQ | -0.7021 | -0.262 | 0.895 |
| PURE x SQ | (0.6297) | (0.594) | (0.579) |
| SUPPORT x SQ | -0.8296 | 0.146 | 0.108 |
| SUPPORT x SQ | (0.6037) | (0.366) | (0.678) |
| FAQ x SQ | -0.722*** | - | - |
| FAQ x SQ | (0.166) | - | - |
| CDQ x SQ | - | -0.0319*** | - |
| CDQ x SQ | - | (0.00819) | - |
| FIQ x SQ | - | - | -0.553*** |
| FIQ x SQ | - | - | (0.158) |
| age x SQ | 0.0305*** | - | - |
| age x SQ | (0.0104) | - | - |
| SQ (SD) | 2.571*** | 2.650*** | 3.012*** |
| SQ (SD) | (0.209) | (0.201) | (0.245) |
| Observations | 5,454 | 9,504 | 6,642 |
Robust standard errors in parentheses
*** p<0.01, ** p<0.05, * p<0.1This would seem to suggest that the Pure profile, in particular, has different preferences and choice probabilities than the other pools of respondents.
Increasing the number of Random parameters in mixed logit models
We also tested for more general models of heterogeneity in preferences by using the preferred models in the main report and estimating models with random parameters for the ‘years’ variables.
These models are reported in Table 2 below.
Table 2. Models by condition, with random parameter on years
| Condition | Allergy | Coeliac | Intolerance |
|---|---|---|---|
| cost | -0.0001354*** | -0.000320*** | -0.000228*** |
| cost | (3.13e-05) | (0.000069) | (0.000636) |
| Years (mean) | -0.0954 | 0.380*** |
-0.550*** |
| Years (mean) | (0.111) | (0.0555) | (0.195) |
| FAQ x years | 0.0505*** | - | - |
| FAQ x years | (0.0201) | - | - |
| FIQ x years | - | - | 0.108*** |
| FIQ x years | - | - | (0.0365) |
| years2 (mean) | -0.00528*** | -0.00795*** | - |
| years2 (mean) | (0.00248) | (0.00199) | - |
| FAQ x SQ | -0.561*** | - | - |
| FAQ x SQ | (0.140) | - | - |
| CDQ x SQ | - | -0.0346*** | - |
| CDQ x SQ | - | (0.0097) | - |
| FIQ x SQ | - | - | -0.316*** |
| FIQ x SQ | - | - | (0.111) |
| age x SQ | 0.0253** | - | - |
| age x SQ | (0.00963) | - | - |
| SQ (mean) | 2.932*** | 2.928*** | 2.597*** |
| SQ (mean) | (0.815) | (0.533) | (0.634) |
| SQ (SD) | 2.188*** | 2.840*** | (1.674)*** |
| SQ (SD) | (0.412) | (0.423) | (0.295) |
| years (SD) | 0.264*** | 0.364*** | 0.400*** |
| years (SD) | (0.089) | (0.095) | (0.131) |
| years2 (SD) | 0.0144 | 0.0174*** | - |
| years2 (SD) | (0.0047) | (0.0057) | - |
| Cov (SQ: years) | 0.115 | -0.250 | -0.447*** |
| Cov (SQ: years) | (0.237) | (0.372) | (0.165) |
| Cov (SQ: years2) | (0.011) | (0.0181) | - |
| Cov (SQ: years2) | (0.0024) | (0.00298) | - |
| Choices | 2727 | 4752 | 3321 |
| Individuals | 303 | 528 | 369 |
Robust standard errors in parentheses
*** p<0.01, ** p<0.05, * p<0.1
Given individual estimates of preference parameters it is then possible to generate individual specific estimates of WT for a year’s relief from the condition.
These are calculated using the individual specific measures of the condition scores, and for coeliacs, for the initial year of improvement.
The distribution of these values is reported in Figure 1-3 below.
Figure 1. Distribution of individual WTP, Food Allergy

Figure 2. Distribution of individual WTP, Coeliac Disease

Figure 3. Distribution of individual WTP, Food Intolerance

Where there are negative values, we interpret this to mean that respondents have such a low value for the change (either because they have a negative preference parameter and/or a low value for the condition score) that they would not want to take the pill even if subsidised: not that they would value greater lengths of time with the condition.
Including Attitude to Risk in the Mixed Logit Models
Appendix N describes the nature and distribution of a measure of risk that was generated in the study.
We investigated whether this could be used to explain choices within the DCE. We specified a model in which that individual-level risk attitude was interacted with the status quo (SQ) dummies variable (Table 3 below).
For all three models (conditions) a higher level of willingness to take risk led to a reduction in the value placed on the status quo: or equivalently, those who had more risk averse attitudes were less likely to buy and take the pill.
Table 3: Models by condition, with risk interactions on the SQ dummy
| Condition | Allergy | Coeliac | Intolerance |
|---|---|---|---|
| years | 0.0146 | 0.238*** | -0.0454 |
| years | (0.0574) | (0.0324) | (0.0399) |
| FAQ x years | 0.0228*** | - | - |
| FAQ x years | (0.00783) | - | - |
| FIQ x years | - | - | 0.0229*** |
| FIQ x years | - | - | (0.00775) |
| years2 | -0.00301* | -0.00532*** | - |
| years2 | (0.0018) | (0.00130) | - |
| cost | -0.000115*** | -0.000170*** | -0.000115*** |
| cost | (2.14e-05) | (2.36e-05) | (1.84e-05) |
| FAQ x SQ | -0.693*** | - | - |
| FAQ x SQ | (0.144) | - | - |
| CDQ x SQ | - | -0.0294*** | - |
| CDQ x SQ | - | (0.00814) | - |
| FIQ x SQ | - | - | -0.793*** |
| FIQ x SQ | - | - | (0.160) |
| age x SQ | 0.0222** | - | - |
| age x SQ | (0.00934) | - | - |
| risk x SQ | -0.281*** | -0.199* | -0.453*** |
| risk x SQ | (0.0953) | (0.0877) | (0.107) |
| SQ (mean) | 4.969*** | 3.402*** | 7.537*** |
| SQ (mean) | (1.083) | (0.586) | (1.086) |
| SQ (SD) | 2.275*** | 2.634*** | 3.102*** |
| SQ (SD) | (0.249) | (0.288) | (0.357) |
| Choices | 2727 | 4752 | 3321 |
| Individuals | 303 | 528 | 369 |
Robust standard errors in parentheses
*** p<0.01, ** p<0.05, * p<0.1
Including Subjective Perception Of Illness in the Mixed Logit Models
We used a subjective perception of illness scale as an additional potential measure of the impact of the conditions on respondents. We used the widely cited Brief Illness Perception Questionnaire (Brief IPQ) (Broadbent at al., 2006).
In the model below we use the response to this question:
How much does your condition affect your life?
0 - no effect at all
10 - severely affects my life
(labelled, BIPQ) as an interaction term in the Adult models for the 3 conditions.
BIPQ is interacted with both years without the FHS and the Status Quo ASC.
Table 4. Models by condition, with BIPQ interactions
| Condition | Allergy | Coeliac | Intolerance |
|---|---|---|---|
| years | 0.0527 | 0.237*** | 0.0242 |
| years | (0.0542) | (0.0324) | (0.0345) |
| BIPQ x years | -0.00308* | - | 0.00586 |
| BIPQ x years | (0.00181) | - | (0.00450) |
| years2 | -0.00301* | -0.00531*** | - |
| years2 | (0.0018) | (0.00130) | - |
| cost | -0.000114*** | -0.000169*** | -0.000113*** |
| cost | (2.13e-05) | (2.39e-05) | (1.77e-05) |
| BIPQ x SQ | -0.446*** | -0.127** | -0.369*** |
| BIPQ x SQ | (0.0837) | (0.0559) | (0.0963) |
| age x SQ | 0.0183** | - | - |
| age x SQ | (0.00868) | - | - |
| SQ (mean) | 3.855*** | 2.011*** | 4.586*** |
| SQ (mean) | (0.794) | (0.427) | (0.751) |
| SQ (SD) | 2.259*** | 2.656*** | 3.322*** |
| SQ (SD) | (0.243) | (0.281) | (0.389) |
| Choices | 2727 | 4752 | 3321 |
| Individuals | 303 | 528 | 369 |
Robust standard errors in parentheses
*** p<0.01, ** p<0.05, * p<0.1
Compared to using the condition specific measures, there is a slight improvement in fit using the BIPQ for the Allergy data, and reductions in fit for coeliac and Intolerance data. There is now no significant effect of the interaction with years for food intolerance. However, the other parameters in the models are largely unchanged.