Prosiect ymchwil
Consumer Insights Tracker September 2023
The Consumer Insights Tracker is an online monthly tracking survey commissioned by the Food Standards Agency (FSA).
The Consumer Insights Tracker is an online monthly tracking survey commissioned by the Food Standards Agency (FSA). It monitors the behaviour and attitudes of adult consumers aged 16+ in England, Wales and Northern Ireland in relation to food.
The survey includes topics such as food availability, food affordability, consumer concerns in relation to food, confidence in the food supply chain and in the FSA as a regulator.
The full data set is published on data.food.gov.uk: Consumer Insights Tracker July 2023 - present.
Key findings for September 2023
Food affordability
- 25% are worried about their household being able to afford food in the next month, in line with last month (25%).
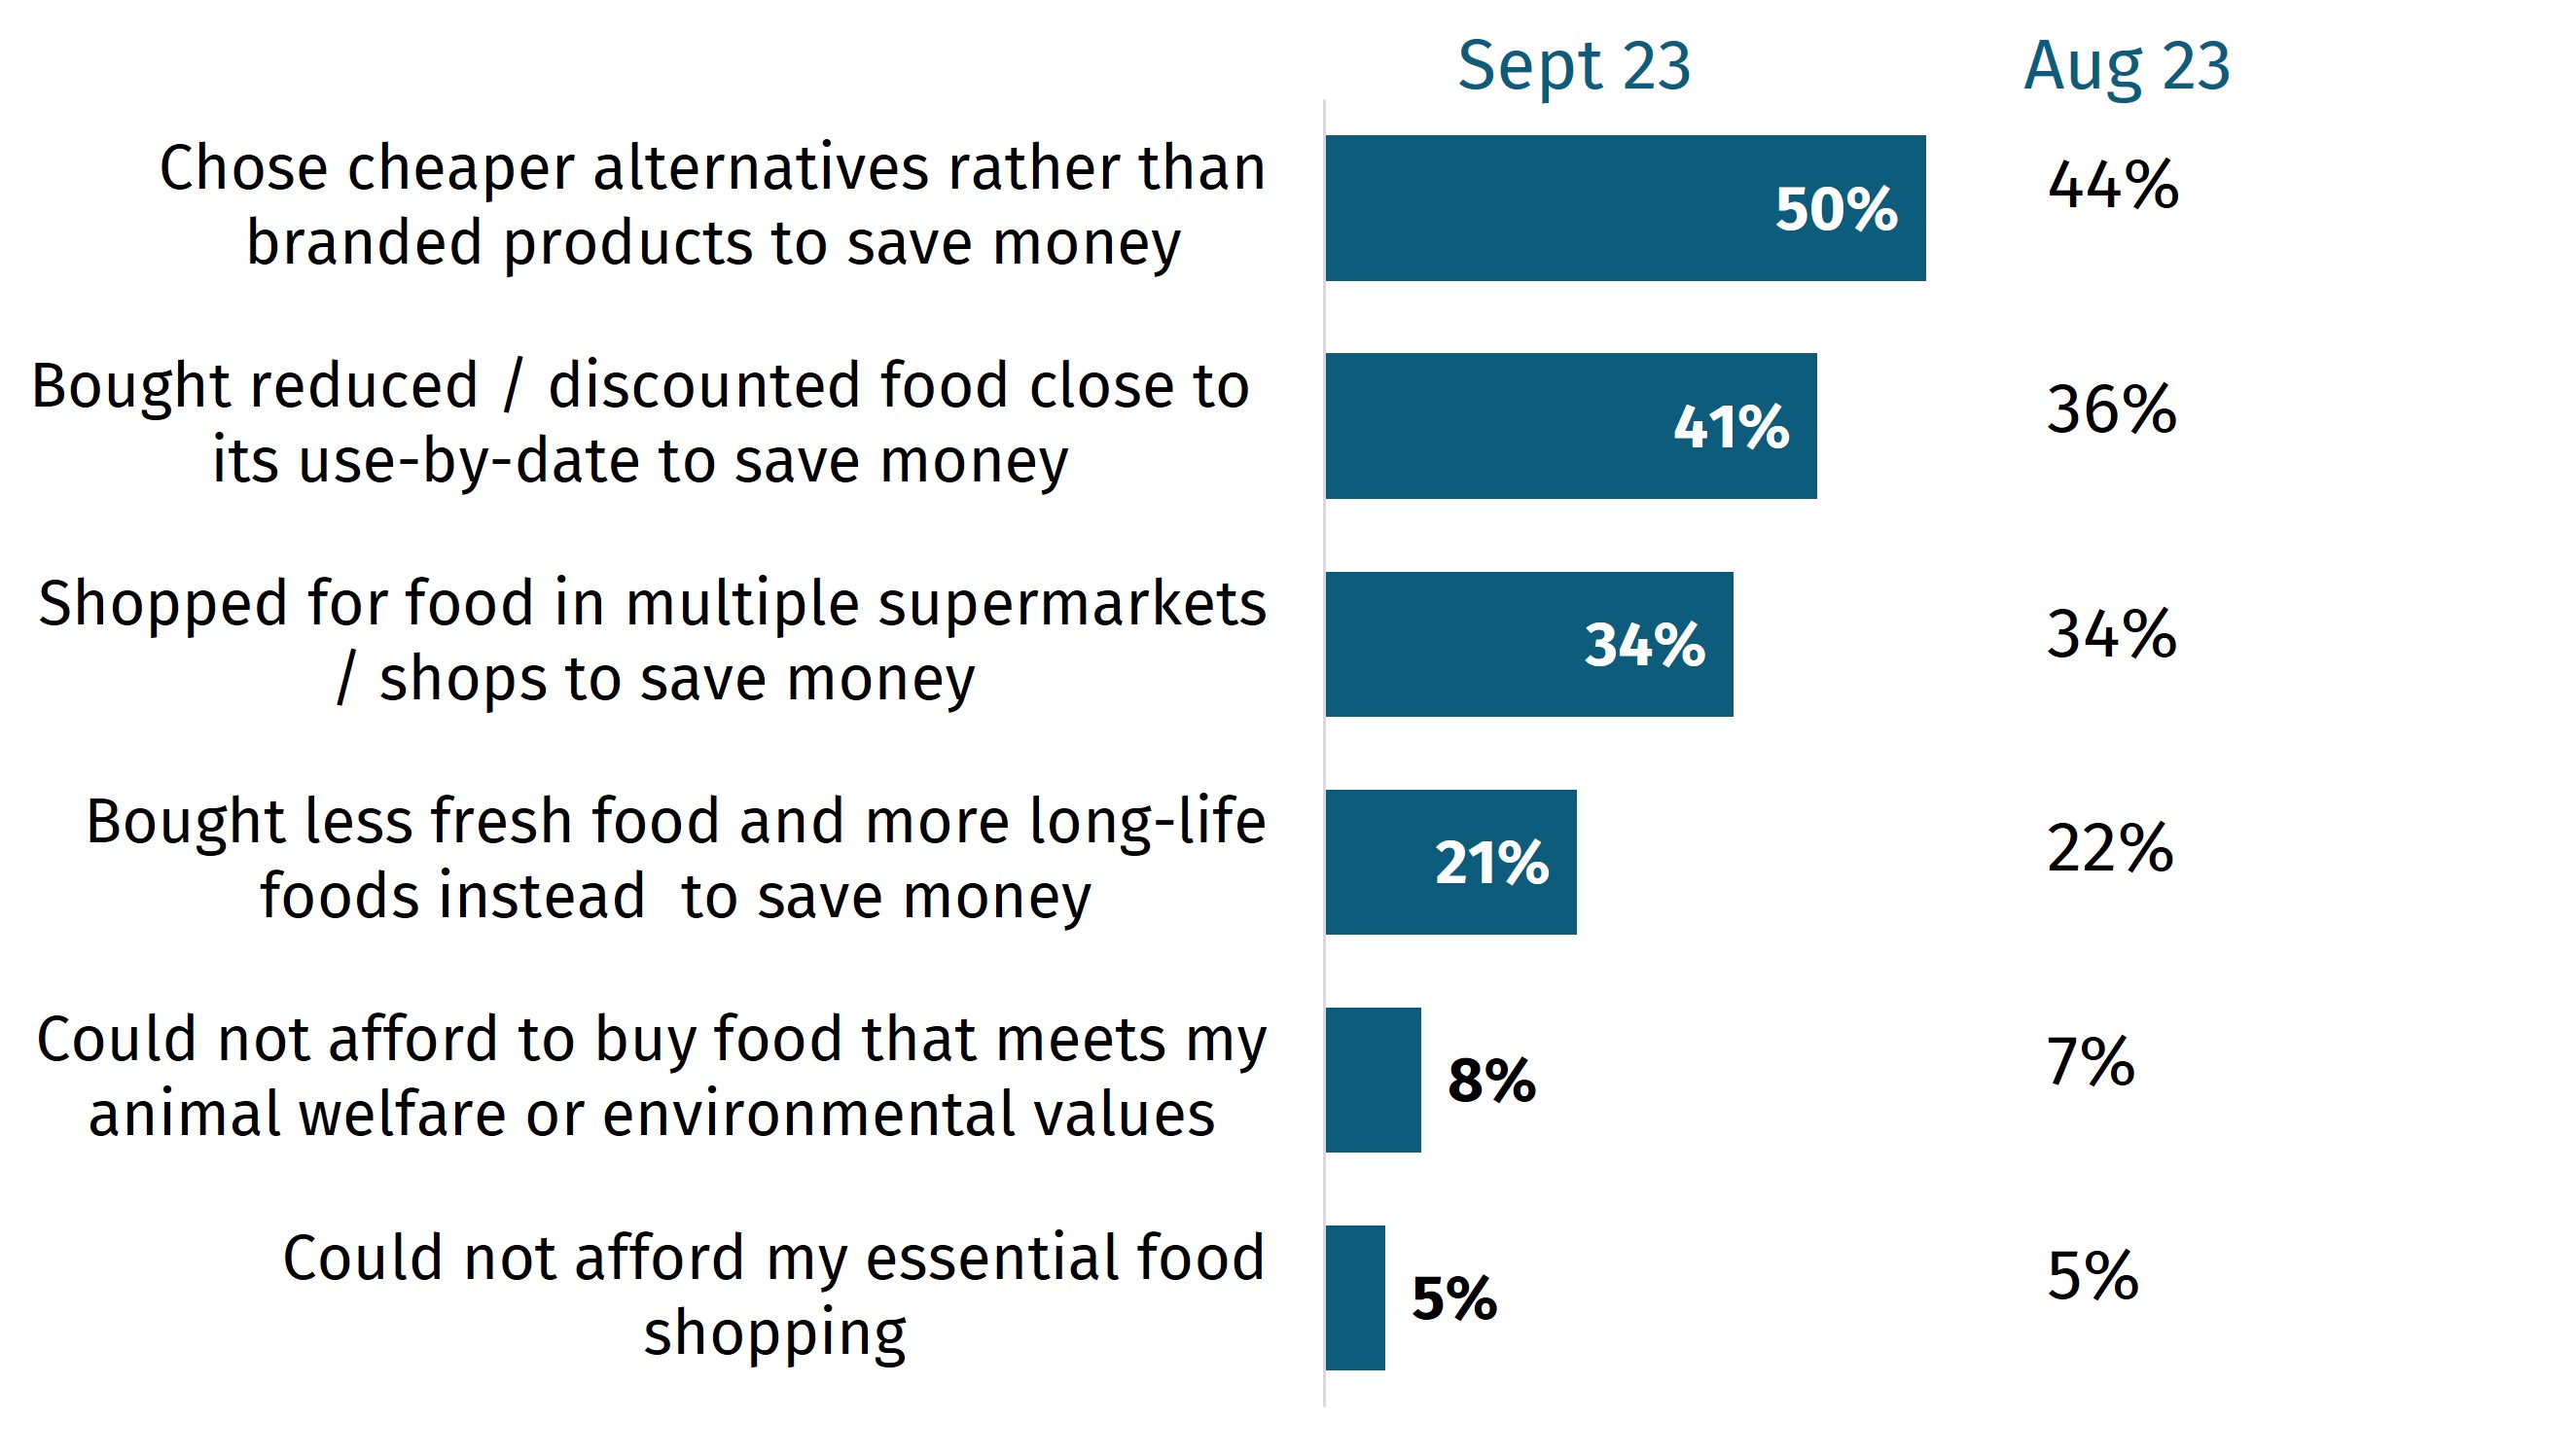
- 41% bought reduced or discounted food close to its use-by-date to save money, an increase from 36% last month.
Food concerns
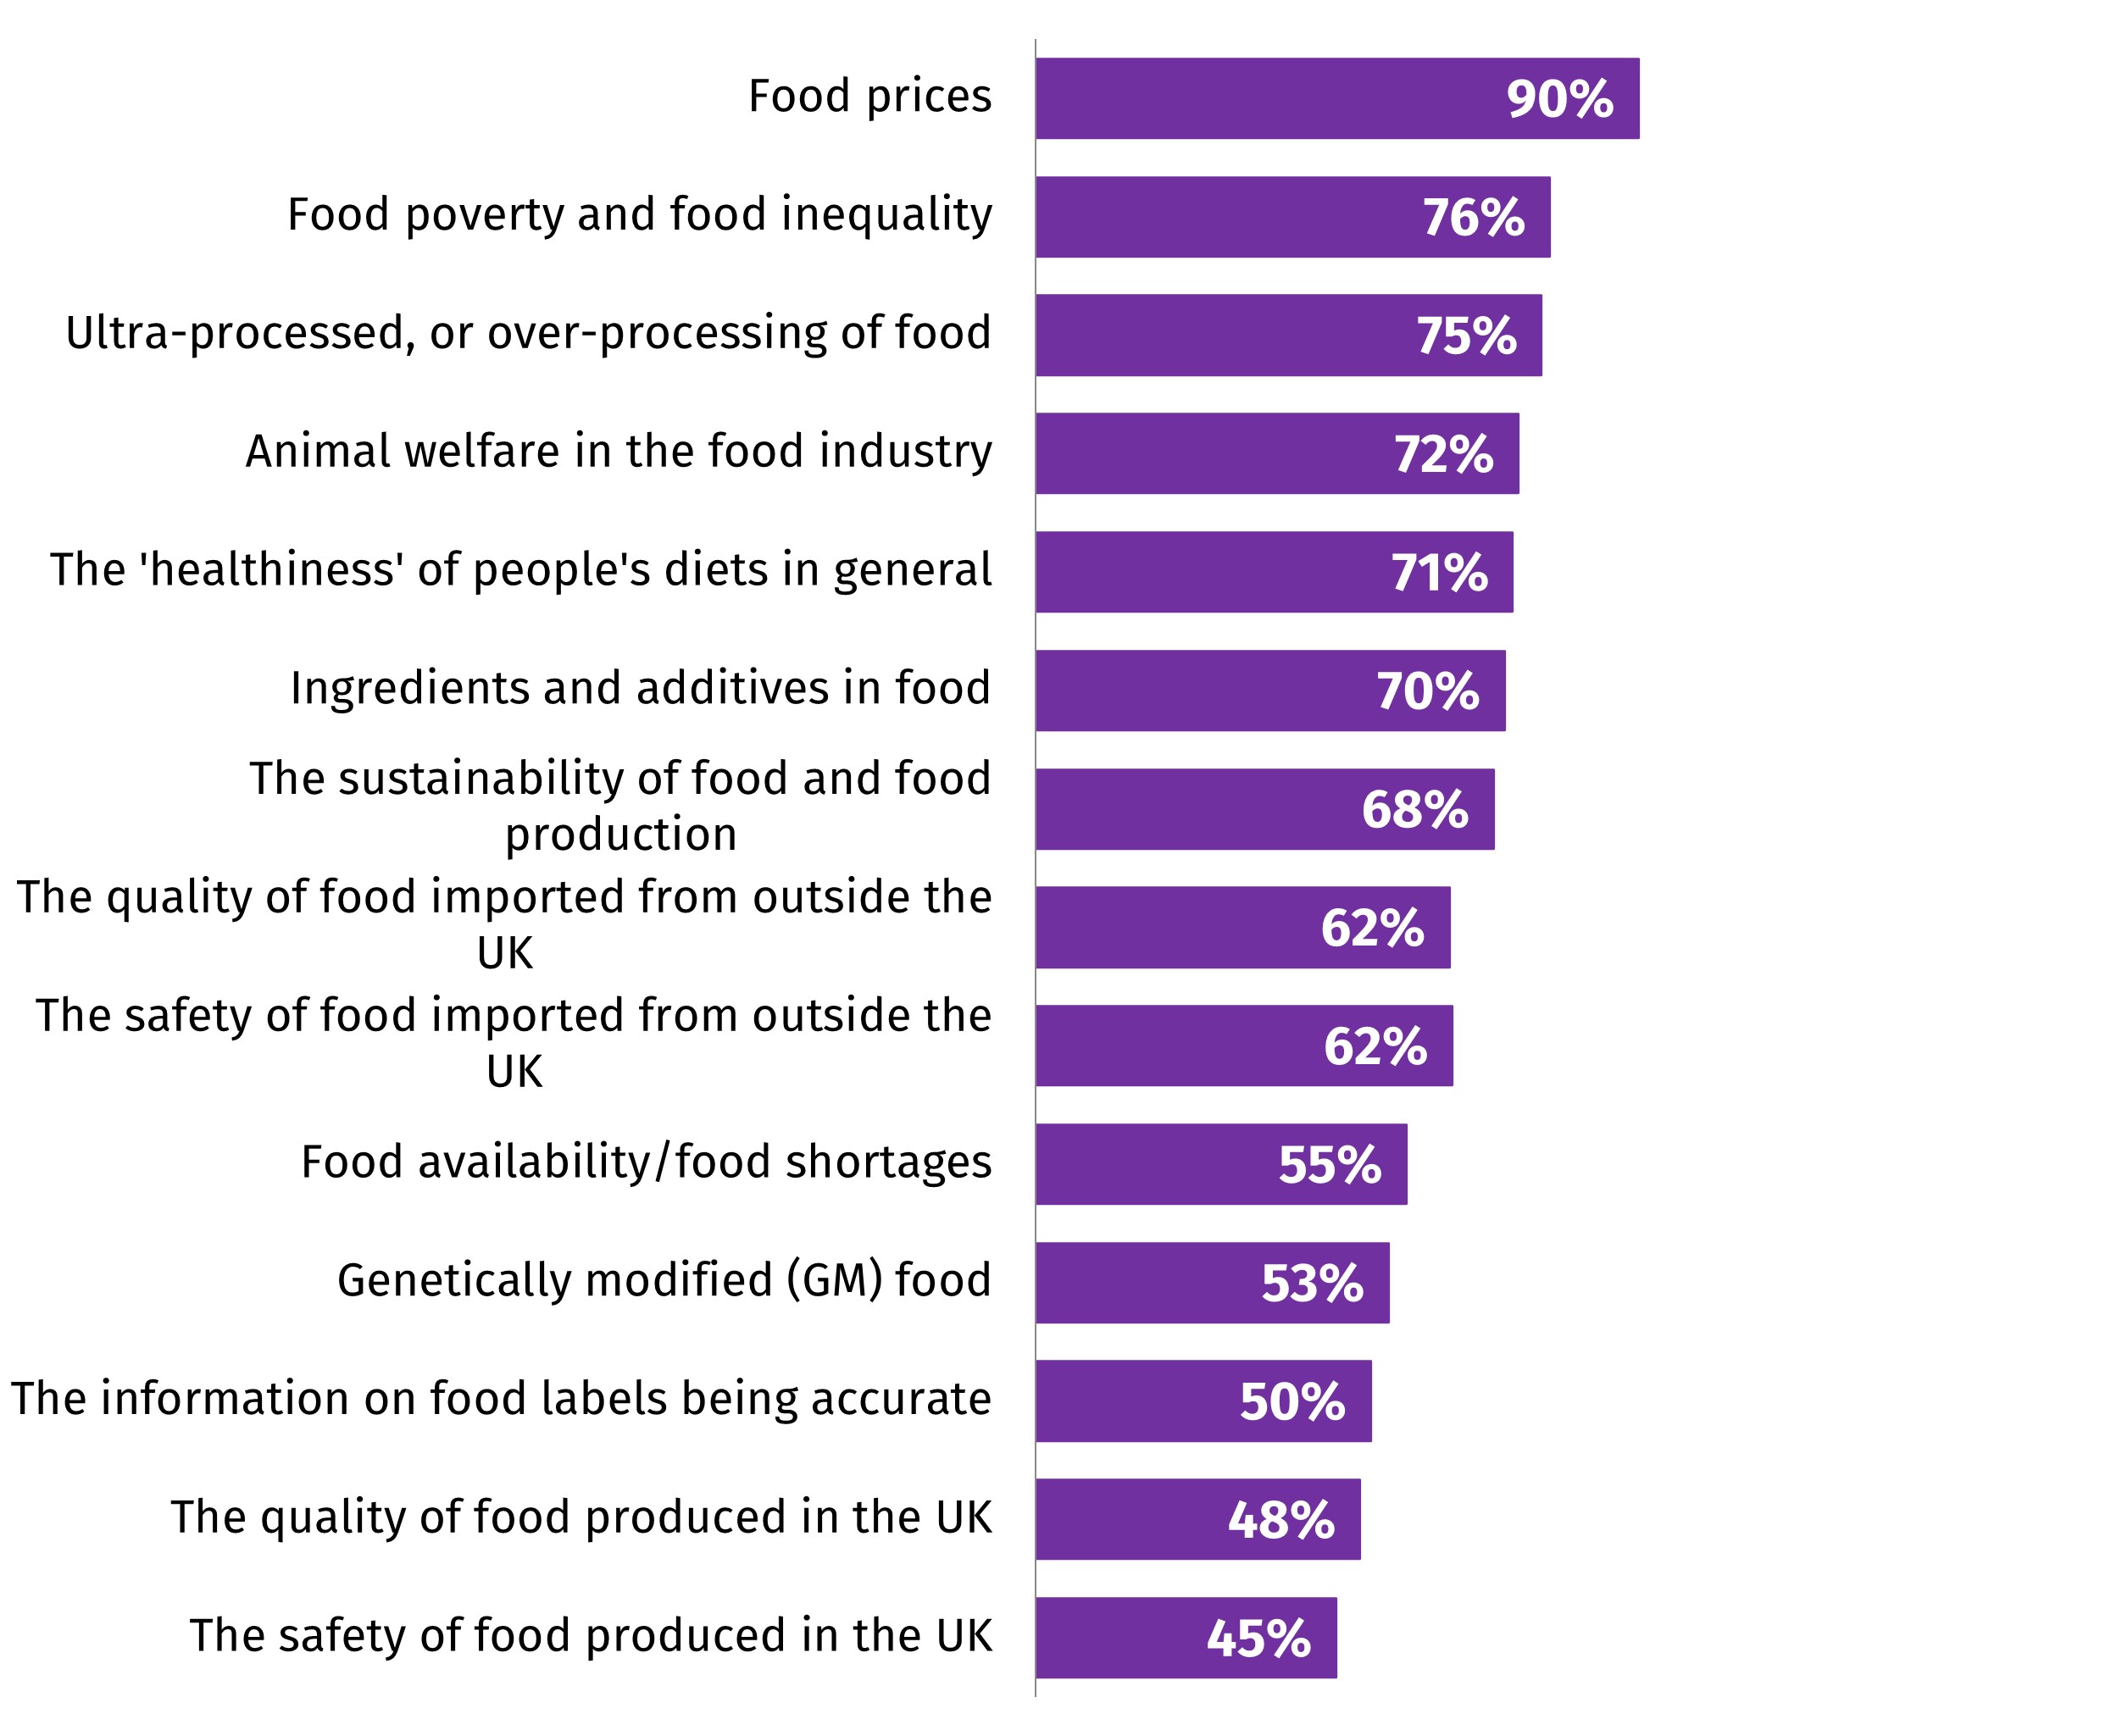
- 90% are concerned about food prices, and 76% are concerned about food poverty and food inequality.
Food availability
- 21% are worried about there being enough food available for their household in the next month, in line with 22% last month.
The FSA
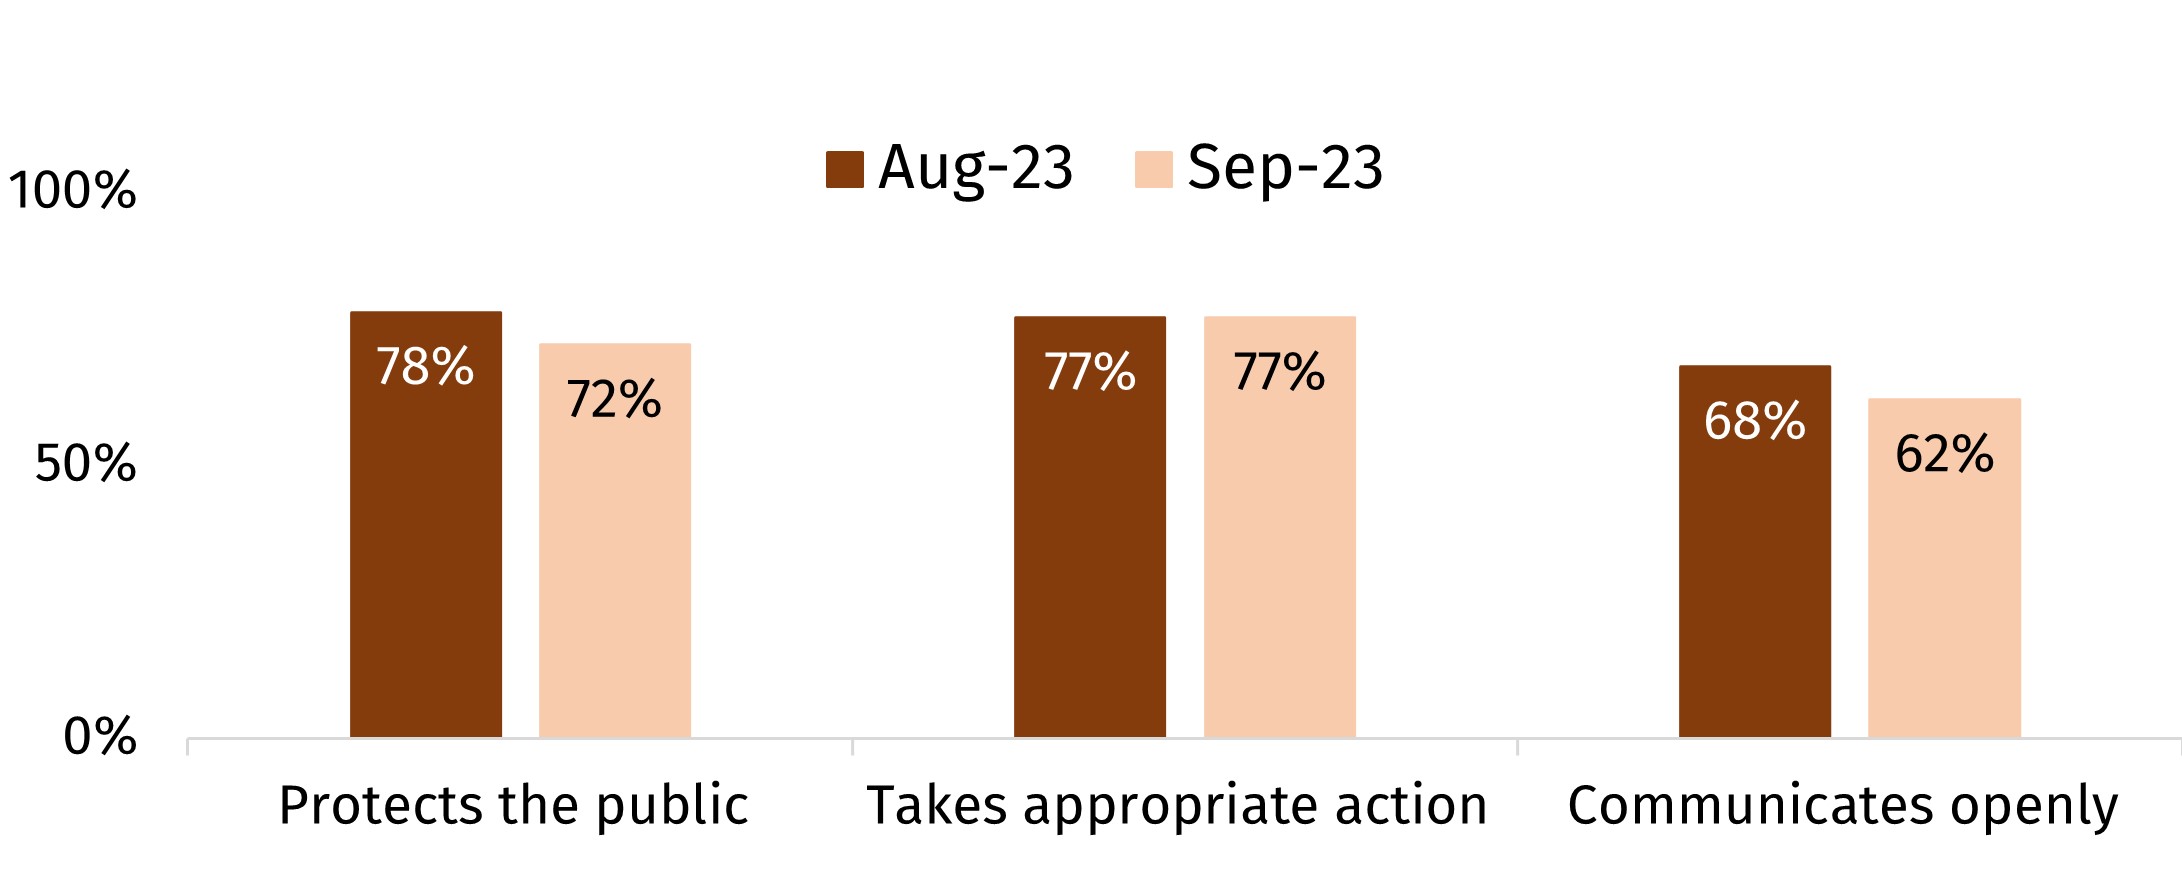
- Of those with some knowledge of the FSA, 72% are confident that the FSA protects the public from food-related risks, a decrease from last month (78%).
Food supply chain
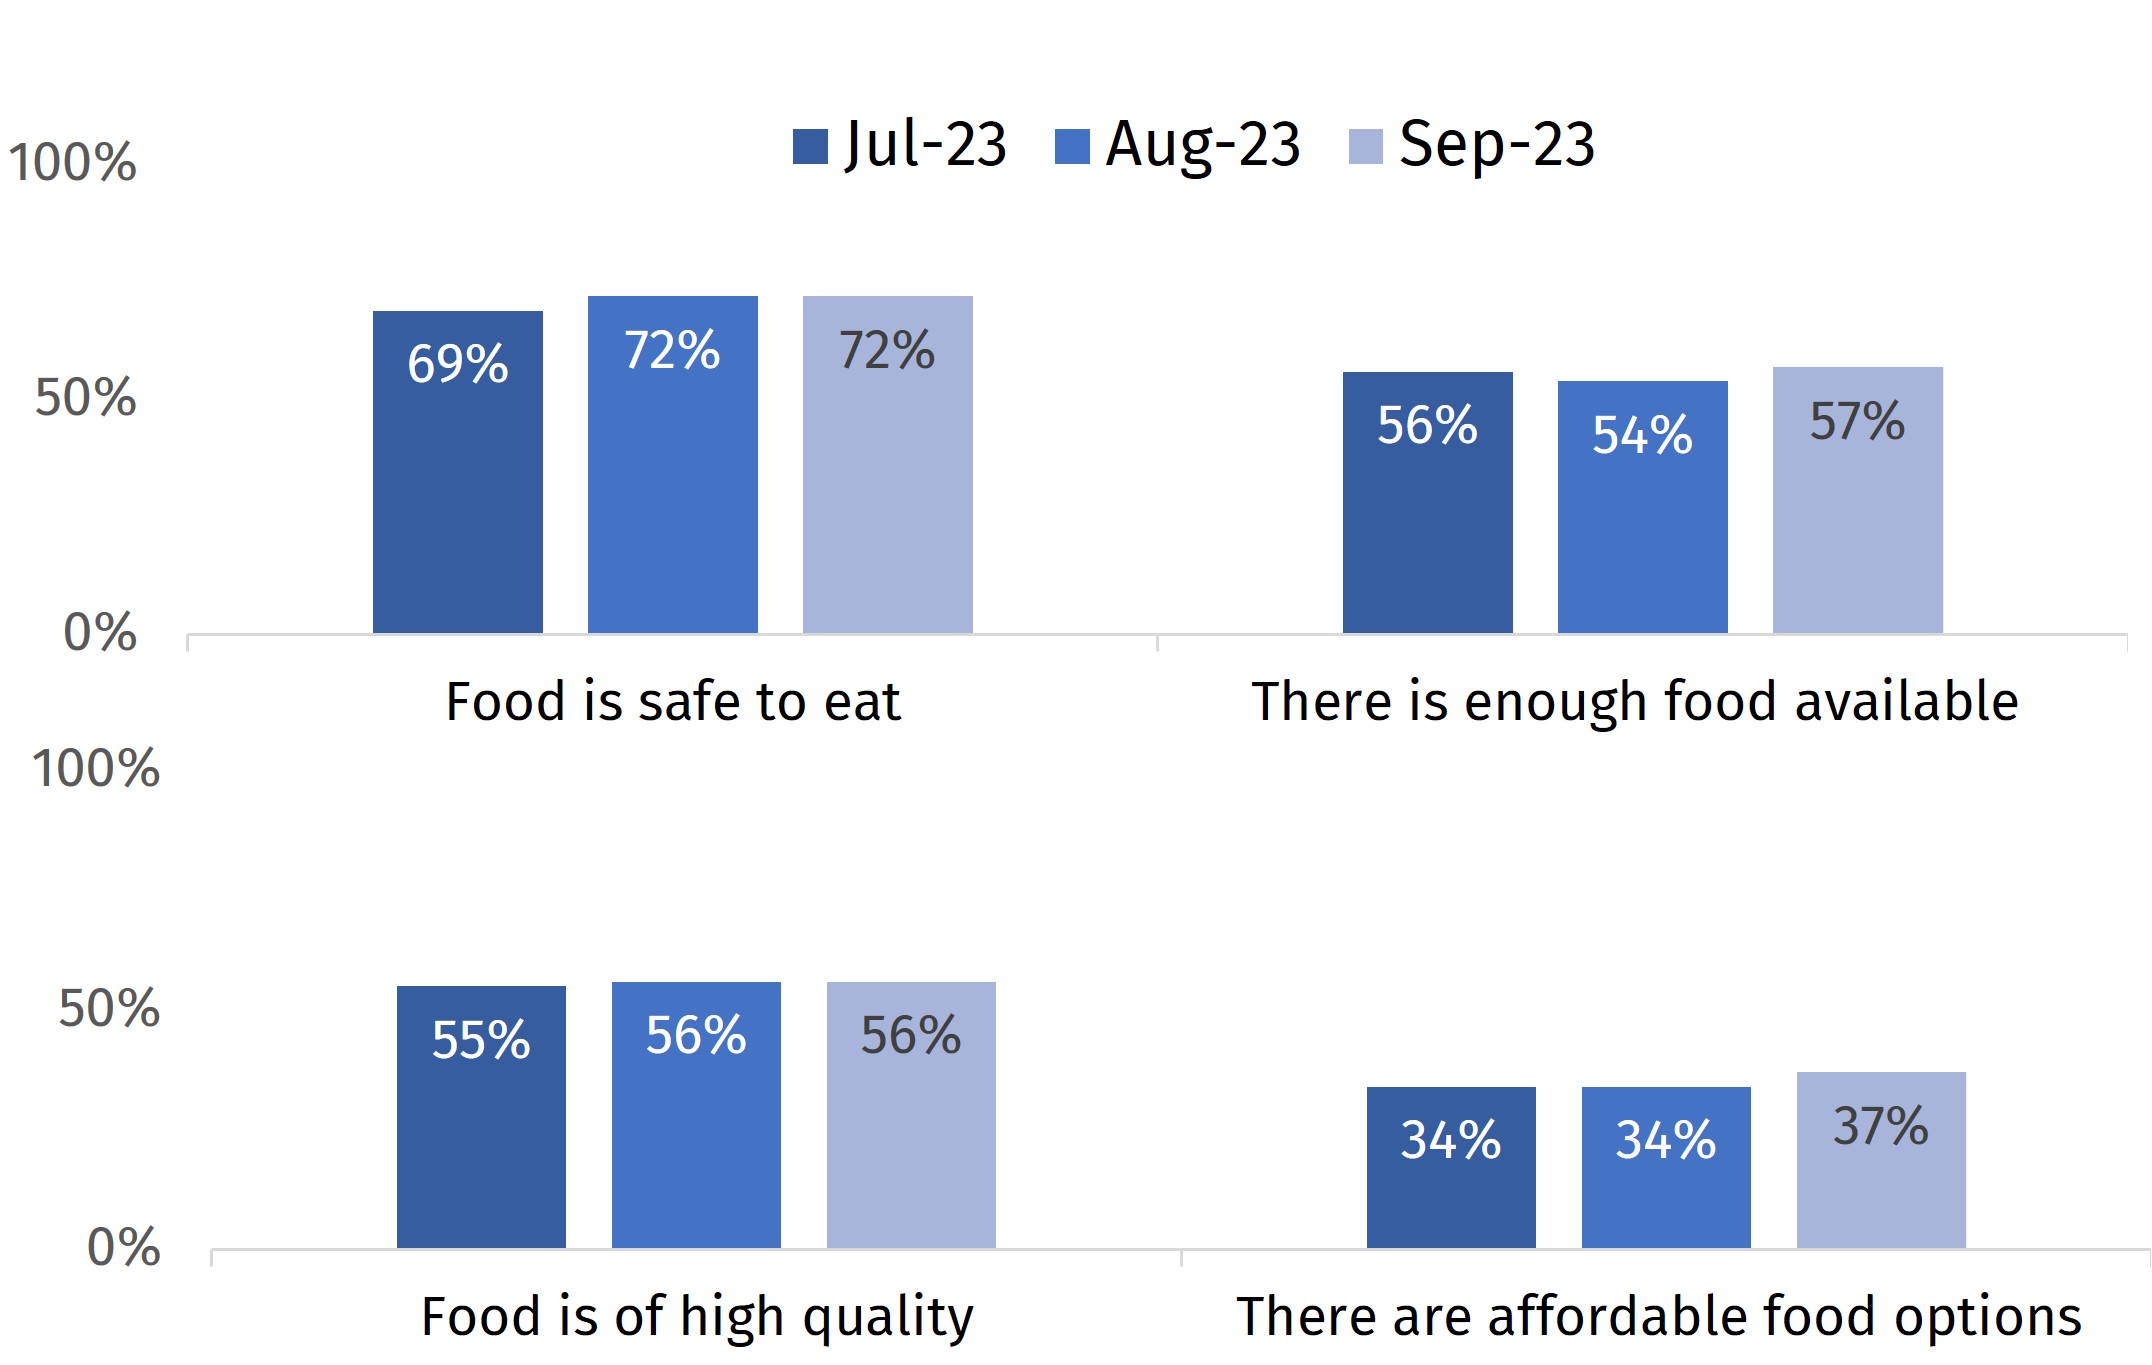
- 72% are confident that those involved in the food supply chain ensure food is safe to eat. Only 37% are confident that the food supply chain ensures that there are affordable food options for everyone.
Food affordability
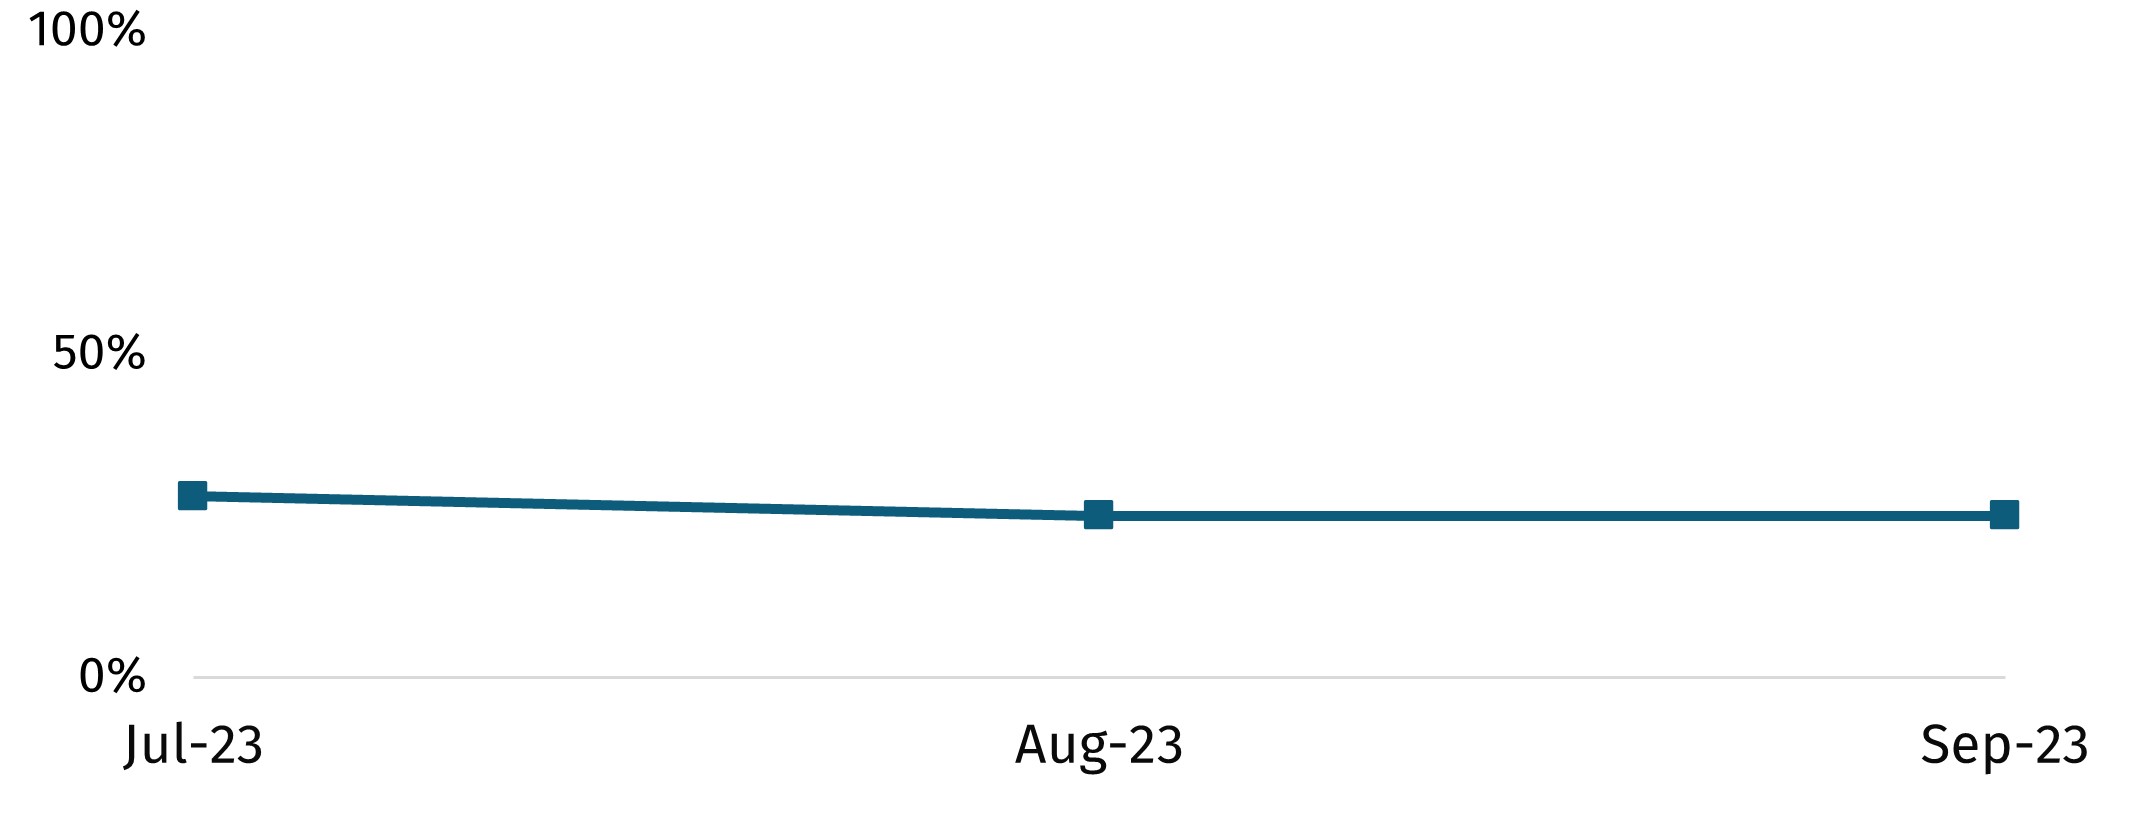
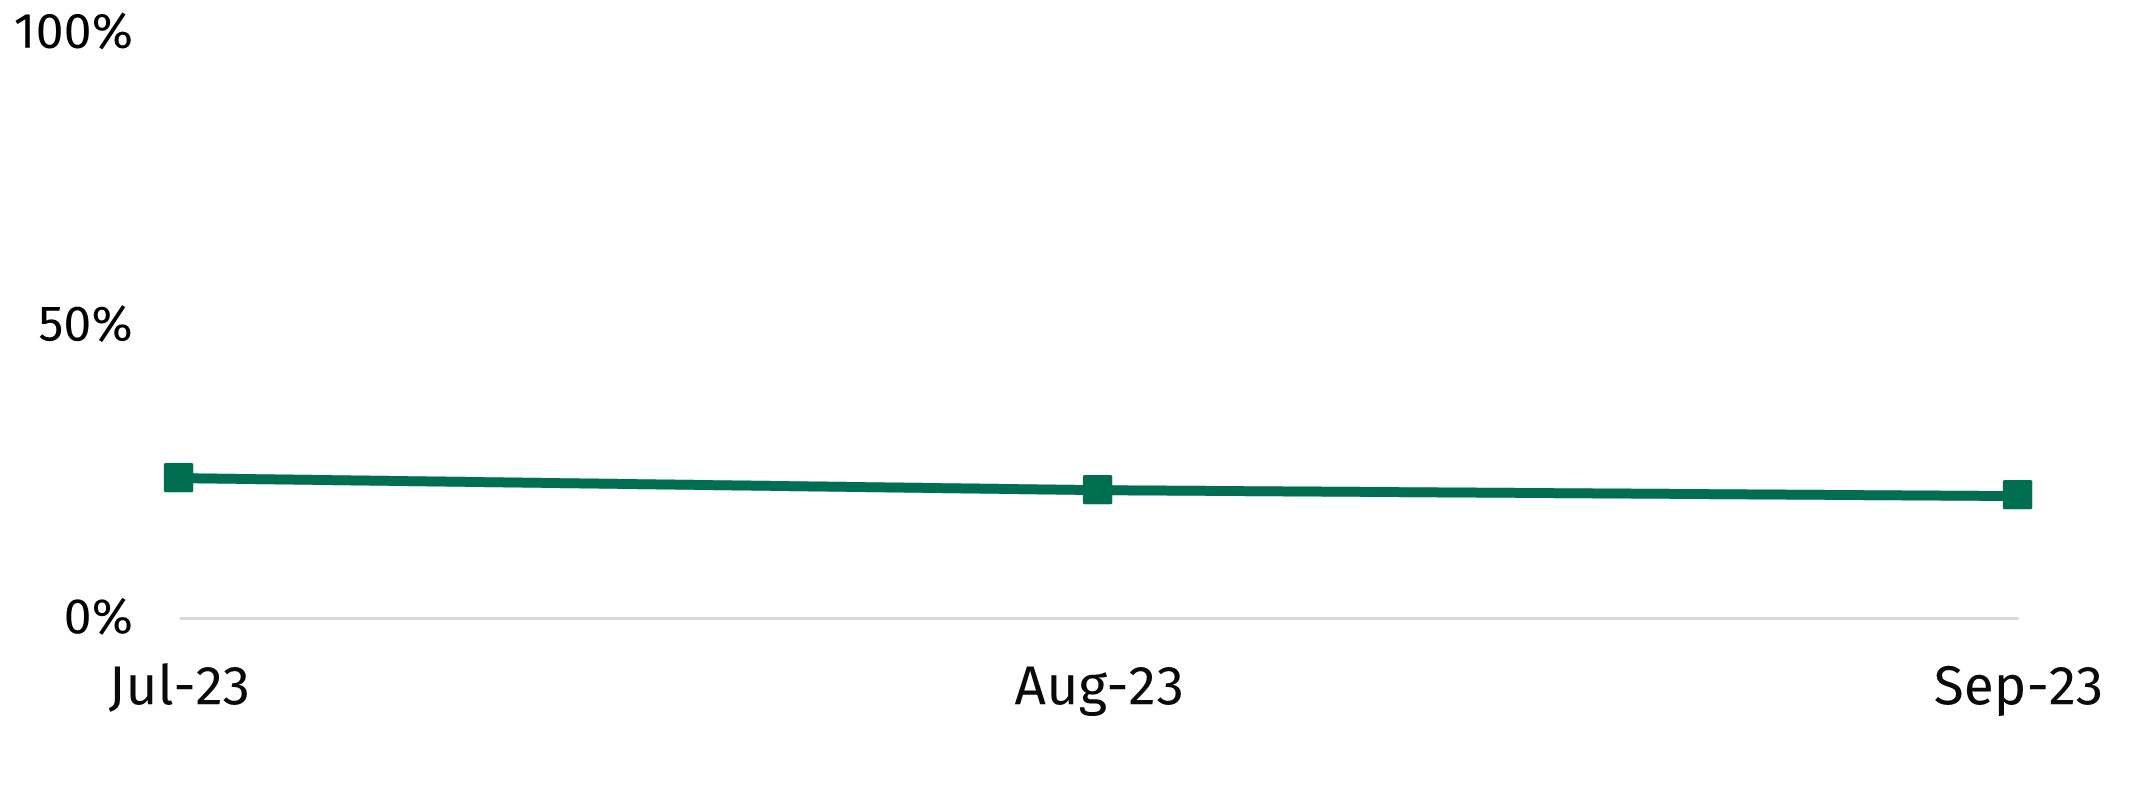
One in four (25%) are worried about their household not being able to afford food in the next month.
This is comparable to August, but statistically significantly lower than in July. More data is needed to confirm whether this is a downwards trend.
Proportion who reported worrying about their household not being able to afford food in the next month. (footnote 1)
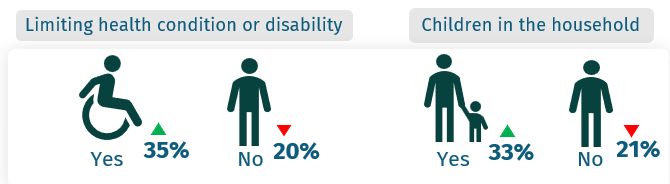
The following households are significantly more likely to be worried about their household affording food in the next month:
- participants with a limiting disability/health conditions
- households with children
- most deprived groups
Proportion who reported worrying about their household not being able to afford food in the next month by demographic group (footnote 2).
Limiting health condition or disability and children in the household:
Index of multiple deprivation (IMD):
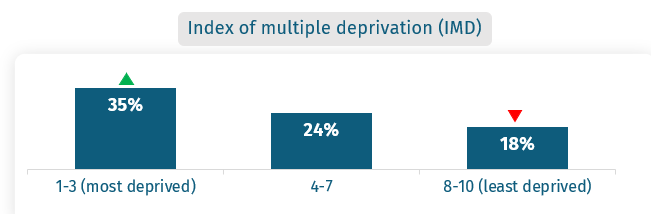
This is compared to 25% of all respondents who said they were worried their household will not be able to afford food in the next month.
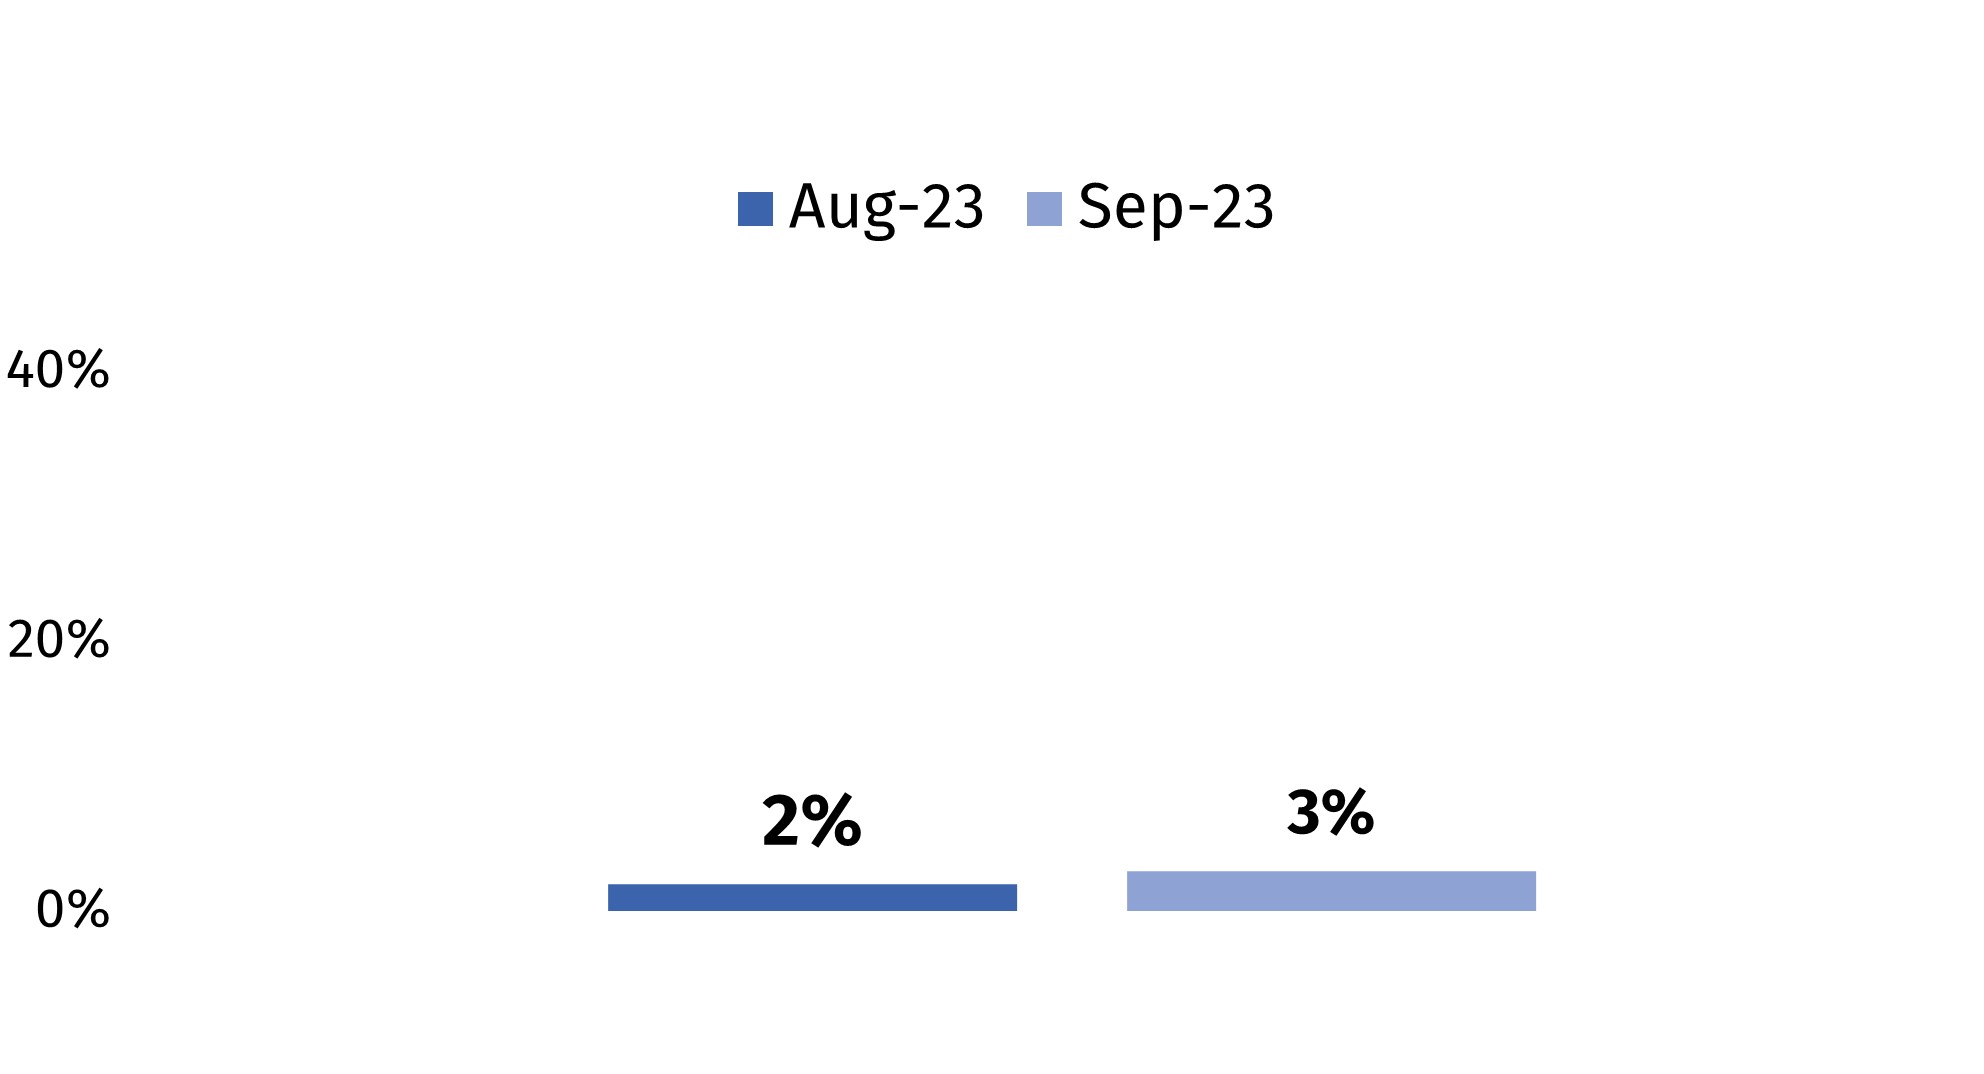
3% reported that they, or someone in their household, received a free parcel of food from a food bank or other emergency food provider in the last month.
This is in line with August.
Proportion who reported receiving a food parcel from a food bank or emergency food provider (footnote 3)
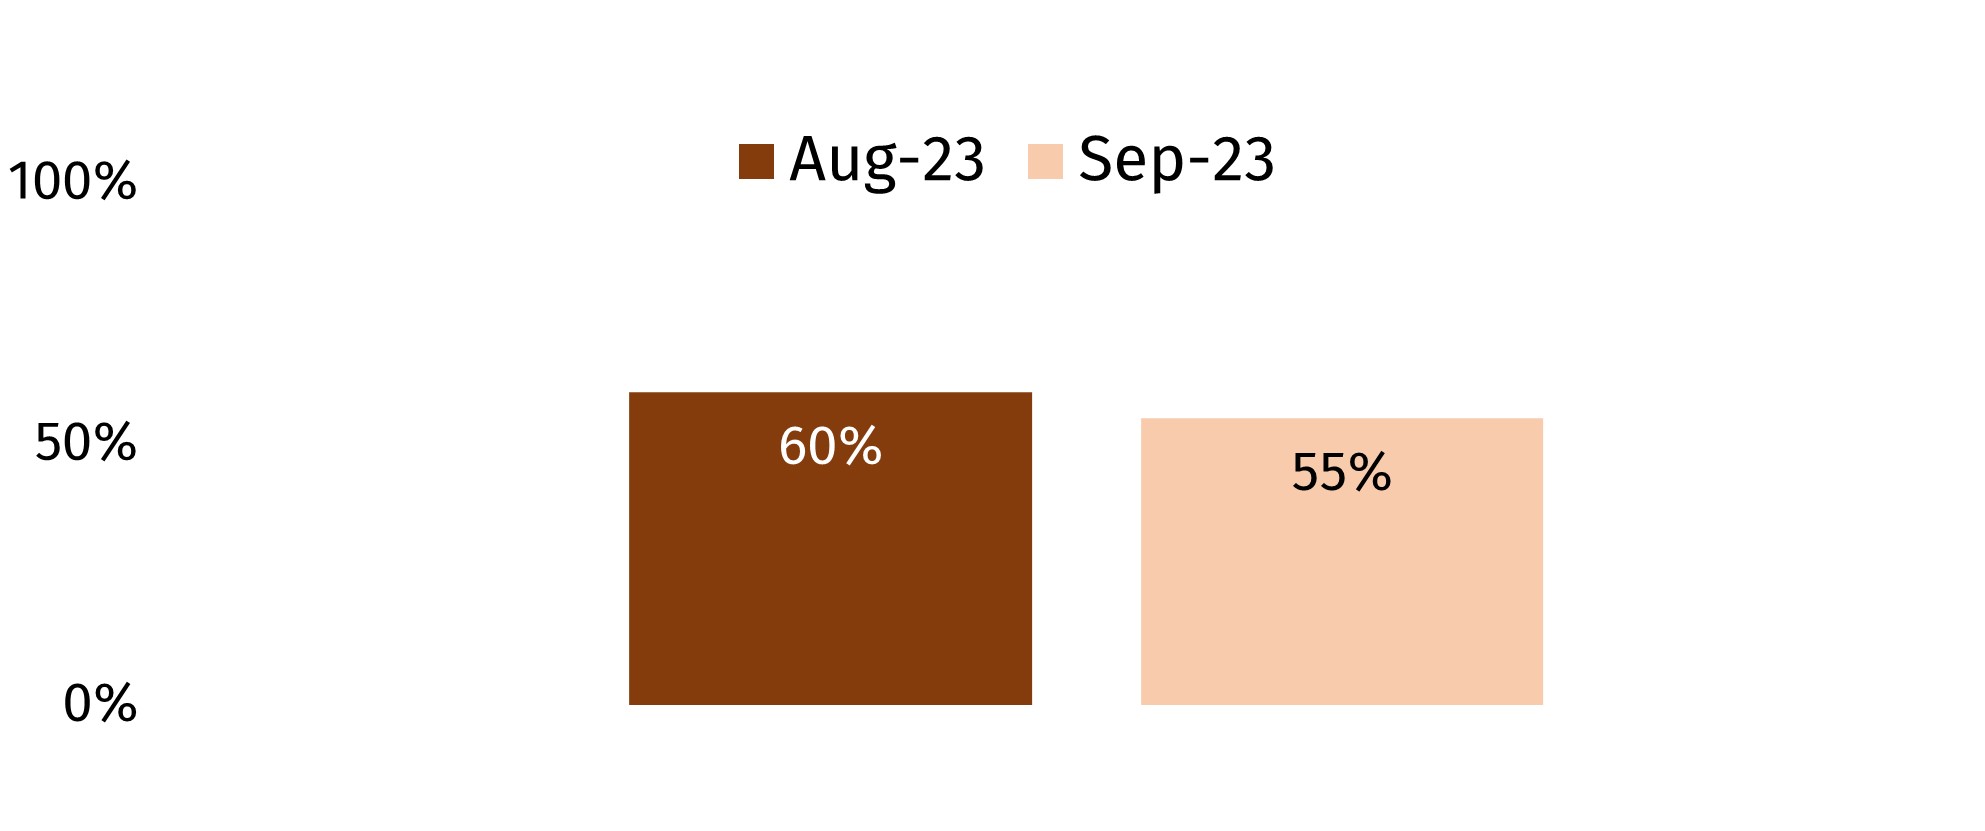
72% reported at least one of the following shopping, cooking or eating behaviours applied to them or their household.
This has risen from 60% last month, due to increases in the number choosing cheaper alternatives, buying discounted food close to its use-by-date and cooking from scratch.
Reported shopping behaviours (footnote 4)
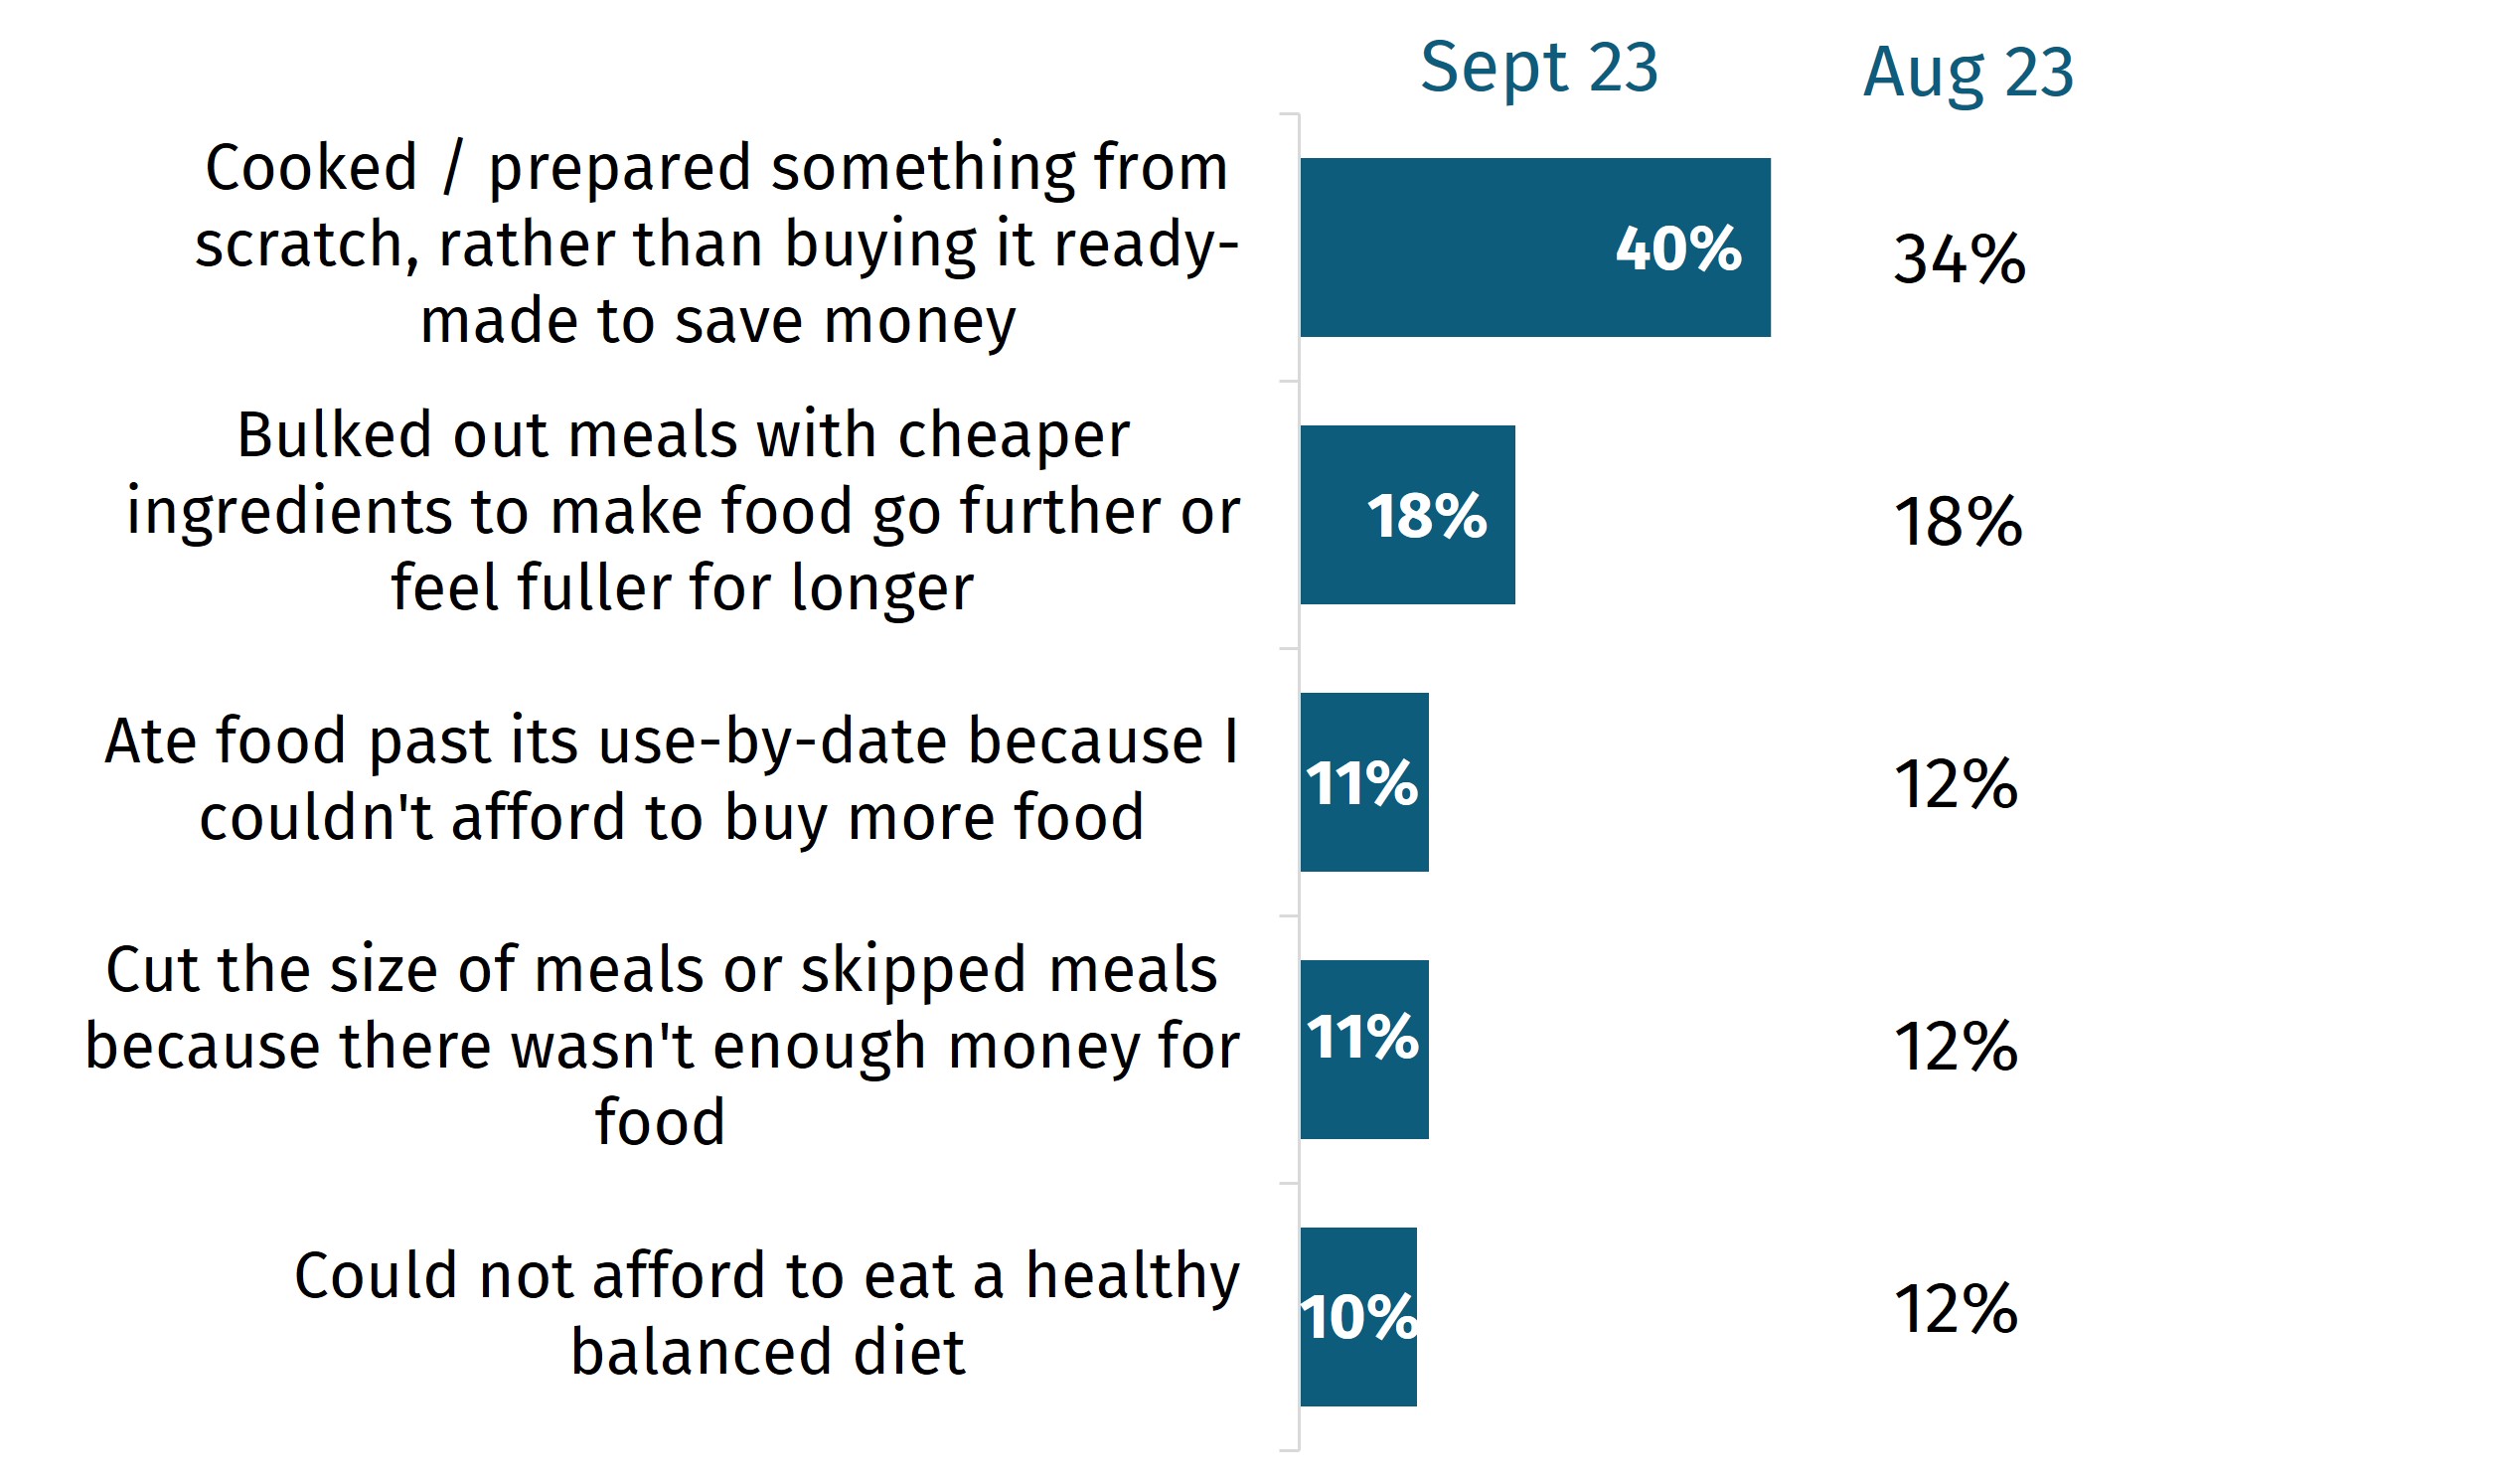
Reported cooking and eating behaviours
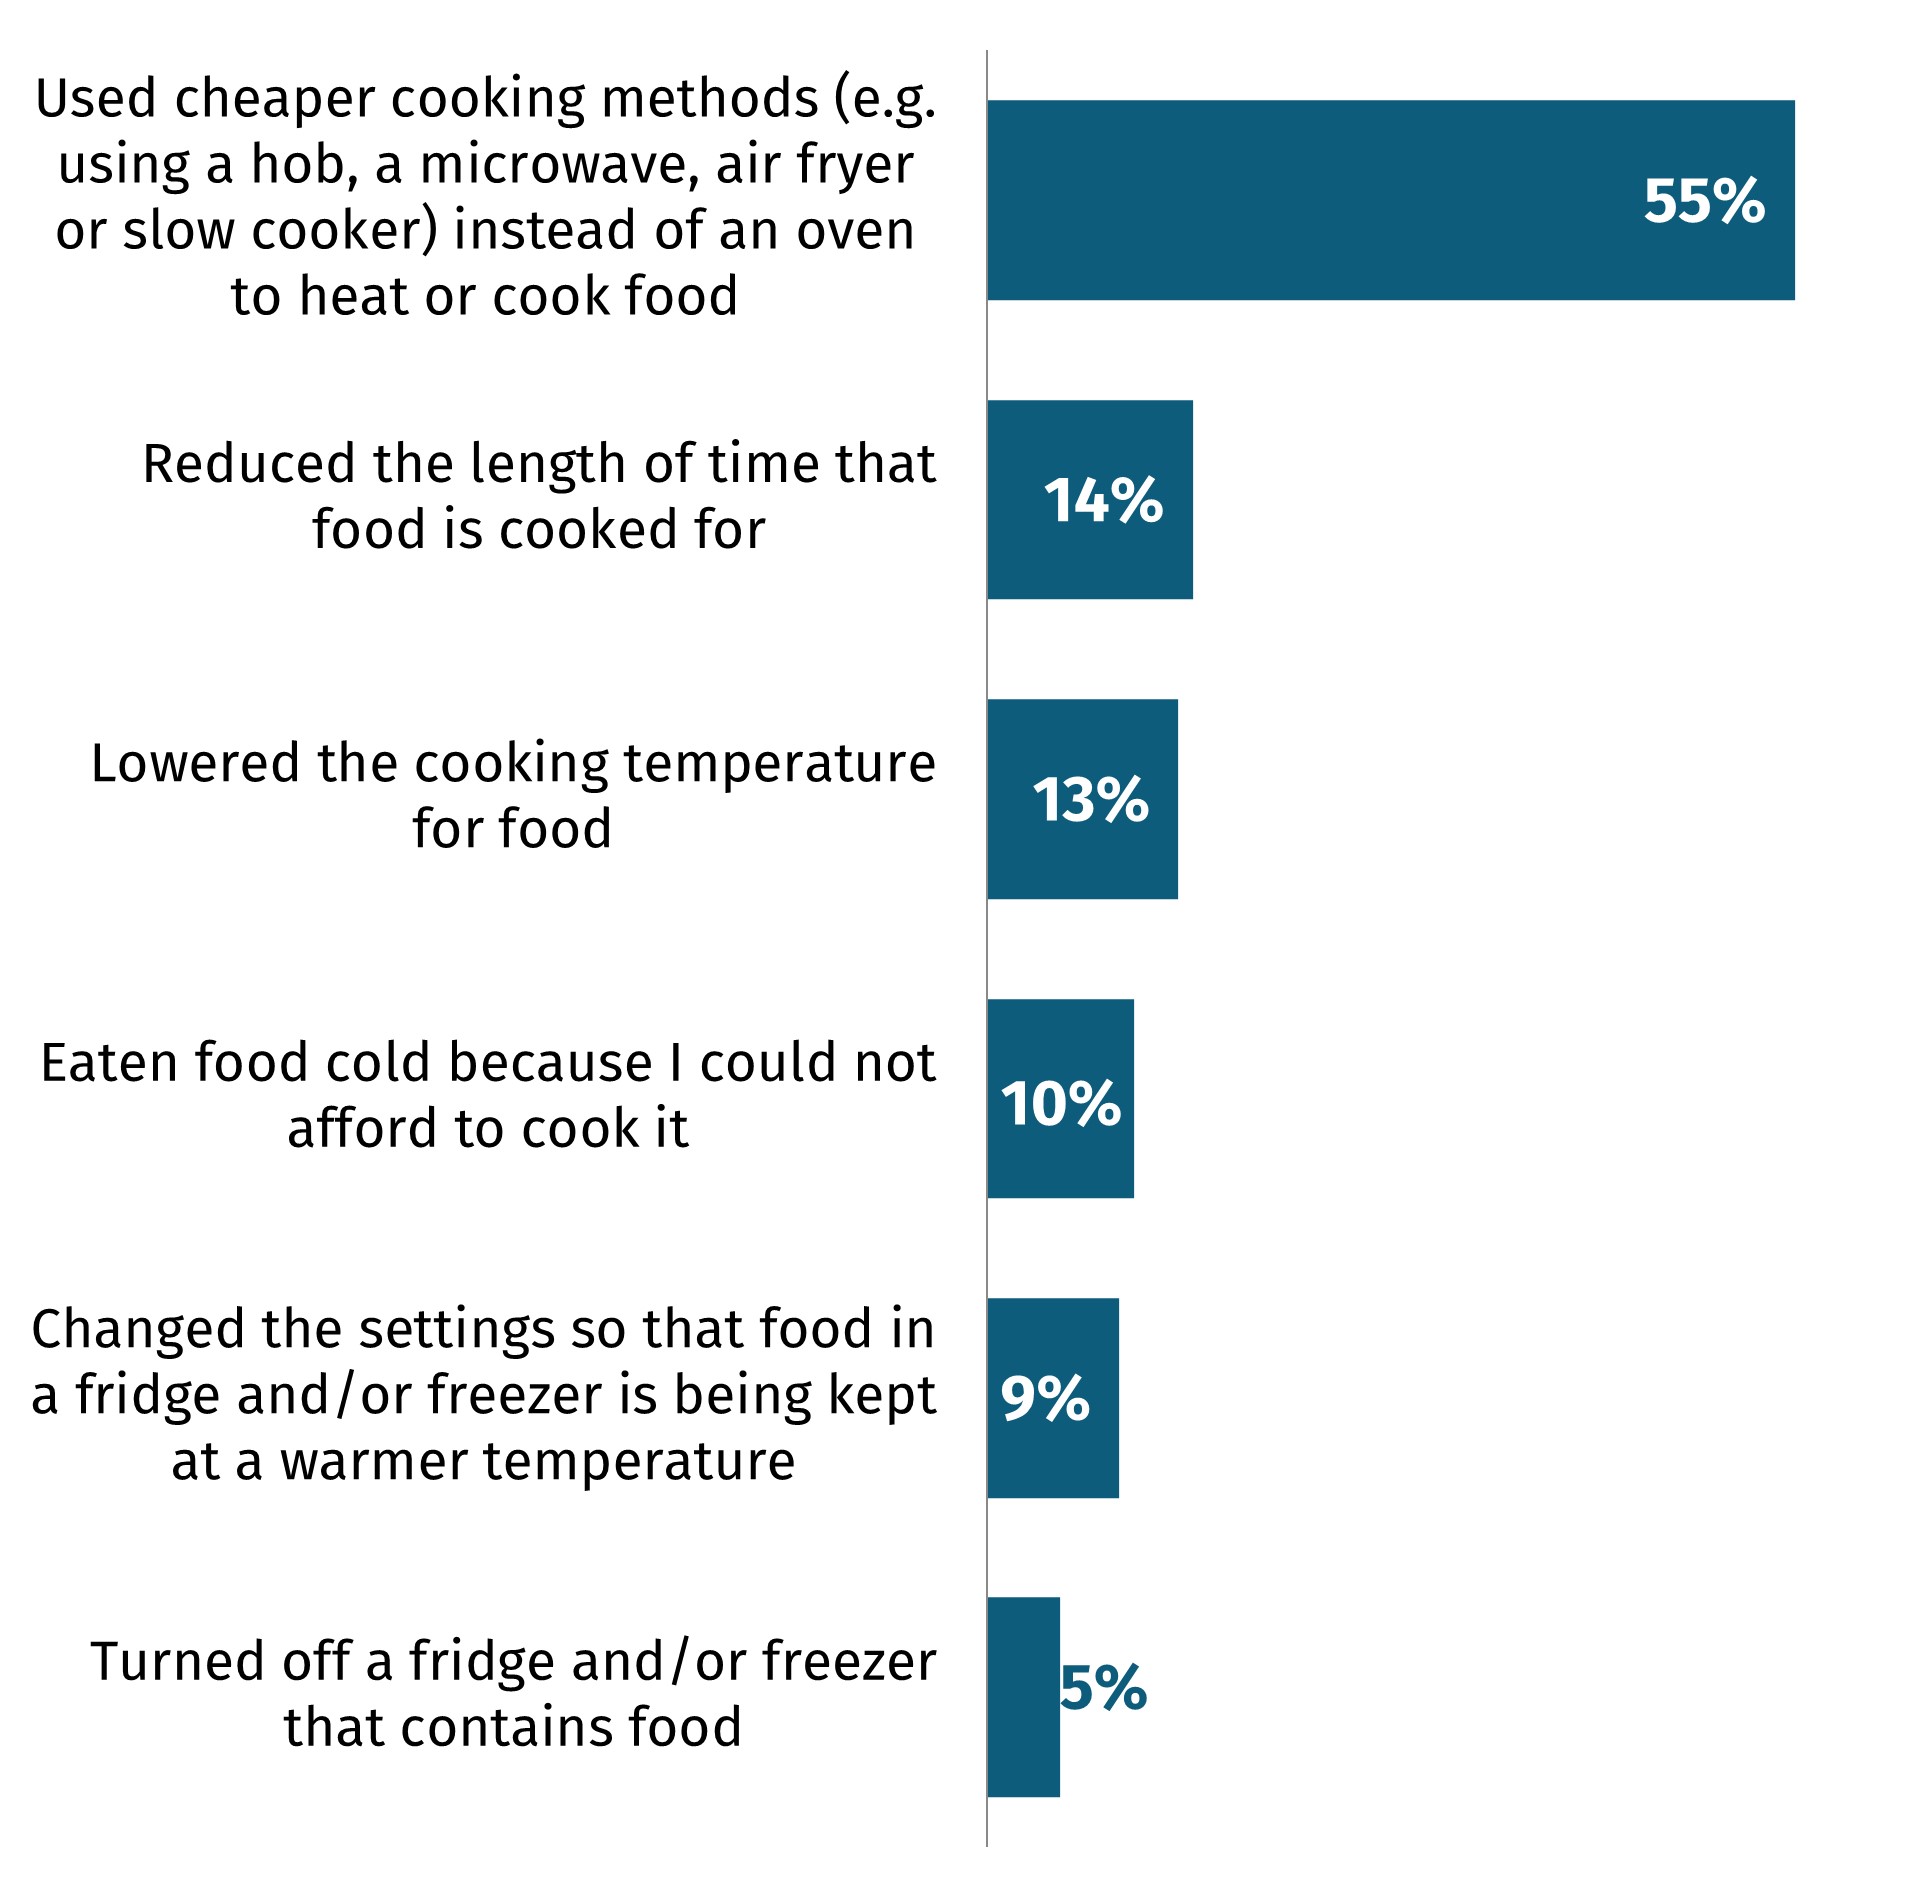
55% have used cheaper cooking methods instead of an oven to heat or cook food in the last month and 10% have eaten food cold because they couldn’t afford to cook it.
Proportion who did any of the following to reduce energy bills or save money in the last month (footnote 5)
Food availability
One in five (21%) are worried about there not being enough food available for their household in the next month
This is comparable to August, but statistically significantly lower than in July. More data is needed to confirm whether this is a downwards trend.
Proportion who reported worrying about there not being enough food available for their household in the next month (footnote 6)
Food concerns
90% are concerned about food prices, 76% are concerned about food poverty and food inequality
Proportion who reported concern about food by topic (footnote 7)
Food supply chain
72% are confident that those involved in the food supply chain in the UK ensure that food is safe to eat, whilst only 37% are confident that they ensure there are affordable options for everyone
Proportion who reported confidence in the food supply chain (footnote 8)
Proportion who reported confidence that those involved in the food supply chain ensure that... (footnote 9)
The FSA
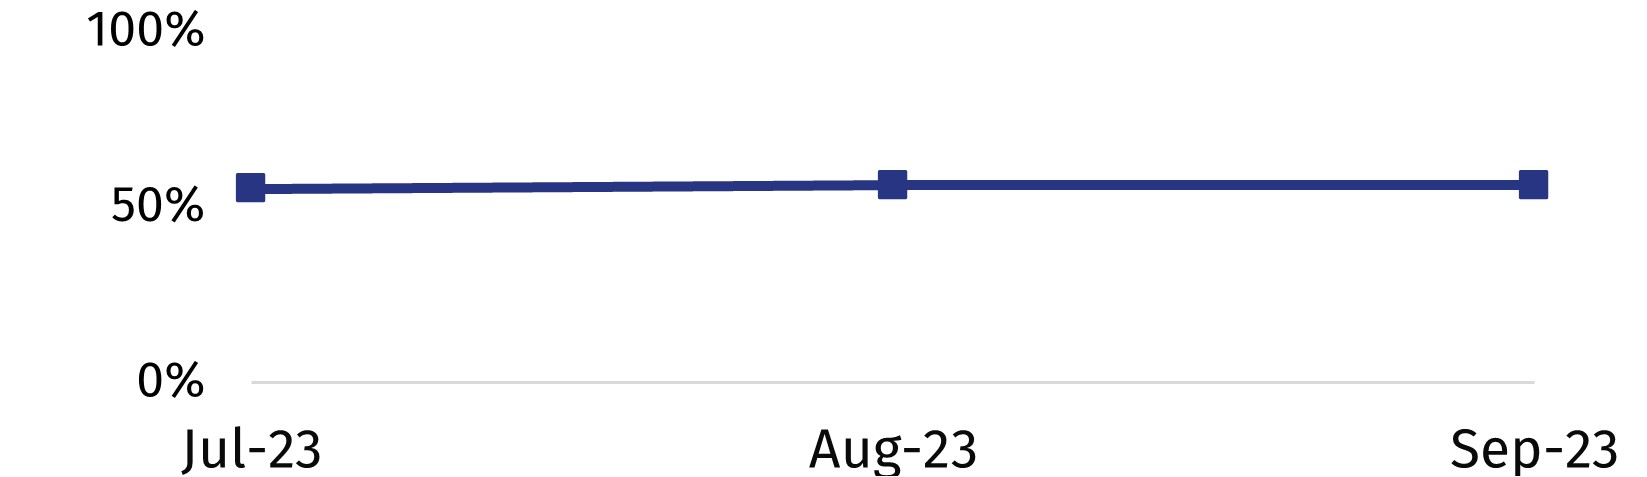
55% of those with some knowledge of the FSA trust the FSA to do its job
Although there has been a decline in trust in FSA between August and September, more data is needed to understand whether this is a downwards trend.
Proportion that trust the FSA to do its job (footnote 10)
Proportion who reported confidence that the FSA... (footnote 11)
Background and methodological information
Changes in approach
Following a review of the FSA's Consumer Insights Tracker by the FSA’s Advisory Committee for Social Science (ACSS), the project was recommissioned in early 2023.
In July 2023, the Consumer Insights Tracker was transitioned to a new supplier, YouGov. Changing supplier provided the opportunity to make the following methodological changes:
- review the questionnaire content and question wording
- expand the sample to include adults aged 16+ (previously 16-75)
- boost the sample to include a larger number of participants from Northern Ireland
- utilise a panel survey approach (previously an omnibus approach was used to collect the data)
Due to these methodological differences, data captured by YouGov (from July 2023 onwards) should not be directly compared to data captured by the previous supplier (April 2020 – June 2023).
Method
- this research was conducted online using the YouGov panel which gives access to 400,000 active panellists in the UK.
- this report presents findings from September 2023. Where appropriate comparisons are made to the July 2023 and/or August 2023 survey.
- 2,057 adults across England, Wales and Northern Ireland took part in the September survey between 7th-11th September 2023.
- quotas were set by age, gender, education and region. The data is also weighted to be representative of the population by these demographic variables.
Notes for interpretation
- figures may not add up to 100% on graphs due to rounding, or in some questions, respondents were able to select multiple answers.
- significance testing is applied to the data to compare and determine whether a difference is “real”, or if it has occurred by chance (because not everyone in the population has been surveyed).
- any differences between demographic groups and month to month which are reported (with arrows) are statistically significant at the 95% confidence level.
- if you require further information on the statistical significance testing carried out, please contact the social science team.
For more information:
-
visit our Consumer Insights Tracker webpage
- or please contact the FSA Social Science Team
-
Q3m. To what extent, if at all, are you worried you/your household will not be able to afford food in the next month? Base: All in September (n=2,057), August (n=2,044) and July (n=2,085) 2023.
-
Q3m. To what extent, if at all, are you worried you/your household will not be able to afford food in the next month?
Base: All in September 2023 (n=2,057)
Those with a limiting health problem or disability have said that 1) they have either a health problem or disability and 2) it limits their daily life either a lot or a little.
The Index of Multiple Deprivation (IMD) is a measure of deprivation calculated based off postcode, which takes into account income, employment, education, skills and training, health, crime, housing and the living environment of an area.
-
Q3. In the last month, have you or anyone else in your household received a free parcel of food from a food bank or other emergency food provider?
Base: All in September (n=2,057) and August (n=2,044) 2023.
-
Q6. In the last month, did any of the following apply to you, or someone else in your household? Please tick all that apply. I, or someone in my household... Base: All in September (n=2,057) and August (n=2,044) 2023. Please note: Total values do not add to 100% as participants could select multiple responses.
-
Q8m. In the last month, which, if any, of the following have you done to reduce your energy bills and save money? Base: All in September (n=2,057) and August (n=2,044) 2023.
-
Q2m. To what extent, if at all, are you worried about there not being enough food available for you/your household to buy in the next month? Base: All in September (n=2,057), August (n=2,044) and July (n=2,085) 2023.
-
Q12. Thinking about food in the UK in general. At the moment, how concerned, if at all, do you feel about each of the following topics? Base: All in September (n=2,057) and August (n=2,044) 2023.
-
Q13. How confident are you in the food supply chain? That is all the processes involved in bringing food to your table.
-
Q14. How confident are you that those involved in the food supply chain in the UK… Base: All in September (n=2,057), August (n=2,044) and July (n=2,085) 2023.
-
Q16. The Food Standards Agency is the Government Agency responsible for food safety in England, Wales and Northern Ireland. How much do you trust or distrust the Food Standards Agency to do its job? That is to make sure that food is safe and what it says it is. Base: Those who know a little / a lot about the Food Standards Agency in August (n=1,126) and September (n=1,161) 2023
-
Q15. The Food Standards Agency is the Government Agency responsible for food safety in England, Wales and Northern Ireland. How confident are you that the Food Standards Agency... Base: Those who know a little / a lot about the Food Standards Agency in August (n=1,126) and September (n=1,161) 2023
Hanes diwygio
Published: 2 Hydref 2023
Diweddarwyd ddiwethaf: 2 Hydref 2024