FSA 22-06-09 Household Food Insecurity
FSA 22-06-09 Household Food Insecurity: Annex B
Annex B to the FSA 22-06-09 Household Food Insecurity: main report sets out the socio-economic evidence, the potential impacts of this on food safety and the main areas for concern.
A full PDF version is available for download:
What is the food price commodity tracker dashboard?
This dashboard provides a snapshot of commodity price changes across the food system. The following categories of indicators, with direct and indirect impacts on food prices, are tracked and updated monthly relying on published data sources from the ONS, FAO and World Bank:
Exchange rate:
See Annex A for explanation on Exchange Rate Pass-Through.
The UK ‘effective’ exchange rate tells us how “strong” the pound sterling is compared to other competing currencies around the world.
If the pound strengthens and rises in value, then imports become relatively cheaper. If the pound falls, then imports become relatively more expensive which may lead to food becoming more expensive on shop shelves.
Global commodities:
World bank data is used to track the price changes of the following global commodities:
- Fertiliser
- Energy
- Wheat
- Rapeseed Oil
- Maize
- Sunflower Oil
Food Producer costs:
ONS data has been used to track how the price of producing certain food items has changed over time:
- Oils and Fats
- Grain and Starch
- Animal Feed
- Soft and bottled Drinks
- Dairy
- Meat
Consumer food prices:
The ONS publishes data on how the price of high-level food groups are changing over time. The groups included are listed below:
- All Food Items
- Oils and fats
- Milk, Cheese and Eggs
- Meat
- Fruit
- Bread & Cereals
- Vegetables
- Fish
- Sugary Items
How to read the food price commodity tracker dashboard
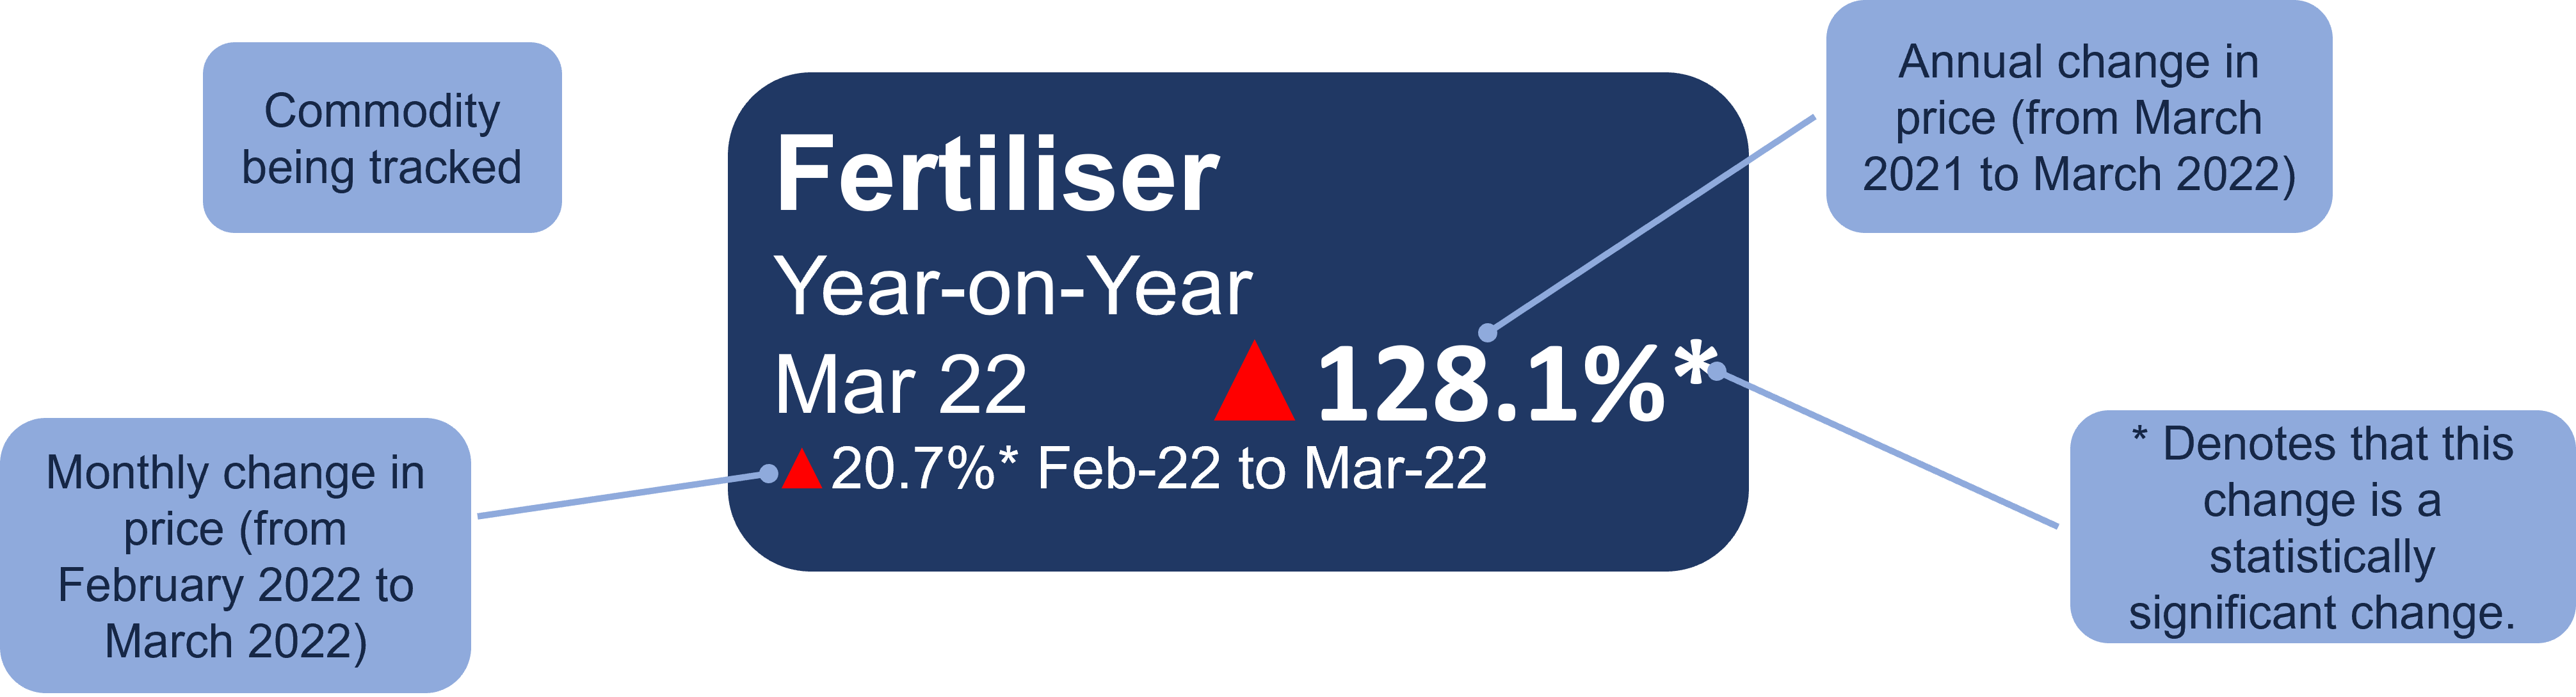
Commodity being tracked is listed first.
Second is the monthly change in price, in the example given this is February 2022 to March 2022.
Aligned to the left is the annual change in price from March 2021 to March 2022, in the example this 1128.1%. An asterisk next to this figure denotes that the change is significant.
Food Price Commodity Tracker Dashboard
Exchange rate
Monthly change: 0.4% February to March 2022
Annual change in price: 0.7%
Global commodities
| Commodity | Monthly change in price (February to March 2022) | Annual change in price | Significant change |
|---|---|---|---|
| Fertiliser | 20.7% | 128.1% | Yes |
| Energy | 24.1% | 101.6% | Yes |
| Wheat | 24.5% | 78% | No |
| Rapeseed oil | 24% | 63.6% | No |
| Sunflower oil | 57.5% | 46.6% | No |
| Maize | 14.7% | 36.9% | No |
Food producer costs
| Commodity | Monthly change in price (February to March 2022) | Annual change in price | Significant change |
|---|---|---|---|
| Oils and fats | 1.6% | 28.8% | No |
| Grain and starch | 0.9% | 10.7% | No |
| Animal feed | 1.1% | 9.4% | No |
| Soft and bottled drinks | 0.8% | 8.6% | Yes |
| Dairy | 0.9% | 7.2% | No |
| Meat | 0.4% | 6.3% | No |
Consumer food prices
| Commodity | Monthly change in price (February to March 2022) | Annual change in price | Significant change |
|---|---|---|---|
| Oils and fats | 7.2% | 18.1% | Yes |
| Milk, cheese and eggs | 0.7% | 8.6% | No |
| Meat | 0.4% | 5.6% | No |
| Fruit | 1.3% | 5.4% | No |
| Bread and cereals | 0.1% | 5.3% | No |
| Vegetables | 0.8% | 4.8% | No |
| Fish | 0.4% | 4.7% | No |
| Sugary items | 0.3% | 3.8% | No |
All food items, February to March 2022 0% and annual change in price 5.8%.
Commentary
Oils and fats
The cost of producing Oil and Fat products rose by 28.8% from March 2021 to March 2022. This is the largest annual increase from one March to the next since 2011.
Drivers
Ukraine and Russia are large exporters of cooking oils such as Sunflower Oil. The war between these countries has disrupted the supply chains of these products.
The Oils and Fats industry is particularly vulnerable to “shocks”. A shock, such as the Ukraine-Russian war, is likely to have a greater impact on the production of oils and fats than other sub-sectors of the food industry.
Impact
This increase in the cost of producing Oil and Fat products has been passed onto consumers.
The price of Oil and Fat products in UK shops rose by 18.1% from March 2021 to March 2022, which is the largest annual increase from one March to the next in the time period analysed (January 2000 to March 2022).
Cooking oils are UK consumer staples and are used to create other food products such as crisps, fish fingers and biscuits. Oils such as Palm Oil are also used in cosmetics and cleaning products.
Fertiliser
From February 2022 to March 2022, the global price of fertiliser rose by 20.7%. From March 2021 to March 2022, the global price of fertiliser rose by 128.1%. The latter is the largest annual increase from one March to the next in the time period analysed (Jan 2000 – March 2022).
Drivers
Ukraine is a large exporter of fertiliser and Russia is the world’s largest exporter of fertiliser. The war between these countries has disrupted the supply chains of these products.
In an attempt to control rising food prices in China, Beijing imposed greater controls on the export of phosphate (a major ingredient of commercial fertiliser) in October 2021. This reduces global supply, increasing prices for firms outside of China. This ban is expected to last until June 2022 at least.
Impact
Fertiliser is a major input into the production of food. It increases farming yield as it ensures the nutrients in farming soil are not depleted.
More expensive, limited supplies of fertiliser makes food production more expensive. This higher cost of producing food may result in food price increases for consumers.
Consumer price in food
The price of food on supermarket shelves rose by 5.8% from March 2021 to March 2022. This is the largest annual increase from one March to the next since 2009. It rose by 0.0% between February 2022 and March 2022.
Drivers
A combination of factors are driving the recent rise in the cost of food for UK consumers.
These factors include the rising cost of agricultural inputs (Energy, Fertiliser, Oils and Fats) and a reduction in the supply of labour in the agri-food sector (as a knock-on effect of EU Exit and the Pandemic).
The 0.0% price change from February to March 2022 echoes a similar trend seen in the % change between February and March in other years.
Impact
The affordability of food is a key component of household food insecurity. In January 2022, 15% of respondents across England, Wales and Northern Ireland were food insecure when surveyed by the FSA.
The fact that the 0.0% February 2022 to March 2022 price change echoes other years, suggests that this is not evidence of the cost of food crises “cooling off”.
One in seven people lives in household food insecurity
“Food security exists when all people, at all times, have physical and economic access to sufficient, safe and nutritious food that meets their dietary needs and food preferences for an active and healthy life.” World Food Summit, 1996.
The potential food health risks of inequality:
- listeria
- reduced choice/higher prices for people with hypersensitivities
- reduced visibility of food safety ratings out of home
- obesity and malnutrition
- poor mental health
- risky food safety behaviours
Our tracking survey shows that almost one in four consumers (22%) now report skipping a meal, or cutting down the size of meals, because they did not have enough money to buy food – this has risen steadily since June 2021. 15% of respondents reported using a food charity or food bank in March 2022; a proportion that has significantly increased since the year before (9% in March 2021).
Our Consumer Interest in Food report indicates that the cost of food is now the top concern for consumers. The latest wave of Food and You 2 shows that 42% of people are concerned about food prices. 15% - or roughly one in seven - people live in household food insecurity. This is around one in six in Wales (18%) and Northern Ireland (16%) and one in five in the North West of England (20% of households). Our data shows that household food insecurity is particularly acute among younger adults, low-income families, and people who are unemployed. Our analysis also suggests that lower middle-income households are also at risk of food insecurity if there are any further economic shocks. People with low food security are making different and difficult choices. Those who are food insecure report different behaviours, such as eating less than they should (31%), cutting the size of their meal or skipping meals (30%), being hungry (20%) and losing weight (12%). Food insecure households are more likely to buy food close to its use-by date and eat food past its use-by date, than food secure households (Food and You 2, Wave 3). They are more likely to have reduced choices, (for example ‘free from foods’ are often more expensive) when managing hypersensitivities.
Base: COVID-19 Consumer tracker April 2020-October 2021, Consumer insights tracking survey November 2021 - March 2022 Online, England, Wales and NI, adults 16-75
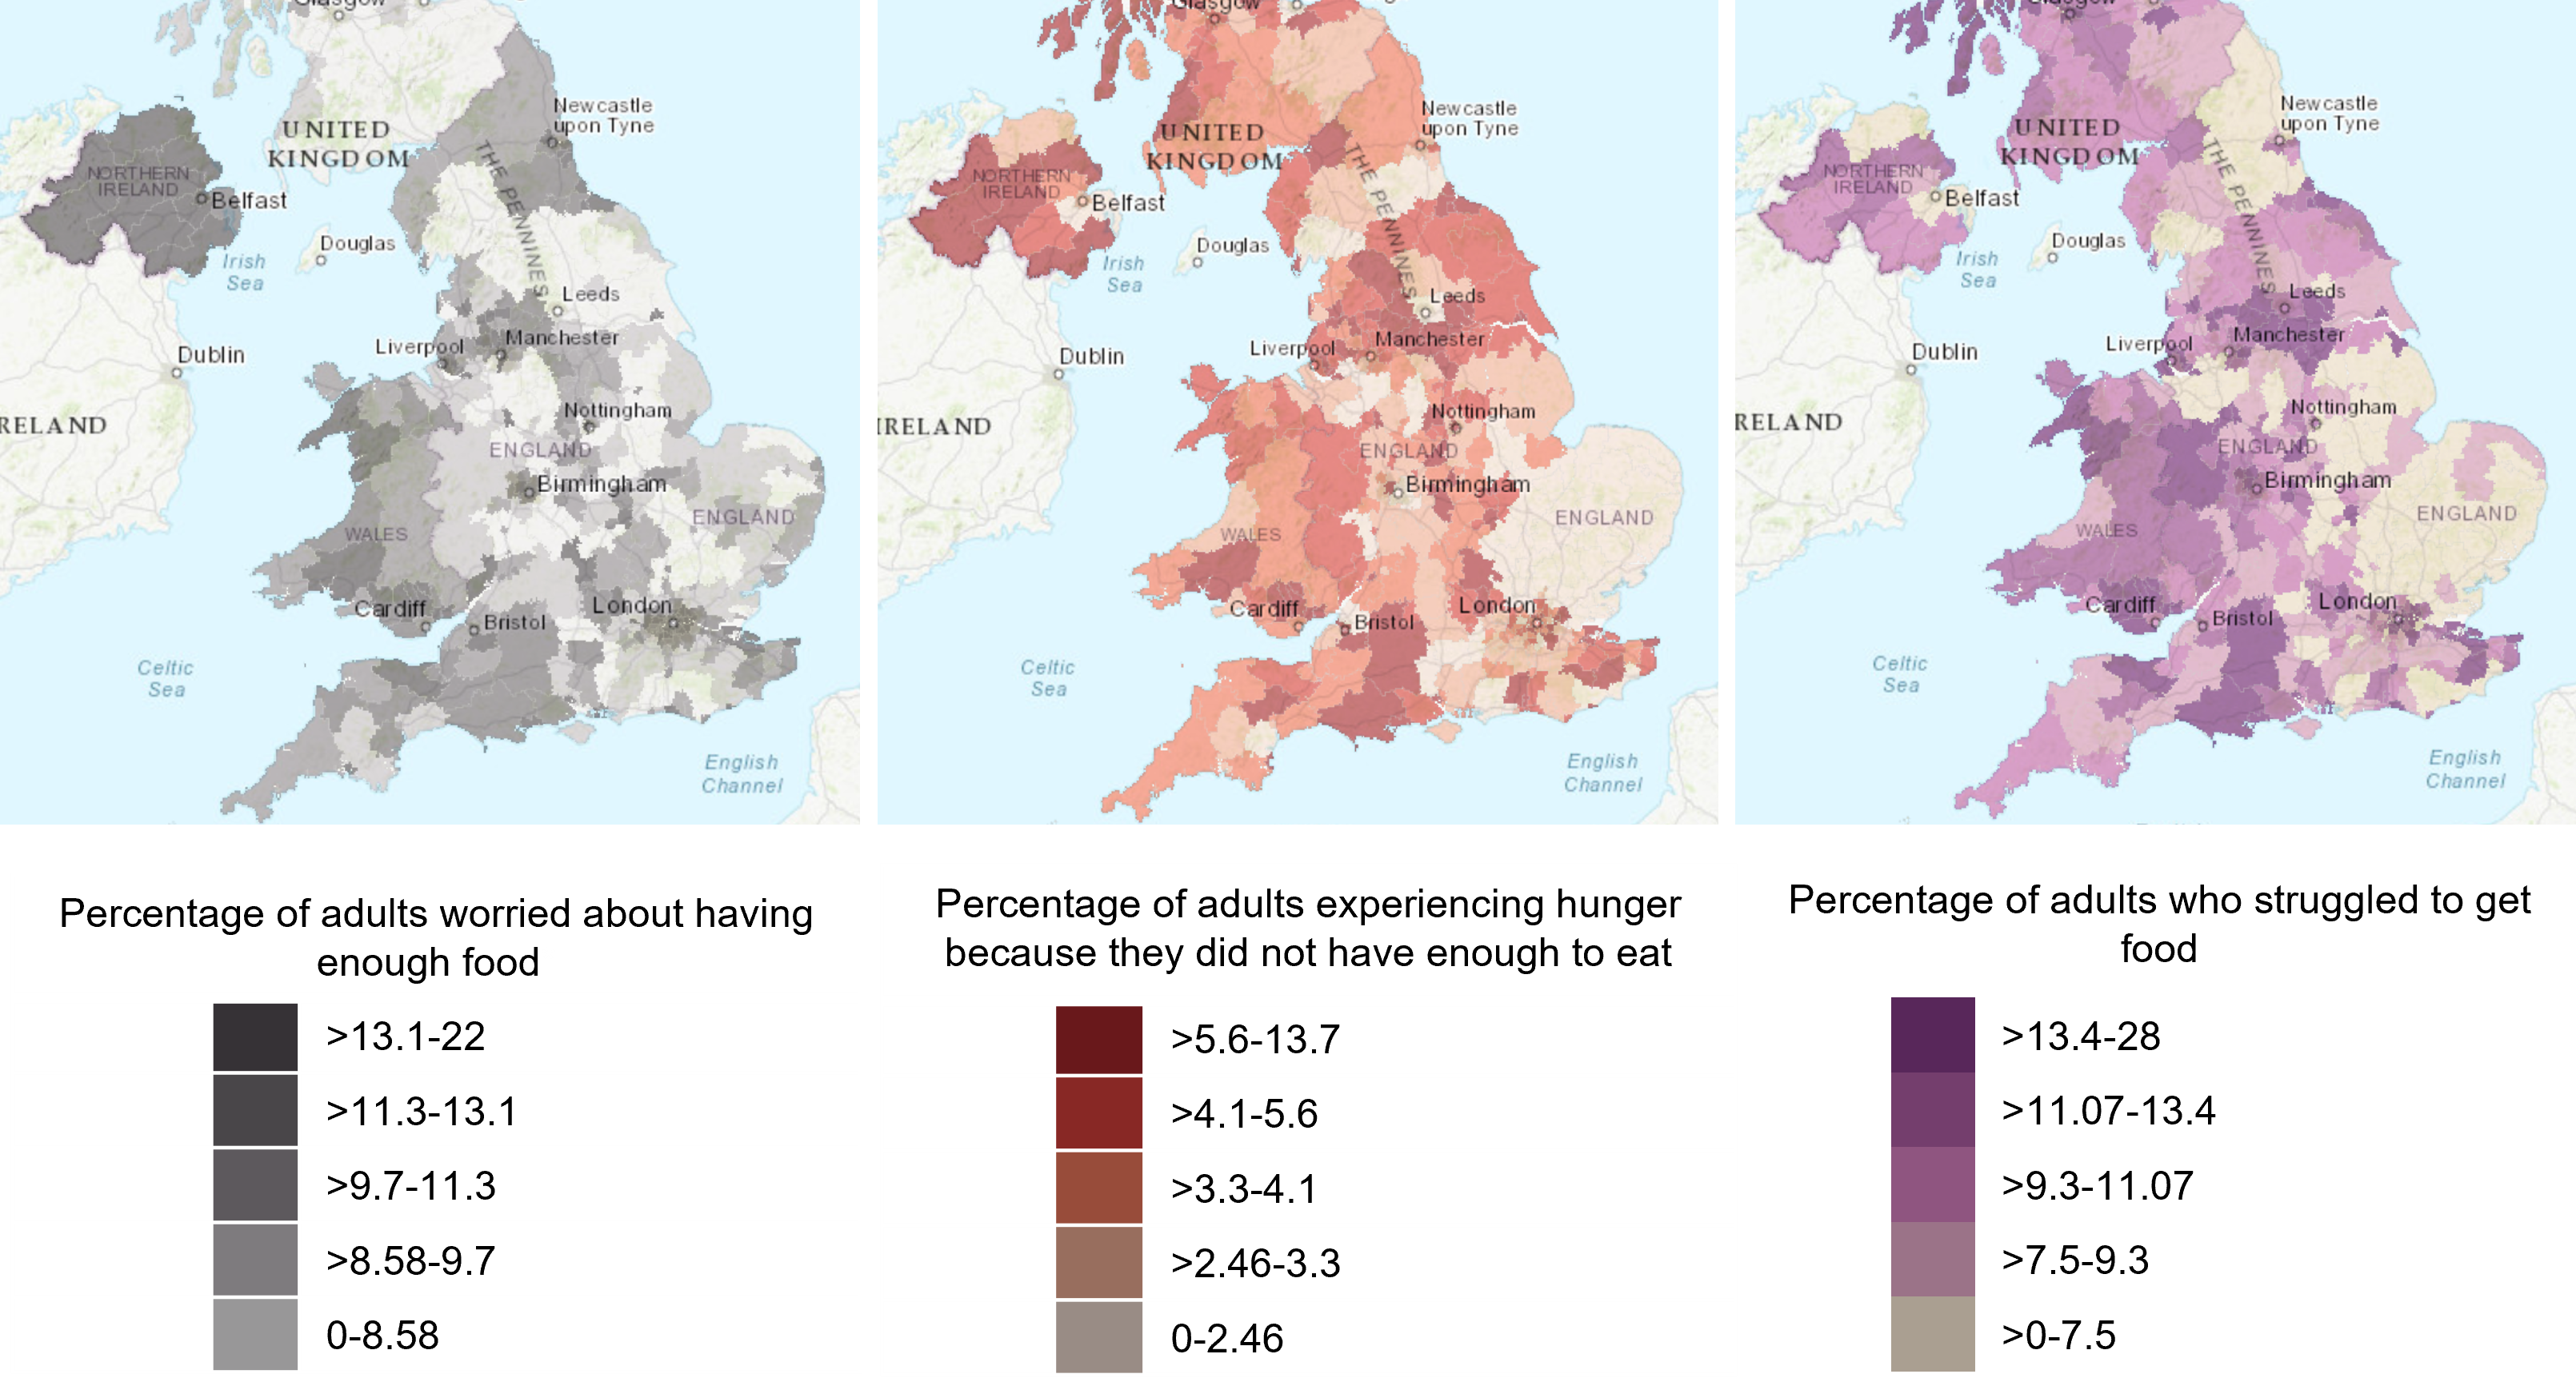
Public Wider interest in food
Estimates of the percentage of adults who worried about having enough food, experienced hunger or struggled to get food at a local authority level
March 2022: Almost 1 in 3 people are worried about being able to afford food
Question: To what extent, if at all, are you worried that you/your households will not be able to afford food in the next month?
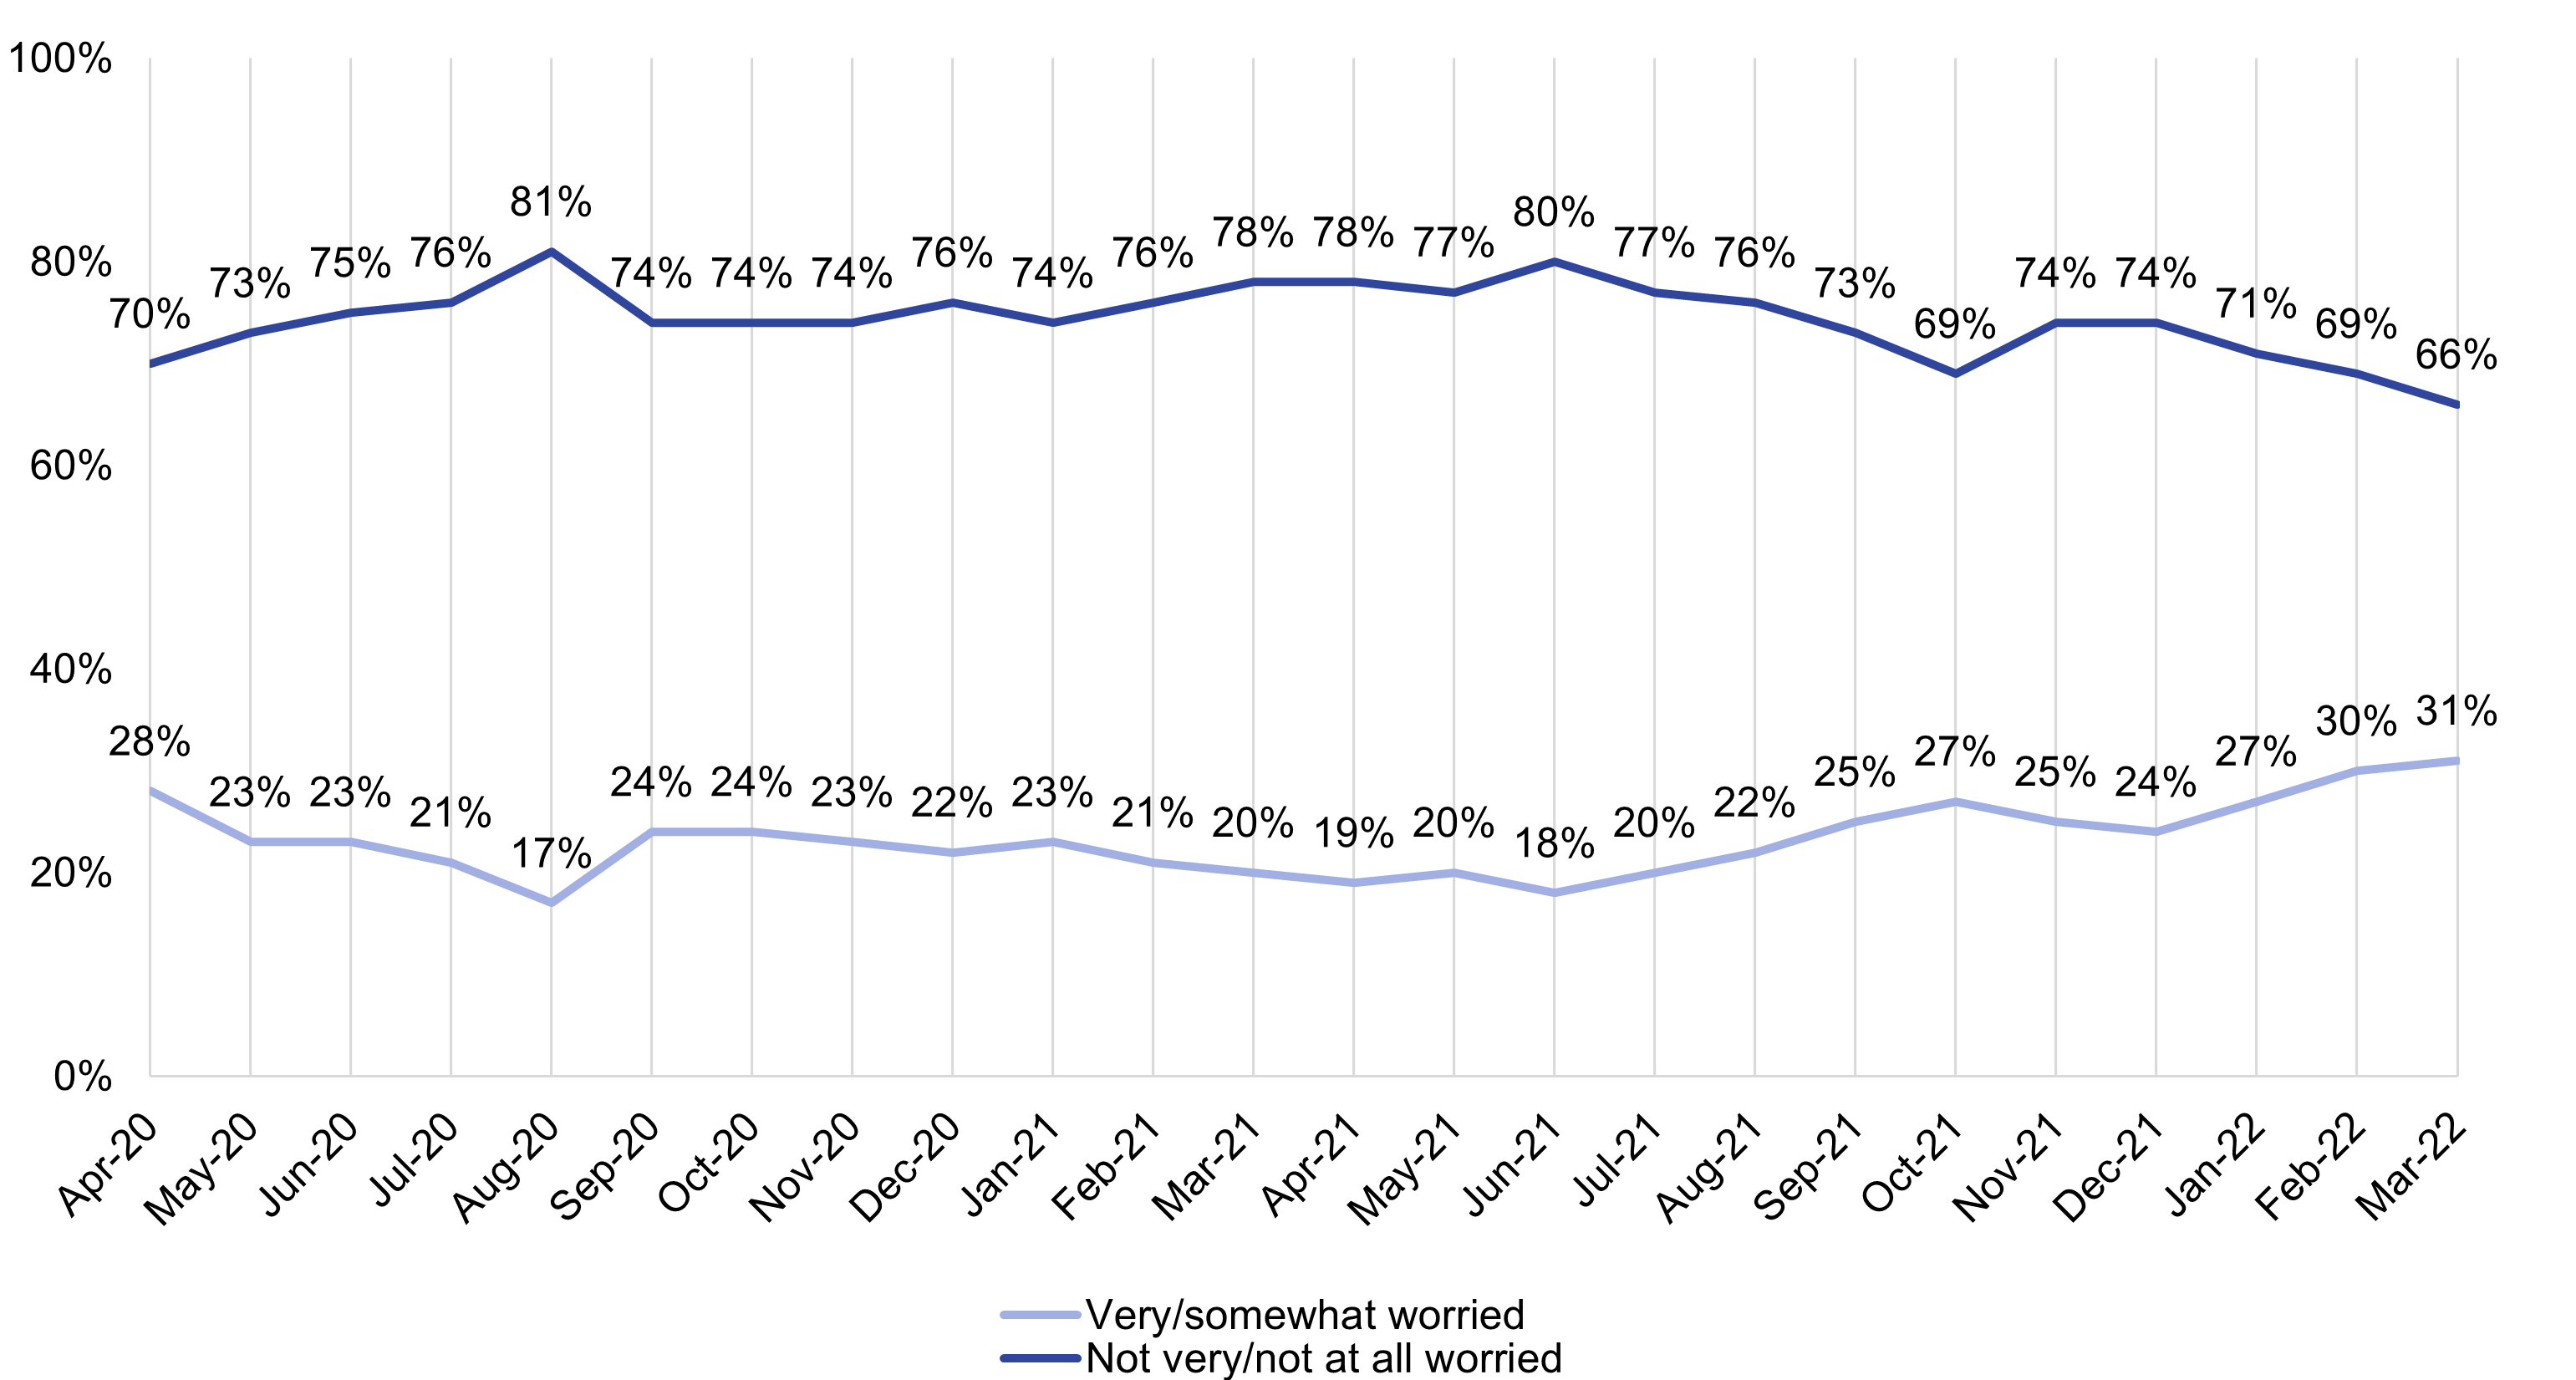
Base: COVID-19 Consumer tracker April 2020-October 2021, Consumer insights tracking survey November 2021 - March 2022. Base size: approximately 2,000 per wave. Online, England, Wales and NI, adults 16-75. Values may not add to 100% as ‘don’t know’ and ‘prefer not to answer’ responses are not shown.
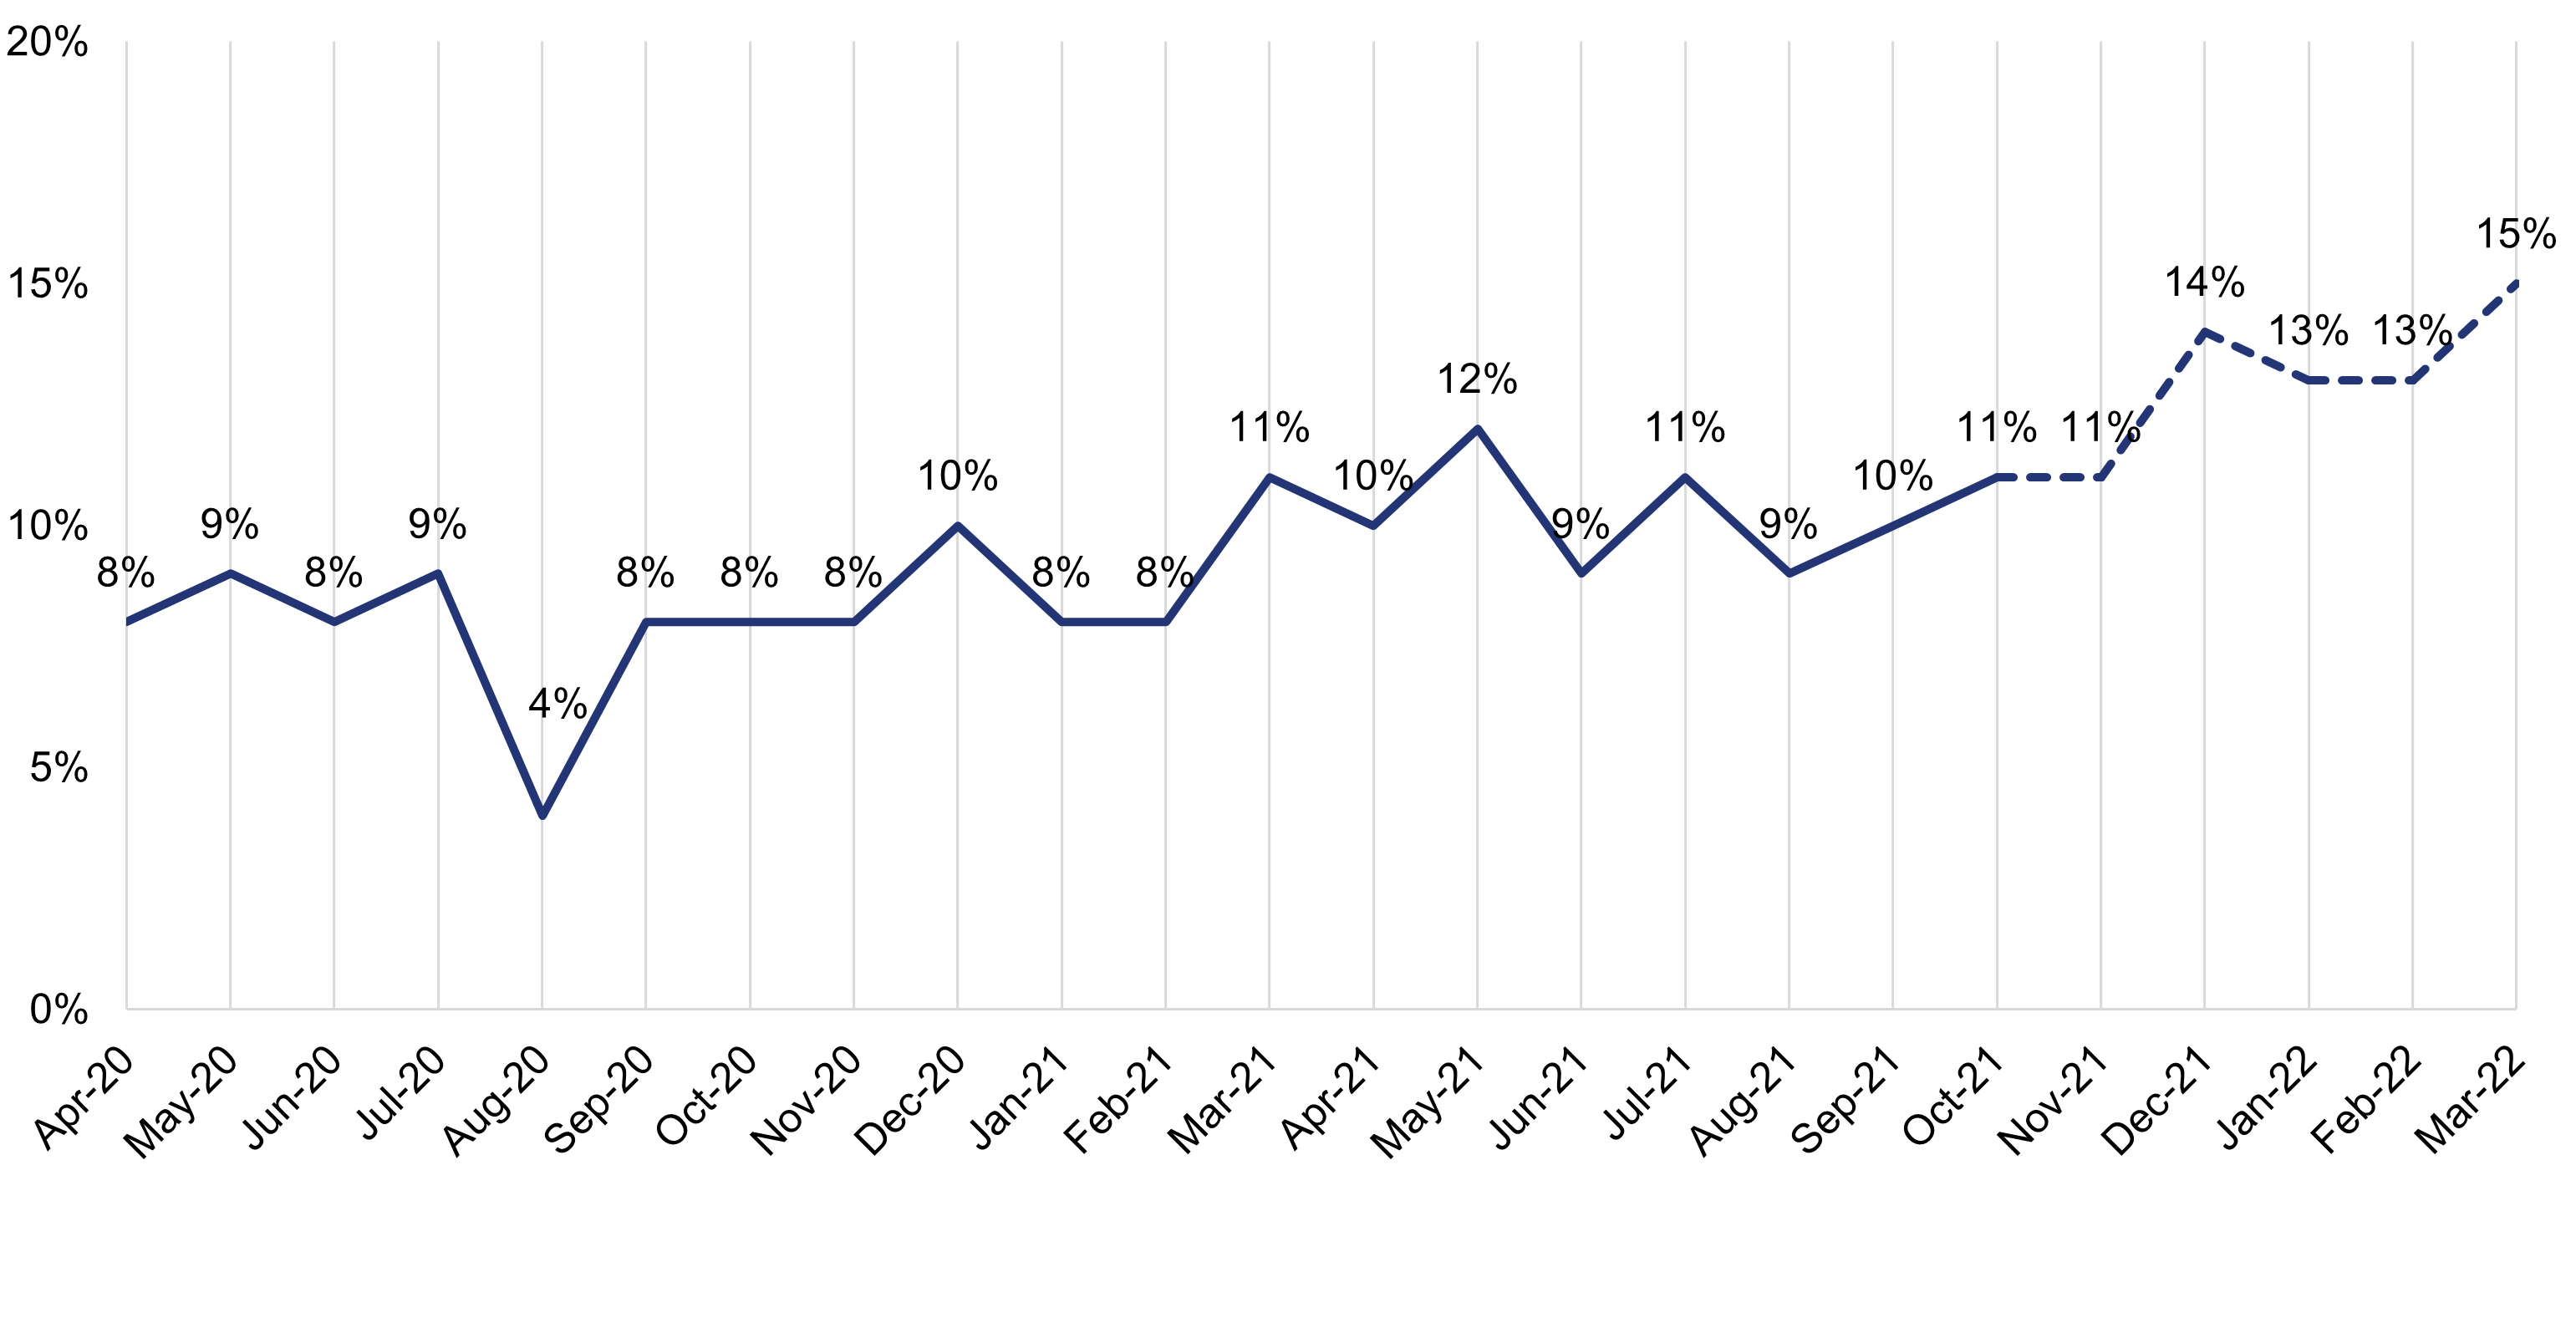
March 2022: Over 1 in 5 people cut meal size or skipped meals
In the last month have you cut down the size of your meals or skipped meals for any of these reasons? You did not have enough money to buy food.
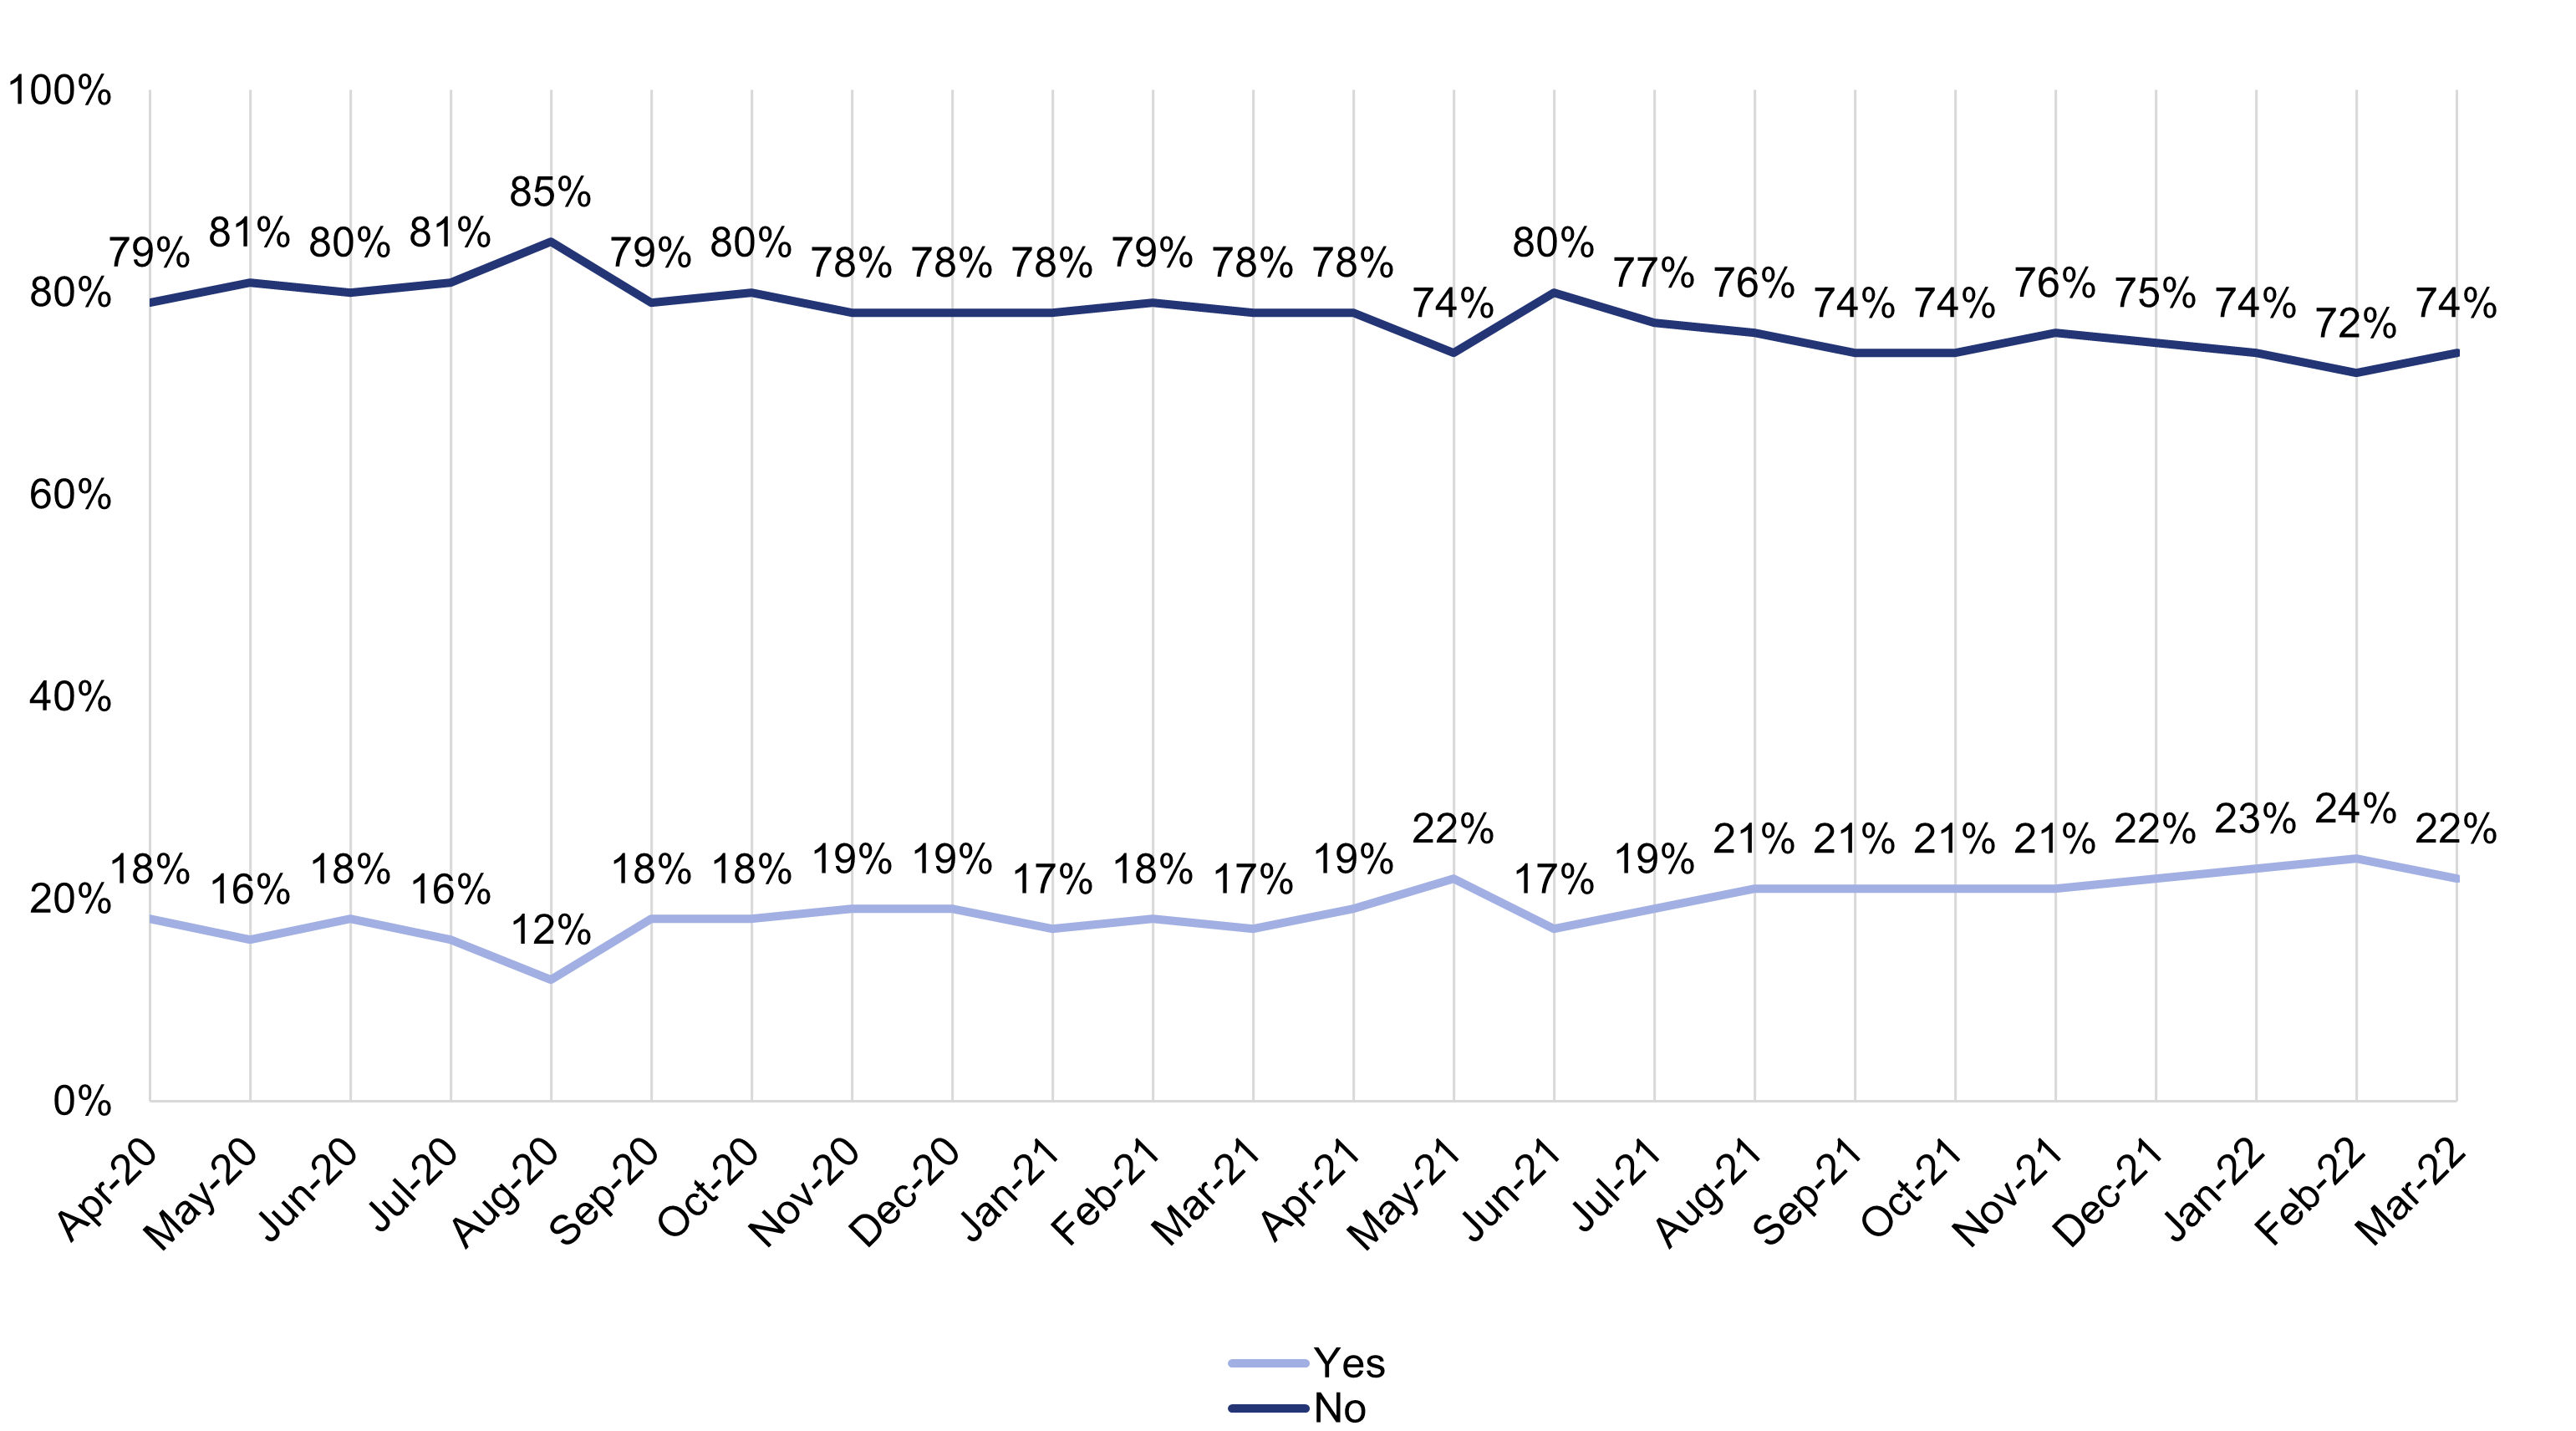
Base: COVID-19 Consumer tracker April 2020-October 2021, Consumer insights tracking survey November 2021 - March 2022. Base size: approximately 2,000 per wave. Online, England, Wales and NI, adults 16-75. Values may not add to 100% as ‘don’t know’ and ‘prefer not to answer’ responses are not shown.
March 2022: Around 1 in 7 people used a food bank or charity
In the last month, how often, if at all, have you used a food charity or food bank?
Base: COVID-19 Consumer tracker April 2020-October 2021, Consumer insights tracking survey November 2021 - March 2022. Base size: approximately 2,000 per wave. Online, England, Wales and NI, adults 16-75. Values may not add to 100% as ‘don’t know’ and ‘prefer not to answer’ responses are not shown.
Food security: demographic groups
Respondents are classified as being food secure (high, marginal) or food insecure (low, very low).
High 72%
Older adults, high income households, retired, working in managerial, administrative and professional occupations, white, smaller household size, no children in household
Marginal 13%
Younger adults, low income households, full-time students, semi-routine and routine occupations*, Asian/British Asian, larger households, children in the household*
Low 9%
Younger adults, low household income, long term unemployed or never worked, semi-routine and routine occupations
Very low 6%
Younger adults, low household income, long term unemployed or never worked, long term health condition* .
Food security: food-related behaviours
High 72%
- Shopping: Most likely to consider quality (46%); unlikely to have bought processed food everyday or most days (4%)
- Top food-related concern: The amount of sugar in food (68%)
- Eating habits: Most cook from scratch (66%) and eat healthy meals (71%) everyday or most days
- Safety: Most likely to know the correct fridge temperature (63%)
Marginal 13%
- Shopping: Most likely to consider price/value for money (60%); 24% had bought food close to the UBD in the previous year, changed where (34%) and what (29%) food is bought for cheaper alternatives
- Top food-related concern: Food waste (61%)
- Eating habits: Most cook from scratch (63%) and eat healthy meals (59%) everyday or most days; 47% had made changes to eating habits for financial reasons in the previous year
- Safety: 21% had eaten more food past the UBD than in the previous year
Low 9%
- Shopping: Most likely to consider price/value for money (62%); in the previous year 25% had bought more food close to the UBD, and changed where (42%) and what (40%) food is bought for cheaper alternatives
- Top food-related concern: Food prices (62%)
- Eating habits: Many cook from scratch (52%) and eat healthy meals (54%) everyday or most days; in the previous year, 67% had made changes to eating habits for financial reasons; 25% have cut the size of meals or skip meals because there wasn't enough money for food
- Safety: 22% had eaten more food past the UBD than in the previous year
Very low 6%
- Shopping: Most likely to consider price/value for money (68%); in the previous year 25% had bought more food close to the UBD, changed where (66%) and what (65%) food is bought for cheaper alternatives, and 13% had used a food bank/emergency food; 24% had bought processed food everyday or most days
- Top food-related concern: Food prices (60%)
- Eating habits: Many cook from scratch (50%), eat healthy meals (49%) and snack on cakes, biscuits, confectionery and/or savoury snacks (59%) everyday or most days; in the previous year 91% had made changes to eating habits for financial reasons; 98% have cut the size of meals or skip meals, 43% lost weight, and 38% didn’t eat for a whole day because there wasn't enough money for food
- Safety: 37% had eaten more food past the UBD than in the previous year
Source: Food and You 2: Wave 3
The lived experience: a case study

Brianna Beans
- Age: 72
- Gender, ethnicity: Female, Mixed race, Jamaican heritage
- Household: Living alone
- Income and Education: Retired, DE
- Health: Has amyloidosis, an incurable condition requiring monthly treatments to slow progression
- Location: Bristol & Avon
Food system feelings
"As I've gotten older, I really have noticed how horrible cheaper food is. I wish that they would sell food that is accessible to everybody so that poor people could eat things like salmon for example, because they happen to like it or because it's good for you or whatever.
There’s no doubt about it, in the long run, you eat cheap stuff, you get ill. The NHS is suffering blah, blah, blah. Because you’re ill because you can't eat properly!"
'It's unfair that poor people have to make do with poor quality food.'
"If you’ve got to pay for a nice tin of Heinz baked beans, it's gonna maybe cost you one-pound something. But if you’re like my son and his partner, you can only afford the nasty 20p-a-tin one, which is not good for you, not good for the kids. It's full of sugar, it's horrible."
'I dream about being able to afford the good quality, fresh food that I need to feel well.'
"If I had more money, I could afford to go to a proper greengrocer, Eastern European Or something. Which I did once and it was absolutely amazing. Lots of lovely fruits, I didn't even know what they were. But I came out of there and I've spent 20 quid! I eat a lot of grapes because I can taste them and they cleanse my mouth and they help with the ulcers. If only I could afford the best grapes!. You buy a cheap bag of potatoes and half of them have got nasty potato things on them. They've got to be cut out, which makes the potato smaller, which makes me use potatoes ad infinitum."
'I worry about my grandkids and I help my children financially, but that sets me back too.'
"Your kids go to school and are dozy [from being hungry]... I mean, we don't have that in our family, because I make sure that doesn't happen, but that has an impact on me because then I have got cheap food, which I really hate. Without being disrespectful to my kids, if I didn't have the grandchildren or them to worry about, I'd be rich. I could afford to have the best apples instead of the cheap ones that dry up and go mouldy in two days, but it's not a big deal. It's not a sacrifice. It’s my family, you know. If I didn't have my kids, then I would be able to put £30, £40 worth of fuel in my car. Whereas at the moment I’d put in, you know, £10 at a time and that’s got to last me a week."
'I take risks with unsafe food because it is more affordable and my concerns are dismissed because of my skin colour.'
"I’ve been in the supermarkets before, when I went up and said, 'You got some beef in there and it's bleeding you need to take it out.' They must think 'bloody black people'... you know, straightaway, they see the colour of your skin, and it's like, 'oh my God, here we go' I can’t imagine going to some of these upmarket supermarkets and seeing that - you simply wouldn't see it. I'm quite prepared to open up the freezer and take out that other piece of beef, not knowing if any of the blood from other meats leaked into that. I’m quite happy with that because it's only X amount of pounds to buy."
'I don't trust the FSA to protect our interests, because they don't understand how food inequality affects us.'
"I have lactose-free milk and it's expensive but I have to have it because otherwise, I get problems. The lactose-free milk is like £1.45 a pint... And I think well, I've got one that'll last me till Monday. It would be brilliant if the food standards people would employ people to go into ordinary houses and actually see how I'm living and ask me to open up my cupboards and see that most of the stuff is tinned."
Food priorities
- Food justice
- Food Of adequate quality is not affordable for people on low incomes, especially when managing a chronic illness.
Food banks are under increasing pressure
Across the UK, there was a 177% increase in demand for food banks between March 2019 and March 2020, driven by reduction in income, increased basic costs (such as utility bills or caring for parents or children and reduced access to affordable food), exacerbating existing insecurity and vulnerabilities.
Food banks are predicting a further increase in demand: Universal Credit cuts and rising energy prices have disproportional impact on those already experiencing financial difficulties. This is despite some people being unable to access sufficient help to meet their needs, or being unaware support may be available, or unwilling to access help due to perceived stigma.
Most common challenges for food banks are: being unable to provide fresh foods and meet dietary needs for example, allergy sufferers; relying on an insufficient, voluntary workforce and continually increasing demand for food provision.
Food banks, particularly newer, less formal models, are highly localised and the level of services they can provide depends on others for example, local food poverty alliances, informal neighbourhood groups and local businesses.
Some people may be more vulnerable to food insecurity in the future
Food Hypersensitivity for example: Greater costs and reduced availability of ‘free-from’ foods compared to standard food items, makes this group more vulnerable to further changes in the affordability and accessibility of food.
Northern Ireland for example: Despite facing the highest (joint first with London) grocery prices in the UK, NI households experience some of the lowest disposable incomes in the UK. This makes NI households particularly vulnerable to changes in the affordability of food.
North West and North East of England for example: Lower incomes, greater than average unemployment, and greater than average rises in energy costs makes these regions vulnerable to future changes in the affordability of food.
Households with children for example: additional living costs associated with children such as larger housing and additional food costs make this group more vulnerable to future changes in the affordability of food.
People with disabilities for example: Above average difficulty accessing food shops and preparing and cooking food where fine motor skills are required.
Low-income households for example: Correlation between low-income areas and food deserts mean that access to food is lower for low-income households. Having less disposable income to spend on food makes these households more exposed to changes in the affordability of food.
Hanes diwygio
Published: 2 Mehefin 2022
Diweddarwyd ddiwethaf: 12 Medi 2023
Hanes diwygio
Published: 2 Mehefin 2022
Diweddarwyd ddiwethaf: 12 Medi 2023